Project
GNF SymAtlas + NCI-60 cancer cell lines, comparison of cancers vs non-cancers, human (Su, 2004; Ross, 2000)
Navigation
Downloads
Results for HMGA1
Z-value: 0.16
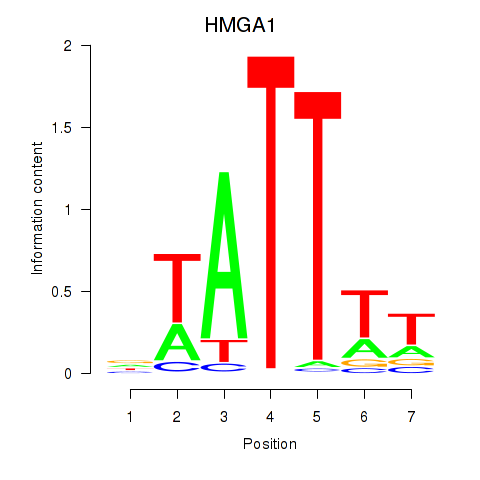
Motif logo
Transcription factors associated with HMGA1
| Gene Symbol | Gene ID | Gene Info |
|---|---|---|
|
HMGA1
|
ENSG00000137309.15 | high mobility group AT-hook 1 |
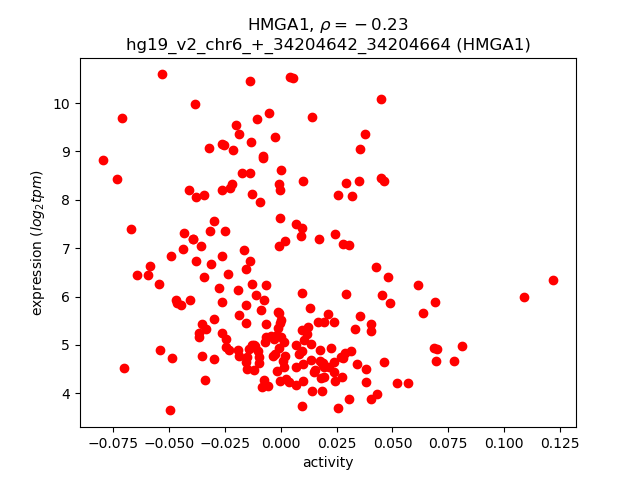
Activity-expression correlation:
| Gene | Promoter | Pearson corr. coef. | P-value | Plot |
|---|---|---|---|---|
| HMGA1 | hg19_v2_chr6_+_34204642_34204664 | -0.23 | 5.5e-04 | Click! |
Activity profile of HMGA1 motif
Sorted Z-values of HMGA1 motif
| Promoter | Log-likelihood | Transcript | Gene | Gene Info |
|---|---|---|---|---|
| chr12_-_91539918 | 12.44 |
ENST00000548218.1
|
DCN
|
decorin |
| chr4_+_155484155 | 11.57 |
ENST00000509493.1
|
FGB
|
fibrinogen beta chain |
| chr1_+_196621002 | 11.32 |
ENST00000367429.4
ENST00000439155.2 |
CFH
|
complement factor H |
| chr3_-_195310802 | 10.20 |
ENST00000421243.1
ENST00000453131.1 |
APOD
|
apolipoprotein D |
| chr12_-_91546926 | 9.75 |
ENST00000550758.1
|
DCN
|
decorin |
| chr2_+_189839046 | 8.60 |
ENST00000304636.3
ENST00000317840.5 |
COL3A1
|
collagen, type III, alpha 1 |
| chr4_-_143226979 | 8.57 |
ENST00000514525.1
|
INPP4B
|
inositol polyphosphate-4-phosphatase, type II, 105kDa |
| chr12_-_91573249 | 7.83 |
ENST00000550099.1
ENST00000546391.1 ENST00000551354.1 |
DCN
|
decorin |
| chr1_+_196621156 | 7.64 |
ENST00000359637.2
|
CFH
|
complement factor H |
| chr12_-_71551652 | 7.51 |
ENST00000546561.1
|
TSPAN8
|
tetraspanin 8 |
| chr14_-_61748550 | 7.40 |
ENST00000555868.1
|
TMEM30B
|
transmembrane protein 30B |
| chr12_-_91574142 | 7.10 |
ENST00000547937.1
|
DCN
|
decorin |
| chrX_-_13835461 | 7.08 |
ENST00000316715.4
ENST00000356942.5 |
GPM6B
|
glycoprotein M6B |
| chr6_+_153552455 | 7.00 |
ENST00000392385.2
|
AL590867.1
|
Uncharacterized protein; cDNA FLJ59044, highly similar to LINE-1 reverse transcriptase homolog |
| chr4_+_74301880 | 6.80 |
ENST00000395792.2
ENST00000226359.2 |
AFP
|
alpha-fetoprotein |
| chr4_+_74269956 | 6.70 |
ENST00000295897.4
ENST00000415165.2 ENST00000503124.1 ENST00000509063.1 ENST00000401494.3 |
ALB
|
albumin |
| chr5_-_147211226 | 6.65 |
ENST00000296695.5
|
SPINK1
|
serine peptidase inhibitor, Kazal type 1 |
| chr4_+_55095264 | 6.32 |
ENST00000257290.5
|
PDGFRA
|
platelet-derived growth factor receptor, alpha polypeptide |
| chr12_+_12938541 | 6.07 |
ENST00000356591.4
|
APOLD1
|
apolipoprotein L domain containing 1 |
| chr4_+_88896819 | 5.84 |
ENST00000237623.7
ENST00000395080.3 ENST00000508233.1 ENST00000360804.4 |
SPP1
|
secreted phosphoprotein 1 |
| chr12_-_91505608 | 5.79 |
ENST00000266718.4
|
LUM
|
lumican |
| chrX_-_73072534 | 5.77 |
ENST00000429829.1
|
XIST
|
X inactive specific transcript (non-protein coding) |
| chr4_-_88450244 | 5.73 |
ENST00000503414.1
|
SPARCL1
|
SPARC-like 1 (hevin) |
| chr2_+_1418154 | 5.68 |
ENST00000423320.1
ENST00000382198.1 |
TPO
|
thyroid peroxidase |
| chr2_-_86333244 | 5.66 |
ENST00000263857.6
ENST00000409681.1 |
POLR1A
|
polymerase (RNA) I polypeptide A, 194kDa |
| chr1_-_57045228 | 5.65 |
ENST00000371250.3
|
PPAP2B
|
phosphatidic acid phosphatase type 2B |
| chr4_-_155533787 | 5.47 |
ENST00000407946.1
ENST00000405164.1 ENST00000336098.3 ENST00000393846.2 ENST00000404648.3 ENST00000443553.1 |
FGG
|
fibrinogen gamma chain |
| chr4_+_74275057 | 5.39 |
ENST00000511370.1
|
ALB
|
albumin |
| chrX_+_103031421 | 5.39 |
ENST00000433491.1
ENST00000418604.1 ENST00000443502.1 |
PLP1
|
proteolipid protein 1 |
| chr5_-_147211190 | 5.22 |
ENST00000510027.2
|
SPINK1
|
serine peptidase inhibitor, Kazal type 1 |
| chr11_+_93479588 | 5.16 |
ENST00000526335.1
|
C11orf54
|
chromosome 11 open reading frame 54 |
| chr4_+_155484103 | 5.03 |
ENST00000302068.4
|
FGB
|
fibrinogen beta chain |
| chr8_-_82395461 | 5.02 |
ENST00000256104.4
|
FABP4
|
fatty acid binding protein 4, adipocyte |
| chr3_+_148508845 | 4.82 |
ENST00000491148.1
|
CPB1
|
carboxypeptidase B1 (tissue) |
| chr7_-_16844611 | 4.76 |
ENST00000401412.1
ENST00000419304.2 |
AGR2
|
anterior gradient 2 |
| chr10_-_5046042 | 4.57 |
ENST00000421196.3
ENST00000455190.1 |
AKR1C2
|
aldo-keto reductase family 1, member C2 |
| chr4_-_134070250 | 4.51 |
ENST00000505289.1
ENST00000509715.1 |
RP11-9G1.3
|
RP11-9G1.3 |
| chr7_+_134430212 | 4.35 |
ENST00000436461.2
|
CALD1
|
caldesmon 1 |
| chr2_-_152589670 | 4.24 |
ENST00000604864.1
ENST00000603639.1 |
NEB
|
nebulin |
| chr11_-_111781554 | 4.23 |
ENST00000526167.1
ENST00000528961.1 |
CRYAB
|
crystallin, alpha B |
| chr7_+_94023873 | 4.22 |
ENST00000297268.6
|
COL1A2
|
collagen, type I, alpha 2 |
| chr1_+_89829610 | 4.05 |
ENST00000370456.4
ENST00000535065.1 |
GBP6
|
guanylate binding protein family, member 6 |
| chr15_-_99789736 | 4.02 |
ENST00000560235.1
ENST00000394132.2 ENST00000560860.1 ENST00000558078.1 ENST00000394136.1 ENST00000262074.4 ENST00000558613.1 ENST00000394130.1 ENST00000560772.1 |
TTC23
|
tetratricopeptide repeat domain 23 |
| chr2_-_238323007 | 3.98 |
ENST00000295550.4
|
COL6A3
|
collagen, type VI, alpha 3 |
| chr7_+_75932863 | 3.88 |
ENST00000429938.1
|
HSPB1
|
heat shock 27kDa protein 1 |
| chr19_-_10333842 | 3.84 |
ENST00000317726.4
|
CTD-2369P2.2
|
CTD-2369P2.2 |
| chr17_-_66951474 | 3.79 |
ENST00000269080.2
|
ABCA8
|
ATP-binding cassette, sub-family A (ABC1), member 8 |
| chr1_+_104159999 | 3.77 |
ENST00000414303.2
ENST00000423678.1 |
AMY2A
|
amylase, alpha 2A (pancreatic) |
| chr13_-_45010939 | 3.76 |
ENST00000261489.2
|
TSC22D1
|
TSC22 domain family, member 1 |
| chr17_-_64216748 | 3.75 |
ENST00000585162.1
|
APOH
|
apolipoprotein H (beta-2-glycoprotein I) |
| chr9_-_21202204 | 3.47 |
ENST00000239347.3
|
IFNA7
|
interferon, alpha 7 |
| chr4_-_186696425 | 3.43 |
ENST00000430503.1
ENST00000319454.6 ENST00000450341.1 |
SORBS2
|
sorbin and SH3 domain containing 2 |
| chrX_-_13835147 | 3.41 |
ENST00000493677.1
ENST00000355135.2 |
GPM6B
|
glycoprotein M6B |
| chr3_+_109128961 | 3.39 |
ENST00000489670.1
|
RP11-702L6.4
|
RP11-702L6.4 |
| chr8_+_22224811 | 3.39 |
ENST00000381237.1
|
SLC39A14
|
solute carrier family 39 (zinc transporter), member 14 |
| chr3_-_167191814 | 3.38 |
ENST00000466903.1
ENST00000264677.4 |
SERPINI2
|
serpin peptidase inhibitor, clade I (pancpin), member 2 |
| chr1_-_237167718 | 3.34 |
ENST00000464121.2
|
MT1HL1
|
metallothionein 1H-like 1 |
| chr4_-_186877806 | 3.27 |
ENST00000355634.5
|
SORBS2
|
sorbin and SH3 domain containing 2 |
| chr17_-_64225508 | 3.24 |
ENST00000205948.6
|
APOH
|
apolipoprotein H (beta-2-glycoprotein I) |
| chr7_+_20686946 | 3.24 |
ENST00000443026.2
ENST00000406935.1 |
ABCB5
|
ATP-binding cassette, sub-family B (MDR/TAP), member 5 |
| chr5_+_140739537 | 3.23 |
ENST00000522605.1
|
PCDHGB2
|
protocadherin gamma subfamily B, 2 |
| chr21_-_43735628 | 3.21 |
ENST00000291525.10
ENST00000518498.1 |
TFF3
|
trefoil factor 3 (intestinal) |
| chr17_-_10452929 | 3.14 |
ENST00000532183.2
ENST00000397183.2 ENST00000420805.1 |
MYH2
|
myosin, heavy chain 2, skeletal muscle, adult |
| chr11_-_13517565 | 3.10 |
ENST00000282091.1
ENST00000529816.1 |
PTH
|
parathyroid hormone |
| chr12_+_101988627 | 2.99 |
ENST00000547405.1
ENST00000452455.2 ENST00000441232.1 ENST00000360610.2 ENST00000392934.3 ENST00000547509.1 ENST00000361685.2 ENST00000549145.1 ENST00000553190.1 |
MYBPC1
|
myosin binding protein C, slow type |
| chr5_+_137203465 | 2.97 |
ENST00000239926.4
|
MYOT
|
myotilin |
| chr6_-_52859046 | 2.94 |
ENST00000457564.1
ENST00000541324.1 ENST00000370960.1 |
GSTA4
|
glutathione S-transferase alpha 4 |
| chr6_-_52705641 | 2.93 |
ENST00000370989.2
|
GSTA5
|
glutathione S-transferase alpha 5 |
| chr2_+_79252834 | 2.90 |
ENST00000409471.1
|
REG3G
|
regenerating islet-derived 3 gamma |
| chr17_+_41857793 | 2.87 |
ENST00000449302.3
|
C17orf105
|
chromosome 17 open reading frame 105 |
| chr4_-_186697044 | 2.84 |
ENST00000437304.2
|
SORBS2
|
sorbin and SH3 domain containing 2 |
| chr9_-_95298314 | 2.82 |
ENST00000344604.5
ENST00000375540.1 |
ECM2
|
extracellular matrix protein 2, female organ and adipocyte specific |
| chr8_-_17555164 | 2.81 |
ENST00000297488.6
|
MTUS1
|
microtubule associated tumor suppressor 1 |
| chr11_-_2906979 | 2.80 |
ENST00000380725.1
ENST00000313407.6 ENST00000430149.2 ENST00000440480.2 ENST00000414822.3 |
CDKN1C
|
cyclin-dependent kinase inhibitor 1C (p57, Kip2) |
| chr13_-_38172863 | 2.77 |
ENST00000541481.1
ENST00000379743.4 ENST00000379742.4 ENST00000379749.4 ENST00000541179.1 ENST00000379747.4 |
POSTN
|
periostin, osteoblast specific factor |
| chr2_+_196313239 | 2.74 |
ENST00000413290.1
|
AC064834.1
|
AC064834.1 |
| chr4_+_71248795 | 2.74 |
ENST00000304915.3
|
SMR3B
|
submaxillary gland androgen regulated protein 3B |
| chr9_+_71944241 | 2.72 |
ENST00000257515.8
|
FAM189A2
|
family with sequence similarity 189, member A2 |
| chr7_+_134551583 | 2.69 |
ENST00000435928.1
|
CALD1
|
caldesmon 1 |
| chr9_+_706842 | 2.59 |
ENST00000382293.3
|
KANK1
|
KN motif and ankyrin repeat domains 1 |
| chr3_+_109128837 | 2.52 |
ENST00000497996.1
|
RP11-702L6.4
|
RP11-702L6.4 |
| chr19_+_41509851 | 2.51 |
ENST00000593831.1
ENST00000330446.5 |
CYP2B6
|
cytochrome P450, family 2, subfamily B, polypeptide 6 |
| chr11_-_2162468 | 2.50 |
ENST00000434045.2
|
IGF2
|
insulin-like growth factor 2 (somatomedin A) |
| chr9_-_98079965 | 2.50 |
ENST00000289081.3
|
FANCC
|
Fanconi anemia, complementation group C |
| chr12_+_54422142 | 2.49 |
ENST00000243108.4
|
HOXC6
|
homeobox C6 |
| chr18_-_64271363 | 2.44 |
ENST00000262150.2
|
CDH19
|
cadherin 19, type 2 |
| chr15_+_80733570 | 2.41 |
ENST00000533983.1
ENST00000527771.1 ENST00000525103.1 |
ARNT2
|
aryl-hydrocarbon receptor nuclear translocator 2 |
| chr14_-_90798418 | 2.40 |
ENST00000354366.3
|
NRDE2
|
NRDE-2, necessary for RNA interference, domain containing |
| chr5_-_160279207 | 2.39 |
ENST00000327245.5
|
ATP10B
|
ATPase, class V, type 10B |
| chr10_-_21661870 | 2.37 |
ENST00000433460.1
|
RP11-275N1.1
|
RP11-275N1.1 |
| chr14_-_82000140 | 2.34 |
ENST00000555824.1
ENST00000557372.1 ENST00000336735.4 |
SEL1L
|
sel-1 suppressor of lin-12-like (C. elegans) |
| chr4_-_100242549 | 2.34 |
ENST00000305046.8
ENST00000394887.3 |
ADH1B
|
alcohol dehydrogenase 1B (class I), beta polypeptide |
| chr3_-_149095652 | 2.33 |
ENST00000305366.3
|
TM4SF1
|
transmembrane 4 L six family member 1 |
| chr12_-_102591604 | 2.32 |
ENST00000329406.4
|
PMCH
|
pro-melanin-concentrating hormone |
| chr9_-_123812542 | 2.31 |
ENST00000223642.1
|
C5
|
complement component 5 |
| chr7_-_99277610 | 2.30 |
ENST00000343703.5
ENST00000222982.4 ENST00000439761.1 ENST00000339843.2 |
CYP3A5
|
cytochrome P450, family 3, subfamily A, polypeptide 5 |
| chr17_-_47755338 | 2.30 |
ENST00000508805.1
ENST00000515508.2 ENST00000451526.2 ENST00000507970.1 |
SPOP
|
speckle-type POZ protein |
| chr2_+_79252822 | 2.30 |
ENST00000272324.5
|
REG3G
|
regenerating islet-derived 3 gamma |
| chr10_+_114710516 | 2.29 |
ENST00000542695.1
ENST00000346198.4 |
TCF7L2
|
transcription factor 7-like 2 (T-cell specific, HMG-box) |
| chr10_-_69597810 | 2.27 |
ENST00000483798.2
|
DNAJC12
|
DnaJ (Hsp40) homolog, subfamily C, member 12 |
| chr12_+_14572070 | 2.24 |
ENST00000545769.1
ENST00000428217.2 ENST00000396279.2 ENST00000542514.1 ENST00000536279.1 |
ATF7IP
|
activating transcription factor 7 interacting protein |
| chr10_+_92980517 | 2.22 |
ENST00000336126.5
|
PCGF5
|
polycomb group ring finger 5 |
| chr3_+_149191723 | 2.22 |
ENST00000305354.4
|
TM4SF4
|
transmembrane 4 L six family member 4 |
| chr5_-_41261540 | 2.19 |
ENST00000263413.3
|
C6
|
complement component 6 |
| chr5_+_137203557 | 2.17 |
ENST00000515645.1
|
MYOT
|
myotilin |
| chr2_-_211168332 | 2.16 |
ENST00000341685.4
|
MYL1
|
myosin, light chain 1, alkali; skeletal, fast |
| chr9_-_21187598 | 2.15 |
ENST00000421715.1
|
IFNA4
|
interferon, alpha 4 |
| chr5_+_118812237 | 2.14 |
ENST00000513628.1
|
HSD17B4
|
hydroxysteroid (17-beta) dehydrogenase 4 |
| chr1_+_215740709 | 2.13 |
ENST00000259154.4
|
KCTD3
|
potassium channel tetramerization domain containing 3 |
| chr5_+_140762268 | 2.13 |
ENST00000518325.1
|
PCDHGA7
|
protocadherin gamma subfamily A, 7 |
| chr12_-_111358372 | 2.11 |
ENST00000548438.1
ENST00000228841.8 |
MYL2
|
myosin, light chain 2, regulatory, cardiac, slow |
| chr5_+_137203541 | 2.07 |
ENST00000421631.2
|
MYOT
|
myotilin |
| chr7_-_55930443 | 2.05 |
ENST00000388975.3
|
SEPT14
|
septin 14 |
| chr1_-_153013588 | 2.04 |
ENST00000360379.3
|
SPRR2D
|
small proline-rich protein 2D |
| chr14_-_21270995 | 2.04 |
ENST00000555698.1
ENST00000397970.4 ENST00000340900.3 |
RNASE1
|
ribonuclease, RNase A family, 1 (pancreatic) |
| chr7_-_152373216 | 2.00 |
ENST00000359321.1
|
XRCC2
|
X-ray repair complementing defective repair in Chinese hamster cells 2 |
| chr12_-_54582655 | 2.00 |
ENST00000504338.1
ENST00000514685.1 ENST00000504797.1 ENST00000513838.1 ENST00000505128.1 ENST00000337581.3 ENST00000503306.1 ENST00000243112.5 ENST00000514196.1 ENST00000506169.1 ENST00000507904.1 ENST00000508394.2 |
SMUG1
|
single-strand-selective monofunctional uracil-DNA glycosylase 1 |
| chr17_+_68071458 | 1.99 |
ENST00000589377.1
|
KCNJ16
|
potassium inwardly-rectifying channel, subfamily J, member 16 |
| chr2_+_17721920 | 1.96 |
ENST00000295156.4
|
VSNL1
|
visinin-like 1 |
| chr3_+_69915385 | 1.95 |
ENST00000314589.5
|
MITF
|
microphthalmia-associated transcription factor |
| chr2_-_217560248 | 1.94 |
ENST00000233813.4
|
IGFBP5
|
insulin-like growth factor binding protein 5 |
| chr14_-_70883708 | 1.93 |
ENST00000256366.4
|
SYNJ2BP
|
synaptojanin 2 binding protein |
| chr20_-_23731893 | 1.92 |
ENST00000398402.1
|
CST1
|
cystatin SN |
| chr6_-_46293378 | 1.90 |
ENST00000330430.6
|
RCAN2
|
regulator of calcineurin 2 |
| chr5_+_118812294 | 1.88 |
ENST00000509514.1
|
HSD17B4
|
hydroxysteroid (17-beta) dehydrogenase 4 |
| chr3_-_50340996 | 1.88 |
ENST00000266031.4
ENST00000395143.2 ENST00000457214.2 ENST00000447605.2 ENST00000418723.1 ENST00000395144.2 |
HYAL1
|
hyaluronoglucosaminidase 1 |
| chrX_+_65384052 | 1.87 |
ENST00000336279.5
ENST00000458621.1 |
HEPH
|
hephaestin |
| chr4_-_89744314 | 1.86 |
ENST00000508369.1
|
FAM13A
|
family with sequence similarity 13, member A |
| chr12_-_16759711 | 1.86 |
ENST00000447609.1
|
LMO3
|
LIM domain only 3 (rhombotin-like 2) |
| chr5_+_140753444 | 1.85 |
ENST00000517434.1
|
PCDHGA6
|
protocadherin gamma subfamily A, 6 |
| chr4_-_57547454 | 1.83 |
ENST00000556376.2
|
HOPX
|
HOP homeobox |
| chr16_-_71610985 | 1.82 |
ENST00000355962.4
|
TAT
|
tyrosine aminotransferase |
| chr17_-_6915646 | 1.80 |
ENST00000574377.1
ENST00000399541.2 ENST00000399540.2 ENST00000575727.1 ENST00000573939.1 |
AC027763.2
|
Uncharacterized protein |
| chr1_+_180601139 | 1.80 |
ENST00000367590.4
ENST00000367589.3 |
XPR1
|
xenotropic and polytropic retrovirus receptor 1 |
| chr6_+_126102292 | 1.79 |
ENST00000368357.3
|
NCOA7
|
nuclear receptor coactivator 7 |
| chr7_-_120498357 | 1.79 |
ENST00000415871.1
ENST00000222747.3 ENST00000430985.1 |
TSPAN12
|
tetraspanin 12 |
| chr6_-_151773232 | 1.78 |
ENST00000444024.1
ENST00000367303.4 |
RMND1
|
required for meiotic nuclear division 1 homolog (S. cerevisiae) |
| chr11_+_22696314 | 1.74 |
ENST00000532398.1
ENST00000433790.1 |
GAS2
|
growth arrest-specific 2 |
| chr12_+_32655048 | 1.72 |
ENST00000427716.2
ENST00000266482.3 |
FGD4
|
FYVE, RhoGEF and PH domain containing 4 |
| chr6_+_161123270 | 1.71 |
ENST00000366924.2
ENST00000308192.9 ENST00000418964.1 |
PLG
|
plasminogen |
| chr12_+_20963632 | 1.71 |
ENST00000540853.1
ENST00000261196.2 |
SLCO1B3
|
solute carrier organic anion transporter family, member 1B3 |
| chr12_-_102872317 | 1.69 |
ENST00000424202.2
|
IGF1
|
insulin-like growth factor 1 (somatomedin C) |
| chr2_+_145780767 | 1.69 |
ENST00000599358.1
ENST00000596278.1 ENST00000596747.1 ENST00000608652.1 ENST00000609705.1 ENST00000608432.1 ENST00000596970.1 ENST00000602041.1 ENST00000601578.1 ENST00000596034.1 ENST00000414195.2 ENST00000594837.1 |
TEX41
|
testis expressed 41 (non-protein coding) |
| chr12_+_20963647 | 1.65 |
ENST00000381545.3
|
SLCO1B3
|
solute carrier organic anion transporter family, member 1B3 |
| chr3_-_148939835 | 1.65 |
ENST00000264613.6
|
CP
|
ceruloplasmin (ferroxidase) |
| chr10_-_62149433 | 1.65 |
ENST00000280772.2
|
ANK3
|
ankyrin 3, node of Ranvier (ankyrin G) |
| chr2_-_206950781 | 1.61 |
ENST00000403263.1
|
INO80D
|
INO80 complex subunit D |
| chr11_+_1940925 | 1.61 |
ENST00000453458.1
ENST00000381557.2 ENST00000381589.3 ENST00000381579.3 ENST00000381563.4 ENST00000344578.4 |
TNNT3
|
troponin T type 3 (skeletal, fast) |
| chr5_-_125930929 | 1.61 |
ENST00000553117.1
ENST00000447989.2 ENST00000409134.3 |
ALDH7A1
|
aldehyde dehydrogenase 7 family, member A1 |
| chr13_-_41240717 | 1.60 |
ENST00000379561.5
|
FOXO1
|
forkhead box O1 |
| chr1_+_152881014 | 1.59 |
ENST00000368764.3
ENST00000392667.2 |
IVL
|
involucrin |
| chr2_-_69870747 | 1.59 |
ENST00000409068.1
|
AAK1
|
AP2 associated kinase 1 |
| chr15_+_49462397 | 1.59 |
ENST00000396509.2
|
GALK2
|
galactokinase 2 |
| chr5_-_107703556 | 1.59 |
ENST00000496714.1
|
FBXL17
|
F-box and leucine-rich repeat protein 17 |
| chr6_+_151646800 | 1.58 |
ENST00000354675.6
|
AKAP12
|
A kinase (PRKA) anchor protein 12 |
| chr2_-_188312971 | 1.58 |
ENST00000410068.1
ENST00000447403.1 ENST00000410102.1 |
CALCRL
|
calcitonin receptor-like |
| chr10_-_69597915 | 1.58 |
ENST00000225171.2
|
DNAJC12
|
DnaJ (Hsp40) homolog, subfamily C, member 12 |
| chr12_+_21207503 | 1.57 |
ENST00000545916.1
|
SLCO1B7
|
solute carrier organic anion transporter family, member 1B7 (non-functional) |
| chr4_-_47983519 | 1.56 |
ENST00000358519.4
ENST00000544810.1 ENST00000402813.3 |
CNGA1
|
cyclic nucleotide gated channel alpha 1 |
| chr3_+_111717600 | 1.55 |
ENST00000273368.4
|
TAGLN3
|
transgelin 3 |
| chr15_-_55657428 | 1.55 |
ENST00000568543.1
|
CCPG1
|
cell cycle progression 1 |
| chr12_+_8995832 | 1.54 |
ENST00000541459.1
|
A2ML1
|
alpha-2-macroglobulin-like 1 |
| chr9_-_21142144 | 1.50 |
ENST00000380229.2
|
IFNW1
|
interferon, omega 1 |
| chr12_+_101988774 | 1.50 |
ENST00000545503.2
ENST00000536007.1 ENST00000541119.1 ENST00000361466.2 ENST00000551300.1 ENST00000550270.1 |
MYBPC1
|
myosin binding protein C, slow type |
| chr4_-_100212132 | 1.48 |
ENST00000209668.2
|
ADH1A
|
alcohol dehydrogenase 1A (class I), alpha polypeptide |
| chr9_-_21995249 | 1.48 |
ENST00000494262.1
|
CDKN2A
|
cyclin-dependent kinase inhibitor 2A |
| chrX_+_138612889 | 1.47 |
ENST00000218099.2
ENST00000394090.2 |
F9
|
coagulation factor IX |
| chr20_-_14318248 | 1.46 |
ENST00000378053.3
ENST00000341420.4 |
FLRT3
|
fibronectin leucine rich transmembrane protein 3 |
| chr10_-_101825151 | 1.45 |
ENST00000441382.1
|
CPN1
|
carboxypeptidase N, polypeptide 1 |
| chr4_-_89744365 | 1.44 |
ENST00000513837.1
ENST00000503556.1 |
FAM13A
|
family with sequence similarity 13, member A |
| chr7_-_137028498 | 1.43 |
ENST00000393083.2
|
PTN
|
pleiotrophin |
| chr13_+_73629107 | 1.43 |
ENST00000539231.1
|
KLF5
|
Kruppel-like factor 5 (intestinal) |
| chr10_+_118305435 | 1.42 |
ENST00000369221.2
|
PNLIP
|
pancreatic lipase |
| chr15_+_49462434 | 1.41 |
ENST00000558145.1
ENST00000543495.1 ENST00000544523.1 ENST00000560138.1 |
GALK2
|
galactokinase 2 |
| chrX_-_102941596 | 1.41 |
ENST00000441076.2
ENST00000422355.1 ENST00000442614.1 ENST00000422154.2 ENST00000451301.1 |
MORF4L2
|
mortality factor 4 like 2 |
| chr3_-_124653579 | 1.41 |
ENST00000478191.1
ENST00000311075.3 |
MUC13
|
mucin 13, cell surface associated |
| chr17_+_3379284 | 1.41 |
ENST00000263080.2
|
ASPA
|
aspartoacylase |
| chr2_-_87248975 | 1.39 |
ENST00000409310.2
ENST00000355705.3 |
PLGLB1
|
plasminogen-like B1 |
| chr14_+_39736582 | 1.38 |
ENST00000556148.1
ENST00000348007.3 |
CTAGE5
|
CTAGE family, member 5 |
| chr3_+_69985792 | 1.37 |
ENST00000531774.1
|
MITF
|
microphthalmia-associated transcription factor |
| chr4_+_88754069 | 1.37 |
ENST00000395102.4
ENST00000497649.2 |
MEPE
|
matrix extracellular phosphoglycoprotein |
| chr3_-_46608010 | 1.37 |
ENST00000395905.3
|
LRRC2
|
leucine rich repeat containing 2 |
| chr13_+_113760098 | 1.37 |
ENST00000346342.3
ENST00000541084.1 ENST00000375581.3 |
F7
|
coagulation factor VII (serum prothrombin conversion accelerator) |
| chr7_-_99381798 | 1.36 |
ENST00000415003.1
ENST00000354593.2 |
CYP3A4
|
cytochrome P450, family 3, subfamily A, polypeptide 4 |
| chr7_+_134528635 | 1.36 |
ENST00000445569.2
|
CALD1
|
caldesmon 1 |
| chr5_+_66254698 | 1.35 |
ENST00000405643.1
ENST00000407621.1 ENST00000432426.1 |
MAST4
|
microtubule associated serine/threonine kinase family member 4 |
| chr2_-_224467093 | 1.33 |
ENST00000305409.2
|
SCG2
|
secretogranin II |
| chr2_+_210517895 | 1.32 |
ENST00000447185.1
|
MAP2
|
microtubule-associated protein 2 |
| chr7_-_99381884 | 1.32 |
ENST00000336411.2
|
CYP3A4
|
cytochrome P450, family 3, subfamily A, polypeptide 4 |
| chr2_+_172543919 | 1.32 |
ENST00000452242.1
ENST00000340296.4 |
DYNC1I2
|
dynein, cytoplasmic 1, intermediate chain 2 |
| chr12_+_19358228 | 1.31 |
ENST00000424268.1
ENST00000543806.1 |
PLEKHA5
|
pleckstrin homology domain containing, family A member 5 |
| chr13_+_49684445 | 1.30 |
ENST00000398316.3
|
FNDC3A
|
fibronectin type III domain containing 3A |
| chr6_+_26158343 | 1.27 |
ENST00000377777.4
ENST00000289316.2 |
HIST1H2BD
|
histone cluster 1, H2bd |
| chr6_+_134758827 | 1.27 |
ENST00000431422.1
|
LINC01010
|
long intergenic non-protein coding RNA 1010 |
| chr3_+_171561127 | 1.26 |
ENST00000334567.5
ENST00000450693.1 |
TMEM212
|
transmembrane protein 212 |
| chrX_+_65384182 | 1.26 |
ENST00000441993.2
ENST00000419594.1 |
HEPH
|
hephaestin |
| chr2_+_157330081 | 1.24 |
ENST00000409674.1
|
GPD2
|
glycerol-3-phosphate dehydrogenase 2 (mitochondrial) |
| chr4_-_89744457 | 1.24 |
ENST00000395002.2
|
FAM13A
|
family with sequence similarity 13, member A |
| chr5_+_92919043 | 1.22 |
ENST00000327111.3
|
NR2F1
|
nuclear receptor subfamily 2, group F, member 1 |
| chr8_-_110620284 | 1.21 |
ENST00000529690.1
|
SYBU
|
syntabulin (syntaxin-interacting) |
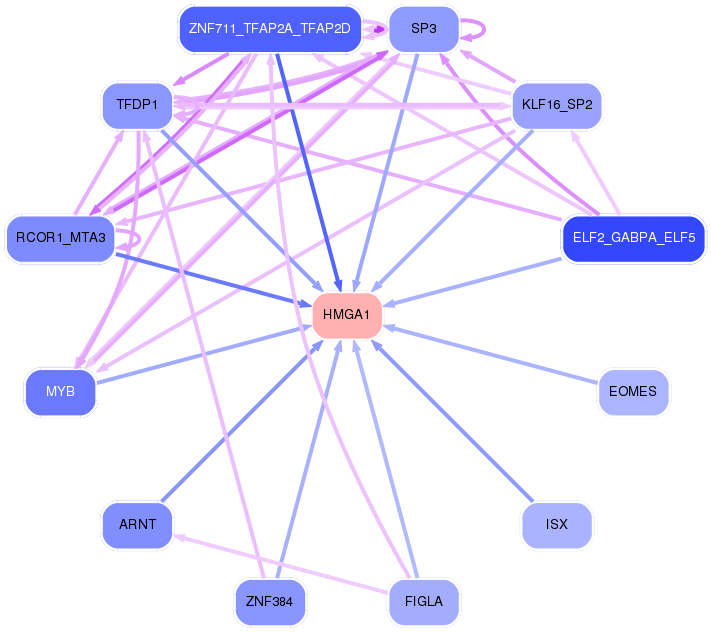
Network of associatons between targets according to the STRING database.

First level regulatory network of HMGA1
Gene Ontology Analysis
Gene overrepresentation in biological_process category:
| Log-likelihood per target | Total log-likelihood | Term | Description |
|---|---|---|---|
| 4.0 | 12.1 | GO:0044179 | hemolysis by symbiont of host erythrocytes(GO:0019836) hemolysis in other organism(GO:0044179) hemolysis in other organism involved in symbiotic interaction(GO:0052331) |
| 3.4 | 10.2 | GO:2000097 | regulation of smooth muscle cell-matrix adhesion(GO:2000097) |
| 3.1 | 37.1 | GO:1900747 | negative regulation of vascular endothelial growth factor signaling pathway(GO:1900747) |
| 2.1 | 6.3 | GO:0072276 | metanephric glomerulus morphogenesis(GO:0072275) metanephric glomerulus vasculature morphogenesis(GO:0072276) metanephric glomerular capillary formation(GO:0072277) |
| 2.0 | 11.9 | GO:0010751 | negative regulation of nitric oxide mediated signal transduction(GO:0010751) |
| 1.9 | 5.8 | GO:0035938 | estrogen secretion(GO:0035937) estradiol secretion(GO:0035938) regulation of estrogen secretion(GO:2000861) regulation of estradiol secretion(GO:2000864) |
| 1.7 | 5.2 | GO:0044278 | cell wall disruption in other organism(GO:0044278) |
| 1.7 | 16.6 | GO:0043152 | induction of bacterial agglutination(GO:0043152) |
| 1.4 | 5.7 | GO:1904749 | regulation of protein localization to nucleolus(GO:1904749) |
| 1.2 | 5.0 | GO:0009822 | alkaloid catabolic process(GO:0009822) |
| 1.1 | 2.2 | GO:0001970 | positive regulation of activation of membrane attack complex(GO:0001970) |
| 1.1 | 8.7 | GO:0051918 | negative regulation of fibrinolysis(GO:0051918) |
| 1.1 | 8.6 | GO:0060414 | aorta smooth muscle tissue morphogenesis(GO:0060414) |
| 1.1 | 4.2 | GO:0007525 | somatic muscle development(GO:0007525) |
| 1.0 | 3.1 | GO:0090290 | positive regulation of osteoclast proliferation(GO:0090290) negative regulation of bone mineralization involved in bone maturation(GO:1900158) |
| 1.0 | 9.7 | GO:0051581 | negative regulation of neurotransmitter uptake(GO:0051581) serotonin uptake(GO:0051610) regulation of serotonin uptake(GO:0051611) negative regulation of serotonin uptake(GO:0051612) |
| 1.0 | 3.9 | GO:0099640 | axo-dendritic protein transport(GO:0099640) |
| 0.9 | 22.7 | GO:0006957 | complement activation, alternative pathway(GO:0006957) |
| 0.9 | 2.8 | GO:1990523 | bone regeneration(GO:1990523) |
| 0.9 | 2.6 | GO:2000393 | negative regulation of lamellipodium morphogenesis(GO:2000393) |
| 0.8 | 5.9 | GO:0032914 | positive regulation of transforming growth factor beta1 production(GO:0032914) |
| 0.8 | 3.2 | GO:0048749 | compound eye development(GO:0048749) |
| 0.8 | 4.6 | GO:1903899 | positive regulation of PERK-mediated unfolded protein response(GO:1903899) |
| 0.7 | 4.3 | GO:0010908 | regulation of heparan sulfate proteoglycan biosynthetic process(GO:0010908) positive regulation of heparan sulfate proteoglycan biosynthetic process(GO:0010909) canonical Wnt signaling pathway involved in positive regulation of epithelial to mesenchymal transition(GO:0044334) positive regulation of proteoglycan biosynthetic process(GO:1902730) |
| 0.7 | 1.4 | GO:1904397 | negative regulation of neuromuscular junction development(GO:1904397) |
| 0.7 | 4.0 | GO:0036111 | very long-chain fatty-acyl-CoA metabolic process(GO:0036111) |
| 0.7 | 4.6 | GO:0071395 | response to jasmonic acid(GO:0009753) cellular response to jasmonic acid stimulus(GO:0071395) |
| 0.6 | 1.9 | GO:1904204 | regulation of skeletal muscle hypertrophy(GO:1904204) |
| 0.6 | 1.9 | GO:1900104 | hyaluranon cable assembly(GO:0036118) regulation of hyaluranon cable assembly(GO:1900104) positive regulation of hyaluranon cable assembly(GO:1900106) |
| 0.6 | 7.4 | GO:0070863 | positive regulation of protein exit from endoplasmic reticulum(GO:0070863) |
| 0.5 | 1.6 | GO:0018262 | isopeptide cross-linking via N6-(L-isoglutamyl)-L-lysine(GO:0018153) isopeptide cross-linking(GO:0018262) |
| 0.5 | 6.1 | GO:0042118 | endothelial cell activation(GO:0042118) |
| 0.5 | 1.4 | GO:0006533 | aspartate catabolic process(GO:0006533) |
| 0.5 | 3.3 | GO:0044245 | polysaccharide digestion(GO:0044245) |
| 0.5 | 6.8 | GO:0001542 | ovulation from ovarian follicle(GO:0001542) |
| 0.4 | 1.7 | GO:0032571 | response to vitamin K(GO:0032571) |
| 0.4 | 8.7 | GO:0033141 | positive regulation of peptidyl-serine phosphorylation of STAT protein(GO:0033141) |
| 0.4 | 1.6 | GO:1900827 | positive regulation of cell communication by electrical coupling(GO:0010650) maintenance of protein location in membrane(GO:0072658) maintenance of protein location in plasma membrane(GO:0072660) positive regulation of membrane depolarization during cardiac muscle cell action potential(GO:1900827) |
| 0.4 | 2.8 | GO:1902746 | regulation of lens fiber cell differentiation(GO:1902746) |
| 0.4 | 1.9 | GO:2001106 | regulation of Rho guanyl-nucleotide exchange factor activity(GO:2001106) |
| 0.4 | 13.1 | GO:0003298 | physiological muscle hypertrophy(GO:0003298) physiological cardiac muscle hypertrophy(GO:0003301) cell growth involved in cardiac muscle cell development(GO:0061049) |
| 0.4 | 2.3 | GO:2000676 | positive regulation of type B pancreatic cell apoptotic process(GO:2000676) |
| 0.4 | 3.8 | GO:0042908 | xenobiotic transport(GO:0042908) |
| 0.4 | 1.1 | GO:0003218 | cardiac left ventricle formation(GO:0003218) cell migration involved in vasculogenesis(GO:0035441) |
| 0.4 | 2.6 | GO:0006572 | tyrosine catabolic process(GO:0006572) |
| 0.3 | 3.4 | GO:0071578 | zinc II ion transmembrane import(GO:0071578) |
| 0.3 | 5.0 | GO:0071285 | cellular response to lithium ion(GO:0071285) |
| 0.3 | 2.0 | GO:0000707 | meiotic DNA recombinase assembly(GO:0000707) |
| 0.3 | 1.0 | GO:0006711 | estrogen catabolic process(GO:0006711) |
| 0.3 | 3.0 | GO:0042738 | exogenous drug catabolic process(GO:0042738) |
| 0.3 | 5.5 | GO:0031639 | plasminogen activation(GO:0031639) |
| 0.3 | 1.0 | GO:0035602 | fibroblast growth factor receptor signaling pathway involved in negative regulation of apoptotic process in bone marrow(GO:0035602) fibroblast growth factor receptor signaling pathway involved in hemopoiesis(GO:0035603) fibroblast growth factor receptor signaling pathway involved in positive regulation of cell proliferation in bone marrow(GO:0035604) fibroblast growth factor receptor signaling pathway involved in mammary gland specification(GO:0060595) mammary gland bud formation(GO:0060615) branch elongation involved in salivary gland morphogenesis(GO:0060667) mesenchymal cell differentiation involved in lung development(GO:0060915) |
| 0.3 | 1.6 | GO:1902617 | regulation of gluconeogenesis by regulation of transcription from RNA polymerase II promoter(GO:0035947) response to fluoride(GO:1902617) |
| 0.3 | 4.5 | GO:0071688 | striated muscle myosin thick filament assembly(GO:0071688) |
| 0.3 | 1.0 | GO:0003099 | regulation of systemic arterial blood pressure by carotid sinus baroreceptor feedback(GO:0001978) baroreceptor response to increased systemic arterial blood pressure(GO:0001983) positive regulation of the force of heart contraction by chemical signal(GO:0003099) |
| 0.3 | 1.0 | GO:0036079 | GDP-fucose transport(GO:0015783) purine nucleotide-sugar transport(GO:0036079) |
| 0.3 | 5.4 | GO:0042759 | long-chain fatty acid biosynthetic process(GO:0042759) |
| 0.3 | 4.4 | GO:0043589 | skin morphogenesis(GO:0043589) |
| 0.3 | 1.9 | GO:2000324 | positive regulation of glucocorticoid receptor signaling pathway(GO:2000324) |
| 0.3 | 1.5 | GO:0030070 | insulin processing(GO:0030070) |
| 0.3 | 0.9 | GO:0002933 | lipid hydroxylation(GO:0002933) |
| 0.3 | 2.0 | GO:0098735 | positive regulation of the force of heart contraction(GO:0098735) |
| 0.3 | 2.5 | GO:0038028 | insulin receptor signaling pathway via phosphatidylinositol 3-kinase(GO:0038028) positive regulation of glycogen (starch) synthase activity(GO:2000467) |
| 0.3 | 0.8 | GO:0051725 | protein de-ADP-ribosylation(GO:0051725) |
| 0.3 | 1.1 | GO:0006663 | platelet activating factor biosynthetic process(GO:0006663) |
| 0.3 | 1.8 | GO:0030643 | cellular phosphate ion homeostasis(GO:0030643) cellular trivalent inorganic anion homeostasis(GO:0072502) |
| 0.3 | 2.0 | GO:0019563 | glycerol catabolic process(GO:0019563) |
| 0.3 | 2.5 | GO:0006069 | ethanol oxidation(GO:0006069) |
| 0.2 | 3.2 | GO:1902083 | negative regulation of peptidyl-cysteine S-nitrosylation(GO:1902083) |
| 0.2 | 0.7 | GO:0070171 | negative regulation of tooth mineralization(GO:0070171) |
| 0.2 | 0.7 | GO:0010166 | wax biosynthetic process(GO:0010025) wax metabolic process(GO:0010166) |
| 0.2 | 1.9 | GO:0048312 | intracellular distribution of mitochondria(GO:0048312) |
| 0.2 | 4.2 | GO:0007021 | tubulin complex assembly(GO:0007021) |
| 0.2 | 1.2 | GO:0070131 | positive regulation of mitochondrial translation(GO:0070131) |
| 0.2 | 0.9 | GO:0019276 | UDP-N-acetylgalactosamine metabolic process(GO:0019276) |
| 0.2 | 1.6 | GO:0042426 | choline catabolic process(GO:0042426) |
| 0.2 | 5.7 | GO:0006590 | thyroid hormone generation(GO:0006590) |
| 0.2 | 0.7 | GO:1990414 | replication-born double-strand break repair via sister chromatid exchange(GO:1990414) |
| 0.2 | 0.7 | GO:0032252 | secretory granule localization(GO:0032252) |
| 0.2 | 1.5 | GO:0007598 | blood coagulation, extrinsic pathway(GO:0007598) |
| 0.2 | 1.7 | GO:0070973 | protein localization to endoplasmic reticulum exit site(GO:0070973) |
| 0.2 | 2.3 | GO:2000582 | positive regulation of microtubule motor activity(GO:2000576) regulation of ATP-dependent microtubule motor activity, plus-end-directed(GO:2000580) positive regulation of ATP-dependent microtubule motor activity, plus-end-directed(GO:2000582) |
| 0.2 | 1.0 | GO:2000301 | negative regulation of synaptic vesicle exocytosis(GO:2000301) |
| 0.2 | 1.8 | GO:0038007 | netrin-activated signaling pathway(GO:0038007) |
| 0.2 | 1.0 | GO:0007197 | adenylate cyclase-inhibiting G-protein coupled acetylcholine receptor signaling pathway(GO:0007197) |
| 0.2 | 0.4 | GO:0097156 | fasciculation of motor neuron axon(GO:0097156) |
| 0.2 | 0.8 | GO:0090234 | regulation of kinetochore assembly(GO:0090234) |
| 0.2 | 0.6 | GO:1904294 | positive regulation of ERAD pathway(GO:1904294) |
| 0.2 | 1.1 | GO:0061737 | leukotriene signaling pathway(GO:0061737) |
| 0.2 | 0.5 | GO:0051697 | protein delipidation(GO:0051697) |
| 0.2 | 1.6 | GO:0009744 | response to sucrose(GO:0009744) response to disaccharide(GO:0034285) |
| 0.2 | 0.7 | GO:0071231 | thymidylate synthase biosynthetic process(GO:0050757) regulation of thymidylate synthase biosynthetic process(GO:0050758) cellular response to folic acid(GO:0071231) |
| 0.2 | 0.2 | GO:0003404 | optic vesicle morphogenesis(GO:0003404) |
| 0.2 | 10.7 | GO:0036092 | phosphatidylinositol-3-phosphate biosynthetic process(GO:0036092) |
| 0.2 | 5.7 | GO:0015721 | bile acid and bile salt transport(GO:0015721) |
| 0.2 | 1.4 | GO:0032534 | regulation of microvillus assembly(GO:0032534) |
| 0.2 | 1.0 | GO:0015842 | aminergic neurotransmitter loading into synaptic vesicle(GO:0015842) |
| 0.2 | 0.5 | GO:0015888 | thiamine transport(GO:0015888) thiamine transmembrane transport(GO:0071934) |
| 0.2 | 2.0 | GO:0045008 | depyrimidination(GO:0045008) |
| 0.2 | 3.0 | GO:0006012 | galactose metabolic process(GO:0006012) |
| 0.1 | 0.6 | GO:0038155 | interleukin-23-mediated signaling pathway(GO:0038155) |
| 0.1 | 7.0 | GO:1900047 | negative regulation of blood coagulation(GO:0030195) negative regulation of hemostasis(GO:1900047) |
| 0.1 | 0.7 | GO:1903385 | regulation of homophilic cell adhesion(GO:1903385) |
| 0.1 | 3.7 | GO:0006825 | copper ion transport(GO:0006825) |
| 0.1 | 0.4 | GO:1901842 | negative regulation of high voltage-gated calcium channel activity(GO:1901842) |
| 0.1 | 0.3 | GO:0060018 | astrocyte fate commitment(GO:0060018) |
| 0.1 | 0.6 | GO:1900738 | psychomotor behavior(GO:0036343) positive regulation of phospholipase C-activating G-protein coupled receptor signaling pathway(GO:1900738) |
| 0.1 | 0.3 | GO:0070309 | lens fiber cell morphogenesis(GO:0070309) |
| 0.1 | 0.6 | GO:0046533 | negative regulation of photoreceptor cell differentiation(GO:0046533) |
| 0.1 | 0.9 | GO:0015705 | iodide transport(GO:0015705) |
| 0.1 | 0.4 | GO:0010966 | regulation of phosphate transport(GO:0010966) |
| 0.1 | 1.6 | GO:0010739 | positive regulation of protein kinase A signaling(GO:0010739) |
| 0.1 | 2.4 | GO:0070168 | negative regulation of bone mineralization(GO:0030502) negative regulation of biomineral tissue development(GO:0070168) |
| 0.1 | 0.5 | GO:0060125 | negative regulation of growth hormone secretion(GO:0060125) |
| 0.1 | 3.1 | GO:2000369 | regulation of clathrin-mediated endocytosis(GO:2000369) |
| 0.1 | 0.8 | GO:0002175 | protein localization to paranode region of axon(GO:0002175) |
| 0.1 | 0.9 | GO:0033084 | regulation of immature T cell proliferation in thymus(GO:0033084) negative regulation of immature T cell proliferation in thymus(GO:0033088) |
| 0.1 | 1.9 | GO:0097150 | neuronal stem cell population maintenance(GO:0097150) |
| 0.1 | 18.3 | GO:0007156 | homophilic cell adhesion via plasma membrane adhesion molecules(GO:0007156) |
| 0.1 | 0.4 | GO:0016139 | glycoside catabolic process(GO:0016139) |
| 0.1 | 0.6 | GO:1902731 | ovarian cumulus expansion(GO:0001550) fused antrum stage(GO:0048165) negative regulation of chondrocyte proliferation(GO:1902731) |
| 0.1 | 2.4 | GO:0016246 | RNA interference(GO:0016246) |
| 0.1 | 7.2 | GO:0030049 | muscle filament sliding(GO:0030049) actin-myosin filament sliding(GO:0033275) |
| 0.1 | 1.7 | GO:0010842 | retina layer formation(GO:0010842) |
| 0.1 | 0.8 | GO:0015693 | magnesium ion transport(GO:0015693) |
| 0.1 | 1.5 | GO:0034393 | positive regulation of smooth muscle cell apoptotic process(GO:0034393) |
| 0.1 | 1.3 | GO:0060973 | cell migration involved in heart development(GO:0060973) |
| 0.1 | 2.8 | GO:0001580 | detection of chemical stimulus involved in sensory perception of bitter taste(GO:0001580) |
| 0.1 | 1.4 | GO:0061365 | positive regulation of triglyceride lipase activity(GO:0061365) |
| 0.1 | 2.4 | GO:0034204 | lipid translocation(GO:0034204) phospholipid translocation(GO:0045332) |
| 0.1 | 1.3 | GO:0048245 | eosinophil chemotaxis(GO:0048245) |
| 0.1 | 0.7 | GO:0070475 | rRNA base methylation(GO:0070475) |
| 0.1 | 0.7 | GO:0001574 | ganglioside biosynthetic process(GO:0001574) |
| 0.1 | 2.9 | GO:1901685 | glutathione derivative metabolic process(GO:1901685) glutathione derivative biosynthetic process(GO:1901687) |
| 0.1 | 0.5 | GO:0044800 | fusion of virus membrane with host plasma membrane(GO:0019064) membrane fusion involved in viral entry into host cell(GO:0039663) multi-organism membrane fusion(GO:0044800) |
| 0.1 | 1.1 | GO:0071670 | smooth muscle cell chemotaxis(GO:0071670) |
| 0.1 | 2.9 | GO:0070884 | regulation of calcineurin-NFAT signaling cascade(GO:0070884) |
| 0.1 | 2.3 | GO:1904380 | endoplasmic reticulum mannose trimming(GO:1904380) |
| 0.1 | 1.3 | GO:0060009 | Sertoli cell development(GO:0060009) |
| 0.1 | 0.4 | GO:0010513 | regulation of phosphatidylinositol biosynthetic process(GO:0010511) positive regulation of phosphatidylinositol biosynthetic process(GO:0010513) |
| 0.1 | 0.7 | GO:0070166 | enamel mineralization(GO:0070166) regulation of tooth mineralization(GO:0070170) |
| 0.1 | 0.9 | GO:0009650 | UV protection(GO:0009650) |
| 0.1 | 0.2 | GO:0009107 | lipoate biosynthetic process(GO:0009107) |
| 0.1 | 1.8 | GO:0010107 | potassium ion import(GO:0010107) |
| 0.1 | 0.3 | GO:0044821 | meiotic telomere tethering at nuclear periphery(GO:0044821) meiotic attachment of telomere to nuclear envelope(GO:0070197) chromosome attachment to the nuclear envelope(GO:0097240) |
| 0.1 | 0.5 | GO:0060372 | regulation of atrial cardiac muscle cell membrane repolarization(GO:0060372) membrane depolarization during SA node cell action potential(GO:0086046) |
| 0.1 | 1.4 | GO:0030277 | maintenance of gastrointestinal epithelium(GO:0030277) |
| 0.1 | 0.6 | GO:0070777 | D-aspartate transport(GO:0070777) D-aspartate import(GO:0070779) |
| 0.1 | 3.7 | GO:0050911 | detection of chemical stimulus involved in sensory perception of smell(GO:0050911) |
| 0.1 | 0.9 | GO:1901387 | positive regulation of voltage-gated calcium channel activity(GO:1901387) |
| 0.1 | 5.0 | GO:0006749 | glutathione metabolic process(GO:0006749) |
| 0.1 | 0.4 | GO:0034378 | chylomicron assembly(GO:0034378) |
| 0.1 | 3.1 | GO:0030318 | melanocyte differentiation(GO:0030318) |
| 0.1 | 0.9 | GO:0035372 | protein localization to microtubule(GO:0035372) |
| 0.1 | 0.7 | GO:0060394 | negative regulation of pathway-restricted SMAD protein phosphorylation(GO:0060394) |
| 0.1 | 0.2 | GO:0060332 | positive regulation of response to interferon-gamma(GO:0060332) positive regulation of interferon-gamma-mediated signaling pathway(GO:0060335) |
| 0.1 | 2.6 | GO:0046676 | negative regulation of insulin secretion(GO:0046676) |
| 0.1 | 0.5 | GO:0035871 | protein K11-linked deubiquitination(GO:0035871) |
| 0.1 | 1.0 | GO:0034374 | low-density lipoprotein particle remodeling(GO:0034374) |
| 0.1 | 0.4 | GO:0003096 | renal sodium ion transport(GO:0003096) renal sodium ion absorption(GO:0070294) |
| 0.1 | 0.5 | GO:0018401 | peptidyl-proline hydroxylation to 4-hydroxy-L-proline(GO:0018401) |
| 0.1 | 0.5 | GO:0051552 | flavone metabolic process(GO:0051552) |
| 0.1 | 1.5 | GO:0006699 | bile acid biosynthetic process(GO:0006699) |
| 0.1 | 0.6 | GO:0030322 | stabilization of membrane potential(GO:0030322) |
| 0.1 | 0.3 | GO:0010735 | positive regulation of transcription via serum response element binding(GO:0010735) |
| 0.1 | 0.5 | GO:0043950 | positive regulation of cAMP-mediated signaling(GO:0043950) |
| 0.1 | 0.6 | GO:0006578 | amino-acid betaine biosynthetic process(GO:0006578) |
| 0.1 | 0.2 | GO:1902159 | regulation of cyclic nucleotide-gated ion channel activity(GO:1902159) positive regulation of cyclic nucleotide-gated ion channel activity(GO:1902161) |
| 0.1 | 0.5 | GO:0006030 | chitin metabolic process(GO:0006030) chitin catabolic process(GO:0006032) |
| 0.1 | 0.6 | GO:0019627 | urea cycle(GO:0000050) urea metabolic process(GO:0019627) |
| 0.0 | 1.8 | GO:0051131 | chaperone-mediated protein complex assembly(GO:0051131) |
| 0.0 | 0.4 | GO:0007258 | JUN phosphorylation(GO:0007258) |
| 0.0 | 0.2 | GO:0019805 | quinolinate biosynthetic process(GO:0019805) |
| 0.0 | 0.7 | GO:0070493 | thrombin receptor signaling pathway(GO:0070493) |
| 0.0 | 0.2 | GO:0045590 | negative regulation of regulatory T cell differentiation(GO:0045590) |
| 0.0 | 0.1 | GO:0006425 | glutaminyl-tRNA aminoacylation(GO:0006425) valyl-tRNA aminoacylation(GO:0006438) |
| 0.0 | 2.7 | GO:0001578 | microtubule bundle formation(GO:0001578) |
| 0.0 | 0.6 | GO:0019373 | epoxygenase P450 pathway(GO:0019373) |
| 0.0 | 0.9 | GO:0070262 | peptidyl-serine dephosphorylation(GO:0070262) |
| 0.0 | 0.3 | GO:0036438 | maintenance of lens transparency(GO:0036438) |
| 0.0 | 0.3 | GO:0071763 | nuclear membrane organization(GO:0071763) |
| 0.0 | 0.6 | GO:0090557 | establishment of endothelial intestinal barrier(GO:0090557) |
| 0.0 | 0.3 | GO:0021740 | trigeminal sensory nucleus development(GO:0021730) principal sensory nucleus of trigeminal nerve development(GO:0021740) negative regulation of epithelial cell proliferation involved in lung morphogenesis(GO:2000795) |
| 0.0 | 0.5 | GO:0061053 | somite development(GO:0061053) |
| 0.0 | 0.2 | GO:1902896 | terminal web assembly(GO:1902896) |
| 0.0 | 0.5 | GO:0007342 | fusion of sperm to egg plasma membrane(GO:0007342) |
| 0.0 | 0.9 | GO:0009299 | mRNA transcription(GO:0009299) |
| 0.0 | 0.9 | GO:0016338 | calcium-independent cell-cell adhesion via plasma membrane cell-adhesion molecules(GO:0016338) |
| 0.0 | 2.0 | GO:0090502 | RNA phosphodiester bond hydrolysis, endonucleolytic(GO:0090502) |
| 0.0 | 0.1 | GO:0045062 | extrathymic T cell selection(GO:0045062) |
| 0.0 | 1.2 | GO:0086010 | membrane depolarization during action potential(GO:0086010) |
| 0.0 | 0.6 | GO:0090110 | cargo loading into COPII-coated vesicle(GO:0090110) |
| 0.0 | 3.1 | GO:0007586 | digestion(GO:0007586) |
| 0.0 | 0.6 | GO:0007274 | neuromuscular synaptic transmission(GO:0007274) |
| 0.0 | 0.1 | GO:1904059 | regulation of locomotor rhythm(GO:1904059) |
| 0.0 | 2.0 | GO:0019933 | cAMP-mediated signaling(GO:0019933) |
| 0.0 | 0.7 | GO:0060397 | JAK-STAT cascade involved in growth hormone signaling pathway(GO:0060397) |
| 0.0 | 0.9 | GO:0022400 | regulation of rhodopsin mediated signaling pathway(GO:0022400) |
| 0.0 | 0.9 | GO:0000305 | response to oxygen radical(GO:0000305) |
| 0.0 | 1.4 | GO:0007218 | neuropeptide signaling pathway(GO:0007218) |
| 0.0 | 0.3 | GO:0016486 | peptide hormone processing(GO:0016486) |
| 0.0 | 0.5 | GO:1902895 | positive regulation of pri-miRNA transcription from RNA polymerase II promoter(GO:1902895) |
| 0.0 | 0.8 | GO:0010765 | positive regulation of sodium ion transport(GO:0010765) |
| 0.0 | 1.7 | GO:0046847 | filopodium assembly(GO:0046847) |
| 0.0 | 0.3 | GO:0010839 | negative regulation of keratinocyte proliferation(GO:0010839) |
| 0.0 | 0.2 | GO:0001865 | NK T cell differentiation(GO:0001865) |
| 0.0 | 0.0 | GO:2000381 | negative regulation of mesoderm development(GO:2000381) |
| 0.0 | 0.1 | GO:0006701 | progesterone biosynthetic process(GO:0006701) |
| 0.0 | 6.9 | GO:0006936 | muscle contraction(GO:0006936) |
| 0.0 | 0.7 | GO:0000188 | inactivation of MAPK activity(GO:0000188) |
| 0.0 | 0.7 | GO:0030513 | positive regulation of BMP signaling pathway(GO:0030513) |
| 0.0 | 0.9 | GO:0018149 | peptide cross-linking(GO:0018149) |
| 0.0 | 3.7 | GO:0009952 | anterior/posterior pattern specification(GO:0009952) |
| 0.0 | 0.2 | GO:0043249 | erythrocyte maturation(GO:0043249) |
| 0.0 | 0.2 | GO:0034498 | early endosome to Golgi transport(GO:0034498) |
| 0.0 | 1.8 | GO:0006805 | xenobiotic metabolic process(GO:0006805) |
| 0.0 | 0.7 | GO:0034260 | negative regulation of GTPase activity(GO:0034260) |
| 0.0 | 0.9 | GO:0016266 | O-glycan processing(GO:0016266) |
| 0.0 | 0.1 | GO:0034142 | toll-like receptor 4 signaling pathway(GO:0034142) |
| 0.0 | 0.2 | GO:0048194 | Golgi vesicle budding(GO:0048194) |
| 0.0 | 0.6 | GO:0046039 | GTP metabolic process(GO:0046039) |
| 0.0 | 0.1 | GO:0060687 | antral ovarian follicle growth(GO:0001547) prostate epithelial cord elongation(GO:0060523) regulation of branching involved in prostate gland morphogenesis(GO:0060687) prostate gland morphogenetic growth(GO:0060737) |
| 0.0 | 0.4 | GO:0045022 | early endosome to late endosome transport(GO:0045022) |
| 0.0 | 0.2 | GO:0045954 | positive regulation of natural killer cell mediated cytotoxicity(GO:0045954) |
| 0.0 | 0.2 | GO:0097120 | receptor localization to synapse(GO:0097120) |
| 0.0 | 0.1 | GO:0000395 | mRNA 5'-splice site recognition(GO:0000395) |
| 0.0 | 1.0 | GO:0010923 | negative regulation of phosphatase activity(GO:0010923) |
| 0.0 | 0.3 | GO:0034389 | lipid particle organization(GO:0034389) |
| 0.0 | 0.2 | GO:0005513 | detection of calcium ion(GO:0005513) |
| 0.0 | 0.9 | GO:0051965 | positive regulation of synapse assembly(GO:0051965) |
| 0.0 | 0.1 | GO:2000342 | negative regulation of chemokine (C-X-C motif) ligand 2 production(GO:2000342) |
| 0.0 | 0.6 | GO:0030212 | hyaluronan metabolic process(GO:0030212) |
| 0.0 | 0.1 | GO:0043552 | positive regulation of phosphatidylinositol 3-kinase activity(GO:0043552) |
| 0.0 | 0.2 | GO:0090312 | positive regulation of protein deacetylation(GO:0090312) |
| 0.0 | 0.1 | GO:0036066 | protein O-linked fucosylation(GO:0036066) |
Gene overrepresentation in cellular_component category:
| Log-likelihood per target | Total log-likelihood | Term | Description |
|---|---|---|---|
| 2.9 | 41.1 | GO:0098647 | collagen type VI trimer(GO:0005589) collagen beaded filament(GO:0098647) |
| 1.6 | 21.4 | GO:0005577 | fibrinogen complex(GO:0005577) |
| 1.6 | 18.6 | GO:0098643 | fibrillar collagen trimer(GO:0005583) banded collagen fibril(GO:0098643) |
| 1.0 | 3.1 | GO:0005826 | actomyosin contractile ring(GO:0005826) |
| 0.7 | 4.3 | GO:0070369 | beta-catenin-TCF7L2 complex(GO:0070369) |
| 0.6 | 5.7 | GO:0005579 | membrane attack complex(GO:0005579) |
| 0.6 | 8.4 | GO:0030478 | actin cap(GO:0030478) |
| 0.5 | 2.3 | GO:0000836 | Hrd1p ubiquitin ligase complex(GO:0000836) |
| 0.4 | 2.7 | GO:0097442 | CA3 pyramidal cell dendrite(GO:0097442) |
| 0.4 | 3.6 | GO:0042567 | insulin-like growth factor ternary complex(GO:0042567) |
| 0.4 | 6.3 | GO:0097512 | cardiac myofibril(GO:0097512) |
| 0.4 | 7.0 | GO:0031089 | platelet dense granule lumen(GO:0031089) |
| 0.4 | 1.1 | GO:0097679 | other organism cytoplasm(GO:0097679) |
| 0.4 | 2.5 | GO:0043240 | Fanconi anaemia nuclear complex(GO:0043240) |
| 0.3 | 2.0 | GO:0033063 | DNA recombinase mediator complex(GO:0033061) Rad51B-Rad51C-Rad51D-XRCC2 complex(GO:0033063) |
| 0.3 | 5.7 | GO:0005736 | DNA-directed RNA polymerase I complex(GO:0005736) |
| 0.3 | 1.7 | GO:0044218 | other organism cell membrane(GO:0044218) other organism membrane(GO:0044279) |
| 0.2 | 2.1 | GO:0016013 | syntrophin complex(GO:0016013) |
| 0.2 | 2.4 | GO:0005614 | interstitial matrix(GO:0005614) |
| 0.2 | 0.7 | GO:0005944 | phosphatidylinositol 3-kinase complex, class IB(GO:0005944) |
| 0.2 | 1.1 | GO:0070847 | core mediator complex(GO:0070847) |
| 0.2 | 1.5 | GO:0014701 | junctional sarcoplasmic reticulum membrane(GO:0014701) |
| 0.2 | 1.2 | GO:0009331 | glycerol-3-phosphate dehydrogenase complex(GO:0009331) |
| 0.2 | 4.8 | GO:0032982 | myosin filament(GO:0032982) |
| 0.2 | 0.6 | GO:0097058 | CRLF-CLCF1 complex(GO:0097058) |
| 0.2 | 2.2 | GO:0005859 | muscle myosin complex(GO:0005859) |
| 0.1 | 0.6 | GO:0072536 | interleukin-23 receptor complex(GO:0072536) |
| 0.1 | 0.7 | GO:0020016 | ciliary pocket(GO:0020016) ciliary pocket membrane(GO:0020018) |
| 0.1 | 22.8 | GO:0030018 | Z disc(GO:0030018) |
| 0.1 | 13.3 | GO:0031093 | platelet alpha granule lumen(GO:0031093) |
| 0.1 | 1.1 | GO:0072687 | meiotic spindle(GO:0072687) |
| 0.1 | 0.6 | GO:0005927 | muscle tendon junction(GO:0005927) |
| 0.1 | 1.0 | GO:0070083 | clathrin-sculpted monoamine transport vesicle(GO:0070081) clathrin-sculpted monoamine transport vesicle membrane(GO:0070083) |
| 0.1 | 9.8 | GO:0001669 | acrosomal vesicle(GO:0001669) |
| 0.1 | 0.5 | GO:0071148 | TEAD-1-YAP complex(GO:0071148) |
| 0.1 | 0.8 | GO:0005672 | transcription factor TFIIA complex(GO:0005672) |
| 0.1 | 1.6 | GO:0042622 | photoreceptor outer segment membrane(GO:0042622) |
| 0.1 | 5.5 | GO:0005782 | peroxisomal matrix(GO:0005782) microbody lumen(GO:0031907) |
| 0.1 | 0.2 | GO:1990357 | terminal web(GO:1990357) |
| 0.1 | 1.2 | GO:0097433 | dense body(GO:0097433) |
| 0.1 | 0.7 | GO:0016012 | sarcoglycan complex(GO:0016012) |
| 0.1 | 1.8 | GO:0044295 | axonal growth cone(GO:0044295) |
| 0.1 | 1.3 | GO:0031045 | dense core granule(GO:0031045) |
| 0.1 | 1.6 | GO:0005861 | troponin complex(GO:0005861) |
| 0.1 | 1.0 | GO:0033270 | paranode region of axon(GO:0033270) |
| 0.1 | 6.4 | GO:0005811 | lipid particle(GO:0005811) |
| 0.1 | 2.1 | GO:0031307 | integral component of mitochondrial outer membrane(GO:0031307) |
| 0.1 | 2.3 | GO:0005868 | cytoplasmic dynein complex(GO:0005868) |
| 0.1 | 6.0 | GO:0005902 | microvillus(GO:0005902) |
| 0.1 | 0.8 | GO:0008250 | oligosaccharyltransferase complex(GO:0008250) |
| 0.1 | 0.6 | GO:0031092 | platelet alpha granule membrane(GO:0031092) |
| 0.1 | 0.2 | GO:0033655 | host cell cytoplasm(GO:0030430) host cell cytoplasm part(GO:0033655) |
| 0.1 | 2.9 | GO:0001533 | cornified envelope(GO:0001533) |
| 0.1 | 17.1 | GO:0005788 | endoplasmic reticulum lumen(GO:0005788) |
| 0.1 | 0.2 | GO:0000308 | cytoplasmic cyclin-dependent protein kinase holoenzyme complex(GO:0000308) |
| 0.1 | 0.6 | GO:1990712 | HFE-transferrin receptor complex(GO:1990712) |
| 0.0 | 0.5 | GO:0005581 | collagen trimer(GO:0005581) |
| 0.0 | 0.7 | GO:0031362 | anchored component of external side of plasma membrane(GO:0031362) |
| 0.0 | 1.1 | GO:0070971 | endoplasmic reticulum exit site(GO:0070971) |
| 0.0 | 0.2 | GO:0031205 | endoplasmic reticulum Sec complex(GO:0031205) |
| 0.0 | 0.6 | GO:0030673 | axolemma(GO:0030673) |
| 0.0 | 0.5 | GO:0036038 | MKS complex(GO:0036038) |
| 0.0 | 2.8 | GO:0043195 | terminal bouton(GO:0043195) |
| 0.0 | 0.7 | GO:0005665 | DNA-directed RNA polymerase II, core complex(GO:0005665) |
| 0.0 | 1.5 | GO:0005891 | voltage-gated calcium channel complex(GO:0005891) |
| 0.0 | 48.0 | GO:0005615 | extracellular space(GO:0005615) |
| 0.0 | 7.8 | GO:0016323 | basolateral plasma membrane(GO:0016323) |
| 0.0 | 0.3 | GO:0044300 | cerebellar mossy fiber(GO:0044300) |
| 0.0 | 5.4 | GO:0043209 | myelin sheath(GO:0043209) |
| 0.0 | 0.6 | GO:0005892 | acetylcholine-gated channel complex(GO:0005892) |
| 0.0 | 0.1 | GO:0046581 | intercellular canaliculus(GO:0046581) |
| 0.0 | 0.7 | GO:0031904 | endosome lumen(GO:0031904) |
| 0.0 | 4.1 | GO:0001726 | ruffle(GO:0001726) |
| 0.0 | 0.7 | GO:0043679 | axon terminus(GO:0043679) |
| 0.0 | 0.1 | GO:0060077 | inhibitory synapse(GO:0060077) |
| 0.0 | 1.4 | GO:0005884 | actin filament(GO:0005884) |
| 0.0 | 0.5 | GO:0043198 | dendritic shaft(GO:0043198) |
| 0.0 | 3.7 | GO:0060076 | excitatory synapse(GO:0060076) |
| 0.0 | 0.4 | GO:0051233 | spindle midzone(GO:0051233) |
| 0.0 | 1.2 | GO:0031519 | PcG protein complex(GO:0031519) |
| 0.0 | 0.8 | GO:0031902 | late endosome membrane(GO:0031902) |
| 0.0 | 0.6 | GO:0019005 | SCF ubiquitin ligase complex(GO:0019005) |
| 0.0 | 0.1 | GO:0097550 | transcriptional preinitiation complex(GO:0097550) |
Gene overrepresentation in molecular_function category:
| Log-likelihood per target | Total log-likelihood | Term | Description |
|---|---|---|---|
| 2.1 | 6.3 | GO:0005017 | platelet-derived growth factor-activated receptor activity(GO:0005017) |
| 1.9 | 9.6 | GO:0016316 | phosphatidylinositol-3,4-bisphosphate 4-phosphatase activity(GO:0016316) inositol-1,3,4-trisphosphate 4-phosphatase activity(GO:0017161) phosphatidylinositol-4,5-bisphosphate 4-phosphatase activity(GO:0034597) inositol-3,4-bisphosphate 4-phosphatase activity(GO:0052828) |
| 1.4 | 7.0 | GO:0060230 | lipoprotein lipase activator activity(GO:0060230) |
| 1.3 | 3.9 | GO:0008426 | protein kinase C inhibitor activity(GO:0008426) |
| 1.1 | 12.8 | GO:0048407 | platelet-derived growth factor binding(GO:0048407) |
| 1.0 | 3.0 | GO:0033858 | N-acetylgalactosamine kinase activity(GO:0033858) |
| 0.9 | 5.7 | GO:0004447 | iodide peroxidase activity(GO:0004447) |
| 0.9 | 3.8 | GO:0016160 | amylase activity(GO:0016160) |
| 0.9 | 2.8 | GO:0070052 | collagen V binding(GO:0070052) |
| 0.9 | 2.7 | GO:0030343 | vitamin D3 25-hydroxylase activity(GO:0030343) vitamin D 25-hydroxylase activity(GO:0070643) |
| 0.9 | 7.0 | GO:0008559 | xenobiotic-transporting ATPase activity(GO:0008559) |
| 0.8 | 19.0 | GO:0043395 | heparan sulfate proteoglycan binding(GO:0043395) |
| 0.8 | 12.4 | GO:0015643 | toxic substance binding(GO:0015643) |
| 0.8 | 4.6 | GO:0047086 | phenanthrene 9,10-monooxygenase activity(GO:0018636) ketosteroid monooxygenase activity(GO:0047086) trans-1,2-dihydrobenzene-1,2-diol dehydrogenase activity(GO:0047115) |
| 0.7 | 46.4 | GO:0050840 | extracellular matrix binding(GO:0050840) |
| 0.7 | 4.0 | GO:0033989 | 3alpha,7alpha,12alpha-trihydroxy-5beta-cholest-24-enoyl-CoA hydratase activity(GO:0033989) 17-beta-hydroxysteroid dehydrogenase (NAD+) activity(GO:0044594) |
| 0.6 | 8.7 | GO:0005132 | type I interferon receptor binding(GO:0005132) |
| 0.6 | 1.8 | GO:0070546 | L-phenylalanine aminotransferase activity(GO:0070546) L-phenylalanine:2-oxoglutarate aminotransferase activity(GO:0080130) |
| 0.6 | 2.4 | GO:1990430 | extracellular matrix protein binding(GO:1990430) |
| 0.5 | 5.4 | GO:0070492 | oligosaccharide binding(GO:0070492) |
| 0.5 | 1.6 | GO:0050501 | hyaluronan synthase activity(GO:0050501) |
| 0.5 | 4.8 | GO:0016724 | ferroxidase activity(GO:0004322) oxidoreductase activity, oxidizing metal ions, oxygen as acceptor(GO:0016724) |
| 0.5 | 2.0 | GO:0000702 | oxidized base lesion DNA N-glycosylase activity(GO:0000702) |
| 0.5 | 1.4 | GO:0035373 | chondroitin sulfate proteoglycan binding(GO:0035373) |
| 0.5 | 1.8 | GO:0000822 | inositol hexakisphosphate binding(GO:0000822) |
| 0.4 | 5.4 | GO:0019911 | structural constituent of myelin sheath(GO:0019911) |
| 0.4 | 2.5 | GO:0004024 | alcohol dehydrogenase activity, zinc-dependent(GO:0004024) |
| 0.4 | 8.7 | GO:0002162 | dystroglycan binding(GO:0002162) |
| 0.4 | 1.6 | GO:0030899 | calcium-dependent ATPase activity(GO:0030899) |
| 0.4 | 1.6 | GO:0004948 | calcitonin receptor activity(GO:0004948) |
| 0.3 | 2.0 | GO:0004522 | ribonuclease A activity(GO:0004522) |
| 0.3 | 2.4 | GO:0015093 | ferrous iron transmembrane transporter activity(GO:0015093) |
| 0.3 | 29.7 | GO:0008307 | structural constituent of muscle(GO:0008307) |
| 0.3 | 1.0 | GO:0004937 | alpha1-adrenergic receptor activity(GO:0004937) |
| 0.3 | 1.0 | GO:0005457 | GDP-fucose transmembrane transporter activity(GO:0005457) purine nucleotide-sugar transmembrane transporter activity(GO:0036080) |
| 0.3 | 1.0 | GO:0015222 | serotonin transmembrane transporter activity(GO:0015222) |
| 0.3 | 7.3 | GO:0005523 | tropomyosin binding(GO:0005523) |
| 0.3 | 1.9 | GO:0008597 | calcium-dependent protein serine/threonine phosphatase regulator activity(GO:0008597) |
| 0.3 | 5.7 | GO:0001054 | RNA polymerase I activity(GO:0001054) |
| 0.3 | 1.2 | GO:0052591 | sn-glycerol-3-phosphate:ubiquinone oxidoreductase activity(GO:0052590) sn-glycerol-3-phosphate:ubiquinone-8 oxidoreductase activity(GO:0052591) |
| 0.3 | 1.2 | GO:0051734 | ATP-dependent polydeoxyribonucleotide 5'-hydroxyl-kinase activity(GO:0046404) polydeoxyribonucleotide kinase activity(GO:0051733) ATP-dependent polynucleotide kinase activity(GO:0051734) |
| 0.3 | 5.4 | GO:0016712 | oxidoreductase activity, acting on paired donors, with incorporation or reduction of molecular oxygen, reduced flavin or flavoprotein as one donor, and incorporation of one atom of oxygen(GO:0016712) |
| 0.3 | 5.7 | GO:0015125 | bile acid transmembrane transporter activity(GO:0015125) |
| 0.3 | 0.8 | GO:0005549 | odorant binding(GO:0005549) |
| 0.2 | 0.7 | GO:0016434 | rRNA (cytosine) methyltransferase activity(GO:0016434) |
| 0.2 | 0.7 | GO:0080019 | fatty-acyl-CoA reductase (alcohol-forming) activity(GO:0080019) |
| 0.2 | 4.3 | GO:0004861 | cyclin-dependent protein serine/threonine kinase inhibitor activity(GO:0004861) |
| 0.2 | 3.0 | GO:0001968 | fibronectin binding(GO:0001968) |
| 0.2 | 0.7 | GO:0005148 | prolactin receptor binding(GO:0005148) |
| 0.2 | 4.3 | GO:0070016 | armadillo repeat domain binding(GO:0070016) |
| 0.2 | 1.5 | GO:1990405 | protein antigen binding(GO:1990405) |
| 0.2 | 1.1 | GO:0004974 | leukotriene receptor activity(GO:0004974) |
| 0.2 | 1.5 | GO:0045499 | chemorepellent activity(GO:0045499) |
| 0.2 | 1.0 | GO:0016907 | G-protein coupled acetylcholine receptor activity(GO:0016907) |
| 0.2 | 21.1 | GO:0004867 | serine-type endopeptidase inhibitor activity(GO:0004867) |
| 0.2 | 3.1 | GO:0008179 | adenylate cyclase binding(GO:0008179) |
| 0.2 | 10.5 | GO:0015485 | cholesterol binding(GO:0015485) |
| 0.2 | 0.9 | GO:0015111 | iodide transmembrane transporter activity(GO:0015111) |
| 0.2 | 2.8 | GO:0035612 | AP-2 adaptor complex binding(GO:0035612) |
| 0.2 | 0.9 | GO:0047237 | glucuronylgalactosylproteoglycan 4-beta-N-acetylgalactosaminyltransferase activity(GO:0047237) |
| 0.2 | 2.0 | GO:0000150 | recombinase activity(GO:0000150) |
| 0.2 | 2.4 | GO:0017162 | aryl hydrocarbon receptor binding(GO:0017162) |
| 0.2 | 0.7 | GO:0061714 | folic acid receptor activity(GO:0061714) |
| 0.2 | 1.0 | GO:0050294 | steroid sulfotransferase activity(GO:0050294) |
| 0.2 | 0.5 | GO:0015234 | thiamine transmembrane transporter activity(GO:0015234) thiamine uptake transmembrane transporter activity(GO:0015403) |
| 0.2 | 3.1 | GO:0048018 | receptor agonist activity(GO:0048018) |
| 0.2 | 1.2 | GO:0044323 | retinoic acid-responsive element binding(GO:0044323) |
| 0.1 | 0.6 | GO:0042020 | interleukin-23 binding(GO:0042019) interleukin-23 receptor activity(GO:0042020) |
| 0.1 | 1.3 | GO:0010314 | phosphatidylinositol-5-phosphate binding(GO:0010314) |
| 0.1 | 4.5 | GO:0005212 | structural constituent of eye lens(GO:0005212) |
| 0.1 | 0.6 | GO:0008336 | gamma-butyrobetaine dioxygenase activity(GO:0008336) |
| 0.1 | 6.8 | GO:0004364 | glutathione transferase activity(GO:0004364) |
| 0.1 | 3.9 | GO:0004181 | metallocarboxypeptidase activity(GO:0004181) |
| 0.1 | 6.6 | GO:0005518 | collagen binding(GO:0005518) |
| 0.1 | 0.5 | GO:0008391 | arachidonic acid monooxygenase activity(GO:0008391) arachidonic acid epoxygenase activity(GO:0008392) |
| 0.1 | 13.0 | GO:0051087 | chaperone binding(GO:0051087) |
| 0.1 | 1.6 | GO:0043855 | intracellular cyclic nucleotide activated cation channel activity(GO:0005221) cyclic nucleotide-gated ion channel activity(GO:0043855) |
| 0.1 | 1.8 | GO:0008432 | JUN kinase binding(GO:0008432) |
| 0.1 | 0.9 | GO:0043125 | ErbB-3 class receptor binding(GO:0043125) |
| 0.1 | 0.7 | GO:0015057 | thrombin receptor activity(GO:0015057) |
| 0.1 | 0.5 | GO:0048248 | CXCR3 chemokine receptor binding(GO:0048248) |
| 0.1 | 2.3 | GO:0045504 | dynein heavy chain binding(GO:0045504) |
| 0.1 | 0.7 | GO:0009378 | four-way junction helicase activity(GO:0009378) |
| 0.1 | 0.6 | GO:0005127 | ciliary neurotrophic factor receptor binding(GO:0005127) |
| 0.1 | 2.0 | GO:0015467 | G-protein activated inward rectifier potassium channel activity(GO:0015467) |
| 0.1 | 2.4 | GO:0004012 | phospholipid-translocating ATPase activity(GO:0004012) |
| 0.1 | 1.1 | GO:0047498 | calcium-dependent phospholipase A2 activity(GO:0047498) |
| 0.1 | 0.7 | GO:0003828 | alpha-N-acetylneuraminate alpha-2,8-sialyltransferase activity(GO:0003828) |
| 0.1 | 2.7 | GO:0030546 | receptor activator activity(GO:0030546) |
| 0.1 | 0.8 | GO:0016929 | SUMO-specific protease activity(GO:0016929) |
| 0.1 | 1.0 | GO:0005007 | fibroblast growth factor-activated receptor activity(GO:0005007) |
| 0.1 | 1.3 | GO:0042056 | chemoattractant activity(GO:0042056) |
| 0.1 | 0.7 | GO:0035005 | 1-phosphatidylinositol-4-phosphate 3-kinase activity(GO:0035005) |
| 0.1 | 3.4 | GO:0000146 | microfilament motor activity(GO:0000146) |
| 0.1 | 1.8 | GO:0008331 | high voltage-gated calcium channel activity(GO:0008331) |
| 0.1 | 1.0 | GO:0004576 | oligosaccharyl transferase activity(GO:0004576) |
| 0.1 | 0.9 | GO:0004791 | thioredoxin-disulfide reductase activity(GO:0004791) |
| 0.1 | 0.6 | GO:0015501 | glutamate:sodium symporter activity(GO:0015501) |
| 0.1 | 0.3 | GO:0035473 | lipase binding(GO:0035473) |
| 0.1 | 4.3 | GO:0005504 | fatty acid binding(GO:0005504) |
| 0.1 | 1.8 | GO:0042813 | Wnt-activated receptor activity(GO:0042813) |
| 0.1 | 0.8 | GO:0015248 | sterol transporter activity(GO:0015248) |
| 0.1 | 0.2 | GO:0016992 | lipoate synthase activity(GO:0016992) radical SAM enzyme activity(GO:0070283) |
| 0.1 | 0.9 | GO:0016713 | oxidoreductase activity, acting on paired donors, with incorporation or reduction of molecular oxygen, reduced iron-sulfur protein as one donor, and incorporation of one atom of oxygen(GO:0016713) |
| 0.1 | 1.1 | GO:0000987 | RNA polymerase II core promoter proximal region sequence-specific DNA binding(GO:0000978) core promoter proximal region sequence-specific DNA binding(GO:0000987) |
| 0.1 | 2.1 | GO:0001223 | transcription coactivator binding(GO:0001223) |
| 0.1 | 1.0 | GO:0042043 | neurexin family protein binding(GO:0042043) |
| 0.1 | 2.2 | GO:0042805 | actinin binding(GO:0042805) |
| 0.1 | 1.6 | GO:0004029 | aldehyde dehydrogenase (NAD) activity(GO:0004029) |
| 0.1 | 0.8 | GO:0005004 | GPI-linked ephrin receptor activity(GO:0005004) |
| 0.1 | 0.6 | GO:0005025 | transforming growth factor beta receptor activity, type I(GO:0005025) |
| 0.1 | 0.4 | GO:0016909 | JUN kinase activity(GO:0004705) SAP kinase activity(GO:0016909) |
| 0.1 | 3.0 | GO:0004984 | olfactory receptor activity(GO:0004984) |
| 0.1 | 0.6 | GO:0022841 | potassium ion leak channel activity(GO:0022841) |
| 0.1 | 0.2 | GO:0005260 | channel-conductance-controlling ATPase activity(GO:0005260) |
| 0.1 | 0.3 | GO:0001594 | trace-amine receptor activity(GO:0001594) |
| 0.1 | 0.5 | GO:1990380 | Lys48-specific deubiquitinase activity(GO:1990380) |
| 0.1 | 7.8 | GO:0005178 | integrin binding(GO:0005178) |
| 0.1 | 2.2 | GO:0030552 | cAMP binding(GO:0030552) |
| 0.0 | 0.5 | GO:0031545 | peptidyl-proline 4-dioxygenase activity(GO:0031545) |
| 0.0 | 0.8 | GO:0030955 | potassium ion binding(GO:0030955) |
| 0.0 | 0.5 | GO:0004568 | chitinase activity(GO:0004568) chitin binding(GO:0008061) |
| 0.0 | 0.2 | GO:0005134 | interleukin-2 receptor binding(GO:0005134) |
| 0.0 | 1.4 | GO:0016709 | oxidoreductase activity, acting on paired donors, with incorporation or reduction of molecular oxygen, NAD(P)H as one donor, and incorporation of one atom of oxygen(GO:0016709) |
| 0.0 | 0.5 | GO:0019957 | C-C chemokine binding(GO:0019957) |
| 0.0 | 0.1 | GO:0004819 | glutamine-tRNA ligase activity(GO:0004819) valine-tRNA ligase activity(GO:0004832) |
| 0.0 | 0.1 | GO:0097100 | supercoiled DNA binding(GO:0097100) |
| 0.0 | 0.4 | GO:0016290 | palmitoyl-CoA hydrolase activity(GO:0016290) |
| 0.0 | 0.6 | GO:0016813 | hydrolase activity, acting on carbon-nitrogen (but not peptide) bonds, in linear amidines(GO:0016813) |
| 0.0 | 0.4 | GO:0004993 | G-protein coupled serotonin receptor activity(GO:0004993) |
| 0.0 | 1.2 | GO:0017075 | syntaxin-1 binding(GO:0017075) |
| 0.0 | 0.3 | GO:0008109 | N-acetyllactosaminide beta-1,6-N-acetylglucosaminyltransferase activity(GO:0008109) |
| 0.0 | 2.0 | GO:0070888 | E-box binding(GO:0070888) |
| 0.0 | 0.7 | GO:0005095 | GTPase inhibitor activity(GO:0005095) |
| 0.0 | 2.5 | GO:0004722 | protein serine/threonine phosphatase activity(GO:0004722) |
| 0.0 | 0.8 | GO:0016702 | oxidoreductase activity, acting on single donors with incorporation of molecular oxygen, incorporation of two atoms of oxygen(GO:0016702) |
| 0.0 | 0.2 | GO:0004046 | aminoacylase activity(GO:0004046) |
| 0.0 | 3.2 | GO:0005089 | Rho guanyl-nucleotide exchange factor activity(GO:0005089) |
| 0.0 | 0.6 | GO:0070300 | phosphatidic acid binding(GO:0070300) |
| 0.0 | 0.7 | GO:0005251 | delayed rectifier potassium channel activity(GO:0005251) |
| 0.0 | 1.1 | GO:0016303 | 1-phosphatidylinositol-3-kinase activity(GO:0016303) |
| 0.0 | 0.6 | GO:0042166 | acetylcholine binding(GO:0042166) |
| 0.0 | 0.1 | GO:0032558 | adenyl deoxyribonucleotide binding(GO:0032558) dATP binding(GO:0032564) |
| 0.0 | 0.6 | GO:0004806 | triglyceride lipase activity(GO:0004806) |
| 0.0 | 0.4 | GO:0004143 | diacylglycerol kinase activity(GO:0004143) |
| 0.0 | 0.6 | GO:0005521 | lamin binding(GO:0005521) |
| 0.0 | 0.2 | GO:0005242 | inward rectifier potassium channel activity(GO:0005242) |
| 0.0 | 0.4 | GO:0005548 | phospholipid transporter activity(GO:0005548) |
| 0.0 | 0.9 | GO:0050699 | WW domain binding(GO:0050699) |
| 0.0 | 0.9 | GO:0030507 | spectrin binding(GO:0030507) |
| 0.0 | 0.3 | GO:0005229 | intracellular calcium activated chloride channel activity(GO:0005229) |
| 0.0 | 0.2 | GO:0070273 | phosphatidylinositol-4-phosphate binding(GO:0070273) |
| 0.0 | 0.3 | GO:0043522 | leucine zipper domain binding(GO:0043522) |
| 0.0 | 0.5 | GO:0001972 | retinoic acid binding(GO:0001972) |
| 0.0 | 2.5 | GO:0001085 | RNA polymerase II transcription factor binding(GO:0001085) |
| 0.0 | 0.6 | GO:0048306 | calcium-dependent protein binding(GO:0048306) |
| 0.0 | 0.4 | GO:0017022 | myosin binding(GO:0017022) |
| 0.0 | 0.2 | GO:0048156 | tau protein binding(GO:0048156) |
| 0.0 | 0.6 | GO:0005184 | neuropeptide hormone activity(GO:0005184) |
| 0.0 | 10.7 | GO:0005509 | calcium ion binding(GO:0005509) |
| 0.0 | 0.0 | GO:0016015 | morphogen activity(GO:0016015) |
| 0.0 | 0.1 | GO:0003998 | acylphosphatase activity(GO:0003998) |
| 0.0 | 0.2 | GO:0005537 | mannose binding(GO:0005537) |
| 0.0 | 0.2 | GO:0001222 | transcription corepressor binding(GO:0001222) |
| 0.0 | 5.1 | GO:0005525 | GTP binding(GO:0005525) |
| 0.0 | 1.0 | GO:0005200 | structural constituent of cytoskeleton(GO:0005200) |
| 0.0 | 0.4 | GO:0005507 | copper ion binding(GO:0005507) |
Gene overrepresentation in C2:CP category:
| Log-likelihood per target | Total log-likelihood | Term | Description |
|---|---|---|---|
| 0.7 | 41.4 | NABA PROTEOGLYCANS | Genes encoding proteoglycans |
| 0.4 | 44.8 | PID INTEGRIN1 PATHWAY | Beta1 integrin cell surface interactions |
| 0.3 | 20.5 | PID HNF3B PATHWAY | FOXA2 and FOXA3 transcription factor networks |
| 0.2 | 2.8 | PID THROMBIN PAR4 PATHWAY | PAR4-mediated thrombin signaling events |
| 0.2 | 5.8 | PID PDGFRA PATHWAY | PDGFR-alpha signaling pathway |
| 0.1 | 11.6 | PID AP1 PATHWAY | AP-1 transcription factor network |
| 0.1 | 3.5 | PID SYNDECAN 4 PATHWAY | Syndecan-4-mediated signaling events |
| 0.1 | 1.6 | PID FRA PATHWAY | Validated transcriptional targets of AP1 family members Fra1 and Fra2 |
| 0.1 | 15.8 | NABA ECM GLYCOPROTEINS | Genes encoding structural ECM glycoproteins |
| 0.1 | 4.6 | PID P38 ALPHA BETA DOWNSTREAM PATHWAY | Signaling mediated by p38-alpha and p38-beta |
| 0.1 | 5.3 | PID HIF1 TFPATHWAY | HIF-1-alpha transcription factor network |
| 0.1 | 1.8 | PID ER NONGENOMIC PATHWAY | Plasma membrane estrogen receptor signaling |
| 0.1 | 1.4 | PID EPHA FWDPATHWAY | EPHA forward signaling |
| 0.1 | 1.0 | PID TCR RAS PATHWAY | Ras signaling in the CD4+ TCR pathway |
| 0.1 | 2.5 | PID IL6 7 PATHWAY | IL6-mediated signaling events |
| 0.0 | 0.1 | PID HDAC CLASSIII PATHWAY | Signaling events mediated by HDAC Class III |
| 0.0 | 2.2 | PID AMB2 NEUTROPHILS PATHWAY | amb2 Integrin signaling |
| 0.0 | 2.9 | PID ATR PATHWAY | ATR signaling pathway |
| 0.0 | 2.4 | PID HEDGEHOG GLI PATHWAY | Hedgehog signaling events mediated by Gli proteins |
| 0.0 | 2.7 | PID LKB1 PATHWAY | LKB1 signaling events |
| 0.0 | 3.0 | PID ERA GENOMIC PATHWAY | Validated nuclear estrogen receptor alpha network |
| 0.0 | 1.1 | PID ENDOTHELIN PATHWAY | Endothelins |
| 0.0 | 0.7 | PID EPHRINB REV PATHWAY | Ephrin B reverse signaling |
| 0.0 | 0.5 | PID ARF6 DOWNSTREAM PATHWAY | Arf6 downstream pathway |
| 0.0 | 0.9 | PID FANCONI PATHWAY | Fanconi anemia pathway |
| 0.0 | 0.9 | PID RHODOPSIN PATHWAY | Visual signal transduction: Rods |
| 0.0 | 9.7 | NABA SECRETED FACTORS | Genes encoding secreted soluble factors |
| 0.0 | 0.9 | PID HNF3A PATHWAY | FOXA1 transcription factor network |
| 0.0 | 4.3 | NABA ECM AFFILIATED | Genes encoding proteins affiliated structurally or functionally to extracellular matrix proteins |
| 0.0 | 5.7 | NABA MATRISOME ASSOCIATED | Ensemble of genes encoding ECM-associated proteins including ECM-affilaited proteins, ECM regulators and secreted factors |
| 0.0 | 0.9 | PID ERBB4 PATHWAY | ErbB4 signaling events |
| 0.0 | 0.2 | PID FAK PATHWAY | Signaling events mediated by focal adhesion kinase |
| 0.0 | 0.4 | PID WNT NONCANONICAL PATHWAY | Noncanonical Wnt signaling pathway |
| 0.0 | 0.5 | ST GA13 PATHWAY | G alpha 13 Pathway |
| 0.0 | 0.3 | PID FGF PATHWAY | FGF signaling pathway |
Gene overrepresentation in C2:CP:REACTOME category:
| Log-likelihood per target | Total log-likelihood | Term | Description |
|---|---|---|---|
| 1.4 | 39.0 | REACTOME CS DS DEGRADATION | Genes involved in CS/DS degradation |
| 1.3 | 21.2 | REACTOME COMMON PATHWAY | Genes involved in Common Pathway |
| 1.0 | 16.7 | REACTOME RECYCLING OF BILE ACIDS AND SALTS | Genes involved in Recycling of bile acids and salts |
| 0.8 | 21.9 | REACTOME REGULATION OF COMPLEMENT CASCADE | Genes involved in Regulation of Complement cascade |
| 0.8 | 3.9 | REACTOME DESTABILIZATION OF MRNA BY AUF1 HNRNP D0 | Genes involved in Destabilization of mRNA by AUF1 (hnRNP D0) |
| 0.6 | 9.6 | REACTOME SYNTHESIS OF PIPS AT THE EARLY ENDOSOME MEMBRANE | Genes involved in Synthesis of PIPs at the early endosome membrane |
| 0.5 | 8.6 | REACTOME XENOBIOTICS | Genes involved in Xenobiotics |
| 0.4 | 0.4 | REACTOME DSCAM INTERACTIONS | Genes involved in DSCAM interactions |
| 0.4 | 5.8 | REACTOME KERATAN SULFATE DEGRADATION | Genes involved in Keratan sulfate degradation |
| 0.3 | 2.5 | REACTOME ETHANOL OXIDATION | Genes involved in Ethanol oxidation |
| 0.3 | 2.8 | REACTOME GAMMA CARBOXYLATION TRANSPORT AND AMINO TERMINAL CLEAVAGE OF PROTEINS | Genes involved in Gamma-carboxylation, transport, and amino-terminal cleavage of proteins |
| 0.3 | 3.3 | REACTOME DIGESTION OF DIETARY CARBOHYDRATE | Genes involved in Digestion of dietary carbohydrate |
| 0.3 | 17.0 | REACTOME NCAM1 INTERACTIONS | Genes involved in NCAM1 interactions |
| 0.3 | 5.7 | REACTOME COMPLEMENT CASCADE | Genes involved in Complement cascade |
| 0.3 | 4.3 | REACTOME SYNTHESIS OF BILE ACIDS AND BILE SALTS VIA 7ALPHA HYDROXYCHOLESTEROL | Genes involved in Synthesis of bile acids and bile salts via 7alpha-hydroxycholesterol |
| 0.2 | 6.2 | REACTOME REGULATION OF INSULIN LIKE GROWTH FACTOR IGF ACTIVITY BY INSULIN LIKE GROWTH FACTOR BINDING PROTEINS IGFBPS | Genes involved in Regulation of Insulin-like Growth Factor (IGF) Activity by Insulin-like Growth Factor Binding Proteins (IGFBPs) |
| 0.2 | 5.4 | REACTOME AMINE DERIVED HORMONES | Genes involved in Amine-derived hormones |
| 0.2 | 7.2 | REACTOME REGULATION OF IFNA SIGNALING | Genes involved in Regulation of IFNA signaling |
| 0.2 | 15.0 | REACTOME STRIATED MUSCLE CONTRACTION | Genes involved in Striated Muscle Contraction |
| 0.2 | 7.9 | REACTOME ABC FAMILY PROTEINS MEDIATED TRANSPORT | Genes involved in ABC-family proteins mediated transport |
| 0.2 | 4.8 | REACTOME METAL ION SLC TRANSPORTERS | Genes involved in Metal ion SLC transporters |
| 0.2 | 8.4 | REACTOME SMOOTH MUSCLE CONTRACTION | Genes involved in Smooth Muscle Contraction |
| 0.2 | 5.9 | REACTOME GLUTATHIONE CONJUGATION | Genes involved in Glutathione conjugation |
| 0.2 | 5.5 | REACTOME SPHINGOLIPID DE NOVO BIOSYNTHESIS | Genes involved in Sphingolipid de novo biosynthesis |
| 0.2 | 5.7 | REACTOME RNA POL I TRANSCRIPTION TERMINATION | Genes involved in RNA Polymerase I Transcription Termination |
| 0.1 | 2.5 | REACTOME TERMINATION OF O GLYCAN BIOSYNTHESIS | Genes involved in Termination of O-glycan biosynthesis |
| 0.1 | 2.0 | REACTOME BASE FREE SUGAR PHOSPHATE REMOVAL VIA THE SINGLE NUCLEOTIDE REPLACEMENT PATHWAY | Genes involved in Base-free sugar-phosphate removal via the single-nucleotide replacement pathway |
| 0.1 | 0.5 | REACTOME BINDING AND ENTRY OF HIV VIRION | Genes involved in Binding and entry of HIV virion |
| 0.1 | 2.3 | REACTOME PRE NOTCH PROCESSING IN GOLGI | Genes involved in Pre-NOTCH Processing in Golgi |
| 0.1 | 2.0 | REACTOME GABA B RECEPTOR ACTIVATION | Genes involved in GABA B receptor activation |
| 0.1 | 2.5 | REACTOME FANCONI ANEMIA PATHWAY | Genes involved in Fanconi Anemia pathway |
| 0.1 | 1.8 | REACTOME P130CAS LINKAGE TO MAPK SIGNALING FOR INTEGRINS | Genes involved in p130Cas linkage to MAPK signaling for integrins |
| 0.1 | 8.0 | REACTOME INTEGRIN CELL SURFACE INTERACTIONS | Genes involved in Integrin cell surface interactions |
| 0.1 | 1.6 | REACTOME YAP1 AND WWTR1 TAZ STIMULATED GENE EXPRESSION | Genes involved in YAP1- and WWTR1 (TAZ)-stimulated gene expression |
| 0.1 | 1.1 | REACTOME ACYL CHAIN REMODELLING OF PG | Genes involved in Acyl chain remodelling of PG |
| 0.1 | 1.0 | REACTOME SPRY REGULATION OF FGF SIGNALING | Genes involved in Spry regulation of FGF signaling |
| 0.1 | 1.0 | REACTOME KERATAN SULFATE KERATIN METABOLISM | Genes involved in Keratan sulfate/keratin metabolism |
| 0.1 | 0.7 | REACTOME THROMBIN SIGNALLING THROUGH PROTEINASE ACTIVATED RECEPTORS PARS | Genes involved in Thrombin signalling through proteinase activated receptors (PARs) |
| 0.1 | 3.2 | REACTOME OLFACTORY SIGNALING PATHWAY | Genes involved in Olfactory Signaling Pathway |
| 0.1 | 2.7 | REACTOME AMINE LIGAND BINDING RECEPTORS | Genes involved in Amine ligand-binding receptors |
| 0.1 | 1.0 | REACTOME FGFR2C LIGAND BINDING AND ACTIVATION | Genes involved in FGFR2c ligand binding and activation |
| 0.1 | 1.1 | REACTOME EICOSANOID LIGAND BINDING RECEPTORS | Genes involved in Eicosanoid ligand-binding receptors |
| 0.1 | 1.1 | REACTOME ENDOGENOUS STEROLS | Genes involved in Endogenous sterols |
| 0.1 | 1.8 | REACTOME INTERACTION BETWEEN L1 AND ANKYRINS | Genes involved in Interaction between L1 and Ankyrins |
| 0.1 | 1.6 | REACTOME REGULATION OF GENE EXPRESSION IN BETA CELLS | Genes involved in Regulation of gene expression in beta cells |
| 0.1 | 1.4 | REACTOME METABOLISM OF STEROID HORMONES AND VITAMINS A AND D | Genes involved in Metabolism of steroid hormones and vitamins A and D |
| 0.1 | 4.1 | REACTOME INTERFERON GAMMA SIGNALING | Genes involved in Interferon gamma signaling |
| 0.1 | 1.1 | REACTOME REGULATION OF INSULIN SECRETION | Genes involved in Regulation of Insulin Secretion |
| 0.0 | 0.9 | REACTOME DOWNREGULATION OF ERBB2 ERBB3 SIGNALING | Genes involved in Downregulation of ERBB2:ERBB3 signaling |
| 0.0 | 2.7 | REACTOME NRAGE SIGNALS DEATH THROUGH JNK | Genes involved in NRAGE signals death through JNK |
| 0.0 | 2.1 | REACTOME ION TRANSPORT BY P TYPE ATPASES | Genes involved in Ion transport by P-type ATPases |
| 0.0 | 1.5 | REACTOME LIPOPROTEIN METABOLISM | Genes involved in Lipoprotein metabolism |
| 0.0 | 3.9 | REACTOME TRANSCRIPTIONAL REGULATION OF WHITE ADIPOCYTE DIFFERENTIATION | Genes involved in Transcriptional Regulation of White Adipocyte Differentiation |
| 0.0 | 1.5 | REACTOME TIGHT JUNCTION INTERACTIONS | Genes involved in Tight junction interactions |
| 0.0 | 0.7 | REACTOME PEROXISOMAL LIPID METABOLISM | Genes involved in Peroxisomal lipid metabolism |
| 0.0 | 0.7 | REACTOME PROLACTIN RECEPTOR SIGNALING | Genes involved in Prolactin receptor signaling |
| 0.0 | 0.6 | REACTOME PRESYNAPTIC NICOTINIC ACETYLCHOLINE RECEPTORS | Genes involved in Presynaptic nicotinic acetylcholine receptors |
| 0.0 | 1.0 | REACTOME CYTOSOLIC SULFONATION OF SMALL MOLECULES | Genes involved in Cytosolic sulfonation of small molecules |
| 0.0 | 1.0 | REACTOME CASPASE MEDIATED CLEAVAGE OF CYTOSKELETAL PROTEINS | Genes involved in Caspase-mediated cleavage of cytoskeletal proteins |
| 0.0 | 0.6 | REACTOME SYNTHESIS SECRETION AND INACTIVATION OF GLP1 | Genes involved in Synthesis, Secretion, and Inactivation of Glucagon-like Peptide-1 (GLP-1) |
| 0.0 | 0.5 | REACTOME APOPTOTIC CLEAVAGE OF CELL ADHESION PROTEINS | Genes involved in Apoptotic cleavage of cell adhesion proteins |
| 0.0 | 1.5 | REACTOME G1 PHASE | Genes involved in G1 Phase |
| 0.0 | 0.2 | REACTOME CTLA4 INHIBITORY SIGNALING | Genes involved in CTLA4 inhibitory signaling |
| 0.0 | 1.2 | REACTOME SIGNALING BY FGFR MUTANTS | Genes involved in Signaling by FGFR mutants |
| 0.0 | 1.3 | REACTOME PACKAGING OF TELOMERE ENDS | Genes involved in Packaging Of Telomere Ends |
| 0.0 | 0.8 | REACTOME ACTIVATED NOTCH1 TRANSMITS SIGNAL TO THE NUCLEUS | Genes involved in Activated NOTCH1 Transmits Signal to the Nucleus |
| 0.0 | 2.3 | REACTOME LOSS OF NLP FROM MITOTIC CENTROSOMES | Genes involved in Loss of Nlp from mitotic centrosomes |
| 0.0 | 0.6 | REACTOME ANTIGEN PRESENTATION FOLDING ASSEMBLY AND PEPTIDE LOADING OF CLASS I MHC | Genes involved in Antigen Presentation: Folding, assembly and peptide loading of class I MHC |
| 0.0 | 0.8 | REACTOME AMINO ACID TRANSPORT ACROSS THE PLASMA MEMBRANE | Genes involved in Amino acid transport across the plasma membrane |
| 0.0 | 0.7 | REACTOME SYNTHESIS OF PIPS AT THE PLASMA MEMBRANE | Genes involved in Synthesis of PIPs at the plasma membrane |
| 0.0 | 0.4 | REACTOME JNK C JUN KINASES PHOSPHORYLATION AND ACTIVATION MEDIATED BY ACTIVATED HUMAN TAK1 | Genes involved in JNK (c-Jun kinases) phosphorylation and activation mediated by activated human TAK1 |
| 0.0 | 0.2 | REACTOME TRYPTOPHAN CATABOLISM | Genes involved in Tryptophan catabolism |
| 0.0 | 0.7 | REACTOME VOLTAGE GATED POTASSIUM CHANNELS | Genes involved in Voltage gated Potassium channels |
| 0.0 | 0.5 | REACTOME OXYGEN DEPENDENT PROLINE HYDROXYLATION OF HYPOXIA INDUCIBLE FACTOR ALPHA | Genes involved in Oxygen-dependent Proline Hydroxylation of Hypoxia-inducible Factor Alpha |
| 0.0 | 0.3 | REACTOME NA CL DEPENDENT NEUROTRANSMITTER TRANSPORTERS | Genes involved in Na+/Cl- dependent neurotransmitter transporters |
| 0.0 | 0.3 | REACTOME RNA POL III TRANSCRIPTION TERMINATION | Genes involved in RNA Polymerase III Transcription Termination |
| 0.0 | 0.2 | REACTOME G0 AND EARLY G1 | Genes involved in G0 and Early G1 |
| 0.0 | 0.4 | REACTOME LYSOSOME VESICLE BIOGENESIS | Genes involved in Lysosome Vesicle Biogenesis |