Project
GNF SymAtlas + NCI-60 cancer cell lines, comparison of cancers vs non-cancers, human (Su, 2004; Ross, 2000)
Navigation
Downloads
Results for HOXA6
Z-value: 0.39
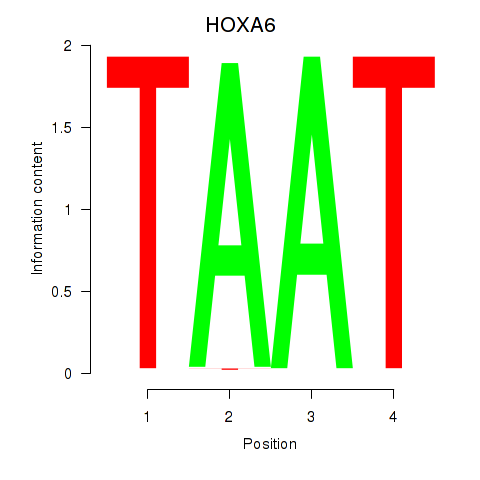
Motif logo
Transcription factors associated with HOXA6
| Gene Symbol | Gene ID | Gene Info |
|---|---|---|
|
HOXA6
|
ENSG00000106006.6 | homeobox A6 |
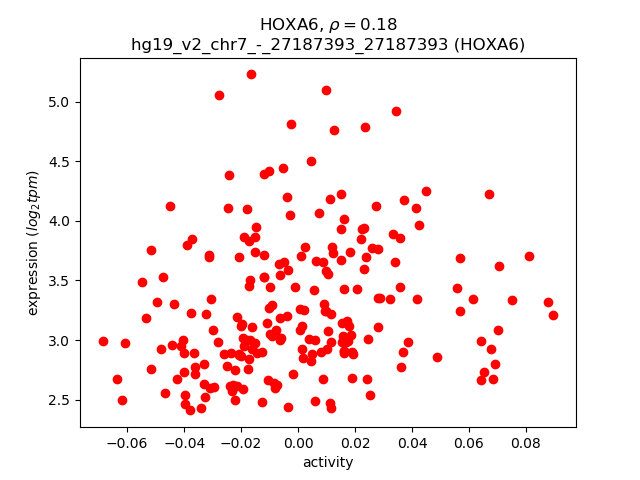
Activity-expression correlation:
| Gene | Promoter | Pearson corr. coef. | P-value | Plot |
|---|---|---|---|---|
| HOXA6 | hg19_v2_chr7_-_27187393_27187393 | 0.18 | 6.7e-03 | Click! |
Activity profile of HOXA6 motif
Sorted Z-values of HOXA6 motif
| Promoter | Log-likelihood | Transcript | Gene | Gene Info |
|---|---|---|---|---|
| chr12_-_91576561 | 13.56 |
ENST00000547568.2
ENST00000552962.1 |
DCN
|
decorin |
| chr4_-_41884620 | 13.32 |
ENST00000504870.1
|
LINC00682
|
long intergenic non-protein coding RNA 682 |
| chr12_-_91576429 | 12.56 |
ENST00000552145.1
ENST00000546745.1 |
DCN
|
decorin |
| chr12_-_91576750 | 12.02 |
ENST00000228329.5
ENST00000303320.3 ENST00000052754.5 |
DCN
|
decorin |
| chr10_-_21786179 | 7.18 |
ENST00000377113.5
|
CASC10
|
cancer susceptibility candidate 10 |
| chr3_-_114477787 | 5.43 |
ENST00000464560.1
|
ZBTB20
|
zinc finger and BTB domain containing 20 |
| chr2_+_66662690 | 4.89 |
ENST00000488550.1
|
MEIS1
|
Meis homeobox 1 |
| chr3_-_114477962 | 4.60 |
ENST00000471418.1
|
ZBTB20
|
zinc finger and BTB domain containing 20 |
| chr2_+_66662510 | 4.58 |
ENST00000272369.9
ENST00000407092.2 |
MEIS1
|
Meis homeobox 1 |
| chr7_-_27183263 | 4.46 |
ENST00000222726.3
|
HOXA5
|
homeobox A5 |
| chr15_+_93443419 | 4.33 |
ENST00000557381.1
ENST00000420239.2 |
CHD2
|
chromodomain helicase DNA binding protein 2 |
| chr3_-_114343039 | 4.04 |
ENST00000481632.1
|
ZBTB20
|
zinc finger and BTB domain containing 20 |
| chr12_-_13248705 | 3.86 |
ENST00000396310.2
|
GSG1
|
germ cell associated 1 |
| chr12_-_13248562 | 3.79 |
ENST00000457134.2
ENST00000537302.1 |
GSG1
|
germ cell associated 1 |
| chr14_-_92413727 | 3.75 |
ENST00000267620.10
|
FBLN5
|
fibulin 5 |
| chr12_-_24103954 | 3.54 |
ENST00000441133.2
ENST00000545921.1 |
SOX5
|
SRY (sex determining region Y)-box 5 |
| chr14_-_92413353 | 3.45 |
ENST00000556154.1
|
FBLN5
|
fibulin 5 |
| chr2_-_177502659 | 3.44 |
ENST00000295549.4
|
AC017048.3
|
long intergenic non-protein coding RNA 1116 |
| chr12_-_13248732 | 3.41 |
ENST00000396302.3
|
GSG1
|
germ cell associated 1 |
| chr18_-_52989217 | 3.22 |
ENST00000570287.2
|
TCF4
|
transcription factor 4 |
| chr17_-_39093672 | 3.06 |
ENST00000209718.3
ENST00000436344.3 ENST00000485751.1 |
KRT23
|
keratin 23 (histone deacetylase inducible) |
| chr11_-_8290263 | 2.99 |
ENST00000428101.2
|
LMO1
|
LIM domain only 1 (rhombotin 1) |
| chr5_-_1882858 | 2.97 |
ENST00000511126.1
ENST00000231357.2 |
IRX4
|
iroquois homeobox 4 |
| chr20_+_52105495 | 2.79 |
ENST00000439873.2
|
AL354993.1
|
Cell growth-inhibiting protein 7; HCG1784586; Uncharacterized protein |
| chr10_-_102989551 | 2.71 |
ENST00000370193.2
|
LBX1
|
ladybird homeobox 1 |
| chr12_-_102874416 | 2.70 |
ENST00000392904.1
ENST00000337514.6 |
IGF1
|
insulin-like growth factor 1 (somatomedin C) |
| chr15_-_70390191 | 2.67 |
ENST00000559191.1
|
TLE3
|
transducin-like enhancer of split 3 (E(sp1) homolog, Drosophila) |
| chr7_-_27205136 | 2.64 |
ENST00000396345.1
ENST00000343483.6 |
HOXA9
|
homeobox A9 |
| chr12_-_102874378 | 2.55 |
ENST00000456098.1
|
IGF1
|
insulin-like growth factor 1 (somatomedin C) |
| chr5_+_170736243 | 2.50 |
ENST00000296921.5
|
TLX3
|
T-cell leukemia homeobox 3 |
| chr5_-_160973649 | 2.47 |
ENST00000393959.1
ENST00000517547.1 |
GABRB2
|
gamma-aminobutyric acid (GABA) A receptor, beta 2 |
| chr4_+_74269956 | 2.42 |
ENST00000295897.4
ENST00000415165.2 ENST00000503124.1 ENST00000509063.1 ENST00000401494.3 |
ALB
|
albumin |
| chr11_-_84634217 | 2.37 |
ENST00000524982.1
|
DLG2
|
discs, large homolog 2 (Drosophila) |
| chrX_+_135279179 | 2.34 |
ENST00000370676.3
|
FHL1
|
four and a half LIM domains 1 |
| chr6_-_10412600 | 2.26 |
ENST00000379608.3
|
TFAP2A
|
transcription factor AP-2 alpha (activating enhancer binding protein 2 alpha) |
| chr11_-_8285405 | 2.20 |
ENST00000335790.3
ENST00000534484.1 |
LMO1
|
LIM domain only 1 (rhombotin 1) |
| chr5_+_66300446 | 2.18 |
ENST00000261569.7
|
MAST4
|
microtubule associated serine/threonine kinase family member 4 |
| chr5_-_115910091 | 2.15 |
ENST00000257414.8
|
SEMA6A
|
sema domain, transmembrane domain (TM), and cytoplasmic domain, (semaphorin) 6A |
| chr12_-_13248598 | 2.12 |
ENST00000337630.6
ENST00000545699.1 |
GSG1
|
germ cell associated 1 |
| chr18_-_52989525 | 2.10 |
ENST00000457482.3
|
TCF4
|
transcription factor 4 |
| chr7_+_28452130 | 2.08 |
ENST00000357727.2
|
CREB5
|
cAMP responsive element binding protein 5 |
| chr15_+_96876340 | 2.01 |
ENST00000453270.2
|
NR2F2
|
nuclear receptor subfamily 2, group F, member 2 |
| chr14_+_22977587 | 2.01 |
ENST00000390504.1
|
TRAJ33
|
T cell receptor alpha joining 33 |
| chr7_+_107110488 | 1.97 |
ENST00000304402.4
|
GPR22
|
G protein-coupled receptor 22 |
| chr15_+_34261089 | 1.92 |
ENST00000383263.5
|
CHRM5
|
cholinergic receptor, muscarinic 5 |
| chr7_-_31380502 | 1.80 |
ENST00000297142.3
|
NEUROD6
|
neuronal differentiation 6 |
| chr11_+_128563652 | 1.76 |
ENST00000527786.2
|
FLI1
|
Fli-1 proto-oncogene, ETS transcription factor |
| chr10_+_115312766 | 1.75 |
ENST00000351270.3
|
HABP2
|
hyaluronan binding protein 2 |
| chr12_-_102874330 | 1.69 |
ENST00000307046.8
|
IGF1
|
insulin-like growth factor 1 (somatomedin C) |
| chrX_+_135251835 | 1.69 |
ENST00000456445.1
|
FHL1
|
four and a half LIM domains 1 |
| chr14_-_24551137 | 1.69 |
ENST00000396995.1
|
NRL
|
neural retina leucine zipper |
| chr7_+_129015484 | 1.68 |
ENST00000490911.1
|
AHCYL2
|
adenosylhomocysteinase-like 2 |
| chr4_+_55095264 | 1.68 |
ENST00000257290.5
|
PDGFRA
|
platelet-derived growth factor receptor, alpha polypeptide |
| chr7_-_25268104 | 1.65 |
ENST00000222674.2
|
NPVF
|
neuropeptide VF precursor |
| chr12_-_102874102 | 1.61 |
ENST00000392905.2
|
IGF1
|
insulin-like growth factor 1 (somatomedin C) |
| chr3_+_69985792 | 1.58 |
ENST00000531774.1
|
MITF
|
microphthalmia-associated transcription factor |
| chr14_-_24551195 | 1.58 |
ENST00000560550.1
|
NRL
|
neural retina leucine zipper |
| chr14_-_69261310 | 1.58 |
ENST00000336440.3
|
ZFP36L1
|
ZFP36 ring finger protein-like 1 |
| chr15_+_58430368 | 1.50 |
ENST00000558772.1
ENST00000219919.4 |
AQP9
|
aquaporin 9 |
| chr6_-_32157947 | 1.50 |
ENST00000375050.4
|
PBX2
|
pre-B-cell leukemia homeobox 2 |
| chr17_-_46671323 | 1.49 |
ENST00000239151.5
|
HOXB5
|
homeobox B5 |
| chr1_-_216896780 | 1.42 |
ENST00000459955.1
ENST00000366937.1 ENST00000408911.3 ENST00000391890.3 |
ESRRG
|
estrogen-related receptor gamma |
| chr8_-_87755878 | 1.41 |
ENST00000320005.5
|
CNGB3
|
cyclic nucleotide gated channel beta 3 |
| chr9_-_124989804 | 1.40 |
ENST00000373755.2
ENST00000373754.2 |
LHX6
|
LIM homeobox 6 |
| chr15_+_58430567 | 1.38 |
ENST00000536493.1
|
AQP9
|
aquaporin 9 |
| chr6_+_45296048 | 1.36 |
ENST00000465038.2
ENST00000352853.5 ENST00000541979.1 ENST00000371438.1 |
RUNX2
|
runt-related transcription factor 2 |
| chr7_-_115670792 | 1.35 |
ENST00000265440.7
ENST00000393485.1 |
TFEC
|
transcription factor EC |
| chr14_+_61654271 | 1.29 |
ENST00000555185.1
ENST00000557294.1 ENST00000556778.1 |
PRKCH
|
protein kinase C, eta |
| chr2_-_77749474 | 1.28 |
ENST00000409093.1
ENST00000409088.3 |
LRRTM4
|
leucine rich repeat transmembrane neuronal 4 |
| chr8_-_133123406 | 1.27 |
ENST00000434736.2
|
HHLA1
|
HERV-H LTR-associating 1 |
| chr10_-_33623310 | 1.24 |
ENST00000395995.1
ENST00000374823.5 ENST00000374821.5 ENST00000374816.3 |
NRP1
|
neuropilin 1 |
| chr12_+_81110684 | 1.23 |
ENST00000228644.3
|
MYF5
|
myogenic factor 5 |
| chrX_+_135251783 | 1.23 |
ENST00000394153.2
|
FHL1
|
four and a half LIM domains 1 |
| chr17_-_10421853 | 1.20 |
ENST00000226207.5
|
MYH1
|
myosin, heavy chain 1, skeletal muscle, adult |
| chr9_+_2717502 | 1.20 |
ENST00000382082.3
|
KCNV2
|
potassium channel, subfamily V, member 2 |
| chr21_-_31538971 | 1.20 |
ENST00000286808.3
|
CLDN17
|
claudin 17 |
| chr5_+_59783941 | 1.19 |
ENST00000506884.1
ENST00000504876.2 |
PART1
|
prostate androgen-regulated transcript 1 (non-protein coding) |
| chr3_-_62359180 | 1.17 |
ENST00000283268.3
|
FEZF2
|
FEZ family zinc finger 2 |
| chr17_-_10452929 | 1.16 |
ENST00000532183.2
ENST00000397183.2 ENST00000420805.1 |
MYH2
|
myosin, heavy chain 2, skeletal muscle, adult |
| chr2_-_183291741 | 1.15 |
ENST00000351439.5
ENST00000409365.1 |
PDE1A
|
phosphodiesterase 1A, calmodulin-dependent |
| chr6_-_22297730 | 1.14 |
ENST00000306482.1
|
PRL
|
prolactin |
| chr7_-_112727774 | 1.14 |
ENST00000297146.3
ENST00000501255.2 |
GPR85
|
G protein-coupled receptor 85 |
| chr7_-_115670804 | 1.14 |
ENST00000320239.7
|
TFEC
|
transcription factor EC |
| chrX_+_9431324 | 1.13 |
ENST00000407597.2
ENST00000424279.1 ENST00000536365.1 ENST00000441088.1 ENST00000380961.1 ENST00000415293.1 |
TBL1X
|
transducin (beta)-like 1X-linked |
| chr4_-_72649763 | 1.12 |
ENST00000513476.1
|
GC
|
group-specific component (vitamin D binding protein) |
| chr9_-_124990680 | 1.12 |
ENST00000541397.2
ENST00000560485.1 |
LHX6
|
LIM homeobox 6 |
| chr7_+_39017504 | 1.10 |
ENST00000403058.1
|
POU6F2
|
POU class 6 homeobox 2 |
| chr1_-_217250231 | 1.10 |
ENST00000493748.1
ENST00000463665.1 |
ESRRG
|
estrogen-related receptor gamma |
| chr4_+_96012614 | 1.09 |
ENST00000264568.4
|
BMPR1B
|
bone morphogenetic protein receptor, type IB |
| chr9_-_123812542 | 1.08 |
ENST00000223642.1
|
C5
|
complement component 5 |
| chr6_-_136847099 | 1.07 |
ENST00000438100.2
|
MAP7
|
microtubule-associated protein 7 |
| chr16_+_89334512 | 1.07 |
ENST00000602042.1
|
AC137932.1
|
AC137932.1 |
| chr3_+_69985734 | 1.06 |
ENST00000314557.6
ENST00000394351.3 |
MITF
|
microphthalmia-associated transcription factor |
| chr6_+_136172820 | 1.06 |
ENST00000308191.6
|
PDE7B
|
phosphodiesterase 7B |
| chr17_-_26220366 | 1.06 |
ENST00000460380.2
ENST00000508862.1 ENST00000379102.3 ENST00000582441.1 |
LYRM9
RP1-66C13.4
|
LYR motif containing 9 Uncharacterized protein |
| chr18_-_53177984 | 1.05 |
ENST00000543082.1
|
TCF4
|
transcription factor 4 |
| chr17_-_46692287 | 1.05 |
ENST00000239144.4
|
HOXB8
|
homeobox B8 |
| chr3_-_54962100 | 1.05 |
ENST00000273286.5
|
LRTM1
|
leucine-rich repeats and transmembrane domains 1 |
| chr2_+_162272605 | 1.05 |
ENST00000389554.3
|
TBR1
|
T-box, brain, 1 |
| chr8_-_70745575 | 1.01 |
ENST00000524945.1
|
SLCO5A1
|
solute carrier organic anion transporter family, member 5A1 |
| chr13_-_36050819 | 1.00 |
ENST00000379919.4
|
MAB21L1
|
mab-21-like 1 (C. elegans) |
| chr5_-_59783882 | 0.98 |
ENST00000505507.2
ENST00000502484.2 |
PDE4D
|
phosphodiesterase 4D, cAMP-specific |
| chr2_+_176987088 | 0.98 |
ENST00000249499.6
|
HOXD9
|
homeobox D9 |
| chr12_-_102591604 | 0.97 |
ENST00000329406.4
|
PMCH
|
pro-melanin-concentrating hormone |
| chr4_+_88720698 | 0.95 |
ENST00000226284.5
|
IBSP
|
integrin-binding sialoprotein |
| chr15_-_70390213 | 0.94 |
ENST00000557997.1
ENST00000317509.8 ENST00000442299.2 |
TLE3
|
transducin-like enhancer of split 3 (E(sp1) homolog, Drosophila) |
| chr15_+_48498480 | 0.93 |
ENST00000380993.3
ENST00000396577.3 |
SLC12A1
|
solute carrier family 12 (sodium/potassium/chloride transporter), member 1 |
| chrX_+_135252050 | 0.93 |
ENST00000449474.1
ENST00000345434.3 |
FHL1
|
four and a half LIM domains 1 |
| chr5_+_59783540 | 0.92 |
ENST00000515734.2
|
PART1
|
prostate androgen-regulated transcript 1 (non-protein coding) |
| chr15_+_96869165 | 0.91 |
ENST00000421109.2
|
NR2F2
|
nuclear receptor subfamily 2, group F, member 2 |
| chr18_+_32073253 | 0.91 |
ENST00000283365.9
ENST00000596745.1 ENST00000315456.6 |
DTNA
|
dystrobrevin, alpha |
| chr1_+_62439037 | 0.91 |
ENST00000545929.1
|
INADL
|
InaD-like (Drosophila) |
| chr3_+_1134260 | 0.88 |
ENST00000446702.2
ENST00000539053.1 ENST00000350110.2 |
CNTN6
|
contactin 6 |
| chr6_-_10415218 | 0.86 |
ENST00000466073.1
ENST00000498450.1 |
TFAP2A
|
transcription factor AP-2 alpha (activating enhancer binding protein 2 alpha) |
| chr17_-_10372875 | 0.85 |
ENST00000255381.2
|
MYH4
|
myosin, heavy chain 4, skeletal muscle |
| chr6_+_108487245 | 0.83 |
ENST00000368986.4
|
NR2E1
|
nuclear receptor subfamily 2, group E, member 1 |
| chr18_-_53070913 | 0.81 |
ENST00000568186.1
ENST00000564228.1 |
TCF4
|
transcription factor 4 |
| chrX_+_11311533 | 0.79 |
ENST00000380714.3
ENST00000380712.3 ENST00000348912.4 |
AMELX
|
amelogenin, X-linked |
| chr5_-_24645078 | 0.78 |
ENST00000264463.4
|
CDH10
|
cadherin 10, type 2 (T2-cadherin) |
| chr11_-_36619771 | 0.77 |
ENST00000311485.3
ENST00000527033.1 ENST00000532616.1 |
RAG2
|
recombination activating gene 2 |
| chr2_+_166428839 | 0.77 |
ENST00000342316.4
|
CSRNP3
|
cysteine-serine-rich nuclear protein 3 |
| chr6_+_45296391 | 0.77 |
ENST00000371436.6
ENST00000576263.1 |
RUNX2
|
runt-related transcription factor 2 |
| chr12_-_14133053 | 0.74 |
ENST00000609686.1
|
GRIN2B
|
glutamate receptor, ionotropic, N-methyl D-aspartate 2B |
| chr4_+_100495864 | 0.74 |
ENST00000265517.5
ENST00000422897.2 |
MTTP
|
microsomal triglyceride transfer protein |
| chr3_+_69812877 | 0.74 |
ENST00000457080.1
ENST00000328528.6 |
MITF
|
microphthalmia-associated transcription factor |
| chr2_-_161056762 | 0.73 |
ENST00000428609.2
ENST00000409967.2 |
ITGB6
|
integrin, beta 6 |
| chr14_-_37051798 | 0.72 |
ENST00000258829.5
|
NKX2-8
|
NK2 homeobox 8 |
| chr2_+_28618532 | 0.72 |
ENST00000545753.1
|
FOSL2
|
FOS-like antigen 2 |
| chr11_-_84634447 | 0.71 |
ENST00000532653.1
|
DLG2
|
discs, large homolog 2 (Drosophila) |
| chr4_-_116034979 | 0.71 |
ENST00000264363.2
|
NDST4
|
N-deacetylase/N-sulfotransferase (heparan glucosaminyl) 4 |
| chr5_-_58882219 | 0.70 |
ENST00000505453.1
ENST00000360047.5 |
PDE4D
|
phosphodiesterase 4D, cAMP-specific |
| chr5_+_161494521 | 0.69 |
ENST00000356592.3
|
GABRG2
|
gamma-aminobutyric acid (GABA) A receptor, gamma 2 |
| chr13_-_99667960 | 0.69 |
ENST00000448493.2
|
DOCK9
|
dedicator of cytokinesis 9 |
| chr14_-_98444386 | 0.68 |
ENST00000556462.1
ENST00000556138.1 |
C14orf64
|
chromosome 14 open reading frame 64 |
| chr6_-_76782371 | 0.66 |
ENST00000369950.3
ENST00000369963.3 |
IMPG1
|
interphotoreceptor matrix proteoglycan 1 |
| chr7_+_134576151 | 0.64 |
ENST00000393118.2
|
CALD1
|
caldesmon 1 |
| chr18_-_53089723 | 0.63 |
ENST00000561992.1
ENST00000562512.2 |
TCF4
|
transcription factor 4 |
| chr12_-_86650045 | 0.63 |
ENST00000604798.1
|
MGAT4C
|
mannosyl (alpha-1,3-)-glycoprotein beta-1,4-N-acetylglucosaminyltransferase, isozyme C (putative) |
| chr12_+_41831485 | 0.62 |
ENST00000539469.2
ENST00000298919.7 |
PDZRN4
|
PDZ domain containing ring finger 4 |
| chr17_-_46608272 | 0.62 |
ENST00000577092.1
ENST00000239174.6 |
HOXB1
|
homeobox B1 |
| chr5_-_58295712 | 0.62 |
ENST00000317118.8
|
PDE4D
|
phosphodiesterase 4D, cAMP-specific |
| chr2_+_171034646 | 0.61 |
ENST00000409044.3
ENST00000408978.4 |
MYO3B
|
myosin IIIB |
| chr3_+_69928256 | 0.60 |
ENST00000394355.2
|
MITF
|
microphthalmia-associated transcription factor |
| chr9_+_82186872 | 0.58 |
ENST00000376544.3
ENST00000376520.4 |
TLE4
|
transducin-like enhancer of split 4 (E(sp1) homolog, Drosophila) |
| chr3_-_65583561 | 0.56 |
ENST00000460329.2
|
MAGI1
|
membrane associated guanylate kinase, WW and PDZ domain containing 1 |
| chr15_+_71839566 | 0.56 |
ENST00000357769.4
|
THSD4
|
thrombospondin, type I, domain containing 4 |
| chrX_+_16668278 | 0.56 |
ENST00000380200.3
|
S100G
|
S100 calcium binding protein G |
| chr17_-_46682321 | 0.55 |
ENST00000225648.3
ENST00000484302.2 |
HOXB6
|
homeobox B6 |
| chr1_+_12538594 | 0.54 |
ENST00000543710.1
|
VPS13D
|
vacuolar protein sorting 13 homolog D (S. cerevisiae) |
| chr3_-_57233966 | 0.54 |
ENST00000473921.1
ENST00000295934.3 |
HESX1
|
HESX homeobox 1 |
| chr1_+_186265399 | 0.52 |
ENST00000367486.3
ENST00000367484.3 ENST00000533951.1 ENST00000367482.4 ENST00000367483.4 ENST00000367485.4 ENST00000445192.2 |
PRG4
|
proteoglycan 4 |
| chr5_+_161494770 | 0.52 |
ENST00000414552.2
ENST00000361925.4 |
GABRG2
|
gamma-aminobutyric acid (GABA) A receptor, gamma 2 |
| chr12_-_117319236 | 0.49 |
ENST00000257572.5
|
HRK
|
harakiri, BCL2 interacting protein (contains only BH3 domain) |
| chr14_-_54423529 | 0.47 |
ENST00000245451.4
ENST00000559087.1 |
BMP4
|
bone morphogenetic protein 4 |
| chr1_-_116383322 | 0.47 |
ENST00000429731.1
|
NHLH2
|
nescient helix loop helix 2 |
| chr15_+_58724184 | 0.46 |
ENST00000433326.2
|
LIPC
|
lipase, hepatic |
| chr9_-_20622478 | 0.45 |
ENST00000355930.6
ENST00000380338.4 |
MLLT3
|
myeloid/lymphoid or mixed-lineage leukemia (trithorax homolog, Drosophila); translocated to, 3 |
| chr7_+_134576317 | 0.45 |
ENST00000424922.1
ENST00000495522.1 |
CALD1
|
caldesmon 1 |
| chr2_+_33359687 | 0.44 |
ENST00000402934.1
ENST00000404525.1 ENST00000407925.1 |
LTBP1
|
latent transforming growth factor beta binding protein 1 |
| chr2_-_233641265 | 0.43 |
ENST00000438786.1
ENST00000409779.1 ENST00000233826.3 |
KCNJ13
|
potassium inwardly-rectifying channel, subfamily J, member 13 |
| chr3_+_69812701 | 0.43 |
ENST00000472437.1
|
MITF
|
microphthalmia-associated transcription factor |
| chr8_-_93107827 | 0.42 |
ENST00000520724.1
ENST00000518844.1 |
RUNX1T1
|
runt-related transcription factor 1; translocated to, 1 (cyclin D-related) |
| chr1_-_53608289 | 0.42 |
ENST00000371491.4
|
SLC1A7
|
solute carrier family 1 (glutamate transporter), member 7 |
| chr11_+_128562372 | 0.42 |
ENST00000344954.6
|
FLI1
|
Fli-1 proto-oncogene, ETS transcription factor |
| chr12_-_16761007 | 0.41 |
ENST00000354662.1
ENST00000441439.2 |
LMO3
|
LIM domain only 3 (rhombotin-like 2) |
| chr5_+_174151536 | 0.40 |
ENST00000239243.6
ENST00000507785.1 |
MSX2
|
msh homeobox 2 |
| chr21_-_40033618 | 0.40 |
ENST00000417133.2
ENST00000398910.1 ENST00000442448.1 |
ERG
|
v-ets avian erythroblastosis virus E26 oncogene homolog |
| chr7_+_134464376 | 0.39 |
ENST00000454108.1
ENST00000361675.2 |
CALD1
|
caldesmon 1 |
| chr9_-_14722715 | 0.38 |
ENST00000380911.3
|
CER1
|
cerberus 1, DAN family BMP antagonist |
| chr12_-_99548524 | 0.38 |
ENST00000549558.2
ENST00000550693.2 ENST00000549493.2 |
ANKS1B
|
ankyrin repeat and sterile alpha motif domain containing 1B |
| chr2_+_33359646 | 0.36 |
ENST00000390003.4
ENST00000418533.2 |
LTBP1
|
latent transforming growth factor beta binding protein 1 |
| chr8_-_25281747 | 0.36 |
ENST00000421054.2
|
GNRH1
|
gonadotropin-releasing hormone 1 (luteinizing-releasing hormone) |
| chr1_-_53608249 | 0.36 |
ENST00000371494.4
|
SLC1A7
|
solute carrier family 1 (glutamate transporter), member 7 |
| chr1_-_203055129 | 0.36 |
ENST00000241651.4
|
MYOG
|
myogenin (myogenic factor 4) |
| chr6_-_136847610 | 0.35 |
ENST00000454590.1
ENST00000432797.2 |
MAP7
|
microtubule-associated protein 7 |
| chr18_+_59000815 | 0.35 |
ENST00000262717.4
|
CDH20
|
cadherin 20, type 2 |
| chr2_+_226265364 | 0.32 |
ENST00000272907.6
|
NYAP2
|
neuronal tyrosine-phosphorylated phosphoinositide-3-kinase adaptor 2 |
| chr17_-_38859996 | 0.32 |
ENST00000264651.2
|
KRT24
|
keratin 24 |
| chr2_+_210444142 | 0.31 |
ENST00000360351.4
ENST00000361559.4 |
MAP2
|
microtubule-associated protein 2 |
| chr12_-_117799446 | 0.28 |
ENST00000317775.6
ENST00000344089.3 |
NOS1
|
nitric oxide synthase 1 (neuronal) |
| chr5_+_161112563 | 0.28 |
ENST00000274545.5
|
GABRA6
|
gamma-aminobutyric acid (GABA) A receptor, alpha 6 |
| chr5_-_27038683 | 0.28 |
ENST00000511822.1
ENST00000231021.4 |
CDH9
|
cadherin 9, type 2 (T1-cadherin) |
| chr8_-_42234745 | 0.28 |
ENST00000220812.2
|
DKK4
|
dickkopf WNT signaling pathway inhibitor 4 |
| chr17_-_47045949 | 0.24 |
ENST00000357424.2
|
GIP
|
gastric inhibitory polypeptide |
| chr1_+_168250194 | 0.24 |
ENST00000367821.3
|
TBX19
|
T-box 19 |
| chr7_-_27142290 | 0.23 |
ENST00000222718.5
|
HOXA2
|
homeobox A2 |
| chr5_+_145718587 | 0.22 |
ENST00000230732.4
|
POU4F3
|
POU class 4 homeobox 3 |
| chr18_+_32173276 | 0.21 |
ENST00000591816.1
ENST00000588125.1 ENST00000598334.1 ENST00000588684.1 ENST00000554864.3 ENST00000399121.5 ENST00000595022.1 ENST00000269190.7 ENST00000399097.3 |
DTNA
|
dystrobrevin, alpha |
| chr12_-_86650077 | 0.21 |
ENST00000552808.2
ENST00000547225.1 |
MGAT4C
|
mannosyl (alpha-1,3-)-glycoprotein beta-1,4-N-acetylglucosaminyltransferase, isozyme C (putative) |
| chr4_-_111563076 | 0.21 |
ENST00000354925.2
ENST00000511990.1 |
PITX2
|
paired-like homeodomain 2 |
| chrY_-_6742068 | 0.20 |
ENST00000215479.5
|
AMELY
|
amelogenin, Y-linked |
| chr8_-_93107443 | 0.19 |
ENST00000360348.2
ENST00000520428.1 ENST00000518992.1 ENST00000520556.1 ENST00000518317.1 ENST00000521319.1 ENST00000521375.1 ENST00000518449.1 |
RUNX1T1
|
runt-related transcription factor 1; translocated to, 1 (cyclin D-related) |
| chr11_+_123396528 | 0.19 |
ENST00000322282.7
ENST00000529750.1 |
GRAMD1B
|
GRAM domain containing 1B |
| chr5_-_34043310 | 0.18 |
ENST00000231338.7
|
C1QTNF3
|
C1q and tumor necrosis factor related protein 3 |
| chr11_+_120971882 | 0.17 |
ENST00000392793.1
|
TECTA
|
tectorin alpha |
| chr17_-_39623681 | 0.15 |
ENST00000225899.3
|
KRT32
|
keratin 32 |
| chr12_-_91398796 | 0.14 |
ENST00000261172.3
ENST00000551767.1 |
EPYC
|
epiphycan |
| chr5_+_140710061 | 0.13 |
ENST00000517417.1
ENST00000378105.3 |
PCDHGA1
|
protocadherin gamma subfamily A, 1 |
| chr9_-_13165457 | 0.13 |
ENST00000542239.1
ENST00000538841.1 ENST00000433359.2 |
MPDZ
|
multiple PDZ domain protein |
| chr12_-_53994805 | 0.13 |
ENST00000328463.7
|
ATF7
|
activating transcription factor 7 |
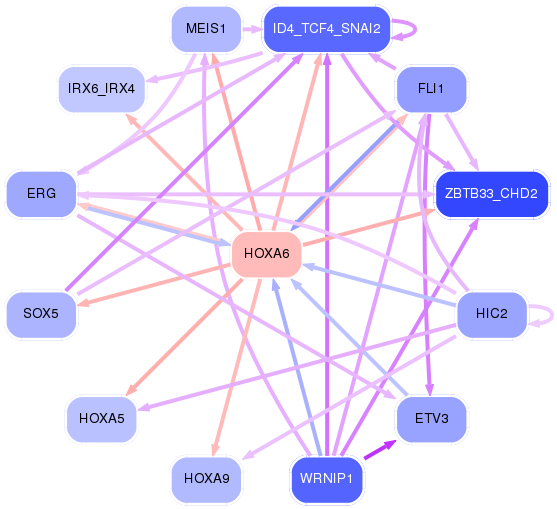
Network of associatons between targets according to the STRING database.

First level regulatory network of HOXA6
Gene Ontology Analysis
Gene overrepresentation in biological_process category:
| Log-likelihood per target | Total log-likelihood | Term | Description |
|---|---|---|---|
| 3.2 | 38.1 | GO:1900747 | negative regulation of vascular endothelial growth factor signaling pathway(GO:1900747) |
| 1.7 | 8.6 | GO:1904075 | trophectodermal cell proliferation(GO:0001834) regulation of trophectodermal cell proliferation(GO:1904073) positive regulation of trophectodermal cell proliferation(GO:1904075) |
| 1.5 | 4.5 | GO:0060535 | trachea cartilage morphogenesis(GO:0060535) |
| 1.3 | 5.1 | GO:0046013 | regulation of T cell homeostatic proliferation(GO:0046013) |
| 0.8 | 3.3 | GO:0045872 | positive regulation of rhodopsin gene expression(GO:0045872) |
| 0.8 | 2.4 | GO:0052331 | hemolysis by symbiont of host erythrocytes(GO:0019836) hemolysis in other organism(GO:0044179) hemolysis in other organism involved in symbiotic interaction(GO:0052331) |
| 0.7 | 2.9 | GO:0009956 | radial pattern formation(GO:0009956) |
| 0.6 | 7.8 | GO:0048251 | elastic fiber assembly(GO:0048251) |
| 0.6 | 2.5 | GO:0003409 | optic cup structural organization(GO:0003409) |
| 0.6 | 3.5 | GO:0055059 | asymmetric neuroblast division(GO:0055059) |
| 0.6 | 2.9 | GO:0015722 | canalicular bile acid transport(GO:0015722) pyrimidine nucleobase transport(GO:0015855) urea transmembrane transport(GO:0071918) purine nucleobase transmembrane transport(GO:1904823) |
| 0.6 | 1.7 | GO:0072276 | metanephric glomerulus morphogenesis(GO:0072275) metanephric glomerulus vasculature morphogenesis(GO:0072276) metanephric glomerular capillary formation(GO:0072277) |
| 0.6 | 1.1 | GO:0048867 | stem cell fate determination(GO:0048867) |
| 0.5 | 11.6 | GO:0035855 | megakaryocyte development(GO:0035855) |
| 0.5 | 1.6 | GO:0048382 | mesendoderm development(GO:0048382) |
| 0.4 | 2.2 | GO:2001224 | positive regulation of neuron migration(GO:2001224) |
| 0.4 | 0.8 | GO:0060164 | regulation of timing of neuron differentiation(GO:0060164) |
| 0.4 | 0.8 | GO:0070172 | positive regulation of tooth mineralization(GO:0070172) |
| 0.4 | 3.9 | GO:0048664 | neuron fate determination(GO:0048664) |
| 0.4 | 1.9 | GO:0007197 | adenylate cyclase-inhibiting G-protein coupled acetylcholine receptor signaling pathway(GO:0007197) |
| 0.4 | 1.1 | GO:0010760 | negative regulation of macrophage chemotaxis(GO:0010760) |
| 0.3 | 2.5 | GO:1904936 | cerebral cortex GABAergic interneuron migration(GO:0021853) interneuron migration(GO:1904936) |
| 0.3 | 0.3 | GO:0098923 | retrograde trans-synaptic signaling by soluble gas(GO:0098923) trans-synaptic signaling by soluble gas(GO:0099543) |
| 0.3 | 2.1 | GO:0002051 | osteoblast fate commitment(GO:0002051) |
| 0.3 | 14.1 | GO:0032728 | positive regulation of interferon-beta production(GO:0032728) |
| 0.3 | 2.3 | GO:0086024 | adrenergic receptor signaling pathway involved in positive regulation of heart rate(GO:0086024) |
| 0.2 | 1.2 | GO:0061552 | vestibulocochlear nerve structural organization(GO:0021649) positive regulation of cytokine activity(GO:0060301) ganglion morphogenesis(GO:0061552) endothelial tip cell fate specification(GO:0097102) VEGF-activated neuropilin signaling pathway involved in axon guidance(GO:1902378) dorsal root ganglion morphogenesis(GO:1904835) otic placode development(GO:1905040) |
| 0.2 | 1.7 | GO:0033353 | S-adenosylmethionine cycle(GO:0033353) |
| 0.2 | 0.2 | GO:0035283 | central nervous system segmentation(GO:0035283) brain segmentation(GO:0035284) |
| 0.2 | 2.6 | GO:0042118 | endothelial cell activation(GO:0042118) |
| 0.2 | 1.1 | GO:0001550 | ovarian cumulus expansion(GO:0001550) fused antrum stage(GO:0048165) |
| 0.2 | 1.0 | GO:0021764 | amygdala development(GO:0021764) |
| 0.2 | 0.6 | GO:0021571 | rhombomere 5 development(GO:0021571) |
| 0.2 | 0.8 | GO:0002331 | pre-B cell differentiation(GO:0002329) pre-B cell allelic exclusion(GO:0002331) |
| 0.2 | 1.3 | GO:0050861 | positive regulation of B cell receptor signaling pathway(GO:0050861) |
| 0.2 | 0.5 | GO:0061150 | apoptotic process involved in endocardial cushion morphogenesis(GO:0003277) intermediate mesoderm development(GO:0048389) intermediate mesoderm morphogenesis(GO:0048390) intermediate mesoderm formation(GO:0048391) intermediate mesodermal cell differentiation(GO:0048392) regulation of cardiac muscle fiber development(GO:0055018) positive regulation of cardiac muscle fiber development(GO:0055020) bud dilation involved in lung branching(GO:0060503) regulation of transcription from RNA polymerase II promoter involved in kidney development(GO:0060994) BMP signaling pathway involved in ureter morphogenesis(GO:0061149) renal system segmentation(GO:0061150) BMP signaling pathway involved in renal system segmentation(GO:0061151) pulmonary artery endothelial tube morphogenesis(GO:0061155) regulation of transcription from RNA polymerase II promoter involved in mesonephros development(GO:0061216) pattern specification involved in mesonephros development(GO:0061227) BMP signaling pathway involved in nephric duct formation(GO:0071893) negative regulation of branch elongation involved in ureteric bud branching(GO:0072096) negative regulation of branch elongation involved in ureteric bud branching by BMP signaling pathway(GO:0072097) anterior/posterior pattern specification involved in kidney development(GO:0072098) anterior/posterior pattern specification involved in ureteric bud development(GO:0072099) specification of ureteric bud anterior/posterior symmetry(GO:0072100) specification of ureteric bud anterior/posterior symmetry by BMP signaling pathway(GO:0072101) ureter epithelial cell differentiation(GO:0072192) negative regulation of mesenchymal cell proliferation involved in ureter development(GO:0072200) positive regulation of cell proliferation involved in outflow tract morphogenesis(GO:1901964) cardiac jelly development(GO:1905072) regulation of metanephric S-shaped body morphogenesis(GO:2000004) negative regulation of metanephric S-shaped body morphogenesis(GO:2000005) regulation of metanephric comma-shaped body morphogenesis(GO:2000006) negative regulation of metanephric comma-shaped body morphogenesis(GO:2000007) |
| 0.2 | 1.7 | GO:0048743 | positive regulation of skeletal muscle fiber development(GO:0048743) |
| 0.1 | 2.8 | GO:0071420 | cellular response to histamine(GO:0071420) |
| 0.1 | 0.4 | GO:0051795 | positive regulation of catagen(GO:0051795) BMP signaling pathway involved in heart development(GO:0061312) activation of meiosis(GO:0090427) |
| 0.1 | 3.1 | GO:0097120 | receptor localization to synapse(GO:0097120) |
| 0.1 | 0.4 | GO:1900383 | regulation of synaptic plasticity by receptor localization to synapse(GO:1900383) |
| 0.1 | 0.4 | GO:1990637 | response to prolactin(GO:1990637) |
| 0.1 | 0.9 | GO:0032277 | negative regulation of gonadotropin secretion(GO:0032277) |
| 0.1 | 6.2 | GO:0043268 | positive regulation of potassium ion transport(GO:0043268) |
| 0.1 | 1.9 | GO:0002087 | regulation of respiratory gaseous exchange by neurological system process(GO:0002087) |
| 0.1 | 0.4 | GO:2000504 | positive regulation of blood vessel remodeling(GO:2000504) |
| 0.1 | 1.2 | GO:0071692 | protein localization to extracellular region(GO:0071692) maintenance of protein location in extracellular region(GO:0071694) |
| 0.1 | 1.2 | GO:0001778 | plasma membrane repair(GO:0001778) |
| 0.1 | 4.4 | GO:2000144 | positive regulation of DNA-templated transcription, initiation(GO:2000144) |
| 0.1 | 2.5 | GO:0009954 | proximal/distal pattern formation(GO:0009954) |
| 0.1 | 4.2 | GO:1904837 | beta-catenin-TCF complex assembly(GO:1904837) |
| 0.1 | 0.7 | GO:0038044 | transforming growth factor-beta secretion(GO:0038044) |
| 0.1 | 0.2 | GO:0035993 | deltoid tuberosity development(GO:0035993) |
| 0.1 | 1.1 | GO:0046069 | cGMP catabolic process(GO:0046069) |
| 0.1 | 0.1 | GO:1903375 | cerebral cortex tangential migration using cell-axon interactions(GO:0021824) gonadotrophin-releasing hormone neuronal migration to the hypothalamus(GO:0021828) hypothalamic tangential migration using cell-axon interactions(GO:0021856) facioacoustic ganglion development(GO:1903375) |
| 0.1 | 0.7 | GO:0034197 | acylglycerol transport(GO:0034196) triglyceride transport(GO:0034197) |
| 0.1 | 0.7 | GO:0030210 | heparin metabolic process(GO:0030202) heparin biosynthetic process(GO:0030210) |
| 0.1 | 0.3 | GO:0051799 | negative regulation of hair follicle development(GO:0051799) |
| 0.1 | 1.0 | GO:0021542 | dentate gyrus development(GO:0021542) |
| 0.0 | 0.2 | GO:0070091 | glucagon secretion(GO:0070091) regulation of glucagon secretion(GO:0070092) |
| 0.0 | 0.5 | GO:0030916 | otic vesicle formation(GO:0030916) |
| 0.0 | 1.1 | GO:0006198 | cAMP catabolic process(GO:0006198) |
| 0.0 | 4.3 | GO:0032508 | DNA duplex unwinding(GO:0032508) |
| 0.0 | 1.1 | GO:0060397 | JAK-STAT cascade involved in growth hormone signaling pathway(GO:0060397) |
| 0.0 | 2.3 | GO:0046426 | negative regulation of JAK-STAT cascade(GO:0046426) negative regulation of STAT cascade(GO:1904893) |
| 0.0 | 1.0 | GO:0008284 | positive regulation of cell proliferation(GO:0008284) |
| 0.0 | 0.2 | GO:0071638 | negative regulation of monocyte chemotactic protein-1 production(GO:0071638) |
| 0.0 | 0.4 | GO:0007379 | segment specification(GO:0007379) |
| 0.0 | 0.2 | GO:0021562 | vestibulocochlear nerve development(GO:0021562) |
| 0.0 | 10.2 | GO:0006367 | transcription initiation from RNA polymerase II promoter(GO:0006367) |
| 0.0 | 1.2 | GO:0016338 | calcium-independent cell-cell adhesion via plasma membrane cell-adhesion molecules(GO:0016338) |
| 0.0 | 0.8 | GO:0089711 | L-glutamate transmembrane transport(GO:0089711) |
| 0.0 | 1.1 | GO:0042359 | vitamin D metabolic process(GO:0042359) |
| 0.0 | 3.0 | GO:0009798 | axis specification(GO:0009798) |
| 0.0 | 0.1 | GO:0048496 | maintenance of organ identity(GO:0048496) |
| 0.0 | 0.5 | GO:0034372 | very-low-density lipoprotein particle remodeling(GO:0034372) |
| 0.0 | 0.7 | GO:0003334 | keratinocyte development(GO:0003334) |
| 0.0 | 0.1 | GO:0072093 | olfactory bulb mitral cell layer development(GO:0061034) ureteric bud invasion(GO:0072092) metanephric renal vesicle formation(GO:0072093) |
| 0.0 | 3.5 | GO:0070268 | cornification(GO:0070268) |
| 0.0 | 0.6 | GO:0044705 | mating behavior(GO:0007617) multi-organism reproductive behavior(GO:0044705) |
| 0.0 | 0.9 | GO:0045747 | positive regulation of Notch signaling pathway(GO:0045747) |
| 0.0 | 1.1 | GO:0007274 | neuromuscular synaptic transmission(GO:0007274) |
| 0.0 | 1.0 | GO:0043252 | sodium-independent organic anion transport(GO:0043252) |
| 0.0 | 1.9 | GO:0048704 | embryonic skeletal system morphogenesis(GO:0048704) |
| 0.0 | 0.2 | GO:0034505 | tooth mineralization(GO:0034505) |
| 0.0 | 0.1 | GO:0061146 | Peyer's patch morphogenesis(GO:0061146) |
| 0.0 | 0.7 | GO:0035235 | ionotropic glutamate receptor signaling pathway(GO:0035235) |
| 0.0 | 0.6 | GO:0045599 | negative regulation of fat cell differentiation(GO:0045599) |
| 0.0 | 0.3 | GO:0032464 | positive regulation of protein homooligomerization(GO:0032464) |
| 0.0 | 0.1 | GO:2000324 | positive regulation of glucocorticoid receptor signaling pathway(GO:2000324) |
| 0.0 | 0.6 | GO:0070997 | neuron death(GO:0070997) |
| 0.0 | 0.9 | GO:0014823 | response to activity(GO:0014823) |
| 0.0 | 1.4 | GO:0006970 | response to osmotic stress(GO:0006970) |
| 0.0 | 1.3 | GO:0007605 | sensory perception of sound(GO:0007605) |
| 0.0 | 0.4 | GO:0010107 | potassium ion import(GO:0010107) |
| 0.0 | 1.2 | GO:1902476 | chloride transmembrane transport(GO:1902476) |
| 0.0 | 0.2 | GO:0021983 | pituitary gland development(GO:0021983) |
| 0.0 | 1.0 | GO:0030282 | bone mineralization(GO:0030282) |
| 0.0 | 2.6 | GO:0007601 | visual perception(GO:0007601) |
| 0.0 | 0.8 | GO:0010923 | negative regulation of phosphatase activity(GO:0010923) |
| 0.0 | 0.1 | GO:0014809 | regulation of skeletal muscle contraction by regulation of release of sequestered calcium ion(GO:0014809) |
Gene overrepresentation in cellular_component category:
| Log-likelihood per target | Total log-likelihood | Term | Description |
|---|---|---|---|
| 2.7 | 38.1 | GO:0098647 | collagen type VI trimer(GO:0005589) collagen beaded filament(GO:0098647) |
| 1.2 | 8.6 | GO:0035867 | alphav-beta3 integrin-IGF-1-IGF1R complex(GO:0035867) |
| 0.7 | 7.2 | GO:0071953 | elastic fiber(GO:0071953) |
| 0.4 | 1.2 | GO:0005826 | actomyosin contractile ring(GO:0005826) |
| 0.4 | 0.7 | GO:0034685 | integrin alphav-beta6 complex(GO:0034685) |
| 0.1 | 1.1 | GO:0005579 | membrane attack complex(GO:0005579) |
| 0.1 | 1.2 | GO:0002116 | semaphorin receptor complex(GO:0002116) sorting endosome(GO:0097443) |
| 0.1 | 1.5 | GO:0030478 | actin cap(GO:0030478) |
| 0.1 | 3.1 | GO:1902711 | GABA-A receptor complex(GO:1902711) |
| 0.1 | 1.1 | GO:1990712 | HFE-transferrin receptor complex(GO:1990712) |
| 0.1 | 2.1 | GO:0032982 | myosin filament(GO:0032982) |
| 0.1 | 1.4 | GO:0001527 | microfibril(GO:0001527) fibril(GO:0043205) |
| 0.1 | 0.4 | GO:0098554 | cytoplasmic side of endoplasmic reticulum membrane(GO:0098554) |
| 0.1 | 0.3 | GO:1990425 | ryanodine receptor complex(GO:1990425) |
| 0.1 | 3.7 | GO:0008328 | ionotropic glutamate receptor complex(GO:0008328) neurotransmitter receptor complex(GO:0098878) |
| 0.0 | 2.3 | GO:0005891 | voltage-gated calcium channel complex(GO:0005891) |
| 0.0 | 20.5 | GO:0005667 | transcription factor complex(GO:0005667) |
| 0.0 | 0.1 | GO:0002139 | stereocilia coupling link(GO:0002139) |
| 0.0 | 3.5 | GO:0005882 | intermediate filament(GO:0005882) |
| 0.0 | 1.2 | GO:0034707 | chloride channel complex(GO:0034707) |
| 0.0 | 1.1 | GO:0031904 | endosome lumen(GO:0031904) |
| 0.0 | 1.6 | GO:0005902 | microvillus(GO:0005902) |
| 0.0 | 2.4 | GO:0031093 | platelet alpha granule lumen(GO:0031093) |
| 0.0 | 4.9 | GO:0016323 | basolateral plasma membrane(GO:0016323) |
| 0.0 | 1.1 | GO:0005876 | spindle microtubule(GO:0005876) |
| 0.0 | 1.3 | GO:0001750 | photoreceptor outer segment(GO:0001750) |
| 0.0 | 0.1 | GO:0097442 | CA3 pyramidal cell dendrite(GO:0097442) |
| 0.0 | 0.9 | GO:0016324 | apical plasma membrane(GO:0016324) |
| 0.0 | 0.1 | GO:0016013 | syntrophin complex(GO:0016013) |
| 0.0 | 0.5 | GO:0034364 | high-density lipoprotein particle(GO:0034364) |
| 0.0 | 1.6 | GO:0000932 | cytoplasmic mRNA processing body(GO:0000932) |
| 0.0 | 0.6 | GO:0016459 | myosin complex(GO:0016459) |
| 0.0 | 1.1 | GO:0042383 | sarcolemma(GO:0042383) |
Gene overrepresentation in molecular_function category:
| Log-likelihood per target | Total log-likelihood | Term | Description |
|---|---|---|---|
| 0.7 | 2.9 | GO:0015265 | glycerol channel activity(GO:0015254) urea channel activity(GO:0015265) |
| 0.6 | 7.8 | GO:0001087 | transcription factor activity, sequence-specific DNA binding, RNA polymerase recruiting(GO:0001011) transcription factor activity, TFIIB-class binding(GO:0001087) |
| 0.6 | 1.7 | GO:0005017 | platelet-derived growth factor-activated receptor activity(GO:0005017) |
| 0.5 | 38.1 | GO:0050840 | extracellular matrix binding(GO:0050840) |
| 0.4 | 1.9 | GO:0016907 | G-protein coupled acetylcholine receptor activity(GO:0016907) |
| 0.4 | 1.1 | GO:0005148 | prolactin receptor binding(GO:0005148) |
| 0.4 | 2.5 | GO:0050682 | AF-2 domain binding(GO:0050682) |
| 0.4 | 2.5 | GO:0005237 | inhibitory extracellular ligand-gated ion channel activity(GO:0005237) |
| 0.3 | 1.7 | GO:0005499 | vitamin D binding(GO:0005499) |
| 0.3 | 1.7 | GO:0004013 | adenosylhomocysteinase activity(GO:0004013) trialkylsulfonium hydrolase activity(GO:0016802) |
| 0.3 | 0.8 | GO:0046848 | hydroxyapatite binding(GO:0046848) |
| 0.3 | 1.3 | GO:0004699 | calcium-independent protein kinase C activity(GO:0004699) |
| 0.2 | 2.3 | GO:0031698 | beta-2 adrenergic receptor binding(GO:0031698) |
| 0.2 | 8.6 | GO:0005159 | insulin-like growth factor receptor binding(GO:0005159) |
| 0.2 | 1.4 | GO:0005223 | intracellular cGMP activated cation channel activity(GO:0005223) |
| 0.2 | 12.1 | GO:0070063 | RNA polymerase binding(GO:0070063) |
| 0.2 | 3.3 | GO:0043522 | leucine zipper domain binding(GO:0043522) |
| 0.2 | 1.2 | GO:0038085 | vascular endothelial growth factor binding(GO:0038085) |
| 0.2 | 1.1 | GO:0048101 | calcium- and calmodulin-regulated 3',5'-cyclic-GMP phosphodiesterase activity(GO:0048101) |
| 0.2 | 0.8 | GO:0050436 | microfibril binding(GO:0050436) |
| 0.2 | 2.4 | GO:0015643 | toxic substance binding(GO:0015643) |
| 0.1 | 6.0 | GO:0070888 | E-box binding(GO:0070888) |
| 0.1 | 1.1 | GO:0005025 | transforming growth factor beta receptor activity, type I(GO:0005025) |
| 0.1 | 0.7 | GO:0015016 | [heparan sulfate]-glucosamine N-sulfotransferase activity(GO:0015016) |
| 0.1 | 1.5 | GO:0008503 | benzodiazepine receptor activity(GO:0008503) |
| 0.1 | 1.6 | GO:0035925 | mRNA 3'-UTR AU-rich region binding(GO:0035925) |
| 0.1 | 4.3 | GO:0004003 | ATP-dependent DNA helicase activity(GO:0004003) |
| 0.1 | 16.1 | GO:0001078 | transcriptional repressor activity, RNA polymerase II core promoter proximal region sequence-specific binding(GO:0001078) |
| 0.1 | 0.6 | GO:0008454 | alpha-1,3-mannosylglycoprotein 4-beta-N-acetylglucosaminyltransferase activity(GO:0008454) |
| 0.1 | 0.7 | GO:0016594 | NMDA glutamate receptor activity(GO:0004972) glycine binding(GO:0016594) |
| 0.1 | 3.1 | GO:0004385 | guanylate kinase activity(GO:0004385) |
| 0.1 | 2.9 | GO:0001972 | retinoic acid binding(GO:0001972) |
| 0.1 | 0.8 | GO:0005314 | high-affinity glutamate transmembrane transporter activity(GO:0005314) |
| 0.1 | 0.3 | GO:0004517 | nitric-oxide synthase activity(GO:0004517) |
| 0.1 | 2.1 | GO:0043425 | bHLH transcription factor binding(GO:0043425) |
| 0.1 | 0.9 | GO:0015377 | cation:chloride symporter activity(GO:0015377) |
| 0.1 | 0.4 | GO:0016015 | morphogen activity(GO:0016015) |
| 0.1 | 8.9 | GO:0005178 | integrin binding(GO:0005178) |
| 0.1 | 2.0 | GO:0000146 | microfilament motor activity(GO:0000146) |
| 0.1 | 1.5 | GO:0005523 | tropomyosin binding(GO:0005523) |
| 0.0 | 6.0 | GO:0003705 | transcription factor activity, RNA polymerase II distal enhancer sequence-specific binding(GO:0003705) |
| 0.0 | 1.1 | GO:0004115 | 3',5'-cyclic-AMP phosphodiesterase activity(GO:0004115) |
| 0.0 | 0.9 | GO:0005112 | Notch binding(GO:0005112) |
| 0.0 | 0.5 | GO:0030247 | pattern binding(GO:0001871) polysaccharide binding(GO:0030247) |
| 0.0 | 0.5 | GO:0039706 | co-receptor binding(GO:0039706) |
| 0.0 | 0.2 | GO:0030345 | extracellular matrix structural constituent conferring compression resistance(GO:0030021) structural constituent of tooth enamel(GO:0030345) |
| 0.0 | 1.9 | GO:0000980 | RNA polymerase II distal enhancer sequence-specific DNA binding(GO:0000980) |
| 0.0 | 0.8 | GO:0043325 | phosphatidylinositol-3,4-bisphosphate binding(GO:0043325) |
| 0.0 | 0.8 | GO:0001102 | RNA polymerase II activating transcription factor binding(GO:0001102) |
| 0.0 | 1.0 | GO:0015347 | sodium-independent organic anion transmembrane transporter activity(GO:0015347) |
| 0.0 | 4.1 | GO:0044325 | ion channel binding(GO:0044325) |
| 0.0 | 2.6 | GO:0001227 | transcriptional repressor activity, RNA polymerase II transcription regulatory region sequence-specific binding(GO:0001227) |
| 0.0 | 1.1 | GO:0008009 | chemokine activity(GO:0008009) |
| 0.0 | 0.5 | GO:0034185 | apolipoprotein binding(GO:0034185) |
| 0.0 | 2.3 | GO:0004860 | protein kinase inhibitor activity(GO:0004860) |
| 0.0 | 0.1 | GO:0061629 | RNA polymerase II sequence-specific DNA binding transcription factor binding(GO:0061629) |
| 0.0 | 5.4 | GO:0000978 | RNA polymerase II core promoter proximal region sequence-specific DNA binding(GO:0000978) |
| 0.0 | 0.1 | GO:0001588 | dopamine neurotransmitter receptor activity, coupled via Gs(GO:0001588) |
| 0.0 | 10.2 | GO:0043565 | sequence-specific DNA binding(GO:0043565) |
| 0.0 | 1.1 | GO:0008013 | beta-catenin binding(GO:0008013) |
| 0.0 | 1.8 | GO:0003774 | motor activity(GO:0003774) |
| 0.0 | 0.6 | GO:0051393 | alpha-actinin binding(GO:0051393) |
| 0.0 | 0.1 | GO:0005539 | glycosaminoglycan binding(GO:0005539) |
| 0.0 | 0.4 | GO:0005242 | inward rectifier potassium channel activity(GO:0005242) |
| 0.0 | 0.7 | GO:0005548 | phospholipid transporter activity(GO:0005548) |
| 0.0 | 6.0 | GO:0003700 | nucleic acid binding transcription factor activity(GO:0001071) transcription factor activity, sequence-specific DNA binding(GO:0003700) |
| 0.0 | 0.1 | GO:0045499 | chemorepellent activity(GO:0045499) |
Gene overrepresentation in C2:CP category:
| Log-likelihood per target | Total log-likelihood | Term | Description |
|---|---|---|---|
| 0.7 | 39.5 | NABA PROTEOGLYCANS | Genes encoding proteoglycans |
| 0.1 | 8.6 | PID IGF1 PATHWAY | IGF1 pathway |
| 0.1 | 16.0 | PID BETA CATENIN NUC PATHWAY | Regulation of nuclear beta catenin signaling and target gene transcription |
| 0.1 | 2.1 | ST G ALPHA S PATHWAY | G alpha s Pathway |
| 0.1 | 1.7 | PID PDGFRA PATHWAY | PDGFR-alpha signaling pathway |
| 0.1 | 1.2 | PID VEGF VEGFR PATHWAY | VEGF and VEGFR signaling network |
| 0.0 | 10.8 | NABA ECM GLYCOPROTEINS | Genes encoding structural ECM glycoproteins |
| 0.0 | 1.1 | PID CONE PATHWAY | Visual signal transduction: Cones |
| 0.0 | 0.9 | PID NOTCH PATHWAY | Notch signaling pathway |
| 0.0 | 2.4 | PID HNF3B PATHWAY | FOXA2 and FOXA3 transcription factor networks |
| 0.0 | 0.7 | PID INTEGRIN5 PATHWAY | Beta5 beta6 beta7 and beta8 integrin cell surface interactions |
| 0.0 | 0.4 | PID AR NONGENOMIC PATHWAY | Nongenotropic Androgen signaling |
| 0.0 | 2.1 | PID FGF PATHWAY | FGF signaling pathway |
| 0.0 | 2.9 | PID TELOMERASE PATHWAY | Regulation of Telomerase |
| 0.0 | 1.9 | PID BMP PATHWAY | BMP receptor signaling |
| 0.0 | 1.3 | PID ENDOTHELIN PATHWAY | Endothelins |
| 0.0 | 1.2 | PID AMB2 NEUTROPHILS PATHWAY | amb2 Integrin signaling |
| 0.0 | 0.7 | PID FRA PATHWAY | Validated transcriptional targets of AP1 family members Fra1 and Fra2 |
| 0.0 | 0.7 | PID REELIN PATHWAY | Reelin signaling pathway |
| 0.0 | 2.1 | PID CASPASE PATHWAY | Caspase cascade in apoptosis |
| 0.0 | 1.1 | PID PTP1B PATHWAY | Signaling events mediated by PTP1B |
| 0.0 | 2.4 | NABA ECM AFFILIATED | Genes encoding proteins affiliated structurally or functionally to extracellular matrix proteins |
| 0.0 | 0.3 | PID ATF2 PATHWAY | ATF-2 transcription factor network |
| 0.0 | 0.7 | PID CDC42 REG PATHWAY | Regulation of CDC42 activity |
| 0.0 | 1.3 | PID MYC REPRESS PATHWAY | Validated targets of C-MYC transcriptional repression |
Gene overrepresentation in C2:CP:REACTOME category:
| Log-likelihood per target | Total log-likelihood | Term | Description |
|---|---|---|---|
| 1.4 | 38.1 | REACTOME CS DS DEGRADATION | Genes involved in CS/DS degradation |
| 0.2 | 2.9 | REACTOME PASSIVE TRANSPORT BY AQUAPORINS | Genes involved in Passive Transport by Aquaporins |
| 0.2 | 8.6 | REACTOME MYOGENESIS | Genes involved in Myogenesis |
| 0.1 | 2.4 | REACTOME RECYCLING OF BILE ACIDS AND SALTS | Genes involved in Recycling of bile acids and salts |
| 0.1 | 0.4 | REACTOME HORMONE LIGAND BINDING RECEPTORS | Genes involved in Hormone ligand-binding receptors |
| 0.1 | 3.1 | REACTOME GABA A RECEPTOR ACTIVATION | Genes involved in GABA A receptor activation |
| 0.1 | 2.2 | REACTOME OTHER SEMAPHORIN INTERACTIONS | Genes involved in Other semaphorin interactions |
| 0.1 | 1.6 | REACTOME DESTABILIZATION OF MRNA BY BRF1 | Genes involved in Destabilization of mRNA by Butyrate Response Factor 1 (BRF1) |
| 0.1 | 3.3 | REACTOME YAP1 AND WWTR1 TAZ STIMULATED GENE EXPRESSION | Genes involved in YAP1- and WWTR1 (TAZ)-stimulated gene expression |
| 0.1 | 1.3 | REACTOME SEMA3A PLEXIN REPULSION SIGNALING BY INHIBITING INTEGRIN ADHESION | Genes involved in SEMA3A-Plexin repulsion signaling by inhibiting Integrin adhesion |
| 0.1 | 2.1 | REACTOME TIGHT JUNCTION INTERACTIONS | Genes involved in Tight junction interactions |
| 0.1 | 1.2 | REACTOME CHYLOMICRON MEDIATED LIPID TRANSPORT | Genes involved in Chylomicron-mediated lipid transport |
| 0.0 | 1.7 | REACTOME DOWNSTREAM SIGNAL TRANSDUCTION | Genes involved in Downstream signal transduction |
| 0.0 | 1.9 | REACTOME AMINE LIGAND BINDING RECEPTORS | Genes involved in Amine ligand-binding receptors |
| 0.0 | 1.1 | REACTOME PROLACTIN RECEPTOR SIGNALING | Genes involved in Prolactin receptor signaling |
| 0.0 | 1.1 | REACTOME CELL CELL JUNCTION ORGANIZATION | Genes involved in Cell-cell junction organization |
| 0.0 | 2.9 | REACTOME TRANSCRIPTIONAL REGULATION OF WHITE ADIPOCYTE DIFFERENTIATION | Genes involved in Transcriptional Regulation of White Adipocyte Differentiation |
| 0.0 | 3.3 | REACTOME NUCLEAR RECEPTOR TRANSCRIPTION PATHWAY | Genes involved in Nuclear Receptor transcription pathway |
| 0.0 | 1.5 | REACTOME SIGNALING BY BMP | Genes involved in Signaling by BMP |
| 0.0 | 0.7 | REACTOME RAS ACTIVATION UOPN CA2 INFUX THROUGH NMDA RECEPTOR | Genes involved in Ras activation uopn Ca2+ infux through NMDA receptor |
| 0.0 | 1.1 | REACTOME STEROID HORMONES | Genes involved in Steroid hormones |
| 0.0 | 1.3 | REACTOME EFFECTS OF PIP2 HYDROLYSIS | Genes involved in Effects of PIP2 hydrolysis |
| 0.0 | 0.8 | REACTOME GLUTAMATE NEUROTRANSMITTER RELEASE CYCLE | Genes involved in Glutamate Neurotransmitter Release Cycle |
| 0.0 | 4.4 | REACTOME G ALPHA S SIGNALLING EVENTS | Genes involved in G alpha (s) signalling events |
| 0.0 | 1.5 | REACTOME SMOOTH MUSCLE CONTRACTION | Genes involved in Smooth Muscle Contraction |
| 0.0 | 0.6 | REACTOME N GLYCAN ANTENNAE ELONGATION | Genes involved in N-Glycan antennae elongation |
| 0.0 | 0.7 | REACTOME HS GAG BIOSYNTHESIS | Genes involved in HS-GAG biosynthesis |
| 0.0 | 1.1 | REACTOME COMPLEMENT CASCADE | Genes involved in Complement cascade |
| 0.0 | 1.7 | REACTOME INTEGRIN CELL SURFACE INTERACTIONS | Genes involved in Integrin cell surface interactions |