Project
GNF SymAtlas + NCI-60 cancer cell lines, comparison of cancers vs non-cancers, human (Su, 2004; Ross, 2000)
Navigation
Downloads
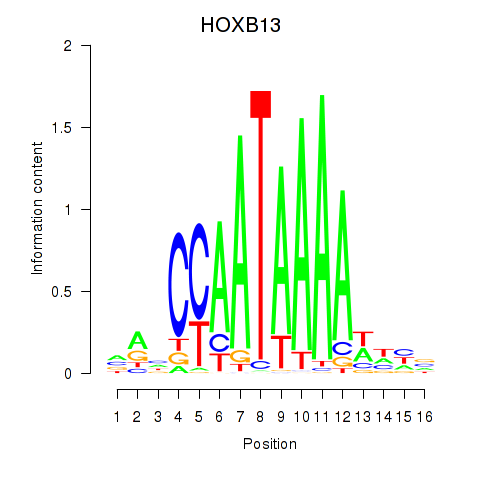
Results for HOXB13
Z-value: 0.56
Motif logo
Transcription factors associated with HOXB13
| Gene Symbol | Gene ID | Gene Info |
|---|---|---|
|
HOXB13
|
ENSG00000159184.7 | homeobox B13 |
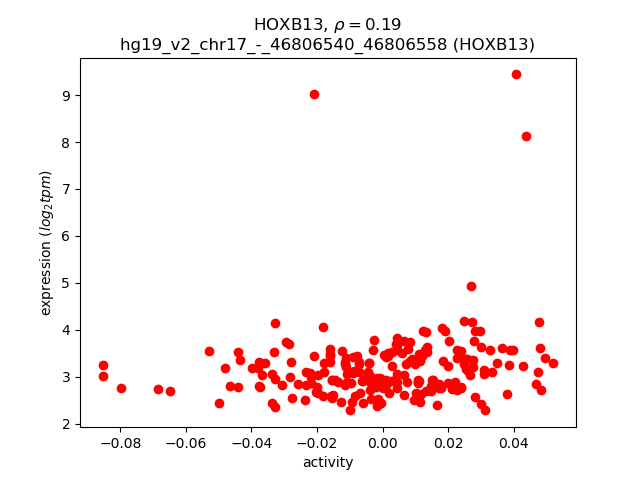
Activity-expression correlation:
| Gene | Promoter | Pearson corr. coef. | P-value | Plot |
|---|---|---|---|---|
| HOXB13 | hg19_v2_chr17_-_46806540_46806558 | 0.19 | 5.4e-03 | Click! |
Activity profile of HOXB13 motif
Sorted Z-values of HOXB13 motif
| Promoter | Log-likelihood | Transcript | Gene | Gene Info |
|---|---|---|---|---|
| chr11_+_118401706 | 7.57 |
ENST00000411589.2
ENST00000442938.2 ENST00000359862.4 |
TMEM25
|
transmembrane protein 25 |
| chr3_-_195310802 | 5.72 |
ENST00000421243.1
ENST00000453131.1 |
APOD
|
apolipoprotein D |
| chr18_-_52989217 | 5.32 |
ENST00000570287.2
|
TCF4
|
transcription factor 4 |
| chr3_-_114790179 | 4.31 |
ENST00000462705.1
|
ZBTB20
|
zinc finger and BTB domain containing 20 |
| chr1_+_84630645 | 4.18 |
ENST00000394839.2
|
PRKACB
|
protein kinase, cAMP-dependent, catalytic, beta |
| chr2_-_51259292 | 3.80 |
ENST00000401669.2
|
NRXN1
|
neurexin 1 |
| chr18_-_52989525 | 3.69 |
ENST00000457482.3
|
TCF4
|
transcription factor 4 |
| chr2_-_51259229 | 3.60 |
ENST00000405472.3
|
NRXN1
|
neurexin 1 |
| chr19_+_35634146 | 3.60 |
ENST00000586063.1
ENST00000270310.2 ENST00000588265.1 |
FXYD7
|
FXYD domain containing ion transport regulator 7 |
| chrM_+_12331 | 3.57 |
ENST00000361567.2
|
MT-ND5
|
mitochondrially encoded NADH dehydrogenase 5 |
| chr8_+_86376081 | 3.38 |
ENST00000285379.5
|
CA2
|
carbonic anhydrase II |
| chr1_+_84630053 | 3.30 |
ENST00000394838.2
ENST00000370682.3 ENST00000432111.1 |
PRKACB
|
protein kinase, cAMP-dependent, catalytic, beta |
| chr2_-_136288113 | 3.30 |
ENST00000401392.1
|
ZRANB3
|
zinc finger, RAN-binding domain containing 3 |
| chr9_-_130829588 | 2.55 |
ENST00000373078.4
|
NAIF1
|
nuclear apoptosis inducing factor 1 |
| chr1_-_45956822 | 2.49 |
ENST00000372086.3
ENST00000341771.6 |
TESK2
|
testis-specific kinase 2 |
| chr1_+_66458072 | 2.11 |
ENST00000423207.2
|
PDE4B
|
phosphodiesterase 4B, cAMP-specific |
| chr17_-_73663168 | 2.09 |
ENST00000578201.1
ENST00000423245.2 |
RECQL5
|
RecQ protein-like 5 |
| chr19_+_1440838 | 2.02 |
ENST00000594262.1
|
AC027307.3
|
Uncharacterized protein |
| chr19_-_5903714 | 1.92 |
ENST00000586349.1
ENST00000585661.1 ENST00000308961.4 ENST00000592634.1 ENST00000418389.2 ENST00000252675.5 |
AC024592.12
NDUFA11
FUT5
|
Uncharacterized protein NADH dehydrogenase (ubiquinone) 1 alpha subcomplex, 11, 14.7kDa fucosyltransferase 5 (alpha (1,3) fucosyltransferase) |
| chr16_+_30669720 | 1.77 |
ENST00000356166.6
|
FBRS
|
fibrosin |
| chr17_-_73663245 | 1.69 |
ENST00000584999.1
ENST00000317905.5 ENST00000420326.2 ENST00000340830.5 |
RECQL5
|
RecQ protein-like 5 |
| chr2_+_67624430 | 1.69 |
ENST00000272342.5
|
ETAA1
|
Ewing tumor-associated antigen 1 |
| chr9_+_103947311 | 1.62 |
ENST00000395056.2
|
LPPR1
|
Lipid phosphate phosphatase-related protein type 1 |
| chr9_+_125132803 | 1.60 |
ENST00000540753.1
|
PTGS1
|
prostaglandin-endoperoxide synthase 1 (prostaglandin G/H synthase and cyclooxygenase) |
| chr9_-_14180778 | 1.53 |
ENST00000380924.1
ENST00000543693.1 |
NFIB
|
nuclear factor I/B |
| chr12_-_81992111 | 1.37 |
ENST00000443686.3
ENST00000407050.4 |
PPFIA2
|
protein tyrosine phosphatase, receptor type, f polypeptide (PTPRF), interacting protein (liprin), alpha 2 |
| chr12_-_52715179 | 1.27 |
ENST00000293670.3
|
KRT83
|
keratin 83 |
| chr4_+_95972822 | 1.26 |
ENST00000509540.1
ENST00000440890.2 |
BMPR1B
|
bone morphogenetic protein receptor, type IB |
| chr16_-_71610985 | 1.18 |
ENST00000355962.4
|
TAT
|
tyrosine aminotransferase |
| chr8_+_119294456 | 1.09 |
ENST00000366457.2
|
AC023590.1
|
Uncharacterized protein |
| chr9_-_104198042 | 1.00 |
ENST00000374855.4
|
ALDOB
|
aldolase B, fructose-bisphosphate |
| chr1_-_45956800 | 0.92 |
ENST00000538496.1
|
TESK2
|
testis-specific kinase 2 |
| chr7_-_50860565 | 0.87 |
ENST00000403097.1
|
GRB10
|
growth factor receptor-bound protein 10 |
| chr8_+_77593474 | 0.84 |
ENST00000455469.2
ENST00000050961.6 |
ZFHX4
|
zinc finger homeobox 4 |
| chr8_+_97597148 | 0.82 |
ENST00000521590.1
|
SDC2
|
syndecan 2 |
| chr8_+_77593448 | 0.79 |
ENST00000521891.2
|
ZFHX4
|
zinc finger homeobox 4 |
| chr1_+_78769549 | 0.66 |
ENST00000370758.1
|
PTGFR
|
prostaglandin F receptor (FP) |
| chr2_-_175629135 | 0.62 |
ENST00000409542.1
ENST00000409219.1 |
CHRNA1
|
cholinergic receptor, nicotinic, alpha 1 (muscle) |
| chr3_+_89156674 | 0.58 |
ENST00000336596.2
|
EPHA3
|
EPH receptor A3 |
| chr2_-_175629164 | 0.54 |
ENST00000409323.1
ENST00000261007.5 ENST00000348749.5 |
CHRNA1
|
cholinergic receptor, nicotinic, alpha 1 (muscle) |
| chr14_-_50583271 | 0.48 |
ENST00000395860.2
ENST00000395859.2 |
VCPKMT
|
valosin containing protein lysine (K) methyltransferase |
| chr11_+_63606373 | 0.45 |
ENST00000402010.2
ENST00000315032.8 ENST00000377809.4 ENST00000413835.2 ENST00000377810.3 |
MARK2
|
MAP/microtubule affinity-regulating kinase 2 |
| chr6_+_27782788 | 0.44 |
ENST00000359465.4
|
HIST1H2BM
|
histone cluster 1, H2bm |
| chr6_-_27782548 | 0.39 |
ENST00000333151.3
|
HIST1H2AJ
|
histone cluster 1, H2aj |
| chr3_+_89156799 | 0.25 |
ENST00000452448.2
ENST00000494014.1 |
EPHA3
|
EPH receptor A3 |
| chr17_-_10560619 | 0.21 |
ENST00000583535.1
|
MYH3
|
myosin, heavy chain 3, skeletal muscle, embryonic |
| chr11_-_102826434 | 0.17 |
ENST00000340273.4
ENST00000260302.3 |
MMP13
|
matrix metallopeptidase 13 (collagenase 3) |
| chr1_+_52682052 | 0.14 |
ENST00000371591.1
|
ZFYVE9
|
zinc finger, FYVE domain containing 9 |
| chr1_+_210501589 | 0.13 |
ENST00000413764.2
ENST00000541565.1 |
HHAT
|
hedgehog acyltransferase |
| chr9_+_125133315 | 0.07 |
ENST00000223423.4
ENST00000362012.2 |
PTGS1
|
prostaglandin-endoperoxide synthase 1 (prostaglandin G/H synthase and cyclooxygenase) |
| chr3_-_123710199 | 0.03 |
ENST00000184183.4
|
ROPN1
|
rhophilin associated tail protein 1 |
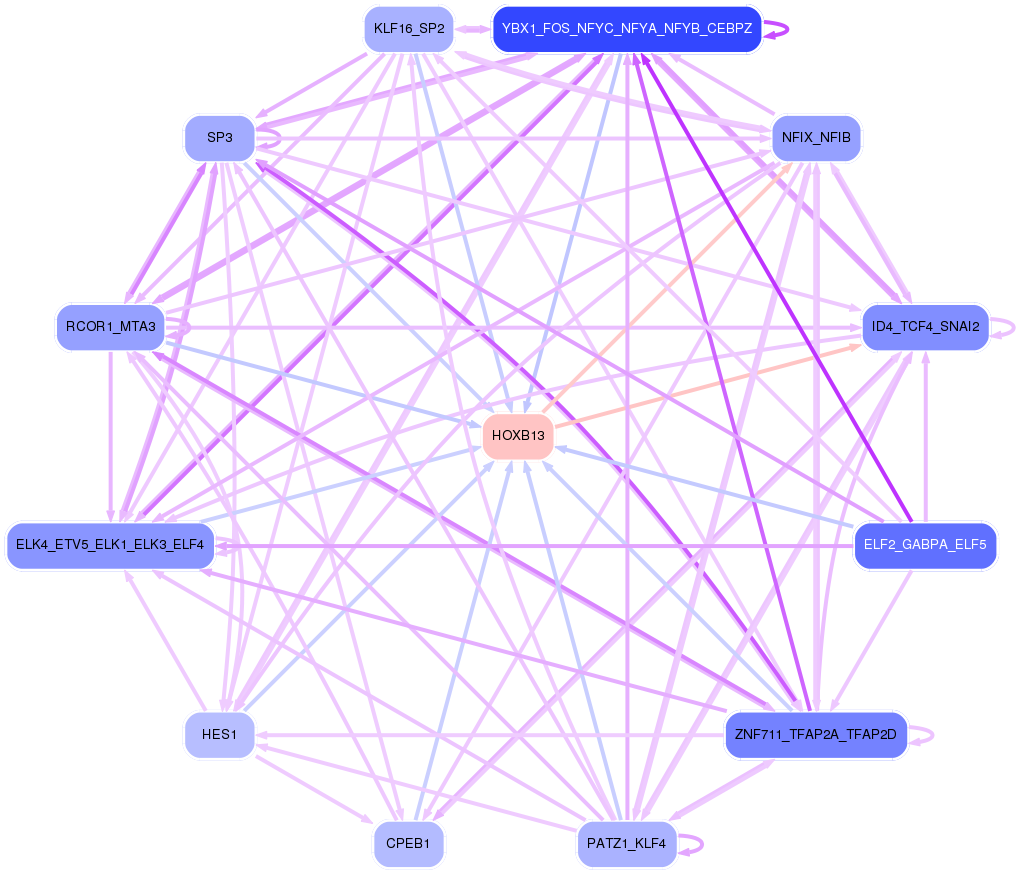
Network of associatons between targets according to the STRING database.

First level regulatory network of HOXB13
Gene Ontology Analysis
Gene overrepresentation in biological_process category:
| Log-likelihood per target | Total log-likelihood | Term | Description |
|---|---|---|---|
| 1.9 | 5.7 | GO:2000097 | regulation of smooth muscle cell-matrix adhesion(GO:2000097) |
| 1.5 | 7.5 | GO:0097338 | response to clozapine(GO:0097338) |
| 1.3 | 3.8 | GO:1990414 | replication-born double-strand break repair via sister chromatid exchange(GO:1990414) |
| 1.1 | 3.4 | GO:0042938 | dipeptide transport(GO:0042938) |
| 0.9 | 7.4 | GO:0097116 | gephyrin clustering involved in postsynaptic density assembly(GO:0097116) |
| 0.7 | 3.3 | GO:0048478 | replication fork protection(GO:0048478) |
| 0.3 | 1.0 | GO:0006001 | fructose catabolic process(GO:0006001) fructose catabolic process to hydroxyacetone phosphate and glyceraldehyde-3-phosphate(GO:0061624) |
| 0.3 | 0.8 | GO:0097156 | fasciculation of motor neuron axon(GO:0097156) |
| 0.3 | 1.3 | GO:0001550 | ovarian cumulus expansion(GO:0001550) fused antrum stage(GO:0048165) |
| 0.2 | 1.5 | GO:0021740 | trigeminal sensory nucleus development(GO:0021730) principal sensory nucleus of trigeminal nerve development(GO:0021740) negative regulation of epithelial cell proliferation involved in lung morphogenesis(GO:2000795) |
| 0.2 | 2.1 | GO:1901898 | negative regulation of relaxation of cardiac muscle(GO:1901898) |
| 0.2 | 1.2 | GO:0006572 | tyrosine catabolic process(GO:0006572) |
| 0.2 | 1.9 | GO:0019317 | fucose catabolic process(GO:0019317) L-fucose metabolic process(GO:0042354) L-fucose catabolic process(GO:0042355) |
| 0.1 | 1.2 | GO:0048630 | skeletal muscle tissue growth(GO:0048630) |
| 0.1 | 0.8 | GO:0008218 | bioluminescence(GO:0008218) |
| 0.1 | 1.7 | GO:0019371 | cyclooxygenase pathway(GO:0019371) |
| 0.1 | 1.7 | GO:0031297 | replication fork processing(GO:0031297) |
| 0.1 | 0.7 | GO:0071798 | response to prostaglandin D(GO:0071798) cellular response to prostaglandin D stimulus(GO:0071799) |
| 0.1 | 4.3 | GO:0032728 | positive regulation of interferon-beta production(GO:0032728) |
| 0.1 | 0.9 | GO:0046325 | negative regulation of glucose import(GO:0046325) |
| 0.1 | 3.6 | GO:0006120 | mitochondrial electron transport, NADH to ubiquinone(GO:0006120) |
| 0.0 | 3.6 | GO:2000649 | regulation of sodium ion transmembrane transporter activity(GO:2000649) |
| 0.0 | 9.0 | GO:0006367 | transcription initiation from RNA polymerase II promoter(GO:0006367) |
| 0.0 | 2.5 | GO:1902108 | regulation of mitochondrial membrane permeability involved in apoptotic process(GO:1902108) |
| 0.0 | 3.4 | GO:0007045 | cell-substrate adherens junction assembly(GO:0007045) focal adhesion assembly(GO:0048041) |
| 0.0 | 0.5 | GO:0032780 | negative regulation of ATPase activity(GO:0032780) |
| 0.0 | 1.4 | GO:0014047 | glutamate secretion(GO:0014047) |
| 0.0 | 0.2 | GO:0003417 | growth plate cartilage development(GO:0003417) |
| 0.0 | 1.3 | GO:0042633 | molting cycle(GO:0042303) hair cycle(GO:0042633) |
Gene overrepresentation in cellular_component category:
| Log-likelihood per target | Total log-likelihood | Term | Description |
|---|---|---|---|
| 0.4 | 7.5 | GO:0005952 | cAMP-dependent protein kinase complex(GO:0005952) |
| 0.1 | 1.5 | GO:0044300 | cerebellar mossy fiber(GO:0044300) |
| 0.1 | 5.0 | GO:0043596 | nuclear replication fork(GO:0043596) |
| 0.1 | 1.3 | GO:1990712 | HFE-transferrin receptor complex(GO:1990712) |
| 0.1 | 5.5 | GO:0005747 | mitochondrial respiratory chain complex I(GO:0005747) NADH dehydrogenase complex(GO:0030964) respiratory chain complex I(GO:0045271) |
| 0.1 | 2.1 | GO:0000930 | gamma-tubulin complex(GO:0000930) |
| 0.1 | 1.4 | GO:0048786 | presynaptic active zone(GO:0048786) |
| 0.1 | 7.4 | GO:0042734 | presynaptic membrane(GO:0042734) |
| 0.0 | 8.9 | GO:0032993 | protein-DNA complex(GO:0032993) |
| 0.0 | 1.2 | GO:0005892 | acetylcholine-gated channel complex(GO:0005892) |
| 0.0 | 0.4 | GO:0097427 | microtubule bundle(GO:0097427) |
| 0.0 | 1.0 | GO:0034451 | centriolar satellite(GO:0034451) |
| 0.0 | 3.1 | GO:0005902 | microvillus(GO:0005902) |
| 0.0 | 3.8 | GO:0016591 | DNA-directed RNA polymerase II, holoenzyme(GO:0016591) |
| 0.0 | 1.3 | GO:0045095 | keratin filament(GO:0045095) |
| 0.0 | 5.7 | GO:0022626 | cytosolic ribosome(GO:0022626) |
Gene overrepresentation in molecular_function category:
| Log-likelihood per target | Total log-likelihood | Term | Description |
|---|---|---|---|
| 0.7 | 9.0 | GO:0001087 | transcription factor activity, sequence-specific DNA binding, RNA polymerase recruiting(GO:0001011) transcription factor activity, TFIIB-class binding(GO:0001087) |
| 0.6 | 3.8 | GO:0009378 | four-way junction helicase activity(GO:0009378) |
| 0.5 | 3.3 | GO:0036310 | annealing helicase activity(GO:0036310) |
| 0.5 | 7.5 | GO:0004691 | cAMP-dependent protein kinase activity(GO:0004691) |
| 0.5 | 7.4 | GO:0097109 | neuroligin family protein binding(GO:0097109) |
| 0.4 | 3.4 | GO:0004064 | arylesterase activity(GO:0004064) |
| 0.4 | 1.7 | GO:0004666 | prostaglandin-endoperoxide synthase activity(GO:0004666) |
| 0.4 | 1.2 | GO:0070546 | L-phenylalanine aminotransferase activity(GO:0070546) L-phenylalanine:2-oxoglutarate aminotransferase activity(GO:0080130) |
| 0.4 | 1.9 | GO:0017060 | 3-galactosyl-N-acetylglucosaminide 4-alpha-L-fucosyltransferase activity(GO:0017060) |
| 0.2 | 0.7 | GO:0004958 | prostaglandin F receptor activity(GO:0004958) |
| 0.1 | 1.3 | GO:0005025 | transforming growth factor beta receptor activity, type I(GO:0005025) |
| 0.1 | 5.7 | GO:0015485 | cholesterol binding(GO:0015485) |
| 0.1 | 1.0 | GO:0004332 | fructose-bisphosphate aldolase activity(GO:0004332) |
| 0.1 | 2.1 | GO:0043015 | gamma-tubulin binding(GO:0043015) |
| 0.1 | 3.6 | GO:0050136 | NADH dehydrogenase (ubiquinone) activity(GO:0008137) NADH dehydrogenase (quinone) activity(GO:0050136) |
| 0.1 | 3.6 | GO:0017080 | sodium channel regulator activity(GO:0017080) |
| 0.1 | 0.8 | GO:0005004 | GPI-linked ephrin receptor activity(GO:0005004) |
| 0.0 | 3.4 | GO:0004712 | protein serine/threonine/tyrosine kinase activity(GO:0004712) |
| 0.0 | 1.2 | GO:0022848 | acetylcholine-gated cation channel activity(GO:0022848) |
| 0.0 | 1.7 | GO:0043539 | protein serine/threonine kinase activator activity(GO:0043539) |
| 0.0 | 0.2 | GO:0017018 | myosin phosphatase activity(GO:0017018) |
| 0.0 | 0.4 | GO:0050321 | tau-protein kinase activity(GO:0050321) |
| 0.0 | 4.3 | GO:0001078 | transcriptional repressor activity, RNA polymerase II core promoter proximal region sequence-specific binding(GO:0001078) |
| 0.0 | 0.9 | GO:0005158 | insulin receptor binding(GO:0005158) |
Gene overrepresentation in C2:CP category:
| Log-likelihood per target | Total log-likelihood | Term | Description |
|---|---|---|---|
| 0.1 | 7.5 | PID IL3 PATHWAY | IL3-mediated signaling events |
| 0.1 | 9.0 | PID AR PATHWAY | Coregulation of Androgen receptor activity |
| 0.0 | 2.2 | PID HNF3B PATHWAY | FOXA2 and FOXA3 transcription factor networks |
| 0.0 | 1.5 | PID HNF3A PATHWAY | FOXA1 transcription factor network |
| 0.0 | 0.9 | PID IGF1 PATHWAY | IGF1 pathway |
| 0.0 | 0.8 | PID EPHA FWDPATHWAY | EPHA forward signaling |
| 0.0 | 1.2 | PID ERBB2 ERBB3 PATHWAY | ErbB2/ErbB3 signaling events |
| 0.0 | 0.8 | PID FGF PATHWAY | FGF signaling pathway |
Gene overrepresentation in C2:CP:REACTOME category:
| Log-likelihood per target | Total log-likelihood | Term | Description |
|---|---|---|---|
| 0.3 | 7.5 | REACTOME HORMONE SENSITIVE LIPASE HSL MEDIATED TRIACYLGLYCEROL HYDROLYSIS | Genes involved in Hormone-sensitive lipase (HSL)-mediated triacylglycerol hydrolysis |
| 0.2 | 3.4 | REACTOME REVERSIBLE HYDRATION OF CARBON DIOXIDE | Genes involved in Reversible Hydration of Carbon Dioxide |
| 0.2 | 9.0 | REACTOME MYOGENESIS | Genes involved in Myogenesis |
| 0.1 | 1.2 | REACTOME PRESYNAPTIC NICOTINIC ACETYLCHOLINE RECEPTORS | Genes involved in Presynaptic nicotinic acetylcholine receptors |
| 0.1 | 0.7 | REACTOME PROSTANOID LIGAND RECEPTORS | Genes involved in Prostanoid ligand receptors |
| 0.0 | 1.5 | REACTOME RNA POL III TRANSCRIPTION TERMINATION | Genes involved in RNA Polymerase III Transcription Termination |
| 0.0 | 2.1 | REACTOME DARPP 32 EVENTS | Genes involved in DARPP-32 events |
| 0.0 | 0.9 | REACTOME SIGNAL ATTENUATION | Genes involved in Signal attenuation |
| 0.0 | 0.8 | REACTOME HS GAG DEGRADATION | Genes involved in HS-GAG degradation |
| 0.0 | 1.0 | REACTOME GLYCOLYSIS | Genes involved in Glycolysis |
| 0.0 | 1.9 | REACTOME RESPIRATORY ELECTRON TRANSPORT | Genes involved in Respiratory electron transport |
| 0.0 | 1.7 | REACTOME PHASE1 FUNCTIONALIZATION OF COMPOUNDS | Genes involved in Phase 1 - Functionalization of compounds |
| 0.0 | 0.8 | REACTOME PACKAGING OF TELOMERE ENDS | Genes involved in Packaging Of Telomere Ends |