Project
GNF SymAtlas + NCI-60 cancer cell lines, comparison of cancers vs non-cancers, human (Su, 2004; Ross, 2000)
Navigation
Downloads
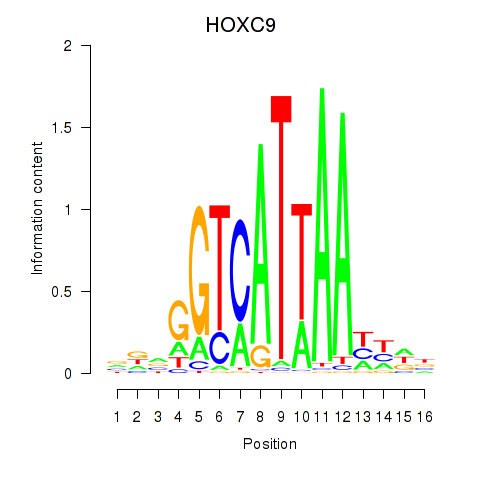
Results for HOXC9
Z-value: 0.17
Motif logo
Transcription factors associated with HOXC9
| Gene Symbol | Gene ID | Gene Info |
|---|---|---|
|
HOXC9
|
ENSG00000180806.4 | homeobox C9 |
Activity profile of HOXC9 motif
Sorted Z-values of HOXC9 motif
| Promoter | Log-likelihood | Transcript | Gene | Gene Info |
|---|---|---|---|---|
| chr8_-_81083890 | 10.44 |
ENST00000518937.1
|
TPD52
|
tumor protein D52 |
| chrX_-_13835147 | 9.58 |
ENST00000493677.1
ENST00000355135.2 |
GPM6B
|
glycoprotein M6B |
| chr6_-_52859046 | 8.25 |
ENST00000457564.1
ENST00000541324.1 ENST00000370960.1 |
GSTA4
|
glutathione S-transferase alpha 4 |
| chr9_+_137979506 | 6.85 |
ENST00000539529.1
ENST00000392991.4 ENST00000371793.3 |
OLFM1
|
olfactomedin 1 |
| chr1_+_149230680 | 6.54 |
ENST00000443018.1
|
RP11-403I13.5
|
RP11-403I13.5 |
| chr18_+_32558208 | 6.30 |
ENST00000436190.2
|
MAPRE2
|
microtubule-associated protein, RP/EB family, member 2 |
| chr8_+_132916318 | 6.22 |
ENST00000254624.5
ENST00000522709.1 |
EFR3A
|
EFR3 homolog A (S. cerevisiae) |
| chr2_+_187371440 | 6.09 |
ENST00000445547.1
|
ZC3H15
|
zinc finger CCCH-type containing 15 |
| chr1_+_163039143 | 6.08 |
ENST00000531057.1
ENST00000527809.1 ENST00000367908.4 |
RGS4
|
regulator of G-protein signaling 4 |
| chr13_-_24007815 | 5.71 |
ENST00000382298.3
|
SACS
|
spastic ataxia of Charlevoix-Saguenay (sacsin) |
| chr8_-_80993010 | 5.65 |
ENST00000537855.1
ENST00000520527.1 ENST00000517427.1 ENST00000448733.2 ENST00000379097.3 |
TPD52
|
tumor protein D52 |
| chr7_+_64838712 | 5.55 |
ENST00000328747.7
ENST00000431504.1 ENST00000357512.2 |
ZNF92
|
zinc finger protein 92 |
| chr11_+_19798964 | 5.30 |
ENST00000527559.2
|
NAV2
|
neuron navigator 2 |
| chr7_+_64838786 | 5.24 |
ENST00000450302.2
|
ZNF92
|
zinc finger protein 92 |
| chr10_-_13344341 | 5.13 |
ENST00000396920.3
|
PHYH
|
phytanoyl-CoA 2-hydroxylase |
| chr1_+_220863187 | 4.85 |
ENST00000294889.5
|
C1orf115
|
chromosome 1 open reading frame 115 |
| chr14_+_53173910 | 4.84 |
ENST00000606149.1
ENST00000555339.1 ENST00000556813.1 |
PSMC6
|
proteasome (prosome, macropain) 26S subunit, ATPase, 6 |
| chr14_+_53173890 | 4.76 |
ENST00000445930.2
|
PSMC6
|
proteasome (prosome, macropain) 26S subunit, ATPase, 6 |
| chr2_-_224467093 | 4.73 |
ENST00000305409.2
|
SCG2
|
secretogranin II |
| chr17_+_48823975 | 4.73 |
ENST00000513969.1
ENST00000503728.1 |
LUC7L3
|
LUC7-like 3 (S. cerevisiae) |
| chr11_+_46366918 | 4.73 |
ENST00000528615.1
ENST00000395574.3 |
DGKZ
|
diacylglycerol kinase, zeta |
| chr12_-_30887948 | 4.56 |
ENST00000433722.2
|
CAPRIN2
|
caprin family member 2 |
| chr9_-_93405352 | 4.55 |
ENST00000375765.3
|
DIRAS2
|
DIRAS family, GTP-binding RAS-like 2 |
| chr9_-_95055956 | 4.53 |
ENST00000375629.3
ENST00000447699.2 ENST00000375643.3 ENST00000395554.3 |
IARS
|
isoleucyl-tRNA synthetase |
| chr9_-_95056010 | 4.44 |
ENST00000443024.2
|
IARS
|
isoleucyl-tRNA synthetase |
| chr1_-_197115818 | 4.33 |
ENST00000367409.4
ENST00000294732.7 |
ASPM
|
asp (abnormal spindle) homolog, microcephaly associated (Drosophila) |
| chr12_+_19358228 | 4.21 |
ENST00000424268.1
ENST00000543806.1 |
PLEKHA5
|
pleckstrin homology domain containing, family A member 5 |
| chr6_+_158733692 | 4.17 |
ENST00000367094.2
ENST00000367097.3 |
TULP4
|
tubby like protein 4 |
| chr8_+_104033296 | 4.13 |
ENST00000521514.1
ENST00000518738.1 |
ATP6V1C1
|
ATPase, H+ transporting, lysosomal 42kDa, V1 subunit C1 |
| chr4_+_70894130 | 4.08 |
ENST00000526767.1
ENST00000530128.1 ENST00000381057.3 |
HTN3
|
histatin 3 |
| chr16_-_66764119 | 4.05 |
ENST00000569320.1
|
DYNC1LI2
|
dynein, cytoplasmic 1, light intermediate chain 2 |
| chr12_-_90049878 | 3.86 |
ENST00000359142.3
|
ATP2B1
|
ATPase, Ca++ transporting, plasma membrane 1 |
| chr6_-_52859968 | 3.82 |
ENST00000370959.1
|
GSTA4
|
glutathione S-transferase alpha 4 |
| chr1_-_212965104 | 3.76 |
ENST00000422588.2
ENST00000366975.6 ENST00000366977.3 ENST00000366976.1 |
NSL1
|
NSL1, MIS12 kinetochore complex component |
| chr12_-_90049828 | 3.70 |
ENST00000261173.2
ENST00000348959.3 |
ATP2B1
|
ATPase, Ca++ transporting, plasma membrane 1 |
| chr2_-_69664586 | 3.62 |
ENST00000303698.3
ENST00000394305.1 ENST00000410022.2 |
NFU1
|
NFU1 iron-sulfur cluster scaffold homolog (S. cerevisiae) |
| chr7_+_130126165 | 3.61 |
ENST00000427521.1
ENST00000416162.2 ENST00000378576.4 |
MEST
|
mesoderm specific transcript |
| chr12_-_118628350 | 3.58 |
ENST00000537952.1
ENST00000537822.1 |
TAOK3
|
TAO kinase 3 |
| chr11_-_107729887 | 3.41 |
ENST00000525815.1
|
SLC35F2
|
solute carrier family 35, member F2 |
| chr19_-_20748541 | 3.38 |
ENST00000427401.4
ENST00000594419.1 |
ZNF737
|
zinc finger protein 737 |
| chr13_-_30424821 | 3.35 |
ENST00000380680.4
|
UBL3
|
ubiquitin-like 3 |
| chr3_+_87276407 | 3.30 |
ENST00000471660.1
ENST00000263780.4 ENST00000494980.1 |
CHMP2B
|
charged multivesicular body protein 2B |
| chr2_-_172750733 | 3.24 |
ENST00000392592.4
ENST00000422440.2 |
SLC25A12
|
solute carrier family 25 (aspartate/glutamate carrier), member 12 |
| chr8_-_17555164 | 3.22 |
ENST00000297488.6
|
MTUS1
|
microtubule associated tumor suppressor 1 |
| chr9_+_80912059 | 3.18 |
ENST00000347159.2
ENST00000376588.3 |
PSAT1
|
phosphoserine aminotransferase 1 |
| chr7_+_130126012 | 3.13 |
ENST00000341441.5
|
MEST
|
mesoderm specific transcript |
| chr8_-_81083731 | 3.10 |
ENST00000379096.5
|
TPD52
|
tumor protein D52 |
| chr19_+_21265028 | 3.06 |
ENST00000291770.7
|
ZNF714
|
zinc finger protein 714 |
| chr2_+_37571845 | 3.04 |
ENST00000537448.1
|
QPCT
|
glutaminyl-peptide cyclotransferase |
| chr22_+_21133469 | 2.98 |
ENST00000406799.1
|
SERPIND1
|
serpin peptidase inhibitor, clade D (heparin cofactor), member 1 |
| chr5_-_68665084 | 2.93 |
ENST00000509462.1
|
TAF9
|
TAF9 RNA polymerase II, TATA box binding protein (TBP)-associated factor, 32kDa |
| chr12_-_63328817 | 2.88 |
ENST00000228705.6
|
PPM1H
|
protein phosphatase, Mg2+/Mn2+ dependent, 1H |
| chr11_-_3400442 | 2.82 |
ENST00000429541.2
ENST00000532539.1 |
ZNF195
|
zinc finger protein 195 |
| chrX_+_105937068 | 2.82 |
ENST00000324342.3
|
RNF128
|
ring finger protein 128, E3 ubiquitin protein ligase |
| chrX_-_68385354 | 2.82 |
ENST00000361478.1
|
PJA1
|
praja ring finger 1, E3 ubiquitin protein ligase |
| chr5_+_156696362 | 2.82 |
ENST00000377576.3
|
CYFIP2
|
cytoplasmic FMR1 interacting protein 2 |
| chr2_+_37571717 | 2.81 |
ENST00000338415.3
ENST00000404976.1 |
QPCT
|
glutaminyl-peptide cyclotransferase |
| chr10_-_127505167 | 2.74 |
ENST00000368786.1
|
UROS
|
uroporphyrinogen III synthase |
| chr19_-_47975417 | 2.74 |
ENST00000236877.6
|
SLC8A2
|
solute carrier family 8 (sodium/calcium exchanger), member 2 |
| chr1_-_226926864 | 2.66 |
ENST00000429204.1
ENST00000366784.1 |
ITPKB
|
inositol-trisphosphate 3-kinase B |
| chr11_-_3400330 | 2.65 |
ENST00000427810.2
ENST00000005082.9 ENST00000534569.1 ENST00000438262.2 ENST00000528796.1 ENST00000528410.1 ENST00000529678.1 ENST00000354599.6 ENST00000526601.1 ENST00000525502.1 ENST00000533036.1 ENST00000399602.4 |
ZNF195
|
zinc finger protein 195 |
| chr4_-_69215467 | 2.64 |
ENST00000579690.1
|
YTHDC1
|
YTH domain containing 1 |
| chr21_-_27423339 | 2.60 |
ENST00000415997.1
|
APP
|
amyloid beta (A4) precursor protein |
| chr5_-_68665296 | 2.54 |
ENST00000512152.1
ENST00000503245.1 ENST00000512561.1 ENST00000380822.4 |
TAF9
|
TAF9 RNA polymerase II, TATA box binding protein (TBP)-associated factor, 32kDa |
| chr3_+_149191723 | 2.51 |
ENST00000305354.4
|
TM4SF4
|
transmembrane 4 L six family member 4 |
| chr4_-_72649763 | 2.48 |
ENST00000513476.1
|
GC
|
group-specific component (vitamin D binding protein) |
| chr11_-_60674037 | 2.48 |
ENST00000541371.1
ENST00000227524.4 |
PRPF19
|
pre-mRNA processing factor 19 |
| chr7_+_110731062 | 2.46 |
ENST00000308478.5
ENST00000451085.1 ENST00000422987.3 ENST00000421101.1 |
LRRN3
|
leucine rich repeat neuronal 3 |
| chr5_-_42811986 | 2.45 |
ENST00000511224.1
ENST00000507920.1 ENST00000510965.1 |
SEPP1
|
selenoprotein P, plasma, 1 |
| chr6_-_111804905 | 2.42 |
ENST00000358835.3
ENST00000435970.1 |
REV3L
|
REV3-like, polymerase (DNA directed), zeta, catalytic subunit |
| chr2_+_160590469 | 2.41 |
ENST00000409591.1
|
MARCH7
|
membrane-associated ring finger (C3HC4) 7, E3 ubiquitin protein ligase |
| chr12_+_123237321 | 2.37 |
ENST00000280557.6
ENST00000455982.2 |
DENR
|
density-regulated protein |
| chrX_-_9734004 | 2.32 |
ENST00000467482.1
ENST00000380929.2 |
GPR143
|
G protein-coupled receptor 143 |
| chrX_-_68385274 | 2.29 |
ENST00000374584.3
ENST00000590146.1 |
PJA1
|
praja ring finger 1, E3 ubiquitin protein ligase |
| chr2_+_86669118 | 2.28 |
ENST00000427678.1
ENST00000542128.1 |
KDM3A
|
lysine (K)-specific demethylase 3A |
| chr9_-_21187598 | 2.25 |
ENST00000421715.1
|
IFNA4
|
interferon, alpha 4 |
| chr8_+_104033277 | 2.24 |
ENST00000518857.1
ENST00000395862.3 |
ATP6V1C1
|
ATPase, H+ transporting, lysosomal 42kDa, V1 subunit C1 |
| chr14_-_21492113 | 2.17 |
ENST00000554094.1
|
NDRG2
|
NDRG family member 2 |
| chr5_-_111093167 | 2.13 |
ENST00000446294.2
ENST00000419114.2 |
NREP
|
neuronal regeneration related protein |
| chr20_+_57414743 | 2.13 |
ENST00000313949.7
|
GNAS
|
GNAS complex locus |
| chr2_+_70121075 | 2.11 |
ENST00000409116.1
|
SNRNP27
|
small nuclear ribonucleoprotein 27kDa (U4/U6.U5) |
| chr2_-_225811747 | 2.03 |
ENST00000409592.3
|
DOCK10
|
dedicator of cytokinesis 10 |
| chr10_+_45495898 | 2.01 |
ENST00000298299.3
|
ZNF22
|
zinc finger protein 22 |
| chr2_+_207630081 | 2.01 |
ENST00000236980.6
ENST00000418289.1 ENST00000402774.3 ENST00000403094.3 |
FASTKD2
|
FAST kinase domains 2 |
| chr4_+_70916119 | 1.98 |
ENST00000246896.3
ENST00000511674.1 |
HTN1
|
histatin 1 |
| chr2_+_106468204 | 1.97 |
ENST00000425756.1
ENST00000393349.2 |
NCK2
|
NCK adaptor protein 2 |
| chr9_+_2029019 | 1.95 |
ENST00000382194.1
|
SMARCA2
|
SWI/SNF related, matrix associated, actin dependent regulator of chromatin, subfamily a, member 2 |
| chr5_+_140227048 | 1.95 |
ENST00000532602.1
|
PCDHA9
|
protocadherin alpha 9 |
| chr11_-_128894053 | 1.93 |
ENST00000392657.3
|
ARHGAP32
|
Rho GTPase activating protein 32 |
| chr10_-_73848086 | 1.88 |
ENST00000536168.1
|
SPOCK2
|
sparc/osteonectin, cwcv and kazal-like domains proteoglycan (testican) 2 |
| chr4_+_69681710 | 1.87 |
ENST00000265403.7
ENST00000458688.2 |
UGT2B10
|
UDP glucuronosyltransferase 2 family, polypeptide B10 |
| chr10_+_115614370 | 1.87 |
ENST00000369301.3
|
NHLRC2
|
NHL repeat containing 2 |
| chr10_-_73848531 | 1.84 |
ENST00000373109.2
|
SPOCK2
|
sparc/osteonectin, cwcv and kazal-like domains proteoglycan (testican) 2 |
| chr16_+_56485402 | 1.81 |
ENST00000566157.1
ENST00000562150.1 ENST00000561646.1 ENST00000568397.1 |
OGFOD1
|
2-oxoglutarate and iron-dependent oxygenase domain containing 1 |
| chr1_-_212004090 | 1.80 |
ENST00000366997.4
|
LPGAT1
|
lysophosphatidylglycerol acyltransferase 1 |
| chr2_-_86850949 | 1.79 |
ENST00000237455.4
|
RNF103
|
ring finger protein 103 |
| chr17_+_55162453 | 1.71 |
ENST00000575322.1
ENST00000337714.3 ENST00000314126.3 |
AKAP1
|
A kinase (PRKA) anchor protein 1 |
| chr7_+_102937869 | 1.67 |
ENST00000249269.4
ENST00000428154.1 ENST00000420236.2 |
PMPCB
|
peptidase (mitochondrial processing) beta |
| chr12_+_20963647 | 1.63 |
ENST00000381545.3
|
SLCO1B3
|
solute carrier organic anion transporter family, member 1B3 |
| chr20_+_57414795 | 1.61 |
ENST00000371098.2
ENST00000371075.3 |
GNAS
|
GNAS complex locus |
| chr1_-_19426149 | 1.59 |
ENST00000429347.2
|
UBR4
|
ubiquitin protein ligase E3 component n-recognin 4 |
| chr17_-_9862772 | 1.56 |
ENST00000580865.1
ENST00000583882.1 |
GAS7
|
growth arrest-specific 7 |
| chr16_+_22501658 | 1.52 |
ENST00000415833.2
|
NPIPB5
|
nuclear pore complex interacting protein family, member B5 |
| chr9_-_179018 | 1.48 |
ENST00000431099.2
ENST00000382447.4 ENST00000382389.1 ENST00000377447.3 ENST00000314367.10 ENST00000356521.4 ENST00000382393.1 ENST00000377400.4 |
CBWD1
|
COBW domain containing 1 |
| chr14_+_78174414 | 1.48 |
ENST00000557342.1
ENST00000238688.5 ENST00000557623.1 ENST00000557431.1 ENST00000556831.1 ENST00000556375.1 ENST00000553981.1 |
SLIRP
|
SRA stem-loop interacting RNA binding protein |
| chr8_-_17579726 | 1.47 |
ENST00000381861.3
|
MTUS1
|
microtubule associated tumor suppressor 1 |
| chr9_-_69262509 | 1.42 |
ENST00000377449.1
ENST00000382399.4 ENST00000377439.1 ENST00000377441.1 ENST00000377457.5 |
CBWD6
|
COBW domain containing 6 |
| chr2_+_161993412 | 1.36 |
ENST00000259075.2
ENST00000432002.1 |
TANK
|
TRAF family member-associated NFKB activator |
| chr20_-_23860373 | 1.35 |
ENST00000304710.4
|
CST5
|
cystatin D |
| chr9_+_70856899 | 1.34 |
ENST00000377342.5
ENST00000478048.1 |
CBWD3
|
COBW domain containing 3 |
| chr9_+_131549610 | 1.30 |
ENST00000223865.8
|
TBC1D13
|
TBC1 domain family, member 13 |
| chr6_-_109702885 | 1.28 |
ENST00000504373.1
|
CD164
|
CD164 molecule, sialomucin |
| chr2_-_17981462 | 1.28 |
ENST00000402989.1
ENST00000428868.1 |
SMC6
|
structural maintenance of chromosomes 6 |
| chrX_-_16887963 | 1.27 |
ENST00000380084.4
|
RBBP7
|
retinoblastoma binding protein 7 |
| chr22_-_32651326 | 1.24 |
ENST00000266086.4
|
SLC5A4
|
solute carrier family 5 (glucose activated ion channel), member 4 |
| chr13_-_52027134 | 1.22 |
ENST00000311234.4
ENST00000425000.1 ENST00000463928.1 ENST00000442263.3 ENST00000398119.2 |
INTS6
|
integrator complex subunit 6 |
| chrX_+_120181457 | 1.21 |
ENST00000328078.1
|
GLUD2
|
glutamate dehydrogenase 2 |
| chr12_-_124118296 | 1.20 |
ENST00000424014.2
ENST00000537073.1 |
EIF2B1
|
eukaryotic translation initiation factor 2B, subunit 1 alpha, 26kDa |
| chr15_-_55541227 | 1.18 |
ENST00000566877.1
|
RAB27A
|
RAB27A, member RAS oncogene family |
| chr3_+_138340049 | 1.17 |
ENST00000464668.1
|
FAIM
|
Fas apoptotic inhibitory molecule |
| chr7_-_22539771 | 1.17 |
ENST00000406890.2
ENST00000424363.1 |
STEAP1B
|
STEAP family member 1B |
| chr12_-_10605929 | 1.16 |
ENST00000347831.5
ENST00000359151.3 |
KLRC1
|
killer cell lectin-like receptor subfamily C, member 1 |
| chr12_-_110906027 | 1.15 |
ENST00000537466.2
ENST00000550974.1 ENST00000228827.3 |
GPN3
|
GPN-loop GTPase 3 |
| chr5_-_145562147 | 1.13 |
ENST00000545646.1
ENST00000274562.9 ENST00000510191.1 ENST00000394434.2 |
LARS
|
leucyl-tRNA synthetase |
| chr1_+_35734562 | 1.12 |
ENST00000314607.6
ENST00000373297.2 |
ZMYM4
|
zinc finger, MYM-type 4 |
| chr7_-_44122063 | 1.11 |
ENST00000335195.6
ENST00000395831.3 ENST00000414235.1 ENST00000452049.1 ENST00000242248.5 |
POLM
|
polymerase (DNA directed), mu |
| chr12_+_20963632 | 1.09 |
ENST00000540853.1
ENST00000261196.2 |
SLCO1B3
|
solute carrier organic anion transporter family, member 1B3 |
| chr4_+_71248795 | 1.06 |
ENST00000304915.3
|
SMR3B
|
submaxillary gland androgen regulated protein 3B |
| chr4_-_103749313 | 1.05 |
ENST00000394803.5
|
UBE2D3
|
ubiquitin-conjugating enzyme E2D 3 |
| chr9_+_103947311 | 1.04 |
ENST00000395056.2
|
LPPR1
|
Lipid phosphate phosphatase-related protein type 1 |
| chr9_-_70490107 | 1.04 |
ENST00000377395.4
ENST00000429800.2 ENST00000430059.2 ENST00000377384.1 ENST00000382405.3 |
CBWD5
|
COBW domain containing 5 |
| chr4_+_155484103 | 1.02 |
ENST00000302068.4
|
FGB
|
fibrinogen beta chain |
| chr1_+_81771806 | 1.01 |
ENST00000370721.1
ENST00000370727.1 ENST00000370725.1 ENST00000370723.1 ENST00000370728.1 ENST00000370730.1 |
LPHN2
|
latrophilin 2 |
| chr11_+_125496619 | 0.99 |
ENST00000532669.1
ENST00000278916.3 |
CHEK1
|
checkpoint kinase 1 |
| chr11_+_43333513 | 0.98 |
ENST00000534695.1
ENST00000455725.2 ENST00000531273.1 ENST00000420461.2 ENST00000378852.3 ENST00000534600.1 |
API5
|
apoptosis inhibitor 5 |
| chr2_+_114195268 | 0.98 |
ENST00000259199.4
ENST00000416503.2 ENST00000433343.2 |
CBWD2
|
COBW domain containing 2 |
| chr10_-_96829246 | 0.98 |
ENST00000371270.3
ENST00000535898.1 ENST00000539050.1 |
CYP2C8
|
cytochrome P450, family 2, subfamily C, polypeptide 8 |
| chr19_-_48894104 | 0.96 |
ENST00000597017.1
|
KDELR1
|
KDEL (Lys-Asp-Glu-Leu) endoplasmic reticulum protein retention receptor 1 |
| chr2_+_109204909 | 0.96 |
ENST00000393310.1
|
LIMS1
|
LIM and senescent cell antigen-like domains 1 |
| chr3_+_112709804 | 0.94 |
ENST00000383677.3
|
GTPBP8
|
GTP-binding protein 8 (putative) |
| chr5_-_125930929 | 0.93 |
ENST00000553117.1
ENST00000447989.2 ENST00000409134.3 |
ALDH7A1
|
aldehyde dehydrogenase 7 family, member A1 |
| chr8_-_30670384 | 0.93 |
ENST00000221138.4
ENST00000518243.1 |
PPP2CB
|
protein phosphatase 2, catalytic subunit, beta isozyme |
| chr11_+_22688150 | 0.92 |
ENST00000454584.2
|
GAS2
|
growth arrest-specific 2 |
| chr3_+_69812701 | 0.88 |
ENST00000472437.1
|
MITF
|
microphthalmia-associated transcription factor |
| chr18_+_34124507 | 0.88 |
ENST00000591635.1
|
FHOD3
|
formin homology 2 domain containing 3 |
| chr13_+_33160553 | 0.87 |
ENST00000315596.10
|
PDS5B
|
PDS5, regulator of cohesion maintenance, homolog B (S. cerevisiae) |
| chr5_-_42812143 | 0.84 |
ENST00000514985.1
|
SEPP1
|
selenoprotein P, plasma, 1 |
| chr1_+_146714291 | 0.74 |
ENST00000431239.1
ENST00000369259.3 ENST00000369258.4 ENST00000361293.5 |
CHD1L
|
chromodomain helicase DNA binding protein 1-like |
| chr1_+_47603109 | 0.74 |
ENST00000371890.3
ENST00000294337.3 ENST00000371891.3 |
CYP4A22
|
cytochrome P450, family 4, subfamily A, polypeptide 22 |
| chr10_-_115614127 | 0.73 |
ENST00000369305.1
|
DCLRE1A
|
DNA cross-link repair 1A |
| chr16_+_28505955 | 0.72 |
ENST00000564831.1
ENST00000328423.5 ENST00000431282.1 |
APOBR
|
apolipoprotein B receptor |
| chr6_+_13272904 | 0.71 |
ENST00000379335.3
ENST00000379329.1 |
PHACTR1
|
phosphatase and actin regulator 1 |
| chr2_+_103035102 | 0.71 |
ENST00000264260.2
|
IL18RAP
|
interleukin 18 receptor accessory protein |
| chr5_-_135290705 | 0.69 |
ENST00000274507.1
|
LECT2
|
leukocyte cell-derived chemotaxin 2 |
| chr4_-_103749105 | 0.67 |
ENST00000394801.4
ENST00000394804.2 |
UBE2D3
|
ubiquitin-conjugating enzyme E2D 3 |
| chr11_+_73498898 | 0.67 |
ENST00000535529.1
ENST00000497094.2 ENST00000411840.2 ENST00000535277.1 ENST00000398483.3 ENST00000542303.1 |
MRPL48
|
mitochondrial ribosomal protein L48 |
| chr2_+_202047596 | 0.66 |
ENST00000286186.6
ENST00000360132.3 |
CASP10
|
caspase 10, apoptosis-related cysteine peptidase |
| chr19_+_21106081 | 0.65 |
ENST00000300540.3
ENST00000595854.1 ENST00000601284.1 ENST00000328178.8 ENST00000599885.1 ENST00000596476.1 ENST00000345030.6 |
ZNF85
|
zinc finger protein 85 |
| chr2_+_109271481 | 0.64 |
ENST00000542845.1
ENST00000393314.2 |
LIMS1
|
LIM and senescent cell antigen-like domains 1 |
| chr2_-_8723918 | 0.63 |
ENST00000454224.1
|
AC011747.4
|
AC011747.4 |
| chr11_+_89764274 | 0.62 |
ENST00000448984.1
ENST00000432771.1 |
TRIM49C
|
tripartite motif containing 49C |
| chr11_-_89541743 | 0.61 |
ENST00000329758.1
|
TRIM49
|
tripartite motif containing 49 |
| chr2_-_70475701 | 0.59 |
ENST00000282574.4
|
TIA1
|
TIA1 cytotoxic granule-associated RNA binding protein |
| chr9_+_131549483 | 0.59 |
ENST00000372648.5
ENST00000539497.1 |
TBC1D13
|
TBC1 domain family, member 13 |
| chr12_-_10573149 | 0.55 |
ENST00000381904.2
ENST00000381903.2 ENST00000396439.2 |
KLRC3
|
killer cell lectin-like receptor subfamily C, member 3 |
| chr3_-_38992052 | 0.55 |
ENST00000302328.3
ENST00000450244.1 ENST00000444237.2 |
SCN11A
|
sodium channel, voltage-gated, type XI, alpha subunit |
| chr12_-_104234966 | 0.55 |
ENST00000392876.3
|
NT5DC3
|
5'-nucleotidase domain containing 3 |
| chr5_+_175288631 | 0.54 |
ENST00000509837.1
|
CPLX2
|
complexin 2 |
| chr15_+_52155001 | 0.54 |
ENST00000544199.1
|
TMOD3
|
tropomodulin 3 (ubiquitous) |
| chr19_+_30433372 | 0.53 |
ENST00000312051.6
|
URI1
|
URI1, prefoldin-like chaperone |
| chr11_+_125496400 | 0.52 |
ENST00000524737.1
|
CHEK1
|
checkpoint kinase 1 |
| chr11_+_114310102 | 0.51 |
ENST00000265881.5
|
REXO2
|
RNA exonuclease 2 |
| chrY_-_6740649 | 0.51 |
ENST00000383036.1
ENST00000383037.4 |
AMELY
|
amelogenin, Y-linked |
| chr4_+_88529681 | 0.50 |
ENST00000399271.1
|
DSPP
|
dentin sialophosphoprotein |
| chrX_+_41193407 | 0.50 |
ENST00000457138.2
ENST00000441189.2 |
DDX3X
|
DEAD (Asp-Glu-Ala-Asp) box helicase 3, X-linked |
| chr17_-_40288449 | 0.50 |
ENST00000552162.1
ENST00000550504.1 |
RAB5C
|
RAB5C, member RAS oncogene family |
| chr19_-_54850417 | 0.49 |
ENST00000291759.4
|
LILRA4
|
leukocyte immunoglobulin-like receptor, subfamily A (with TM domain), member 4 |
| chr2_+_233390890 | 0.45 |
ENST00000258385.3
ENST00000536614.1 ENST00000457943.2 |
CHRND
|
cholinergic receptor, nicotinic, delta (muscle) |
| chr6_+_166945369 | 0.45 |
ENST00000598601.1
|
Z98049.1
|
CDNA FLJ25492 fis, clone CBR01389; Uncharacterized protein |
| chr2_+_109237717 | 0.45 |
ENST00000409441.1
|
LIMS1
|
LIM and senescent cell antigen-like domains 1 |
| chr15_-_90222642 | 0.44 |
ENST00000430628.2
|
PLIN1
|
perilipin 1 |
| chr8_-_110986918 | 0.44 |
ENST00000297404.1
|
KCNV1
|
potassium channel, subfamily V, member 1 |
| chr9_-_104198042 | 0.43 |
ENST00000374855.4
|
ALDOB
|
aldolase B, fructose-bisphosphate |
| chr12_-_21757774 | 0.43 |
ENST00000261195.2
|
GYS2
|
glycogen synthase 2 (liver) |
| chr2_-_231989808 | 0.43 |
ENST00000258400.3
|
HTR2B
|
5-hydroxytryptamine (serotonin) receptor 2B, G protein-coupled |
| chr15_-_90222610 | 0.42 |
ENST00000300055.5
|
PLIN1
|
perilipin 1 |
| chr12_-_27167233 | 0.41 |
ENST00000535819.1
ENST00000543803.1 ENST00000535423.1 ENST00000539741.1 ENST00000343028.4 ENST00000545600.1 ENST00000543088.1 |
TM7SF3
|
transmembrane 7 superfamily member 3 |
| chrX_+_43515467 | 0.41 |
ENST00000338702.3
ENST00000542639.1 |
MAOA
|
monoamine oxidase A |
| chr12_-_8803128 | 0.40 |
ENST00000543467.1
|
MFAP5
|
microfibrillar associated protein 5 |
| chr12_-_11091862 | 0.39 |
ENST00000537503.1
|
TAS2R14
|
taste receptor, type 2, member 14 |
| chrX_+_65382433 | 0.38 |
ENST00000374727.3
|
HEPH
|
hephaestin |
| chr7_+_141811539 | 0.38 |
ENST00000550469.2
ENST00000477922.3 |
RP11-1220K2.2
|
Putative inactive maltase-glucoamylase-like protein LOC93432 |
| chr8_-_93029865 | 0.38 |
ENST00000422361.2
|
RUNX1T1
|
runt-related transcription factor 1; translocated to, 1 (cyclin D-related) |
| chr4_+_155484155 | 0.36 |
ENST00000509493.1
|
FGB
|
fibrinogen beta chain |
| chr17_+_58018269 | 0.34 |
ENST00000591035.1
|
RP11-178C3.1
|
Uncharacterized protein |
| chr5_-_16738451 | 0.34 |
ENST00000274203.9
ENST00000515803.1 |
MYO10
|
myosin X |
| chr4_-_69536346 | 0.33 |
ENST00000338206.5
|
UGT2B15
|
UDP glucuronosyltransferase 2 family, polypeptide B15 |
| chr6_-_88876058 | 0.33 |
ENST00000369501.2
|
CNR1
|
cannabinoid receptor 1 (brain) |
| chr4_-_103748880 | 0.33 |
ENST00000453744.2
ENST00000349311.8 |
UBE2D3
|
ubiquitin-conjugating enzyme E2D 3 |
| chr4_+_71226468 | 0.31 |
ENST00000226460.4
|
SMR3A
|
submaxillary gland androgen regulated protein 3A |
Network of associatons between targets according to the STRING database.

First level regulatory network of HOXC9
Gene Ontology Analysis
Gene overrepresentation in biological_process category:
| Log-likelihood per target | Total log-likelihood | Term | Description |
|---|---|---|---|
| 3.0 | 9.0 | GO:0006428 | isoleucyl-tRNA aminoacylation(GO:0006428) |
| 1.9 | 5.8 | GO:0017186 | peptidyl-pyroglutamic acid biosynthetic process, using glutaminyl-peptide cyclotransferase(GO:0017186) |
| 1.5 | 7.6 | GO:1990034 | calcium ion export from cell(GO:1990034) |
| 1.3 | 5.3 | GO:0021564 | vagus nerve development(GO:0021564) |
| 1.3 | 5.1 | GO:0097089 | methyl-branched fatty acid metabolic process(GO:0097089) |
| 1.1 | 3.2 | GO:0043490 | malate-aspartate shuttle(GO:0043490) |
| 1.0 | 9.6 | GO:0051612 | negative regulation of neurotransmitter uptake(GO:0051581) serotonin uptake(GO:0051610) regulation of serotonin uptake(GO:0051611) negative regulation of serotonin uptake(GO:0051612) |
| 0.8 | 2.4 | GO:0002188 | translation reinitiation(GO:0002188) |
| 0.8 | 6.8 | GO:0003190 | atrioventricular valve formation(GO:0003190) |
| 0.8 | 2.3 | GO:0007290 | spermatid nucleus elongation(GO:0007290) |
| 0.7 | 4.3 | GO:0051661 | maintenance of centrosome location(GO:0051661) |
| 0.7 | 2.7 | GO:0046502 | uroporphyrinogen III biosynthetic process(GO:0006780) uroporphyrinogen III metabolic process(GO:0046502) |
| 0.6 | 3.2 | GO:0042816 | vitamin B6 metabolic process(GO:0042816) |
| 0.6 | 2.3 | GO:0043324 | eye pigment biosynthetic process(GO:0006726) eye pigment metabolic process(GO:0042441) pigment metabolic process involved in developmental pigmentation(GO:0043324) pigment metabolic process involved in pigmentation(GO:0043474) regulation of melanosome transport(GO:1902908) |
| 0.5 | 3.7 | GO:0040032 | post-embryonic body morphogenesis(GO:0040032) |
| 0.5 | 2.6 | GO:0071874 | cellular response to norepinephrine stimulus(GO:0071874) |
| 0.4 | 3.0 | GO:0008218 | bioluminescence(GO:0008218) |
| 0.4 | 1.3 | GO:0010286 | heat acclimation(GO:0010286) cellular heat acclimation(GO:0070370) |
| 0.4 | 5.5 | GO:0000492 | box C/D snoRNP assembly(GO:0000492) |
| 0.4 | 2.5 | GO:0000393 | spliceosomal conformational changes to generate catalytic conformation(GO:0000393) |
| 0.4 | 3.3 | GO:0032510 | endosome to lysosome transport via multivesicular body sorting pathway(GO:0032510) |
| 0.4 | 2.0 | GO:0061668 | mitochondrial ribosome assembly(GO:0061668) mitochondrial large ribosomal subunit assembly(GO:1902775) |
| 0.4 | 9.6 | GO:0045899 | positive regulation of RNA polymerase II transcriptional preinitiation complex assembly(GO:0045899) |
| 0.4 | 1.1 | GO:0044376 | RNA polymerase II complex import to nucleus(GO:0044376) RNA polymerase III complex localization to nucleus(GO:1990022) |
| 0.4 | 2.7 | GO:0033029 | regulation of neutrophil apoptotic process(GO:0033029) common myeloid progenitor cell proliferation(GO:0035726) |
| 0.4 | 1.1 | GO:0006425 | glutaminyl-tRNA aminoacylation(GO:0006425) valyl-tRNA aminoacylation(GO:0006438) |
| 0.4 | 12.1 | GO:1901687 | glutathione derivative metabolic process(GO:1901685) glutathione derivative biosynthetic process(GO:1901687) |
| 0.4 | 1.5 | GO:0000960 | mitochondrial RNA catabolic process(GO:0000957) regulation of mitochondrial RNA catabolic process(GO:0000960) |
| 0.4 | 5.7 | GO:0090084 | negative regulation of inclusion body assembly(GO:0090084) |
| 0.4 | 2.8 | GO:0051388 | positive regulation of neurotrophin TRK receptor signaling pathway(GO:0051388) |
| 0.3 | 2.0 | GO:0036493 | positive regulation of translation in response to endoplasmic reticulum stress(GO:0036493) |
| 0.3 | 4.7 | GO:0048245 | eosinophil chemotaxis(GO:0048245) |
| 0.3 | 2.8 | GO:1904352 | positive regulation of protein catabolic process in the vacuole(GO:1904352) |
| 0.3 | 1.8 | GO:0035407 | histone H3-T11 phosphorylation(GO:0035407) |
| 0.2 | 1.7 | GO:0002933 | lipid hydroxylation(GO:0002933) |
| 0.2 | 1.2 | GO:0098706 | ferric iron import into cell(GO:0097461) ferric iron import across plasma membrane(GO:0098706) |
| 0.2 | 2.7 | GO:0048172 | regulation of short-term neuronal synaptic plasticity(GO:0048172) |
| 0.2 | 0.2 | GO:0033216 | ferric iron import(GO:0033216) |
| 0.2 | 4.7 | GO:0046339 | diacylglycerol metabolic process(GO:0046339) |
| 0.2 | 1.2 | GO:1903435 | positive regulation of constitutive secretory pathway(GO:1903435) |
| 0.2 | 6.4 | GO:0090383 | phagosome acidification(GO:0090383) |
| 0.2 | 1.2 | GO:0006537 | glutamate biosynthetic process(GO:0006537) |
| 0.2 | 2.0 | GO:0002315 | marginal zone B cell differentiation(GO:0002315) |
| 0.2 | 6.2 | GO:0006376 | mRNA splice site selection(GO:0006376) |
| 0.2 | 3.6 | GO:0031163 | iron-sulfur cluster assembly(GO:0016226) metallo-sulfur cluster assembly(GO:0031163) |
| 0.2 | 3.6 | GO:0007095 | mitotic G2 DNA damage checkpoint(GO:0007095) |
| 0.2 | 4.6 | GO:0061003 | positive regulation of dendritic spine morphogenesis(GO:0061003) |
| 0.2 | 22.0 | GO:0030183 | B cell differentiation(GO:0030183) |
| 0.1 | 6.1 | GO:0050832 | defense response to fungus(GO:0050832) |
| 0.1 | 6.1 | GO:0000188 | inactivation of MAPK activity(GO:0000188) |
| 0.1 | 0.4 | GO:0006001 | fructose catabolic process(GO:0006001) fructose catabolic process to hydroxyacetone phosphate and glyceraldehyde-3-phosphate(GO:0061624) |
| 0.1 | 2.3 | GO:0034063 | stress granule assembly(GO:0034063) |
| 0.1 | 2.2 | GO:0090361 | platelet-derived growth factor production(GO:0090360) regulation of platelet-derived growth factor production(GO:0090361) |
| 0.1 | 0.9 | GO:0042426 | choline catabolic process(GO:0042426) |
| 0.1 | 4.1 | GO:0051642 | centrosome localization(GO:0051642) |
| 0.1 | 1.0 | GO:2000270 | negative regulation of fibroblast apoptotic process(GO:2000270) |
| 0.1 | 1.7 | GO:0006122 | mitochondrial electron transport, ubiquinol to cytochrome c(GO:0006122) |
| 0.1 | 0.3 | GO:0099541 | trans-synaptic signaling by lipid(GO:0099541) trans-synaptic signaling by endocannabinoid(GO:0099542) trans-synaptic signaling by lipid, modulating synaptic transmission(GO:0099552) trans-synaptic signaling by endocannabinoid, modulating synaptic transmission(GO:0099553) |
| 0.1 | 1.7 | GO:1904380 | endoplasmic reticulum mannose trimming(GO:1904380) |
| 0.1 | 1.8 | GO:0036148 | phosphatidylglycerol acyl-chain remodeling(GO:0036148) |
| 0.1 | 0.3 | GO:0019482 | beta-alanine metabolic process(GO:0019482) |
| 0.1 | 4.2 | GO:0061512 | protein localization to cilium(GO:0061512) |
| 0.1 | 2.4 | GO:0002643 | regulation of tolerance induction(GO:0002643) |
| 0.1 | 2.5 | GO:0042359 | vitamin D metabolic process(GO:0042359) |
| 0.1 | 0.5 | GO:0051694 | pointed-end actin filament capping(GO:0051694) |
| 0.1 | 1.0 | GO:0006621 | protein retention in ER lumen(GO:0006621) |
| 0.1 | 0.4 | GO:0010513 | positive regulation of phosphatidylinositol biosynthetic process(GO:0010513) |
| 0.1 | 0.7 | GO:0031848 | protection from non-homologous end joining at telomere(GO:0031848) |
| 0.1 | 2.4 | GO:0042276 | error-prone translesion synthesis(GO:0042276) |
| 0.1 | 1.4 | GO:0044320 | cellular response to leptin stimulus(GO:0044320) |
| 0.1 | 3.5 | GO:0061458 | reproductive system development(GO:0061458) |
| 0.1 | 0.6 | GO:1903608 | protein localization to cytoplasmic stress granule(GO:1903608) |
| 0.1 | 2.7 | GO:0043252 | sodium-independent organic anion transport(GO:0043252) |
| 0.1 | 1.2 | GO:0016180 | snRNA processing(GO:0016180) |
| 0.1 | 0.5 | GO:0000722 | telomere maintenance via recombination(GO:0000722) |
| 0.1 | 0.9 | GO:0051639 | actin filament network formation(GO:0051639) |
| 0.1 | 2.2 | GO:0051894 | positive regulation of focal adhesion assembly(GO:0051894) |
| 0.0 | 6.2 | GO:0046854 | phosphatidylinositol phosphorylation(GO:0046854) |
| 0.0 | 1.2 | GO:1904659 | hexose transmembrane transport(GO:0035428) glucose transmembrane transport(GO:1904659) |
| 0.0 | 0.7 | GO:0034447 | very-low-density lipoprotein particle clearance(GO:0034447) |
| 0.0 | 0.2 | GO:0050717 | positive regulation of interleukin-1 alpha secretion(GO:0050717) |
| 0.0 | 0.2 | GO:0010133 | proline catabolic process to glutamate(GO:0010133) |
| 0.0 | 0.5 | GO:0031915 | positive regulation of synaptic plasticity(GO:0031915) |
| 0.0 | 0.5 | GO:0048227 | plasma membrane to endosome transport(GO:0048227) |
| 0.0 | 6.2 | GO:0007416 | synapse assembly(GO:0007416) |
| 0.0 | 0.2 | GO:0015860 | purine nucleoside transmembrane transport(GO:0015860) |
| 0.0 | 0.7 | GO:0000717 | nucleotide-excision repair, DNA duplex unwinding(GO:0000717) |
| 0.0 | 5.2 | GO:0019221 | cytokine-mediated signaling pathway(GO:0019221) |
| 0.0 | 0.9 | GO:2000144 | positive regulation of DNA-templated transcription, initiation(GO:2000144) |
| 0.0 | 2.5 | GO:0042246 | tissue regeneration(GO:0042246) |
| 0.0 | 1.3 | GO:0007157 | heterophilic cell-cell adhesion via plasma membrane cell adhesion molecules(GO:0007157) |
| 0.0 | 0.1 | GO:0042264 | peptidyl-aspartic acid hydroxylation(GO:0042264) |
| 0.0 | 1.0 | GO:0010738 | regulation of protein kinase A signaling(GO:0010738) |
| 0.0 | 3.6 | GO:0007062 | sister chromatid cohesion(GO:0007062) |
| 0.0 | 0.2 | GO:0048630 | skeletal muscle tissue growth(GO:0048630) |
| 0.0 | 0.4 | GO:0042420 | dopamine catabolic process(GO:0042420) |
| 0.0 | 1.2 | GO:0014003 | oligodendrocyte development(GO:0014003) |
| 0.0 | 1.9 | GO:0031338 | regulation of vesicle fusion(GO:0031338) |
| 0.0 | 0.8 | GO:0090503 | RNA phosphodiester bond hydrolysis, exonucleolytic(GO:0090503) |
| 0.0 | 0.5 | GO:0034505 | tooth mineralization(GO:0034505) |
| 0.0 | 2.7 | GO:0007498 | mesoderm development(GO:0007498) |
| 0.0 | 1.2 | GO:0051865 | protein autoubiquitination(GO:0051865) |
| 0.0 | 1.7 | GO:0042476 | odontogenesis(GO:0042476) |
| 0.0 | 0.3 | GO:0006516 | glycoprotein catabolic process(GO:0006516) |
| 0.0 | 0.2 | GO:0070129 | regulation of mitochondrial translation(GO:0070129) |
| 0.0 | 1.4 | GO:0007286 | spermatid development(GO:0007286) |
| 0.0 | 0.6 | GO:0051930 | regulation of sensory perception of pain(GO:0051930) regulation of sensory perception(GO:0051931) |
| 0.0 | 4.1 | GO:0006470 | protein dephosphorylation(GO:0006470) |
| 0.0 | 2.7 | GO:0043406 | positive regulation of MAP kinase activity(GO:0043406) |
| 0.0 | 0.2 | GO:0034629 | cellular protein complex localization(GO:0034629) |
| 0.0 | 0.4 | GO:0060216 | definitive hemopoiesis(GO:0060216) |
| 0.0 | 0.4 | GO:0045599 | negative regulation of fat cell differentiation(GO:0045599) |
Gene overrepresentation in cellular_component category:
| Log-likelihood per target | Total log-likelihood | Term | Description |
|---|---|---|---|
| 1.3 | 6.4 | GO:0000221 | vacuolar proton-transporting V-type ATPase, V1 domain(GO:0000221) |
| 0.8 | 5.7 | GO:0070852 | cell body fiber(GO:0070852) |
| 0.8 | 9.6 | GO:0031595 | nuclear proteasome complex(GO:0031595) |
| 0.8 | 3.8 | GO:0000444 | MIS12/MIND type complex(GO:0000444) |
| 0.7 | 5.5 | GO:0070761 | pre-snoRNP complex(GO:0070761) |
| 0.6 | 4.3 | GO:0036449 | microtubule minus-end(GO:0036449) |
| 0.5 | 2.5 | GO:0071012 | catalytic step 1 spliceosome(GO:0071012) |
| 0.5 | 5.3 | GO:0005614 | interstitial matrix(GO:0005614) |
| 0.5 | 10.1 | GO:0017101 | aminoacyl-tRNA synthetase multienzyme complex(GO:0017101) |
| 0.3 | 7.6 | GO:0032591 | dendritic spine membrane(GO:0032591) |
| 0.3 | 1.3 | GO:0030915 | Smc5-Smc6 complex(GO:0030915) |
| 0.3 | 6.8 | GO:0044295 | axonal growth cone(GO:0044295) |
| 0.3 | 2.6 | GO:1990812 | growth cone lamellipodium(GO:1990761) growth cone filopodium(GO:1990812) |
| 0.3 | 3.3 | GO:0000815 | ESCRT III complex(GO:0000815) |
| 0.2 | 4.7 | GO:0031045 | dense core granule(GO:0031045) |
| 0.2 | 6.3 | GO:0035371 | microtubule plus-end(GO:0035371) |
| 0.2 | 4.7 | GO:0071004 | U2-type prespliceosome(GO:0071004) |
| 0.2 | 3.5 | GO:0033162 | melanosome membrane(GO:0033162) chitosome(GO:0045009) |
| 0.2 | 2.4 | GO:0042575 | DNA polymerase complex(GO:0042575) |
| 0.2 | 1.7 | GO:0005750 | mitochondrial respiratory chain complex III(GO:0005750) respiratory chain complex III(GO:0045275) |
| 0.1 | 1.2 | GO:0005851 | eukaryotic translation initiation factor 2B complex(GO:0005851) |
| 0.1 | 1.2 | GO:0032039 | integrator complex(GO:0032039) |
| 0.1 | 4.1 | GO:0005868 | cytoplasmic dynein complex(GO:0005868) |
| 0.1 | 0.3 | GO:0031265 | death-inducing signaling complex(GO:0031264) CD95 death-inducing signaling complex(GO:0031265) |
| 0.1 | 1.4 | GO:0005577 | fibrinogen complex(GO:0005577) |
| 0.1 | 4.9 | GO:0005782 | peroxisomal matrix(GO:0005782) microbody lumen(GO:0031907) |
| 0.1 | 0.6 | GO:0097165 | nuclear stress granule(GO:0097165) |
| 0.1 | 2.0 | GO:0071564 | npBAF complex(GO:0071564) |
| 0.1 | 0.5 | GO:0070554 | synaptobrevin 2-SNAP-25-syntaxin-3-complexin complex(GO:0070554) |
| 0.1 | 0.2 | GO:0031905 | early endosome lumen(GO:0031905) |
| 0.1 | 1.0 | GO:0030663 | COPI-coated vesicle membrane(GO:0030663) |
| 0.1 | 5.3 | GO:1904724 | specific granule lumen(GO:0035580) tertiary granule lumen(GO:1904724) |
| 0.1 | 3.1 | GO:0005834 | heterotrimeric G-protein complex(GO:0005834) |
| 0.1 | 1.7 | GO:0044322 | endoplasmic reticulum quality control compartment(GO:0044322) |
| 0.0 | 1.3 | GO:0035098 | ESC/E(Z) complex(GO:0035098) |
| 0.0 | 2.0 | GO:0009295 | nucleoid(GO:0009295) mitochondrial nucleoid(GO:0042645) |
| 0.0 | 6.7 | GO:0043197 | dendritic spine(GO:0043197) |
| 0.0 | 0.6 | GO:0001518 | voltage-gated sodium channel complex(GO:0001518) |
| 0.0 | 0.2 | GO:0097179 | protease inhibitor complex(GO:0097179) |
| 0.0 | 4.0 | GO:0005578 | proteinaceous extracellular matrix(GO:0005578) |
| 0.0 | 0.7 | GO:0042627 | chylomicron(GO:0042627) |
| 0.0 | 0.9 | GO:0000159 | protein phosphatase type 2A complex(GO:0000159) |
| 0.0 | 24.4 | GO:0048471 | perinuclear region of cytoplasm(GO:0048471) |
| 0.0 | 1.4 | GO:0005865 | striated muscle thin filament(GO:0005865) |
| 0.0 | 0.2 | GO:0061700 | GATOR2 complex(GO:0061700) |
| 0.0 | 0.5 | GO:0005852 | eukaryotic translation initiation factor 3 complex(GO:0005852) |
| 0.0 | 8.6 | GO:0045121 | membrane raft(GO:0045121) |
| 0.0 | 1.9 | GO:0031093 | platelet alpha granule lumen(GO:0031093) |
| 0.0 | 0.3 | GO:0000974 | Prp19 complex(GO:0000974) |
| 0.0 | 1.6 | GO:0101003 | ficolin-1-rich granule membrane(GO:0101003) |
| 0.0 | 4.3 | GO:0030027 | lamellipodium(GO:0030027) |
| 0.0 | 3.2 | GO:0043209 | myelin sheath(GO:0043209) |
| 0.0 | 0.4 | GO:0034451 | centriolar satellite(GO:0034451) |
| 0.0 | 1.8 | GO:0000794 | condensed nuclear chromosome(GO:0000794) |
| 0.0 | 0.5 | GO:0005665 | DNA-directed RNA polymerase II, core complex(GO:0005665) |
| 0.0 | 0.4 | GO:0001527 | microfibril(GO:0001527) fibril(GO:0043205) |
| 0.0 | 0.7 | GO:0005762 | organellar large ribosomal subunit(GO:0000315) mitochondrial large ribosomal subunit(GO:0005762) |
| 0.0 | 5.5 | GO:0043235 | receptor complex(GO:0043235) |
| 0.0 | 0.1 | GO:0032541 | cortical endoplasmic reticulum(GO:0032541) |
| 0.0 | 0.8 | GO:0005811 | lipid particle(GO:0005811) |
| 0.0 | 0.8 | GO:0010494 | cytoplasmic stress granule(GO:0010494) |
| 0.0 | 1.5 | GO:0016323 | basolateral plasma membrane(GO:0016323) |
| 0.0 | 3.7 | GO:0005874 | microtubule(GO:0005874) |
| 0.0 | 0.8 | GO:0005758 | mitochondrial intermembrane space(GO:0005758) |
| 0.0 | 3.7 | GO:0005929 | cilium(GO:0005929) |
| 0.0 | 1.4 | GO:0014069 | postsynaptic density(GO:0014069) postsynaptic specialization(GO:0099572) |
Gene overrepresentation in molecular_function category:
| Log-likelihood per target | Total log-likelihood | Term | Description |
|---|---|---|---|
| 3.0 | 9.0 | GO:0004822 | isoleucine-tRNA ligase activity(GO:0004822) |
| 1.9 | 5.8 | GO:0016603 | glutaminyl-peptide cyclotransferase activity(GO:0016603) |
| 1.1 | 6.4 | GO:0008553 | hydrogen-exporting ATPase activity, phosphorylative mechanism(GO:0008553) |
| 0.9 | 9.6 | GO:0036402 | proteasome-activating ATPase activity(GO:0036402) |
| 0.6 | 3.2 | GO:0015183 | L-aspartate transmembrane transporter activity(GO:0015183) |
| 0.4 | 2.7 | GO:0008440 | inositol-1,4,5-trisphosphate 3-kinase activity(GO:0008440) |
| 0.4 | 4.2 | GO:0010314 | phosphatidylinositol-5-phosphate binding(GO:0010314) |
| 0.4 | 5.5 | GO:0001075 | transcription factor activity, RNA polymerase II core promoter sequence-specific binding involved in preinitiation complex assembly(GO:0001075) |
| 0.4 | 1.1 | GO:0004819 | glutamine-tRNA ligase activity(GO:0004819) valine-tRNA ligase activity(GO:0004832) |
| 0.3 | 3.7 | GO:0051430 | corticotropin-releasing hormone receptor binding(GO:0051429) corticotropin-releasing hormone receptor 1 binding(GO:0051430) |
| 0.3 | 1.2 | GO:0005412 | glucose:sodium symporter activity(GO:0005412) |
| 0.3 | 6.9 | GO:0031418 | L-ascorbic acid binding(GO:0031418) |
| 0.3 | 1.2 | GO:0016639 | oxidoreductase activity, acting on the CH-NH2 group of donors, NAD or NADP as acceptor(GO:0016639) |
| 0.3 | 1.8 | GO:0035402 | histone kinase activity (H3-T11 specific)(GO:0035402) |
| 0.3 | 1.2 | GO:0008823 | cupric reductase activity(GO:0008823) ferric-chelate reductase (NADPH) activity(GO:0052851) |
| 0.3 | 2.7 | GO:0005432 | calcium:sodium antiporter activity(GO:0005432) |
| 0.3 | 5.7 | GO:0070628 | proteasome binding(GO:0070628) |
| 0.3 | 4.7 | GO:0004143 | diacylglycerol kinase activity(GO:0004143) |
| 0.3 | 7.6 | GO:0005388 | calcium-transporting ATPase activity(GO:0005388) |
| 0.3 | 2.6 | GO:0051425 | PTB domain binding(GO:0051425) |
| 0.2 | 12.1 | GO:0004364 | glutathione transferase activity(GO:0004364) |
| 0.2 | 1.0 | GO:0005046 | KDEL sequence binding(GO:0005046) |
| 0.2 | 1.2 | GO:0023024 | MHC class I protein complex binding(GO:0023024) |
| 0.2 | 1.8 | GO:0047144 | 2-acylglycerol-3-phosphate O-acyltransferase activity(GO:0047144) |
| 0.2 | 1.3 | GO:0005499 | vitamin D binding(GO:0005499) |
| 0.2 | 6.5 | GO:0001965 | G-protein alpha-subunit binding(GO:0001965) |
| 0.2 | 2.6 | GO:1990247 | N6-methyladenosine-containing RNA binding(GO:1990247) |
| 0.2 | 4.1 | GO:0045504 | dynein heavy chain binding(GO:0045504) |
| 0.2 | 1.0 | GO:0034875 | oxidoreductase activity, acting on CH or CH2 groups, quinone or similar compound as acceptor(GO:0033695) caffeine oxidase activity(GO:0034875) |
| 0.2 | 2.3 | GO:0035240 | dopamine binding(GO:0035240) |
| 0.2 | 1.8 | GO:1904264 | ubiquitin protein ligase activity involved in ERAD pathway(GO:1904264) |
| 0.2 | 2.5 | GO:0034450 | ubiquitin-ubiquitin ligase activity(GO:0034450) |
| 0.2 | 2.3 | GO:0005132 | type I interferon receptor binding(GO:0005132) |
| 0.1 | 3.7 | GO:0008191 | metalloendopeptidase inhibitor activity(GO:0008191) |
| 0.1 | 3.5 | GO:0003887 | DNA-directed DNA polymerase activity(GO:0003887) |
| 0.1 | 2.3 | GO:0032454 | histone demethylase activity (H3-K9 specific)(GO:0032454) |
| 0.1 | 0.3 | GO:0004949 | cannabinoid receptor activity(GO:0004949) |
| 0.1 | 4.8 | GO:0042056 | chemoattractant activity(GO:0042056) |
| 0.1 | 0.7 | GO:0030229 | very-low-density lipoprotein particle receptor activity(GO:0030229) |
| 0.1 | 0.3 | GO:0004157 | dihydropyrimidinase activity(GO:0004157) |
| 0.1 | 3.3 | GO:0004709 | MAP kinase kinase kinase activity(GO:0004709) |
| 0.1 | 0.7 | GO:0035312 | 5'-3' exodeoxyribonuclease activity(GO:0035312) |
| 0.1 | 2.0 | GO:0008483 | transaminase activity(GO:0008483) |
| 0.1 | 3.6 | GO:0051539 | 4 iron, 4 sulfur cluster binding(GO:0051539) |
| 0.1 | 2.7 | GO:0015347 | sodium-independent organic anion transmembrane transporter activity(GO:0015347) |
| 0.1 | 2.0 | GO:0008093 | cytoskeletal adaptor activity(GO:0008093) |
| 0.1 | 0.5 | GO:0030345 | extracellular matrix structural constituent conferring compression resistance(GO:0030021) structural constituent of tooth enamel(GO:0030345) |
| 0.1 | 0.1 | GO:0003746 | translation elongation factor activity(GO:0003746) |
| 0.1 | 0.7 | GO:0016713 | oxidoreductase activity, acting on paired donors, with incorporation or reduction of molecular oxygen, reduced iron-sulfur protein as one donor, and incorporation of one atom of oxygen(GO:0016713) |
| 0.1 | 0.2 | GO:0004657 | proline dehydrogenase activity(GO:0004657) |
| 0.1 | 0.6 | GO:0017091 | AU-rich element binding(GO:0017091) |
| 0.1 | 0.5 | GO:0033592 | RNA strand annealing activity(GO:0033592) |
| 0.1 | 0.3 | GO:0034711 | inhibin binding(GO:0034711) |
| 0.1 | 0.3 | GO:0097199 | cysteine-type endopeptidase activity involved in apoptotic signaling pathway(GO:0097199) |
| 0.1 | 1.2 | GO:0061650 | ubiquitin conjugating enzyme activity(GO:0061631) ubiquitin-like protein conjugating enzyme activity(GO:0061650) |
| 0.1 | 1.9 | GO:0015020 | glucuronosyltransferase activity(GO:0015020) |
| 0.1 | 0.4 | GO:0008131 | primary amine oxidase activity(GO:0008131) |
| 0.1 | 0.6 | GO:0008253 | 5'-nucleotidase activity(GO:0008253) |
| 0.0 | 2.4 | GO:0043022 | ribosome binding(GO:0043022) |
| 0.0 | 1.0 | GO:0017134 | fibroblast growth factor binding(GO:0017134) |
| 0.0 | 0.2 | GO:0005415 | nucleoside:sodium symporter activity(GO:0005415) |
| 0.0 | 1.0 | GO:0034237 | protein kinase A regulatory subunit binding(GO:0034237) |
| 0.0 | 2.7 | GO:0016836 | hydro-lyase activity(GO:0016836) |
| 0.0 | 3.8 | GO:0004722 | protein serine/threonine phosphatase activity(GO:0004722) |
| 0.0 | 0.4 | GO:0004332 | fructose-bisphosphate aldolase activity(GO:0004332) |
| 0.0 | 0.9 | GO:0004029 | aldehyde dehydrogenase (NAD) activity(GO:0004029) |
| 0.0 | 6.8 | GO:0008201 | heparin binding(GO:0008201) |
| 0.0 | 0.4 | GO:0035251 | UDP-glucosyltransferase activity(GO:0035251) |
| 0.0 | 0.9 | GO:0070888 | E-box binding(GO:0070888) |
| 0.0 | 2.0 | GO:0001105 | RNA polymerase II transcription coactivator activity(GO:0001105) |
| 0.0 | 7.9 | GO:0061630 | ubiquitin protein ligase activity(GO:0061630) |
| 0.0 | 0.7 | GO:0008157 | protein phosphatase 1 binding(GO:0008157) |
| 0.0 | 2.0 | GO:0019843 | rRNA binding(GO:0019843) |
| 0.0 | 0.5 | GO:0098641 | cadherin binding involved in cell-cell adhesion(GO:0098641) |
| 0.0 | 5.9 | GO:0035091 | phosphatidylinositol binding(GO:0035091) |
| 0.0 | 0.7 | GO:0031489 | myosin V binding(GO:0031489) |
| 0.0 | 21.0 | GO:0008270 | zinc ion binding(GO:0008270) |
| 0.0 | 14.6 | GO:0046982 | protein heterodimerization activity(GO:0046982) |
| 0.0 | 0.6 | GO:0005248 | voltage-gated sodium channel activity(GO:0005248) voltage-gated ion channel activity involved in regulation of postsynaptic membrane potential(GO:1905030) |
| 0.0 | 5.8 | GO:0008017 | microtubule binding(GO:0008017) |
| 0.0 | 0.5 | GO:0017075 | syntaxin-1 binding(GO:0017075) |
| 0.0 | 0.5 | GO:0001106 | RNA polymerase II transcription corepressor activity(GO:0001106) |
| 0.0 | 0.8 | GO:0004407 | histone deacetylase activity(GO:0004407) |
| 0.0 | 0.8 | GO:0000175 | 3'-5'-exoribonuclease activity(GO:0000175) |
| 0.0 | 1.2 | GO:0003743 | translation initiation factor activity(GO:0003743) |
| 0.0 | 5.9 | GO:0045296 | cadherin binding(GO:0045296) |
| 0.0 | 0.2 | GO:0089720 | caspase binding(GO:0089720) |
| 0.0 | 3.0 | GO:0005516 | calmodulin binding(GO:0005516) |
| 0.0 | 1.4 | GO:0051087 | chaperone binding(GO:0051087) |
| 0.0 | 3.2 | GO:0003729 | mRNA binding(GO:0003729) poly(A) RNA binding(GO:0044822) |
| 0.0 | 1.3 | GO:0002020 | protease binding(GO:0002020) |
| 0.0 | 3.8 | GO:0003924 | GTPase activity(GO:0003924) |
| 0.0 | 0.4 | GO:0016248 | ion channel inhibitor activity(GO:0008200) channel inhibitor activity(GO:0016248) |
| 0.0 | 0.2 | GO:0015467 | G-protein activated inward rectifier potassium channel activity(GO:0015467) |
| 0.0 | 1.4 | GO:0017137 | Rab GTPase binding(GO:0017137) |
Gene overrepresentation in C2:CP category:
| Log-likelihood per target | Total log-likelihood | Term | Description |
|---|---|---|---|
| 0.2 | 2.7 | ST PAC1 RECEPTOR PATHWAY | PAC1 Receptor Pathway |
| 0.2 | 7.0 | ST INTERLEUKIN 4 PATHWAY | Interleukin 4 (IL-4) Pathway |
| 0.1 | 1.8 | SA G2 AND M PHASES | Cdc25 activates the cdc2/cyclin B complex to induce the G2/M transition. |
| 0.1 | 5.5 | PID MYC PATHWAY | C-MYC pathway |
| 0.1 | 3.2 | PID P38 MKK3 6PATHWAY | p38 MAPK signaling pathway |
| 0.1 | 10.2 | PID CMYB PATHWAY | C-MYB transcription factor network |
| 0.1 | 3.4 | PID EPHRINB REV PATHWAY | Ephrin B reverse signaling |
| 0.1 | 2.6 | PID GLYPICAN 1PATHWAY | Glypican 1 network |
| 0.1 | 1.1 | PID DNA PK PATHWAY | DNA-PK pathway in nonhomologous end joining |
| 0.1 | 2.8 | PID ECADHERIN NASCENT AJ PATHWAY | E-cadherin signaling in the nascent adherens junction |
| 0.0 | 1.0 | PID ARF 3PATHWAY | Arf1 pathway |
| 0.0 | 3.1 | PID TRKR PATHWAY | Neurotrophic factor-mediated Trk receptor signaling |
| 0.0 | 2.0 | PID CDC42 REG PATHWAY | Regulation of CDC42 activity |
| 0.0 | 2.2 | PID ILK PATHWAY | Integrin-linked kinase signaling |
| 0.0 | 1.2 | PID ERBB1 INTERNALIZATION PATHWAY | Internalization of ErbB1 |
| 0.0 | 1.7 | PID VEGFR1 2 PATHWAY | Signaling events mediated by VEGFR1 and VEGFR2 |
| 0.0 | 5.9 | NABA ECM REGULATORS | Genes encoding enzymes and their regulators involved in the remodeling of the extracellular matrix |
| 0.0 | 0.9 | PID IL6 7 PATHWAY | IL6-mediated signaling events |
| 0.0 | 2.3 | PID AR PATHWAY | Coregulation of Androgen receptor activity |
| 0.0 | 0.7 | PID IL23 PATHWAY | IL23-mediated signaling events |
| 0.0 | 2.2 | PID MYC REPRESS PATHWAY | Validated targets of C-MYC transcriptional repression |
| 0.0 | 0.9 | PID TGFBR PATHWAY | TGF-beta receptor signaling |
| 0.0 | 1.4 | PID CASPASE PATHWAY | Caspase cascade in apoptosis |
| 0.0 | 0.8 | PID HEDGEHOG GLI PATHWAY | Hedgehog signaling events mediated by Gli proteins |
| 0.0 | 0.3 | PID NCADHERIN PATHWAY | N-cadherin signaling events |
| 0.0 | 0.6 | PID NFAT TFPATHWAY | Calcineurin-regulated NFAT-dependent transcription in lymphocytes |
Gene overrepresentation in C2:CP:REACTOME category:
| Log-likelihood per target | Total log-likelihood | Term | Description |
|---|---|---|---|
| 0.3 | 12.1 | REACTOME GLUTATHIONE CONJUGATION | Genes involved in Glutathione conjugation |
| 0.3 | 10.1 | REACTOME CYTOSOLIC TRNA AMINOACYLATION | Genes involved in Cytosolic tRNA aminoacylation |
| 0.2 | 19.7 | REACTOME GOLGI ASSOCIATED VESICLE BIOGENESIS | Genes involved in Golgi Associated Vesicle Biogenesis |
| 0.2 | 6.4 | REACTOME INSULIN RECEPTOR RECYCLING | Genes involved in Insulin receptor recycling |
| 0.2 | 9.8 | REACTOME G ALPHA Z SIGNALLING EVENTS | Genes involved in G alpha (z) signalling events |
| 0.2 | 5.1 | REACTOME PEROXISOMAL LIPID METABOLISM | Genes involved in Peroxisomal lipid metabolism |
| 0.1 | 2.8 | REACTOME THE NLRP3 INFLAMMASOME | Genes involved in The NLRP3 inflammasome |
| 0.1 | 3.3 | REACTOME ENDOSOMAL SORTING COMPLEX REQUIRED FOR TRANSPORT ESCRT | Genes involved in Endosomal Sorting Complex Required For Transport (ESCRT) |
| 0.1 | 2.7 | REACTOME TRANSPORT OF ORGANIC ANIONS | Genes involved in Transport of organic anions |
| 0.1 | 1.8 | REACTOME ACYL CHAIN REMODELLING OF PG | Genes involved in Acyl chain remodelling of PG |
| 0.1 | 8.9 | REACTOME P53 INDEPENDENT G1 S DNA DAMAGE CHECKPOINT | Genes involved in p53-Independent G1/S DNA damage checkpoint |
| 0.1 | 3.2 | REACTOME AMINO ACID SYNTHESIS AND INTERCONVERSION TRANSAMINATION | Genes involved in Amino acid synthesis and interconversion (transamination) |
| 0.1 | 2.7 | REACTOME PLATELET CALCIUM HOMEOSTASIS | Genes involved in Platelet calcium homeostasis |
| 0.1 | 2.5 | REACTOME METABOLISM OF PORPHYRINS | Genes involved in Metabolism of porphyrins |
| 0.1 | 5.5 | REACTOME RNA POL II TRANSCRIPTION PRE INITIATION AND PROMOTER OPENING | Genes involved in RNA Polymerase II Transcription Pre-Initiation And Promoter Opening |
| 0.1 | 1.9 | REACTOME GLUCURONIDATION | Genes involved in Glucuronidation |
| 0.1 | 1.4 | REACTOME COMMON PATHWAY | Genes involved in Common Pathway |
| 0.1 | 2.0 | REACTOME ACTIVATION OF RAC | Genes involved in Activation of Rac |
| 0.1 | 4.9 | REACTOME MITOCHONDRIAL PROTEIN IMPORT | Genes involved in Mitochondrial Protein Import |
| 0.1 | 2.2 | REACTOME CELL EXTRACELLULAR MATRIX INTERACTIONS | Genes involved in Cell-extracellular matrix interactions |
| 0.1 | 2.3 | REACTOME REGULATION OF IFNA SIGNALING | Genes involved in Regulation of IFNA signaling |
| 0.1 | 2.5 | REACTOME STEROID HORMONES | Genes involved in Steroid hormones |
| 0.1 | 0.9 | REACTOME ERKS ARE INACTIVATED | Genes involved in ERKs are inactivated |
| 0.1 | 1.0 | REACTOME XENOBIOTICS | Genes involved in Xenobiotics |
| 0.1 | 0.2 | REACTOME NEF MEDIATED DOWNREGULATION OF MHC CLASS I COMPLEX CELL SURFACE EXPRESSION | Genes involved in Nef mediated downregulation of MHC class I complex cell surface expression |
| 0.1 | 1.2 | REACTOME INSULIN SYNTHESIS AND PROCESSING | Genes involved in Insulin Synthesis and Processing |
| 0.0 | 3.8 | REACTOME MITOTIC PROMETAPHASE | Genes involved in Mitotic Prometaphase |
| 0.0 | 7.9 | REACTOME ANTIGEN PROCESSING UBIQUITINATION PROTEASOME DEGRADATION | Genes involved in Antigen processing: Ubiquitination & Proteasome degradation |
| 0.0 | 0.9 | REACTOME HORMONE SENSITIVE LIPASE HSL MEDIATED TRIACYLGLYCEROL HYDROLYSIS | Genes involved in Hormone-sensitive lipase (HSL)-mediated triacylglycerol hydrolysis |
| 0.0 | 0.4 | REACTOME NOREPINEPHRINE NEUROTRANSMITTER RELEASE CYCLE | Genes involved in Norepinephrine Neurotransmitter Release Cycle |
| 0.0 | 0.9 | REACTOME CASPASE MEDIATED CLEAVAGE OF CYTOSKELETAL PROTEINS | Genes involved in Caspase-mediated cleavage of cytoskeletal proteins |
| 0.0 | 3.7 | REACTOME FACTORS INVOLVED IN MEGAKARYOCYTE DEVELOPMENT AND PLATELET PRODUCTION | Genes involved in Factors involved in megakaryocyte development and platelet production |
| 0.0 | 9.2 | REACTOME GENERIC TRANSCRIPTION PATHWAY | Genes involved in Generic Transcription Pathway |
| 0.0 | 0.3 | REACTOME PYRIMIDINE CATABOLISM | Genes involved in Pyrimidine catabolism |
| 0.0 | 1.8 | REACTOME MHC CLASS II ANTIGEN PRESENTATION | Genes involved in MHC class II antigen presentation |
| 0.0 | 1.2 | REACTOME IMMUNOREGULATORY INTERACTIONS BETWEEN A LYMPHOID AND A NON LYMPHOID CELL | Genes involved in Immunoregulatory interactions between a Lymphoid and a non-Lymphoid cell |
| 0.0 | 0.2 | REACTOME PRESYNAPTIC NICOTINIC ACETYLCHOLINE RECEPTORS | Genes involved in Presynaptic nicotinic acetylcholine receptors |
| 0.0 | 0.3 | REACTOME EXTRINSIC PATHWAY FOR APOPTOSIS | Genes involved in Extrinsic Pathway for Apoptosis |
| 0.0 | 0.2 | REACTOME INHIBITION OF VOLTAGE GATED CA2 CHANNELS VIA GBETA GAMMA SUBUNITS | Genes involved in Inhibition of voltage gated Ca2+ channels via Gbeta/gamma subunits |