Project
GNF SymAtlas + NCI-60 cancer cell lines, comparison of cancers vs non-cancers, human (Su, 2004; Ross, 2000)
Navigation
Downloads
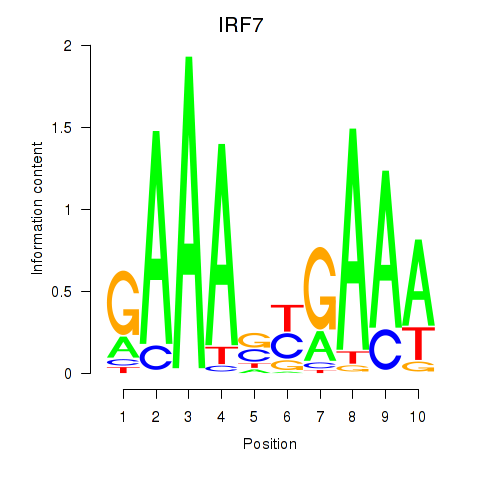
Results for IRF7
Z-value: 0.49
Motif logo
Transcription factors associated with IRF7
| Gene Symbol | Gene ID | Gene Info |
|---|---|---|
|
IRF7
|
ENSG00000185507.15 | interferon regulatory factor 7 |
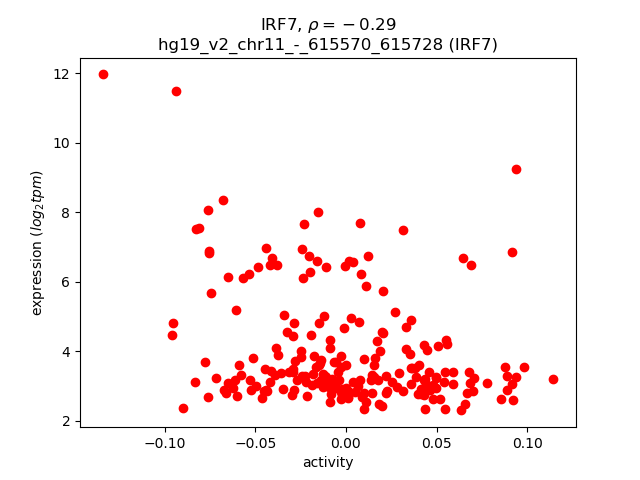
Activity-expression correlation:
| Gene | Promoter | Pearson corr. coef. | P-value | Plot |
|---|---|---|---|---|
| IRF7 | hg19_v2_chr11_-_615570_615728 | -0.29 | 1.2e-05 | Click! |
Activity profile of IRF7 motif
Sorted Z-values of IRF7 motif
| Promoter | Log-likelihood | Transcript | Gene | Gene Info |
|---|---|---|---|---|
| chr2_-_55237484 | 29.08 |
ENST00000394609.2
|
RTN4
|
reticulon 4 |
| chr2_-_151344172 | 28.03 |
ENST00000375734.2
ENST00000263895.4 ENST00000454202.1 |
RND3
|
Rho family GTPase 3 |
| chr12_+_19358228 | 27.27 |
ENST00000424268.1
ENST00000543806.1 |
PLEKHA5
|
pleckstrin homology domain containing, family A member 5 |
| chr4_+_41614909 | 24.42 |
ENST00000509454.1
ENST00000396595.3 ENST00000381753.4 |
LIMCH1
|
LIM and calponin homology domains 1 |
| chrX_+_102631248 | 23.52 |
ENST00000361298.4
ENST00000372645.3 ENST00000372635.1 |
NGFRAP1
|
nerve growth factor receptor (TNFRSF16) associated protein 1 |
| chrX_+_102883620 | 22.61 |
ENST00000372626.3
|
TCEAL1
|
transcription elongation factor A (SII)-like 1 |
| chrX_+_103031421 | 20.71 |
ENST00000433491.1
ENST00000418604.1 ENST00000443502.1 |
PLP1
|
proteolipid protein 1 |
| chr12_-_50616382 | 20.62 |
ENST00000552783.1
|
LIMA1
|
LIM domain and actin binding 1 |
| chrX_+_103031758 | 19.83 |
ENST00000303958.2
ENST00000361621.2 |
PLP1
|
proteolipid protein 1 |
| chr12_-_118498958 | 18.44 |
ENST00000315436.3
|
WSB2
|
WD repeat and SOCS box containing 2 |
| chr11_+_19799327 | 17.49 |
ENST00000540292.1
|
NAV2
|
neuron navigator 2 |
| chr10_+_91152303 | 17.09 |
ENST00000371804.3
|
IFIT1
|
interferon-induced protein with tetratricopeptide repeats 1 |
| chr3_-_47950745 | 15.75 |
ENST00000429422.1
|
MAP4
|
microtubule-associated protein 4 |
| chr1_+_948803 | 15.46 |
ENST00000379389.4
|
ISG15
|
ISG15 ubiquitin-like modifier |
| chr12_-_50616122 | 13.44 |
ENST00000552823.1
ENST00000552909.1 |
LIMA1
|
LIM domain and actin binding 1 |
| chr12_-_26278030 | 13.44 |
ENST00000242728.4
|
BHLHE41
|
basic helix-loop-helix family, member e41 |
| chr5_+_140749803 | 13.42 |
ENST00000576222.1
|
PCDHGB3
|
protocadherin gamma subfamily B, 3 |
| chr15_+_65843130 | 13.41 |
ENST00000569894.1
|
PTPLAD1
|
protein tyrosine phosphatase-like A domain containing 1 |
| chr15_+_80733570 | 13.28 |
ENST00000533983.1
ENST00000527771.1 ENST00000525103.1 |
ARNT2
|
aryl-hydrocarbon receptor nuclear translocator 2 |
| chr9_-_36276966 | 13.18 |
ENST00000543356.2
ENST00000396594.3 |
GNE
|
glucosamine (UDP-N-acetyl)-2-epimerase/N-acetylmannosamine kinase |
| chr8_+_80523321 | 12.91 |
ENST00000518111.1
|
STMN2
|
stathmin-like 2 |
| chr17_-_76975925 | 12.86 |
ENST00000591274.1
ENST00000589906.1 ENST00000591778.1 ENST00000589775.2 ENST00000585407.1 ENST00000262776.3 |
LGALS3BP
|
lectin, galactoside-binding, soluble, 3 binding protein |
| chr11_+_9406169 | 12.85 |
ENST00000379719.3
ENST00000527431.1 |
IPO7
|
importin 7 |
| chr7_+_75931861 | 12.67 |
ENST00000248553.6
|
HSPB1
|
heat shock 27kDa protein 1 |
| chrX_-_13835461 | 12.42 |
ENST00000316715.4
ENST00000356942.5 |
GPM6B
|
glycoprotein M6B |
| chr14_-_69446034 | 11.92 |
ENST00000193403.6
|
ACTN1
|
actinin, alpha 1 |
| chr1_-_149900122 | 11.91 |
ENST00000271628.8
|
SF3B4
|
splicing factor 3b, subunit 4, 49kDa |
| chr14_-_102552659 | 11.90 |
ENST00000441629.2
|
HSP90AA1
|
heat shock protein 90kDa alpha (cytosolic), class A member 1 |
| chr8_+_26150628 | 11.84 |
ENST00000523925.1
ENST00000315985.7 |
PPP2R2A
|
protein phosphatase 2, regulatory subunit B, alpha |
| chr4_+_41614720 | 11.76 |
ENST00000509277.1
|
LIMCH1
|
LIM and calponin homology domains 1 |
| chr11_+_69455855 | 11.45 |
ENST00000227507.2
ENST00000536559.1 |
CCND1
|
cyclin D1 |
| chr5_+_140734570 | 11.43 |
ENST00000571252.1
|
PCDHGA4
|
protocadherin gamma subfamily A, 4 |
| chr18_-_21977748 | 11.19 |
ENST00000399441.4
ENST00000319481.3 |
OSBPL1A
|
oxysterol binding protein-like 1A |
| chr21_-_27542972 | 11.18 |
ENST00000346798.3
ENST00000439274.2 ENST00000354192.3 ENST00000348990.5 ENST00000357903.3 ENST00000358918.3 ENST00000359726.3 |
APP
|
amyloid beta (A4) precursor protein |
| chr14_+_58711539 | 10.90 |
ENST00000216455.4
ENST00000412908.2 ENST00000557508.1 |
PSMA3
|
proteasome (prosome, macropain) subunit, alpha type, 3 |
| chr14_-_69445968 | 10.87 |
ENST00000438964.2
|
ACTN1
|
actinin, alpha 1 |
| chr14_+_73563735 | 10.84 |
ENST00000532192.1
|
RBM25
|
RNA binding motif protein 25 |
| chr9_+_33264861 | 10.67 |
ENST00000223500.8
|
CHMP5
|
charged multivesicular body protein 5 |
| chr8_+_132916318 | 10.63 |
ENST00000254624.5
ENST00000522709.1 |
EFR3A
|
EFR3 homolog A (S. cerevisiae) |
| chr4_-_176923483 | 10.34 |
ENST00000280187.7
ENST00000512509.1 |
GPM6A
|
glycoprotein M6A |
| chr1_-_246357029 | 10.19 |
ENST00000391836.2
|
SMYD3
|
SET and MYND domain containing 3 |
| chrX_+_102883887 | 10.15 |
ENST00000372625.3
ENST00000372624.3 |
TCEAL1
|
transcription elongation factor A (SII)-like 1 |
| chr15_+_96875657 | 10.02 |
ENST00000559679.1
ENST00000394171.2 |
NR2F2
|
nuclear receptor subfamily 2, group F, member 2 |
| chr3_-_114035026 | 9.94 |
ENST00000570269.1
|
RP11-553L6.5
|
RP11-553L6.5 |
| chr20_+_10199468 | 9.72 |
ENST00000254976.2
ENST00000304886.2 |
SNAP25
|
synaptosomal-associated protein, 25kDa |
| chrX_-_13835147 | 9.62 |
ENST00000493677.1
ENST00000355135.2 |
GPM6B
|
glycoprotein M6B |
| chr12_-_54652060 | 9.43 |
ENST00000552562.1
|
CBX5
|
chromobox homolog 5 |
| chr9_+_33265011 | 9.39 |
ENST00000419016.2
|
CHMP5
|
charged multivesicular body protein 5 |
| chr11_-_119293872 | 9.39 |
ENST00000524970.1
|
THY1
|
Thy-1 cell surface antigen |
| chr14_-_70883708 | 9.20 |
ENST00000256366.4
|
SYNJ2BP
|
synaptojanin 2 binding protein |
| chr15_-_37393406 | 9.18 |
ENST00000338564.5
ENST00000558313.1 ENST00000340545.5 |
MEIS2
|
Meis homeobox 2 |
| chr5_-_146461027 | 9.10 |
ENST00000394410.2
ENST00000508267.1 ENST00000504198.1 |
PPP2R2B
|
protein phosphatase 2, regulatory subunit B, beta |
| chr4_+_113739244 | 9.10 |
ENST00000503271.1
ENST00000503423.1 ENST00000506722.1 |
ANK2
|
ankyrin 2, neuronal |
| chr1_+_165796753 | 8.92 |
ENST00000367879.4
|
UCK2
|
uridine-cytidine kinase 2 |
| chr11_-_111794446 | 8.77 |
ENST00000527950.1
|
CRYAB
|
crystallin, alpha B |
| chr10_-_95242044 | 8.57 |
ENST00000371501.4
ENST00000371502.4 ENST00000371489.1 |
MYOF
|
myoferlin |
| chrX_-_20236970 | 8.51 |
ENST00000379548.4
|
RPS6KA3
|
ribosomal protein S6 kinase, 90kDa, polypeptide 3 |
| chr7_-_123197733 | 8.49 |
ENST00000470123.1
ENST00000471770.1 |
NDUFA5
|
NADH dehydrogenase (ubiquinone) 1 alpha subcomplex, 5 |
| chr9_-_21187598 | 8.49 |
ENST00000421715.1
|
IFNA4
|
interferon, alpha 4 |
| chr1_-_21377383 | 8.41 |
ENST00000374935.3
|
EIF4G3
|
eukaryotic translation initiation factor 4 gamma, 3 |
| chr2_-_37384175 | 8.21 |
ENST00000411537.2
ENST00000233057.4 ENST00000395127.2 ENST00000390013.3 |
EIF2AK2
|
eukaryotic translation initiation factor 2-alpha kinase 2 |
| chr10_-_95241951 | 8.15 |
ENST00000358334.5
ENST00000359263.4 ENST00000371488.3 |
MYOF
|
myoferlin |
| chr1_-_21377447 | 8.11 |
ENST00000374937.3
ENST00000264211.8 |
EIF4G3
|
eukaryotic translation initiation factor 4 gamma, 3 |
| chrX_+_21958674 | 8.04 |
ENST00000404933.2
|
SMS
|
spermine synthase |
| chr1_+_84630645 | 8.03 |
ENST00000394839.2
|
PRKACB
|
protein kinase, cAMP-dependent, catalytic, beta |
| chr1_-_55352834 | 7.86 |
ENST00000371269.3
|
DHCR24
|
24-dehydrocholesterol reductase |
| chr4_-_87281224 | 7.86 |
ENST00000395169.3
ENST00000395161.2 |
MAPK10
|
mitogen-activated protein kinase 10 |
| chr7_-_134143841 | 7.84 |
ENST00000285930.4
|
AKR1B1
|
aldo-keto reductase family 1, member B1 (aldose reductase) |
| chr8_+_85618155 | 7.78 |
ENST00000523850.1
ENST00000521376.1 |
RALYL
|
RALY RNA binding protein-like |
| chrX_+_77154935 | 7.74 |
ENST00000481445.1
|
COX7B
|
cytochrome c oxidase subunit VIIb |
| chrX_+_146993534 | 7.68 |
ENST00000334557.6
ENST00000439526.2 ENST00000370475.4 |
FMR1
|
fragile X mental retardation 1 |
| chr17_-_47723943 | 7.41 |
ENST00000510476.1
ENST00000503676.1 |
SPOP
|
speckle-type POZ protein |
| chrX_-_102941596 | 7.38 |
ENST00000441076.2
ENST00000422355.1 ENST00000442614.1 ENST00000422154.2 ENST00000451301.1 |
MORF4L2
|
mortality factor 4 like 2 |
| chr17_-_65362678 | 7.35 |
ENST00000357146.4
ENST00000356126.3 |
PSMD12
|
proteasome (prosome, macropain) 26S subunit, non-ATPase, 12 |
| chrX_+_21958814 | 7.23 |
ENST00000379404.1
ENST00000415881.2 |
SMS
|
spermine synthase |
| chrX_+_146993449 | 7.19 |
ENST00000218200.8
ENST00000370471.3 ENST00000370477.1 |
FMR1
|
fragile X mental retardation 1 |
| chr15_+_78832747 | 7.13 |
ENST00000560217.1
ENST00000044462.7 ENST00000559082.1 ENST00000559948.1 ENST00000413382.2 ENST00000559146.1 ENST00000558281.1 |
PSMA4
|
proteasome (prosome, macropain) subunit, alpha type, 4 |
| chrX_+_56590002 | 7.08 |
ENST00000338222.5
|
UBQLN2
|
ubiquilin 2 |
| chr14_+_90864504 | 7.02 |
ENST00000544280.2
|
CALM1
|
calmodulin 1 (phosphorylase kinase, delta) |
| chr1_+_84630053 | 6.98 |
ENST00000394838.2
ENST00000370682.3 ENST00000432111.1 |
PRKACB
|
protein kinase, cAMP-dependent, catalytic, beta |
| chr5_+_92919043 | 6.95 |
ENST00000327111.3
|
NR2F1
|
nuclear receptor subfamily 2, group F, member 1 |
| chr12_+_79258547 | 6.91 |
ENST00000457153.2
|
SYT1
|
synaptotagmin I |
| chr18_+_12947981 | 6.90 |
ENST00000262124.11
|
SEH1L
|
SEH1-like (S. cerevisiae) |
| chr2_-_55277692 | 6.82 |
ENST00000394611.2
|
RTN4
|
reticulon 4 |
| chr8_+_109455845 | 6.73 |
ENST00000220853.3
|
EMC2
|
ER membrane protein complex subunit 2 |
| chr15_+_96876340 | 6.72 |
ENST00000453270.2
|
NR2F2
|
nuclear receptor subfamily 2, group F, member 2 |
| chr6_+_63921351 | 6.71 |
ENST00000370659.1
|
FKBP1C
|
FK506 binding protein 1C |
| chr9_-_21305312 | 6.66 |
ENST00000259555.4
|
IFNA5
|
interferon, alpha 5 |
| chr10_+_91092241 | 6.59 |
ENST00000371811.4
|
IFIT3
|
interferon-induced protein with tetratricopeptide repeats 3 |
| chrX_+_119737806 | 6.51 |
ENST00000371317.5
|
MCTS1
|
malignant T cell amplified sequence 1 |
| chr4_-_87281196 | 6.47 |
ENST00000359221.3
|
MAPK10
|
mitogen-activated protein kinase 10 |
| chr11_-_33757950 | 6.46 |
ENST00000533403.1
ENST00000528700.1 ENST00000527577.1 ENST00000395850.3 ENST00000351554.3 |
CD59
|
CD59 molecule, complement regulatory protein |
| chr11_-_321050 | 6.41 |
ENST00000399808.4
|
IFITM3
|
interferon induced transmembrane protein 3 |
| chr9_-_21228221 | 6.30 |
ENST00000413767.2
|
IFNA17
|
interferon, alpha 17 |
| chr4_-_139163491 | 6.29 |
ENST00000280612.5
|
SLC7A11
|
solute carrier family 7 (anionic amino acid transporter light chain, xc- system), member 11 |
| chr7_+_134576151 | 6.23 |
ENST00000393118.2
|
CALD1
|
caldesmon 1 |
| chr11_+_46402297 | 6.15 |
ENST00000405308.2
|
MDK
|
midkine (neurite growth-promoting factor 2) |
| chrX_-_34675391 | 6.07 |
ENST00000275954.3
|
TMEM47
|
transmembrane protein 47 |
| chr7_+_112063192 | 6.06 |
ENST00000005558.4
|
IFRD1
|
interferon-related developmental regulator 1 |
| chr1_-_154580616 | 6.05 |
ENST00000368474.4
|
ADAR
|
adenosine deaminase, RNA-specific |
| chr8_+_54764346 | 5.97 |
ENST00000297313.3
ENST00000344277.6 |
RGS20
|
regulator of G-protein signaling 20 |
| chr9_-_21202204 | 5.86 |
ENST00000239347.3
|
IFNA7
|
interferon, alpha 7 |
| chr6_+_151561506 | 5.85 |
ENST00000253332.1
|
AKAP12
|
A kinase (PRKA) anchor protein 12 |
| chr3_+_141106643 | 5.79 |
ENST00000514251.1
|
ZBTB38
|
zinc finger and BTB domain containing 38 |
| chr14_-_54908043 | 5.79 |
ENST00000556113.1
ENST00000553660.1 ENST00000395573.4 ENST00000557690.1 ENST00000216416.4 |
CNIH1
|
cornichon family AMPA receptor auxiliary protein 1 |
| chr5_-_11589131 | 5.72 |
ENST00000511377.1
|
CTNND2
|
catenin (cadherin-associated protein), delta 2 |
| chrX_-_48980098 | 5.68 |
ENST00000156109.5
|
GPKOW
|
G patch domain and KOW motifs |
| chr7_+_55177416 | 5.63 |
ENST00000450046.1
ENST00000454757.2 |
EGFR
|
epidermal growth factor receptor |
| chr10_+_94352956 | 5.61 |
ENST00000260731.3
|
KIF11
|
kinesin family member 11 |
| chr2_-_190044480 | 5.59 |
ENST00000374866.3
|
COL5A2
|
collagen, type V, alpha 2 |
| chr7_-_93519471 | 5.54 |
ENST00000451238.1
|
TFPI2
|
tissue factor pathway inhibitor 2 |
| chr3_-_197026152 | 5.52 |
ENST00000419354.1
|
DLG1
|
discs, large homolog 1 (Drosophila) |
| chr14_-_21924209 | 5.47 |
ENST00000557364.1
|
CHD8
|
chromodomain helicase DNA binding protein 8 |
| chr2_+_120687335 | 5.45 |
ENST00000544261.1
|
PTPN4
|
protein tyrosine phosphatase, non-receptor type 4 (megakaryocyte) |
| chr10_-_91174215 | 5.40 |
ENST00000371837.1
|
LIPA
|
lipase A, lysosomal acid, cholesterol esterase |
| chr1_-_103574024 | 5.35 |
ENST00000512756.1
ENST00000370096.3 ENST00000358392.2 ENST00000353414.4 |
COL11A1
|
collagen, type XI, alpha 1 |
| chr13_-_46543805 | 5.33 |
ENST00000378921.2
|
ZC3H13
|
zinc finger CCCH-type containing 13 |
| chr6_+_151561085 | 5.33 |
ENST00000402676.2
|
AKAP12
|
A kinase (PRKA) anchor protein 12 |
| chr7_+_100797678 | 5.23 |
ENST00000337619.5
|
AP1S1
|
adaptor-related protein complex 1, sigma 1 subunit |
| chr10_+_95517660 | 5.22 |
ENST00000371413.3
|
LGI1
|
leucine-rich, glioma inactivated 1 |
| chr1_+_155829286 | 5.22 |
ENST00000368324.4
|
SYT11
|
synaptotagmin XI |
| chr11_+_57480046 | 5.15 |
ENST00000378312.4
ENST00000278422.4 |
TMX2
|
thioredoxin-related transmembrane protein 2 |
| chr12_+_12878829 | 5.11 |
ENST00000326765.6
|
APOLD1
|
apolipoprotein L domain containing 1 |
| chr15_+_42694573 | 5.10 |
ENST00000397200.4
ENST00000569827.1 |
CAPN3
|
calpain 3, (p94) |
| chrX_+_100878079 | 5.09 |
ENST00000471229.2
|
ARMCX3
|
armadillo repeat containing, X-linked 3 |
| chr17_+_3379284 | 5.05 |
ENST00000263080.2
|
ASPA
|
aspartoacylase |
| chr16_-_4850471 | 5.05 |
ENST00000592019.1
ENST00000586153.1 |
ROGDI
|
rogdi homolog (Drosophila) |
| chr5_+_34915444 | 5.04 |
ENST00000336767.5
|
BRIX1
|
BRX1, biogenesis of ribosomes, homolog (S. cerevisiae) |
| chr9_-_140353748 | 4.96 |
ENST00000371472.2
ENST00000371475.3 ENST00000265663.7 ENST00000437259.1 ENST00000392812.4 ENST00000371474.3 ENST00000371473.3 |
NSMF
|
NMDA receptor synaptonuclear signaling and neuronal migration factor |
| chr6_-_116601044 | 4.96 |
ENST00000368608.3
|
TSPYL1
|
TSPY-like 1 |
| chr4_-_77135046 | 4.95 |
ENST00000264896.2
|
SCARB2
|
scavenger receptor class B, member 2 |
| chr12_+_15699286 | 4.95 |
ENST00000442921.2
ENST00000542557.1 ENST00000445537.2 ENST00000544244.1 |
PTPRO
|
protein tyrosine phosphatase, receptor type, O |
| chr5_-_11588907 | 4.94 |
ENST00000513598.1
ENST00000503622.1 |
CTNND2
|
catenin (cadherin-associated protein), delta 2 |
| chrX_+_23682379 | 4.92 |
ENST00000379349.1
|
PRDX4
|
peroxiredoxin 4 |
| chr11_+_46402583 | 4.89 |
ENST00000359803.3
|
MDK
|
midkine (neurite growth-promoting factor 2) |
| chr7_-_30066233 | 4.88 |
ENST00000222803.5
|
FKBP14
|
FK506 binding protein 14, 22 kDa |
| chr17_+_41363854 | 4.71 |
ENST00000588693.1
ENST00000588659.1 ENST00000541594.1 ENST00000536052.1 ENST00000331615.3 |
TMEM106A
|
transmembrane protein 106A |
| chr14_-_35099315 | 4.69 |
ENST00000396526.3
ENST00000396534.3 ENST00000355110.5 ENST00000557265.1 |
SNX6
|
sorting nexin 6 |
| chr10_+_95517566 | 4.67 |
ENST00000542308.1
|
LGI1
|
leucine-rich, glioma inactivated 1 |
| chr7_+_100797726 | 4.67 |
ENST00000429457.1
|
AP1S1
|
adaptor-related protein complex 1, sigma 1 subunit |
| chrX_-_99891796 | 4.66 |
ENST00000373020.4
|
TSPAN6
|
tetraspanin 6 |
| chr7_-_42971759 | 4.63 |
ENST00000538645.1
ENST00000445517.1 ENST00000223321.4 |
PSMA2
|
proteasome (prosome, macropain) subunit, alpha type, 2 |
| chr11_-_117186946 | 4.62 |
ENST00000313005.6
ENST00000528053.1 |
BACE1
|
beta-site APP-cleaving enzyme 1 |
| chr9_-_13175823 | 4.58 |
ENST00000545857.1
|
MPDZ
|
multiple PDZ domain protein |
| chr11_+_27062272 | 4.57 |
ENST00000529202.1
ENST00000533566.1 |
BBOX1
|
butyrobetaine (gamma), 2-oxoglutarate dioxygenase (gamma-butyrobetaine hydroxylase) 1 |
| chr10_+_95517616 | 4.54 |
ENST00000371418.4
|
LGI1
|
leucine-rich, glioma inactivated 1 |
| chr8_+_101162812 | 4.52 |
ENST00000353107.3
ENST00000522439.1 |
POLR2K
|
polymerase (RNA) II (DNA directed) polypeptide K, 7.0kDa |
| chr13_-_30424821 | 4.48 |
ENST00000380680.4
|
UBL3
|
ubiquitin-like 3 |
| chr11_+_47600562 | 4.47 |
ENST00000263774.4
ENST00000529276.1 ENST00000528192.1 ENST00000530295.1 ENST00000534208.1 ENST00000534716.2 |
NDUFS3
|
NADH dehydrogenase (ubiquinone) Fe-S protein 3, 30kDa (NADH-coenzyme Q reductase) |
| chr7_+_121513143 | 4.43 |
ENST00000393386.2
|
PTPRZ1
|
protein tyrosine phosphatase, receptor-type, Z polypeptide 1 |
| chrX_+_80457442 | 4.41 |
ENST00000373212.5
|
SH3BGRL
|
SH3 domain binding glutamic acid-rich protein like |
| chr4_+_113568207 | 4.35 |
ENST00000511529.1
|
LARP7
|
La ribonucleoprotein domain family, member 7 |
| chr18_+_3451646 | 4.34 |
ENST00000345133.5
ENST00000330513.5 ENST00000549546.1 |
TGIF1
|
TGFB-induced factor homeobox 1 |
| chr3_-_194393206 | 4.33 |
ENST00000265245.5
|
LSG1
|
large 60S subunit nuclear export GTPase 1 |
| chr20_-_33999766 | 4.28 |
ENST00000349714.5
ENST00000438533.1 ENST00000359226.2 ENST00000374384.2 ENST00000374377.5 ENST00000407996.2 ENST00000424405.1 ENST00000542501.1 ENST00000397554.1 ENST00000540457.1 ENST00000374380.2 ENST00000374385.5 |
UQCC1
|
ubiquinol-cytochrome c reductase complex assembly factor 1 |
| chr3_+_154797877 | 4.28 |
ENST00000462745.1
ENST00000493237.1 |
MME
|
membrane metallo-endopeptidase |
| chr21_-_35281399 | 4.28 |
ENST00000418933.1
|
ATP5O
|
ATP synthase, H+ transporting, mitochondrial F1 complex, O subunit |
| chr15_+_80364901 | 4.18 |
ENST00000560228.1
ENST00000559835.1 ENST00000559775.1 ENST00000558688.1 ENST00000560392.1 ENST00000560976.1 ENST00000558272.1 ENST00000558390.1 |
ZFAND6
|
zinc finger, AN1-type domain 6 |
| chr8_+_97597148 | 4.17 |
ENST00000521590.1
|
SDC2
|
syndecan 2 |
| chr11_+_46402744 | 4.16 |
ENST00000533952.1
|
MDK
|
midkine (neurite growth-promoting factor 2) |
| chr3_-_42306248 | 4.16 |
ENST00000334681.5
|
CCK
|
cholecystokinin |
| chr19_+_17378278 | 4.14 |
ENST00000596335.1
ENST00000601436.1 ENST00000595632.1 |
BABAM1
|
BRISC and BRCA1 A complex member 1 |
| chr9_-_21995300 | 4.13 |
ENST00000498628.2
|
CDKN2A
|
cyclin-dependent kinase inhibitor 2A |
| chr6_-_131291572 | 4.07 |
ENST00000529208.1
|
EPB41L2
|
erythrocyte membrane protein band 4.1-like 2 |
| chr20_-_3767324 | 4.03 |
ENST00000379751.4
|
CENPB
|
centromere protein B, 80kDa |
| chr2_-_37899323 | 3.96 |
ENST00000295324.3
ENST00000457889.1 |
CDC42EP3
|
CDC42 effector protein (Rho GTPase binding) 3 |
| chr12_+_113376157 | 3.94 |
ENST00000228928.7
|
OAS3
|
2'-5'-oligoadenylate synthetase 3, 100kDa |
| chr3_+_119316689 | 3.90 |
ENST00000273371.4
|
PLA1A
|
phospholipase A1 member A |
| chr12_-_51422017 | 3.84 |
ENST00000394904.3
|
SLC11A2
|
solute carrier family 11 (proton-coupled divalent metal ion transporter), member 2 |
| chrX_-_100914781 | 3.83 |
ENST00000431597.1
ENST00000458024.1 ENST00000413506.1 ENST00000440675.1 ENST00000328766.5 ENST00000356824.4 |
ARMCX2
|
armadillo repeat containing, X-linked 2 |
| chr9_+_21409146 | 3.80 |
ENST00000380205.1
|
IFNA8
|
interferon, alpha 8 |
| chr18_+_3451584 | 3.78 |
ENST00000551541.1
|
TGIF1
|
TGFB-induced factor homeobox 1 |
| chr10_+_115439630 | 3.76 |
ENST00000369318.3
|
CASP7
|
caspase 7, apoptosis-related cysteine peptidase |
| chr11_+_35211429 | 3.74 |
ENST00000525688.1
ENST00000278385.6 ENST00000533222.1 |
CD44
|
CD44 molecule (Indian blood group) |
| chr17_-_46682321 | 3.70 |
ENST00000225648.3
ENST00000484302.2 |
HOXB6
|
homeobox B6 |
| chr14_-_100841670 | 3.70 |
ENST00000557297.1
ENST00000555813.1 ENST00000557135.1 ENST00000556698.1 ENST00000554509.1 ENST00000555410.1 |
WARS
|
tryptophanyl-tRNA synthetase |
| chr14_-_24615805 | 3.65 |
ENST00000560410.1
|
PSME2
|
proteasome (prosome, macropain) activator subunit 2 (PA28 beta) |
| chr10_+_115439699 | 3.64 |
ENST00000369315.1
|
CASP7
|
caspase 7, apoptosis-related cysteine peptidase |
| chr13_+_29233218 | 3.63 |
ENST00000380842.4
|
POMP
|
proteasome maturation protein |
| chr10_+_115439282 | 3.62 |
ENST00000369321.2
ENST00000345633.4 |
CASP7
|
caspase 7, apoptosis-related cysteine peptidase |
| chr20_-_48732472 | 3.60 |
ENST00000340309.3
ENST00000415862.2 ENST00000371677.3 ENST00000420027.2 |
UBE2V1
|
ubiquitin-conjugating enzyme E2 variant 1 |
| chr17_-_38978847 | 3.60 |
ENST00000269576.5
|
KRT10
|
keratin 10 |
| chr20_+_25388293 | 3.59 |
ENST00000262460.4
ENST00000429262.2 |
GINS1
|
GINS complex subunit 1 (Psf1 homolog) |
| chr18_+_3262954 | 3.58 |
ENST00000584539.1
|
MYL12B
|
myosin, light chain 12B, regulatory |
| chr9_-_32526299 | 3.56 |
ENST00000379882.1
ENST00000379883.2 |
DDX58
|
DEAD (Asp-Glu-Ala-Asp) box polypeptide 58 |
| chr4_-_48782259 | 3.55 |
ENST00000507711.1
ENST00000358350.4 ENST00000537810.1 ENST00000264319.7 |
FRYL
|
FRY-like |
| chr2_-_188419200 | 3.53 |
ENST00000233156.3
ENST00000426055.1 ENST00000453013.1 ENST00000417013.1 |
TFPI
|
tissue factor pathway inhibitor (lipoprotein-associated coagulation inhibitor) |
| chr19_+_17378159 | 3.52 |
ENST00000598188.1
ENST00000359435.4 ENST00000599474.1 ENST00000599057.1 ENST00000601043.1 ENST00000447614.2 |
BABAM1
|
BRISC and BRCA1 A complex member 1 |
| chr1_-_94374946 | 3.52 |
ENST00000370238.3
|
GCLM
|
glutamate-cysteine ligase, modifier subunit |
| chr12_-_27090896 | 3.51 |
ENST00000539625.1
ENST00000538727.1 |
ASUN
|
asunder spermatogenesis regulator |
| chr2_+_169312350 | 3.51 |
ENST00000305747.6
|
CERS6
|
ceramide synthase 6 |
| chr13_+_53216565 | 3.50 |
ENST00000357495.2
|
HNRNPA1L2
|
heterogeneous nuclear ribonucleoprotein A1-like 2 |
| chr12_+_27863706 | 3.49 |
ENST00000081029.3
ENST00000538315.1 ENST00000542791.1 |
MRPS35
|
mitochondrial ribosomal protein S35 |
| chr15_+_91643442 | 3.49 |
ENST00000394232.1
|
SV2B
|
synaptic vesicle glycoprotein 2B |
| chr15_-_41624685 | 3.48 |
ENST00000560640.1
ENST00000220514.3 |
OIP5
|
Opa interacting protein 5 |
| chr16_+_14726672 | 3.46 |
ENST00000261658.2
ENST00000563971.1 |
BFAR
|
bifunctional apoptosis regulator |
| chr12_-_58165870 | 3.45 |
ENST00000257848.7
|
METTL1
|
methyltransferase like 1 |
| chr19_+_30863271 | 3.44 |
ENST00000355537.3
|
ZNF536
|
zinc finger protein 536 |
| chr15_+_63354769 | 3.42 |
ENST00000558910.1
|
TPM1
|
tropomyosin 1 (alpha) |
| chr1_-_115300579 | 3.39 |
ENST00000358528.4
ENST00000525132.1 |
CSDE1
|
cold shock domain containing E1, RNA-binding |
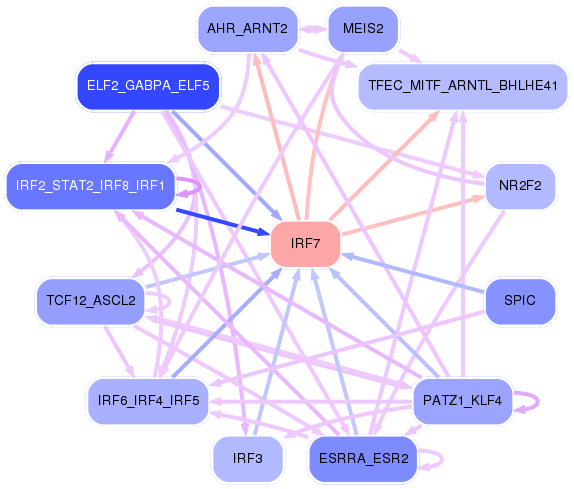
Network of associatons between targets according to the STRING database.

First level regulatory network of IRF7
Gene Ontology Analysis
Gene overrepresentation in biological_process category:
| Log-likelihood per target | Total log-likelihood | Term | Description |
|---|---|---|---|
| 5.7 | 17.1 | GO:0051097 | negative regulation of helicase activity(GO:0051097) |
| 5.1 | 15.3 | GO:0006597 | spermine biosynthetic process(GO:0006597) |
| 4.4 | 17.5 | GO:0021564 | vagus nerve development(GO:0021564) |
| 4.2 | 16.7 | GO:0009956 | radial pattern formation(GO:0009956) |
| 4.0 | 48.2 | GO:0033601 | positive regulation of mammary gland epithelial cell proliferation(GO:0033601) |
| 4.0 | 11.9 | GO:0036309 | protein localization to M-band(GO:0036309) protein localization to T-tubule(GO:0036371) |
| 3.2 | 12.7 | GO:0099640 | axo-dendritic protein transport(GO:0099640) |
| 3.1 | 9.4 | GO:2000298 | regulation of Rho-dependent protein serine/threonine kinase activity(GO:2000298) |
| 3.1 | 12.3 | GO:1900186 | negative regulation of clathrin-mediated endocytosis(GO:1900186) |
| 3.0 | 14.9 | GO:2000301 | negative regulation of synaptic vesicle exocytosis(GO:2000301) |
| 3.0 | 11.9 | GO:0043335 | protein unfolding(GO:0043335) |
| 2.9 | 14.5 | GO:0097338 | response to clozapine(GO:0097338) |
| 2.6 | 15.7 | GO:0051012 | microtubule sliding(GO:0051012) |
| 2.6 | 7.8 | GO:0006059 | hexitol metabolic process(GO:0006059) response to methylglyoxal(GO:0051595) |
| 2.6 | 10.4 | GO:0031117 | positive regulation of microtubule depolymerization(GO:0031117) |
| 2.5 | 15.3 | GO:0030421 | defecation(GO:0030421) |
| 2.3 | 6.9 | GO:0098746 | fast, calcium ion-dependent exocytosis of neurotransmitter(GO:0098746) |
| 2.3 | 38.4 | GO:0042759 | long-chain fatty acid biosynthetic process(GO:0042759) |
| 2.2 | 11.2 | GO:0071874 | cellular response to norepinephrine stimulus(GO:0071874) |
| 2.2 | 8.9 | GO:0006238 | CMP salvage(GO:0006238) CMP biosynthetic process(GO:0009224) CMP metabolic process(GO:0046035) |
| 2.2 | 22.0 | GO:0051610 | negative regulation of neurotransmitter uptake(GO:0051581) serotonin uptake(GO:0051610) regulation of serotonin uptake(GO:0051611) negative regulation of serotonin uptake(GO:0051612) |
| 2.2 | 6.5 | GO:0002188 | translation reinitiation(GO:0002188) |
| 2.0 | 6.1 | GO:0007518 | myoblast fate determination(GO:0007518) |
| 2.0 | 6.0 | GO:1900368 | regulation of RNA interference(GO:1900368) negative regulation of RNA interference(GO:1900369) |
| 1.9 | 9.7 | GO:0099590 | neurotransmitter receptor internalization(GO:0099590) |
| 1.9 | 5.6 | GO:0043006 | activation of phospholipase A2 activity by calcium-mediated signaling(GO:0043006) |
| 1.8 | 14.3 | GO:0007258 | JUN phosphorylation(GO:0007258) |
| 1.7 | 5.2 | GO:0051083 | 'de novo' cotranslational protein folding(GO:0051083) |
| 1.7 | 6.7 | GO:0071733 | transcriptional activation by promoter-enhancer looping(GO:0071733) gene looping(GO:0090202) dsDNA loop formation(GO:0090579) |
| 1.7 | 5.0 | GO:0006533 | aspartate catabolic process(GO:0006533) |
| 1.7 | 6.6 | GO:0034344 | type III interferon production(GO:0034343) regulation of type III interferon production(GO:0034344) |
| 1.6 | 4.9 | GO:0036058 | filtration diaphragm assembly(GO:0036058) slit diaphragm assembly(GO:0036060) |
| 1.6 | 32.4 | GO:0033141 | positive regulation of peptidyl-serine phosphorylation of STAT protein(GO:0033141) |
| 1.6 | 6.5 | GO:0001971 | negative regulation of activation of membrane attack complex(GO:0001971) |
| 1.6 | 7.9 | GO:0033490 | cholesterol biosynthetic process via desmosterol(GO:0033489) cholesterol biosynthetic process via lathosterol(GO:0033490) |
| 1.5 | 16.7 | GO:0001778 | plasma membrane repair(GO:0001778) |
| 1.4 | 5.6 | GO:1903224 | regulation of endodermal cell differentiation(GO:1903224) |
| 1.4 | 11.0 | GO:0072733 | response to staurosporine(GO:0072733) cellular response to staurosporine(GO:0072734) |
| 1.3 | 20.1 | GO:1901673 | regulation of mitotic spindle assembly(GO:1901673) |
| 1.3 | 5.0 | GO:1905123 | regulation of endosome organization(GO:1904978) regulation of glucosylceramidase activity(GO:1905123) |
| 1.2 | 7.4 | GO:2000676 | positive regulation of type B pancreatic cell apoptotic process(GO:2000676) |
| 1.2 | 4.8 | GO:1902748 | positive regulation of lens fiber cell differentiation(GO:1902748) |
| 1.2 | 8.2 | GO:0051834 | evasion or tolerance of host defenses by virus(GO:0019049) avoidance of host defenses(GO:0044413) evasion or tolerance of host defenses(GO:0044415) avoidance of defenses of other organism involved in symbiotic interaction(GO:0051832) evasion or tolerance of defenses of other organism involved in symbiotic interaction(GO:0051834) |
| 1.2 | 5.8 | GO:0006436 | tryptophanyl-tRNA aminoacylation(GO:0006436) |
| 1.1 | 9.0 | GO:0032020 | ISG15-protein conjugation(GO:0032020) |
| 1.1 | 3.4 | GO:0002184 | cytoplasmic translational termination(GO:0002184) |
| 1.1 | 25.4 | GO:0070262 | peptidyl-serine dephosphorylation(GO:0070262) |
| 1.1 | 5.5 | GO:0070131 | positive regulation of mitochondrial translation(GO:0070131) |
| 1.1 | 6.6 | GO:0070966 | nuclear-transcribed mRNA catabolic process, no-go decay(GO:0070966) |
| 1.1 | 4.3 | GO:0071492 | cellular response to UV-A(GO:0071492) |
| 1.0 | 7.3 | GO:2000111 | positive regulation of macrophage apoptotic process(GO:2000111) |
| 1.0 | 11.4 | GO:0035457 | cellular response to interferon-alpha(GO:0035457) |
| 1.0 | 9.2 | GO:0048312 | intracellular distribution of mitochondria(GO:0048312) |
| 1.0 | 13.2 | GO:0006054 | N-acetylneuraminate metabolic process(GO:0006054) |
| 1.0 | 3.0 | GO:0006624 | vacuolar protein processing(GO:0006624) |
| 1.0 | 3.0 | GO:0010845 | positive regulation of reciprocal meiotic recombination(GO:0010845) |
| 1.0 | 4.9 | GO:2000255 | negative regulation of male germ cell proliferation(GO:2000255) |
| 0.9 | 2.8 | GO:0061624 | fructose catabolic process(GO:0006001) fructose catabolic process to hydroxyacetone phosphate and glyceraldehyde-3-phosphate(GO:0061624) |
| 0.9 | 22.8 | GO:0030220 | platelet formation(GO:0030220) |
| 0.9 | 3.6 | GO:0043248 | proteasome assembly(GO:0043248) |
| 0.9 | 3.6 | GO:0046725 | negative regulation by virus of viral protein levels in host cell(GO:0046725) negative regulation of nephron tubule epithelial cell differentiation(GO:0072183) negative regulation of metanephric nephron tubule epithelial cell differentiation(GO:0072308) negative regulation of epithelial cell differentiation involved in kidney development(GO:2000697) |
| 0.9 | 2.7 | GO:0018197 | peptidyl-aspartic acid modification(GO:0018197) peptidyl-aspartic acid hydroxylation(GO:0042264) |
| 0.9 | 3.5 | GO:0097068 | response to thyroxine(GO:0097068) response to L-phenylalanine derivative(GO:1904386) |
| 0.9 | 5.1 | GO:0070315 | G1 to G0 transition involved in cell differentiation(GO:0070315) |
| 0.8 | 5.0 | GO:1903385 | regulation of homophilic cell adhesion(GO:1903385) |
| 0.8 | 13.4 | GO:0010944 | negative regulation of transcription by competitive promoter binding(GO:0010944) |
| 0.8 | 2.4 | GO:0071790 | spindle pole body duplication(GO:0030474) spindle pole body organization(GO:0051300) spindle pole body localization(GO:0070631) establishment of spindle pole body localization(GO:0070632) spindle pole body localization to nuclear envelope(GO:0071789) establishment of spindle pole body localization to nuclear envelope(GO:0071790) |
| 0.8 | 5.5 | GO:1903760 | regulation of voltage-gated potassium channel activity involved in ventricular cardiac muscle cell action potential repolarization(GO:1903760) |
| 0.8 | 2.4 | GO:1990022 | RNA polymerase II complex import to nucleus(GO:0044376) RNA polymerase III complex localization to nucleus(GO:1990022) |
| 0.8 | 6.2 | GO:1900625 | regulation of monocyte aggregation(GO:1900623) positive regulation of monocyte aggregation(GO:1900625) |
| 0.8 | 5.4 | GO:0050910 | detection of mechanical stimulus involved in sensory perception of sound(GO:0050910) |
| 0.7 | 11.2 | GO:0010739 | positive regulation of protein kinase A signaling(GO:0010739) |
| 0.7 | 3.7 | GO:1903588 | regulation of blood vessel endothelial cell proliferation involved in sprouting angiogenesis(GO:1903587) negative regulation of blood vessel endothelial cell proliferation involved in sprouting angiogenesis(GO:1903588) |
| 0.7 | 2.9 | GO:1903786 | mycotoxin catabolic process(GO:0043387) aflatoxin catabolic process(GO:0046223) organic heteropentacyclic compound catabolic process(GO:1901377) regulation of glutathione biosynthetic process(GO:1903786) positive regulation of glutathione biosynthetic process(GO:1903788) |
| 0.7 | 6.6 | GO:0060355 | positive regulation of cell adhesion molecule production(GO:0060355) |
| 0.7 | 2.2 | GO:0021569 | rhombomere 3 development(GO:0021569) |
| 0.7 | 2.1 | GO:1901420 | negative regulation of vitamin D receptor signaling pathway(GO:0070563) negative regulation of response to alcohol(GO:1901420) |
| 0.7 | 10.2 | GO:0006999 | nuclear pore organization(GO:0006999) |
| 0.7 | 2.7 | GO:0061484 | hematopoietic stem cell homeostasis(GO:0061484) |
| 0.7 | 4.7 | GO:1903593 | regulation of histamine secretion by mast cell(GO:1903593) |
| 0.6 | 1.9 | GO:0072428 | signal transduction involved in intra-S DNA damage checkpoint(GO:0072428) response to bisphenol A(GO:1903925) cellular response to bisphenol A(GO:1903926) |
| 0.6 | 4.3 | GO:0007598 | blood coagulation, extrinsic pathway(GO:0007598) |
| 0.6 | 11.9 | GO:0048026 | positive regulation of mRNA splicing, via spliceosome(GO:0048026) |
| 0.6 | 4.2 | GO:0008218 | bioluminescence(GO:0008218) |
| 0.6 | 35.0 | GO:0030835 | negative regulation of actin filament depolymerization(GO:0030835) |
| 0.6 | 2.9 | GO:0010513 | positive regulation of phosphatidylinositol biosynthetic process(GO:0010513) |
| 0.6 | 2.3 | GO:0018352 | protein-pyridoxal-5-phosphate linkage(GO:0018352) |
| 0.6 | 2.3 | GO:1903772 | regulation of viral budding via host ESCRT complex(GO:1903772) |
| 0.6 | 4.4 | GO:0070444 | oligodendrocyte progenitor proliferation(GO:0070444) regulation of oligodendrocyte progenitor proliferation(GO:0070445) |
| 0.5 | 4.3 | GO:2000270 | negative regulation of fibroblast apoptotic process(GO:2000270) |
| 0.5 | 4.2 | GO:0014049 | positive regulation of glutamate secretion(GO:0014049) |
| 0.5 | 5.9 | GO:2001224 | positive regulation of neuron migration(GO:2001224) |
| 0.5 | 8.8 | GO:0007021 | tubulin complex assembly(GO:0007021) |
| 0.5 | 6.7 | GO:0034975 | protein folding in endoplasmic reticulum(GO:0034975) |
| 0.5 | 4.6 | GO:0045329 | carnitine biosynthetic process(GO:0045329) |
| 0.5 | 5.9 | GO:0035455 | response to interferon-alpha(GO:0035455) |
| 0.4 | 3.1 | GO:0036438 | maintenance of lens transparency(GO:0036438) |
| 0.4 | 6.1 | GO:0048387 | negative regulation of retinoic acid receptor signaling pathway(GO:0048387) |
| 0.4 | 1.3 | GO:0010606 | positive regulation of cytoplasmic mRNA processing body assembly(GO:0010606) |
| 0.4 | 3.4 | GO:0003065 | positive regulation of heart rate by epinephrine(GO:0003065) |
| 0.4 | 2.1 | GO:0015692 | lead ion transport(GO:0015692) |
| 0.4 | 2.5 | GO:0044857 | plasma membrane raft assembly(GO:0044854) plasma membrane raft organization(GO:0044857) |
| 0.4 | 1.3 | GO:0086044 | pulmonary valve formation(GO:0003193) atrial ventricular junction remodeling(GO:0003294) foramen ovale closure(GO:0035922) atrial cardiac muscle cell to AV node cell communication by electrical coupling(GO:0086044) bundle of His cell to Purkinje myocyte communication by electrical coupling(GO:0086054) Purkinje myocyte to ventricular cardiac muscle cell communication by electrical coupling(GO:0086055) regulation of Purkinje myocyte action potential(GO:0098906) vasomotion(GO:1990029) |
| 0.4 | 3.6 | GO:0001833 | inner cell mass cell proliferation(GO:0001833) |
| 0.4 | 4.7 | GO:1901223 | negative regulation of NIK/NF-kappaB signaling(GO:1901223) |
| 0.4 | 2.3 | GO:1904879 | positive regulation of calcium ion transmembrane transport via high voltage-gated calcium channel(GO:1904879) |
| 0.4 | 8.5 | GO:0043555 | regulation of translation in response to stress(GO:0043555) |
| 0.4 | 1.1 | GO:0031446 | regulation of fast-twitch skeletal muscle fiber contraction(GO:0031446) positive regulation of fast-twitch skeletal muscle fiber contraction(GO:0031448) |
| 0.4 | 7.7 | GO:0006123 | mitochondrial electron transport, cytochrome c to oxygen(GO:0006123) |
| 0.3 | 2.8 | GO:0097039 | protein linear polyubiquitination(GO:0097039) |
| 0.3 | 10.3 | GO:0051491 | positive regulation of filopodium assembly(GO:0051491) |
| 0.3 | 3.1 | GO:0072520 | seminiferous tubule development(GO:0072520) |
| 0.3 | 3.6 | GO:0042118 | endothelial cell activation(GO:0042118) |
| 0.3 | 6.3 | GO:0089711 | L-glutamate transmembrane transport(GO:0089711) |
| 0.3 | 4.0 | GO:0031274 | positive regulation of pseudopodium assembly(GO:0031274) |
| 0.3 | 1.6 | GO:0035726 | common myeloid progenitor cell proliferation(GO:0035726) |
| 0.3 | 3.3 | GO:0006554 | lysine catabolic process(GO:0006554) |
| 0.3 | 3.3 | GO:0030042 | actin filament depolymerization(GO:0030042) |
| 0.3 | 5.6 | GO:0046602 | regulation of mitotic centrosome separation(GO:0046602) |
| 0.3 | 4.1 | GO:1904776 | regulation of protein localization to cell cortex(GO:1904776) positive regulation of protein localization to cell cortex(GO:1904778) |
| 0.3 | 0.9 | GO:0038098 | sequestering of BMP from receptor via BMP binding(GO:0038098) |
| 0.3 | 2.0 | GO:0097105 | presynaptic membrane assembly(GO:0097105) |
| 0.3 | 7.7 | GO:0070536 | protein K63-linked deubiquitination(GO:0070536) |
| 0.3 | 12.9 | GO:0000413 | protein peptidyl-prolyl isomerization(GO:0000413) |
| 0.3 | 2.5 | GO:0035092 | sperm chromatin condensation(GO:0035092) |
| 0.3 | 1.7 | GO:0061635 | regulation of protein complex stability(GO:0061635) |
| 0.3 | 11.5 | GO:0071549 | cellular response to dexamethasone stimulus(GO:0071549) |
| 0.3 | 5.7 | GO:0035635 | entry of bacterium into host cell(GO:0035635) |
| 0.3 | 1.6 | GO:0070383 | DNA cytosine deamination(GO:0070383) |
| 0.3 | 6.2 | GO:0036150 | phosphatidylserine acyl-chain remodeling(GO:0036150) |
| 0.3 | 1.9 | GO:0040032 | post-embryonic body morphogenesis(GO:0040032) |
| 0.3 | 0.8 | GO:0050720 | interleukin-1 beta biosynthetic process(GO:0050720) |
| 0.3 | 29.7 | GO:0031146 | SCF-dependent proteasomal ubiquitin-dependent protein catabolic process(GO:0031146) |
| 0.3 | 2.4 | GO:0034214 | protein hexamerization(GO:0034214) |
| 0.3 | 2.6 | GO:0060013 | righting reflex(GO:0060013) |
| 0.3 | 0.3 | GO:0046668 | regulation of retinal cell programmed cell death(GO:0046668) |
| 0.3 | 1.3 | GO:1903377 | negative regulation of oxidative stress-induced neuron intrinsic apoptotic signaling pathway(GO:1903377) |
| 0.2 | 12.5 | GO:0000381 | regulation of alternative mRNA splicing, via spliceosome(GO:0000381) |
| 0.2 | 1.0 | GO:0001545 | primary ovarian follicle growth(GO:0001545) |
| 0.2 | 6.3 | GO:0043968 | histone H2A acetylation(GO:0043968) |
| 0.2 | 10.8 | GO:0050690 | regulation of defense response to virus by virus(GO:0050690) |
| 0.2 | 1.4 | GO:0090074 | negative regulation of protein homodimerization activity(GO:0090074) |
| 0.2 | 5.5 | GO:0071498 | cellular response to fluid shear stress(GO:0071498) |
| 0.2 | 3.0 | GO:0006511 | ubiquitin-dependent protein catabolic process(GO:0006511) |
| 0.2 | 1.6 | GO:0006102 | isocitrate metabolic process(GO:0006102) |
| 0.2 | 0.7 | GO:0045875 | negative regulation of sister chromatid cohesion(GO:0045875) |
| 0.2 | 2.9 | GO:0000479 | endonucleolytic cleavage of tricistronic rRNA transcript (SSU-rRNA, 5.8S rRNA, LSU-rRNA)(GO:0000479) |
| 0.2 | 13.0 | GO:0006120 | mitochondrial electron transport, NADH to ubiquinone(GO:0006120) |
| 0.2 | 2.9 | GO:0016081 | synaptic vesicle docking(GO:0016081) |
| 0.2 | 2.4 | GO:0090091 | positive regulation of extracellular matrix disassembly(GO:0090091) |
| 0.2 | 9.4 | GO:0006699 | bile acid biosynthetic process(GO:0006699) |
| 0.2 | 1.1 | GO:0070980 | biphenyl catabolic process(GO:0070980) |
| 0.2 | 15.6 | GO:0010507 | negative regulation of autophagy(GO:0010507) |
| 0.2 | 2.4 | GO:0051601 | exocyst localization(GO:0051601) |
| 0.2 | 0.6 | GO:0071314 | cellular response to cocaine(GO:0071314) |
| 0.2 | 11.6 | GO:0060997 | dendritic spine morphogenesis(GO:0060997) |
| 0.2 | 4.1 | GO:0033169 | histone H3-K9 demethylation(GO:0033169) |
| 0.2 | 0.6 | GO:0045112 | integrin biosynthetic process(GO:0045112) regulation of integrin biosynthetic process(GO:0045113) positive regulation of integrin biosynthetic process(GO:0045726) |
| 0.2 | 1.6 | GO:0019720 | Mo-molybdopterin cofactor biosynthetic process(GO:0006777) Mo-molybdopterin cofactor metabolic process(GO:0019720) |
| 0.2 | 0.8 | GO:0045872 | positive regulation of rhodopsin gene expression(GO:0045872) |
| 0.2 | 1.1 | GO:0003298 | physiological muscle hypertrophy(GO:0003298) physiological cardiac muscle hypertrophy(GO:0003301) cell growth involved in cardiac muscle cell development(GO:0061049) |
| 0.2 | 0.7 | GO:1900041 | negative regulation of interleukin-2 secretion(GO:1900041) |
| 0.2 | 2.6 | GO:2000480 | negative regulation of cAMP-dependent protein kinase activity(GO:2000480) |
| 0.2 | 1.7 | GO:0031953 | negative regulation of protein autophosphorylation(GO:0031953) |
| 0.2 | 0.5 | GO:1901524 | regulation of macromitophagy(GO:1901524) positive regulation of macromitophagy(GO:1901526) regulation of mitophagy in response to mitochondrial depolarization(GO:1904923) positive regulation of mitophagy in response to mitochondrial depolarization(GO:1904925) |
| 0.2 | 1.7 | GO:0071763 | nuclear membrane organization(GO:0071763) |
| 0.2 | 6.9 | GO:0015986 | energy coupled proton transport, down electrochemical gradient(GO:0015985) ATP synthesis coupled proton transport(GO:0015986) |
| 0.2 | 10.9 | GO:0045071 | negative regulation of viral genome replication(GO:0045071) |
| 0.2 | 7.1 | GO:0070534 | protein K63-linked ubiquitination(GO:0070534) |
| 0.2 | 0.8 | GO:0051552 | flavone metabolic process(GO:0051552) |
| 0.2 | 33.2 | GO:0031032 | actomyosin structure organization(GO:0031032) |
| 0.2 | 3.1 | GO:0071420 | cellular response to histamine(GO:0071420) |
| 0.2 | 0.3 | GO:0060437 | lung growth(GO:0060437) |
| 0.2 | 3.8 | GO:0001783 | B cell apoptotic process(GO:0001783) |
| 0.2 | 1.4 | GO:0009249 | protein lipoylation(GO:0009249) |
| 0.1 | 1.0 | GO:1901529 | positive regulation of anion channel activity(GO:1901529) positive regulation of anion transmembrane transport(GO:1903961) |
| 0.1 | 0.4 | GO:0097498 | endothelial tube lumen extension(GO:0097498) |
| 0.1 | 5.0 | GO:0000027 | ribosomal large subunit assembly(GO:0000027) |
| 0.1 | 0.5 | GO:0090527 | actin filament reorganization(GO:0090527) |
| 0.1 | 0.3 | GO:0032687 | negative regulation of interferon-alpha production(GO:0032687) |
| 0.1 | 1.4 | GO:1903204 | negative regulation of oxidative stress-induced neuron death(GO:1903204) |
| 0.1 | 2.9 | GO:0033683 | nucleotide-excision repair, DNA incision(GO:0033683) |
| 0.1 | 1.1 | GO:0048172 | regulation of short-term neuronal synaptic plasticity(GO:0048172) |
| 0.1 | 2.4 | GO:0090110 | cargo loading into COPII-coated vesicle(GO:0090110) |
| 0.1 | 0.9 | GO:0006686 | sphingomyelin biosynthetic process(GO:0006686) |
| 0.1 | 4.5 | GO:0006356 | regulation of transcription from RNA polymerase I promoter(GO:0006356) |
| 0.1 | 1.6 | GO:0071285 | cellular response to lithium ion(GO:0071285) establishment of integrated proviral latency(GO:0075713) |
| 0.1 | 0.8 | GO:0006307 | DNA dealkylation involved in DNA repair(GO:0006307) |
| 0.1 | 6.1 | GO:0008542 | visual learning(GO:0008542) |
| 0.1 | 1.3 | GO:0007252 | I-kappaB phosphorylation(GO:0007252) |
| 0.1 | 3.0 | GO:0030488 | tRNA methylation(GO:0030488) |
| 0.1 | 1.0 | GO:0006682 | galactosylceramide biosynthetic process(GO:0006682) galactolipid biosynthetic process(GO:0019375) |
| 0.1 | 1.9 | GO:0070884 | regulation of calcineurin-NFAT signaling cascade(GO:0070884) |
| 0.1 | 0.5 | GO:0030070 | insulin processing(GO:0030070) |
| 0.1 | 0.5 | GO:1904141 | positive regulation of odontogenesis of dentin-containing tooth(GO:0042488) mammary gland fat development(GO:0060611) positive regulation of macrophage colony-stimulating factor signaling pathway(GO:1902228) positive regulation of response to macrophage colony-stimulating factor(GO:1903971) positive regulation of cellular response to macrophage colony-stimulating factor stimulus(GO:1903974) positive regulation of microglial cell migration(GO:1904141) |
| 0.1 | 4.6 | GO:0050435 | beta-amyloid metabolic process(GO:0050435) |
| 0.1 | 2.8 | GO:1904659 | hexose transmembrane transport(GO:0035428) glucose transmembrane transport(GO:1904659) |
| 0.1 | 0.1 | GO:0045636 | positive regulation of melanocyte differentiation(GO:0045636) |
| 0.1 | 3.5 | GO:0042769 | DNA damage response, detection of DNA damage(GO:0042769) |
| 0.1 | 1.6 | GO:0006488 | dolichol-linked oligosaccharide biosynthetic process(GO:0006488) |
| 0.1 | 1.1 | GO:0043923 | positive regulation by host of viral transcription(GO:0043923) |
| 0.1 | 1.3 | GO:0051386 | regulation of neurotrophin TRK receptor signaling pathway(GO:0051386) |
| 0.1 | 0.6 | GO:0007256 | activation of JNKK activity(GO:0007256) |
| 0.1 | 1.8 | GO:2001022 | positive regulation of response to DNA damage stimulus(GO:2001022) |
| 0.1 | 2.4 | GO:0034080 | CENP-A containing nucleosome assembly(GO:0034080) CENP-A containing chromatin organization(GO:0061641) |
| 0.1 | 3.5 | GO:0046513 | ceramide biosynthetic process(GO:0046513) |
| 0.1 | 5.8 | GO:0048207 | vesicle targeting, rough ER to cis-Golgi(GO:0048207) COPII vesicle coating(GO:0048208) |
| 0.1 | 0.7 | GO:0006564 | L-serine biosynthetic process(GO:0006564) |
| 0.1 | 0.6 | GO:0046007 | negative regulation of activated T cell proliferation(GO:0046007) |
| 0.1 | 0.4 | GO:0010536 | positive regulation of activation of Janus kinase activity(GO:0010536) |
| 0.1 | 0.8 | GO:0018345 | protein palmitoylation(GO:0018345) |
| 0.1 | 9.8 | GO:0006805 | xenobiotic metabolic process(GO:0006805) |
| 0.1 | 0.3 | GO:0051597 | response to methylmercury(GO:0051597) |
| 0.1 | 8.4 | GO:0090002 | establishment of protein localization to plasma membrane(GO:0090002) |
| 0.1 | 1.4 | GO:0032467 | positive regulation of cytokinesis(GO:0032467) |
| 0.1 | 32.3 | GO:0007264 | small GTPase mediated signal transduction(GO:0007264) |
| 0.1 | 0.2 | GO:2000015 | regulation of determination of dorsal identity(GO:2000015) |
| 0.1 | 1.2 | GO:0000028 | ribosomal small subunit assembly(GO:0000028) |
| 0.1 | 2.8 | GO:0051443 | positive regulation of ubiquitin-protein transferase activity(GO:0051443) |
| 0.1 | 1.0 | GO:0048873 | homeostasis of number of cells within a tissue(GO:0048873) |
| 0.1 | 1.7 | GO:0043276 | anoikis(GO:0043276) |
| 0.1 | 5.4 | GO:0035335 | peptidyl-tyrosine dephosphorylation(GO:0035335) |
| 0.1 | 0.6 | GO:0006108 | malate metabolic process(GO:0006108) |
| 0.0 | 0.1 | GO:1990504 | dense core granule exocytosis(GO:1990504) |
| 0.0 | 9.9 | GO:0007411 | axon guidance(GO:0007411) |
| 0.0 | 0.1 | GO:0038043 | interleukin-5-mediated signaling pathway(GO:0038043) |
| 0.0 | 2.1 | GO:0070527 | platelet aggregation(GO:0070527) |
| 0.0 | 1.4 | GO:0006400 | tRNA modification(GO:0006400) |
| 0.0 | 0.6 | GO:0008053 | mitochondrial fusion(GO:0008053) |
| 0.0 | 5.8 | GO:0006275 | regulation of DNA replication(GO:0006275) |
| 0.0 | 1.4 | GO:0010972 | negative regulation of G2/M transition of mitotic cell cycle(GO:0010972) |
| 0.0 | 2.5 | GO:0042475 | odontogenesis of dentin-containing tooth(GO:0042475) |
| 0.0 | 0.8 | GO:0045745 | positive regulation of G-protein coupled receptor protein signaling pathway(GO:0045745) |
| 0.0 | 0.8 | GO:0043407 | negative regulation of MAP kinase activity(GO:0043407) |
| 0.0 | 0.3 | GO:1901621 | negative regulation of smoothened signaling pathway involved in dorsal/ventral neural tube patterning(GO:1901621) |
| 0.0 | 1.7 | GO:0021549 | cerebellum development(GO:0021549) |
| 0.0 | 0.4 | GO:0045838 | positive regulation of membrane potential(GO:0045838) |
| 0.0 | 2.6 | GO:0006369 | termination of RNA polymerase II transcription(GO:0006369) |
| 0.0 | 0.1 | GO:0007500 | mesodermal cell fate determination(GO:0007500) negative regulation of intracellular transport of viral material(GO:1901253) |
| 0.0 | 1.1 | GO:0032781 | positive regulation of ATPase activity(GO:0032781) |
| 0.0 | 1.2 | GO:0001578 | microtubule bundle formation(GO:0001578) |
| 0.0 | 0.2 | GO:0044804 | nucleophagy(GO:0044804) |
| 0.0 | 0.4 | GO:0033189 | response to vitamin A(GO:0033189) |
| 0.0 | 2.5 | GO:0007156 | homophilic cell adhesion via plasma membrane adhesion molecules(GO:0007156) |
| 0.0 | 4.6 | GO:0043687 | post-translational protein modification(GO:0043687) |
| 0.0 | 3.9 | GO:0000398 | RNA splicing, via transesterification reactions with bulged adenosine as nucleophile(GO:0000377) mRNA splicing, via spliceosome(GO:0000398) |
| 0.0 | 0.4 | GO:0036498 | IRE1-mediated unfolded protein response(GO:0036498) |
Gene overrepresentation in cellular_component category:
| Log-likelihood per target | Total log-likelihood | Term | Description |
|---|---|---|---|
| 5.0 | 14.9 | GO:0019034 | viral replication complex(GO:0019034) |
| 2.4 | 9.7 | GO:0070032 | synaptobrevin 2-SNAP-25-syntaxin-1a-complexin I complex(GO:0070032) |
| 2.4 | 2.4 | GO:0098592 | cytoplasmic side of apical plasma membrane(GO:0098592) |
| 2.1 | 25.7 | GO:0019773 | proteasome core complex, alpha-subunit complex(GO:0019773) |
| 2.0 | 7.8 | GO:0097454 | Schwann cell microvillus(GO:0097454) |
| 1.9 | 38.6 | GO:0071782 | endoplasmic reticulum tubular network(GO:0071782) |
| 1.9 | 5.6 | GO:0097489 | multivesicular body, internal vesicle lumen(GO:0097489) |
| 1.9 | 5.6 | GO:0005588 | collagen type V trimer(GO:0005588) |
| 1.7 | 6.9 | GO:0060200 | clathrin-sculpted acetylcholine transport vesicle(GO:0060200) clathrin-sculpted acetylcholine transport vesicle membrane(GO:0060201) |
| 1.6 | 11.2 | GO:1990812 | growth cone filopodium(GO:1990812) |
| 1.5 | 16.7 | GO:0005614 | interstitial matrix(GO:0005614) |
| 1.5 | 4.4 | GO:0072534 | perineuronal net(GO:0072534) |
| 1.5 | 22.1 | GO:0005916 | fascia adherens(GO:0005916) |
| 1.4 | 9.9 | GO:0030121 | AP-1 adaptor complex(GO:0030121) |
| 1.3 | 5.2 | GO:0048787 | presynaptic active zone membrane(GO:0048787) |
| 1.2 | 6.0 | GO:0044530 | supraspliceosomal complex(GO:0044530) |
| 1.1 | 3.4 | GO:0018444 | translation release factor complex(GO:0018444) |
| 1.0 | 6.1 | GO:0008537 | proteasome activator complex(GO:0008537) |
| 1.0 | 15.9 | GO:0031362 | anchored component of external side of plasma membrane(GO:0031362) |
| 1.0 | 6.9 | GO:0061700 | GATOR2 complex(GO:0061700) |
| 1.0 | 13.5 | GO:0031618 | nuclear pericentric heterochromatin(GO:0031618) |
| 1.0 | 7.7 | GO:0070552 | BRISC complex(GO:0070552) |
| 0.9 | 4.7 | GO:0097422 | tubular endosome(GO:0097422) |
| 0.9 | 3.6 | GO:0000811 | GINS complex(GO:0000811) |
| 0.9 | 6.2 | GO:0035692 | macrophage migration inhibitory factor receptor complex(GO:0035692) |
| 0.8 | 2.4 | GO:0070762 | nuclear pore transmembrane ring(GO:0070762) |
| 0.8 | 16.5 | GO:0016281 | eukaryotic translation initiation factor 4F complex(GO:0016281) |
| 0.7 | 6.7 | GO:0072546 | ER membrane protein complex(GO:0072546) |
| 0.7 | 25.4 | GO:0000159 | protein phosphatase type 2A complex(GO:0000159) |
| 0.7 | 7.4 | GO:0008541 | proteasome regulatory particle, lid subcomplex(GO:0008541) |
| 0.7 | 3.6 | GO:0035370 | UBC13-UEV1A complex(GO:0035370) |
| 0.7 | 12.9 | GO:0031089 | platelet dense granule lumen(GO:0031089) |
| 0.7 | 13.9 | GO:0005952 | cAMP-dependent protein kinase complex(GO:0005952) |
| 0.7 | 3.4 | GO:0043527 | tRNA methyltransferase complex(GO:0043527) |
| 0.7 | 6.7 | GO:0097255 | R2TP complex(GO:0097255) |
| 0.7 | 6.6 | GO:0070937 | CRD-mediated mRNA stability complex(GO:0070937) |
| 0.7 | 7.3 | GO:0035985 | senescence-associated heterochromatin focus(GO:0035985) |
| 0.6 | 9.2 | GO:0030478 | actin cap(GO:0030478) |
| 0.6 | 6.6 | GO:0016600 | flotillin complex(GO:0016600) |
| 0.6 | 5.4 | GO:0098643 | fibrillar collagen trimer(GO:0005583) banded collagen fibril(GO:0098643) |
| 0.6 | 3.0 | GO:0033503 | HULC complex(GO:0033503) |
| 0.6 | 5.3 | GO:0005915 | zonula adherens(GO:0005915) |
| 0.6 | 2.8 | GO:0071797 | LUBAC complex(GO:0071797) |
| 0.5 | 14.3 | GO:0031307 | integral component of mitochondrial outer membrane(GO:0031307) |
| 0.5 | 11.9 | GO:0005689 | U12-type spliceosomal complex(GO:0005689) |
| 0.5 | 10.3 | GO:0044295 | axonal growth cone(GO:0044295) |
| 0.5 | 7.0 | GO:0097512 | cardiac myofibril(GO:0097512) |
| 0.5 | 5.5 | GO:0097025 | lateral loop(GO:0043219) MPP7-DLG1-LIN7 complex(GO:0097025) |
| 0.5 | 7.7 | GO:0045277 | respiratory chain complex IV(GO:0045277) |
| 0.4 | 6.7 | GO:0043220 | Schmidt-Lanterman incisure(GO:0043220) |
| 0.4 | 35.5 | GO:0097610 | cleavage furrow(GO:0032154) cell surface furrow(GO:0097610) |
| 0.4 | 1.8 | GO:0030915 | Smc5-Smc6 complex(GO:0030915) |
| 0.4 | 2.1 | GO:0070826 | paraferritin complex(GO:0070826) |
| 0.4 | 11.9 | GO:0071682 | endocytic vesicle lumen(GO:0071682) |
| 0.4 | 5.1 | GO:0008385 | IkappaB kinase complex(GO:0008385) |
| 0.4 | 2.6 | GO:0000275 | mitochondrial proton-transporting ATP synthase complex, catalytic core F(1)(GO:0000275) |
| 0.3 | 4.2 | GO:0043203 | axon hillock(GO:0043203) |
| 0.3 | 5.8 | GO:0032059 | bleb(GO:0032059) |
| 0.3 | 1.7 | GO:0071556 | integral component of lumenal side of endoplasmic reticulum membrane(GO:0071556) lumenal side of endoplasmic reticulum membrane(GO:0098553) |
| 0.3 | 2.3 | GO:0000813 | ESCRT I complex(GO:0000813) |
| 0.3 | 11.9 | GO:0031430 | M band(GO:0031430) |
| 0.3 | 4.1 | GO:0008091 | spectrin(GO:0008091) |
| 0.3 | 12.7 | GO:1904115 | axon cytoplasm(GO:1904115) |
| 0.3 | 3.5 | GO:0010369 | chromocenter(GO:0010369) |
| 0.3 | 1.6 | GO:0005958 | DNA-dependent protein kinase-DNA ligase 4 complex(GO:0005958) DNA ligase IV complex(GO:0032807) |
| 0.3 | 2.3 | GO:0061200 | clathrin-sculpted gamma-aminobutyric acid transport vesicle(GO:0061200) clathrin-sculpted gamma-aminobutyric acid transport vesicle membrane(GO:0061202) |
| 0.3 | 4.5 | GO:0005736 | DNA-directed RNA polymerase I complex(GO:0005736) |
| 0.2 | 3.1 | GO:1990023 | mitotic spindle midzone(GO:1990023) |
| 0.2 | 4.8 | GO:0005753 | mitochondrial proton-transporting ATP synthase complex(GO:0005753) |
| 0.2 | 6.3 | GO:0035267 | NuA4 histone acetyltransferase complex(GO:0035267) H4/H2A histone acetyltransferase complex(GO:0043189) H4 histone acetyltransferase complex(GO:1902562) |
| 0.2 | 3.3 | GO:0042405 | nuclear inclusion body(GO:0042405) |
| 0.2 | 12.6 | GO:0018995 | host(GO:0018995) host cell(GO:0043657) |
| 0.2 | 16.4 | GO:0072686 | mitotic spindle(GO:0072686) |
| 0.2 | 2.7 | GO:0005671 | Ada2/Gcn5/Ada3 transcription activator complex(GO:0005671) |
| 0.2 | 39.8 | GO:0043209 | myelin sheath(GO:0043209) |
| 0.2 | 2.8 | GO:0035102 | PRC1 complex(GO:0035102) |
| 0.2 | 2.4 | GO:0005686 | U2 snRNP(GO:0005686) |
| 0.2 | 1.2 | GO:0097442 | CA3 pyramidal cell dendrite(GO:0097442) |
| 0.2 | 0.9 | GO:0031905 | early endosome lumen(GO:0031905) |
| 0.2 | 5.5 | GO:0044665 | MLL1/2 complex(GO:0044665) MLL1 complex(GO:0071339) |
| 0.2 | 2.5 | GO:0001533 | cornified envelope(GO:0001533) |
| 0.2 | 11.4 | GO:0005643 | nuclear pore(GO:0005643) |
| 0.2 | 2.3 | GO:1990454 | L-type voltage-gated calcium channel complex(GO:1990454) |
| 0.2 | 4.5 | GO:0005791 | rough endoplasmic reticulum(GO:0005791) |
| 0.2 | 3.6 | GO:0099738 | cell cortex region(GO:0099738) |
| 0.2 | 5.6 | GO:0005871 | kinesin complex(GO:0005871) |
| 0.2 | 0.9 | GO:0000138 | Golgi trans cisterna(GO:0000138) |
| 0.2 | 1.3 | GO:0042382 | paraspeckles(GO:0042382) |
| 0.1 | 8.5 | GO:0045271 | mitochondrial respiratory chain complex I(GO:0005747) NADH dehydrogenase complex(GO:0030964) respiratory chain complex I(GO:0045271) |
| 0.1 | 1.3 | GO:0030015 | CCR4-NOT core complex(GO:0030015) |
| 0.1 | 7.9 | GO:0000307 | cyclin-dependent protein kinase holoenzyme complex(GO:0000307) |
| 0.1 | 4.3 | GO:0005790 | smooth endoplasmic reticulum(GO:0005790) |
| 0.1 | 2.8 | GO:0070822 | Sin3-type complex(GO:0070822) |
| 0.1 | 7.0 | GO:0019005 | SCF ubiquitin ligase complex(GO:0019005) |
| 0.1 | 3.5 | GO:0005763 | organellar small ribosomal subunit(GO:0000314) mitochondrial small ribosomal subunit(GO:0005763) |
| 0.1 | 2.1 | GO:0031095 | platelet dense tubular network membrane(GO:0031095) |
| 0.1 | 8.2 | GO:0012507 | ER to Golgi transport vesicle membrane(GO:0012507) |
| 0.1 | 6.8 | GO:0022627 | cytosolic small ribosomal subunit(GO:0022627) |
| 0.1 | 8.7 | GO:0005901 | caveola(GO:0005901) |
| 0.1 | 2.9 | GO:0030686 | 90S preribosome(GO:0030686) |
| 0.1 | 24.4 | GO:0005770 | late endosome(GO:0005770) |
| 0.1 | 15.2 | GO:0030427 | site of polarized growth(GO:0030427) |
| 0.1 | 13.7 | GO:0043204 | perikaryon(GO:0043204) |
| 0.1 | 2.2 | GO:0001527 | microfibril(GO:0001527) fibril(GO:0043205) |
| 0.1 | 1.6 | GO:0000932 | cytoplasmic mRNA processing body(GO:0000932) |
| 0.1 | 7.1 | GO:0005776 | autophagosome(GO:0005776) |
| 0.1 | 4.3 | GO:0015030 | Cajal body(GO:0015030) |
| 0.1 | 3.1 | GO:1902711 | GABA-A receptor complex(GO:1902711) |
| 0.1 | 0.5 | GO:1990682 | CSF1-CSF1R complex(GO:1990682) |
| 0.1 | 0.3 | GO:0097058 | CRLF-CLCF1 complex(GO:0097058) |
| 0.1 | 2.9 | GO:0045171 | intercellular bridge(GO:0045171) |
| 0.1 | 13.7 | GO:0005681 | spliceosomal complex(GO:0005681) |
| 0.1 | 1.3 | GO:0005922 | connexon complex(GO:0005922) |
| 0.1 | 1.1 | GO:0034663 | endoplasmic reticulum chaperone complex(GO:0034663) |
| 0.1 | 0.6 | GO:0071438 | invadopodium membrane(GO:0071438) |
| 0.1 | 3.9 | GO:0005637 | nuclear inner membrane(GO:0005637) |
| 0.1 | 2.9 | GO:0005881 | cytoplasmic microtubule(GO:0005881) |
| 0.1 | 4.9 | GO:0032587 | ruffle membrane(GO:0032587) |
| 0.1 | 3.1 | GO:0042641 | actomyosin(GO:0042641) |
| 0.1 | 7.8 | GO:0008021 | synaptic vesicle(GO:0008021) |
| 0.1 | 0.9 | GO:0030425 | dendrite(GO:0030425) |
| 0.1 | 4.6 | GO:0016363 | nuclear matrix(GO:0016363) |
| 0.0 | 8.1 | GO:0005840 | ribosome(GO:0005840) |
| 0.0 | 2.4 | GO:0031907 | peroxisomal matrix(GO:0005782) microbody lumen(GO:0031907) |
| 0.0 | 16.1 | GO:0005925 | focal adhesion(GO:0005925) |
| 0.0 | 2.7 | GO:0030496 | midbody(GO:0030496) |
| 0.0 | 0.1 | GO:0031213 | RSF complex(GO:0031213) |
| 0.0 | 0.6 | GO:0035145 | exon-exon junction complex(GO:0035145) |
| 0.0 | 0.9 | GO:0016592 | mediator complex(GO:0016592) |
| 0.0 | 8.0 | GO:0016607 | nuclear speck(GO:0016607) |
| 0.0 | 0.2 | GO:0034045 | pre-autophagosomal structure membrane(GO:0034045) |
| 0.0 | 0.7 | GO:0031519 | PcG protein complex(GO:0031519) |
| 0.0 | 0.6 | GO:0030173 | integral component of Golgi membrane(GO:0030173) |
| 0.0 | 2.3 | GO:0001650 | fibrillar center(GO:0001650) |
| 0.0 | 0.4 | GO:0034361 | very-low-density lipoprotein particle(GO:0034361) triglyceride-rich lipoprotein particle(GO:0034385) |
| 0.0 | 2.5 | GO:0005743 | mitochondrial inner membrane(GO:0005743) |
| 0.0 | 1.2 | GO:0005874 | microtubule(GO:0005874) |
| 0.0 | 1.0 | GO:0005882 | intermediate filament(GO:0005882) |
| 0.0 | 0.6 | GO:0005741 | mitochondrial outer membrane(GO:0005741) |
| 0.0 | 0.3 | GO:0032391 | photoreceptor connecting cilium(GO:0032391) |
| 0.0 | 0.9 | GO:0070821 | tertiary granule membrane(GO:0070821) |
Gene overrepresentation in molecular_function category:
| Log-likelihood per target | Total log-likelihood | Term | Description |
|---|---|---|---|
| 4.2 | 12.7 | GO:0008426 | protein kinase C inhibitor activity(GO:0008426) |
| 3.4 | 40.5 | GO:0019911 | structural constituent of myelin sheath(GO:0019911) |
| 3.0 | 14.9 | GO:0034046 | poly(G) binding(GO:0034046) |
| 2.7 | 8.2 | GO:0004694 | eukaryotic translation initiation factor 2alpha kinase activity(GO:0004694) |
| 2.7 | 27.3 | GO:0010314 | phosphatidylinositol-5-phosphate binding(GO:0010314) |
| 2.4 | 14.3 | GO:0016909 | JUN kinase activity(GO:0004705) SAP kinase activity(GO:0016909) |
| 2.3 | 32.7 | GO:0005132 | type I interferon receptor binding(GO:0005132) |
| 1.5 | 4.6 | GO:0008798 | beta-aspartyl-peptidase activity(GO:0008798) |
| 1.5 | 13.4 | GO:0043426 | MRF binding(GO:0043426) |
| 1.4 | 6.9 | GO:0030348 | syntaxin-3 binding(GO:0030348) |
| 1.3 | 10.4 | GO:0044323 | retinoic acid-responsive element binding(GO:0044323) |
| 1.3 | 15.5 | GO:0031386 | protein tag(GO:0031386) |
| 1.3 | 8.9 | GO:0004849 | uridine kinase activity(GO:0004849) |
| 1.2 | 11.9 | GO:0030911 | TPR domain binding(GO:0030911) |
| 1.2 | 9.4 | GO:0034235 | GPI anchor binding(GO:0034235) |
| 1.2 | 5.8 | GO:0004830 | tryptophan-tRNA ligase activity(GO:0004830) |
| 1.1 | 4.6 | GO:0008336 | gamma-butyrobetaine dioxygenase activity(GO:0008336) |
| 1.1 | 10.2 | GO:0001162 | RNA polymerase II intronic transcription regulatory region sequence-specific DNA binding(GO:0001162) |
| 1.1 | 5.6 | GO:0005006 | epidermal growth factor-activated receptor activity(GO:0005006) |
| 1.1 | 6.7 | GO:0043141 | ATP-dependent 5'-3' DNA helicase activity(GO:0043141) |
| 1.1 | 11.2 | GO:0051425 | PTB domain binding(GO:0051425) |
| 1.1 | 13.2 | GO:0016857 | racemase and epimerase activity, acting on carbohydrates and derivatives(GO:0016857) |
| 1.1 | 5.4 | GO:0004771 | sterol esterase activity(GO:0004771) |
| 1.0 | 7.0 | GO:0052739 | phosphatidylserine 1-acylhydrolase activity(GO:0052739) |
| 1.0 | 2.9 | GO:0017108 | 5'-flap endonuclease activity(GO:0017108) |
| 0.9 | 12.2 | GO:0017162 | aryl hydrocarbon receptor binding(GO:0017162) |
| 0.9 | 15.0 | GO:0004691 | cAMP-dependent protein kinase activity(GO:0004691) |
| 0.9 | 3.6 | GO:0055077 | gap junction hemi-channel activity(GO:0055077) |
| 0.9 | 3.5 | GO:0003726 | double-stranded RNA adenosine deaminase activity(GO:0003726) |
| 0.9 | 7.8 | GO:0004032 | alditol:NADP+ 1-oxidoreductase activity(GO:0004032) |
| 0.9 | 6.1 | GO:0061133 | endopeptidase activator activity(GO:0061133) |
| 0.9 | 5.2 | GO:0061649 | ubiquitinated histone binding(GO:0061649) |
| 0.8 | 18.6 | GO:0000339 | RNA cap binding(GO:0000339) |
| 0.8 | 3.3 | GO:0016639 | oxidoreductase activity, acting on the CH-NH2 group of donors, NAD or NADP as acceptor(GO:0016639) |
| 0.8 | 4.1 | GO:0005294 | neutral L-amino acid secondary active transmembrane transporter activity(GO:0005294) |
| 0.8 | 2.3 | GO:0008309 | double-stranded DNA exodeoxyribonuclease activity(GO:0008309) |
| 0.8 | 19.2 | GO:0017166 | vinculin binding(GO:0017166) |
| 0.7 | 32.8 | GO:0050699 | WW domain binding(GO:0050699) |
| 0.7 | 5.0 | GO:0004046 | aminoacylase activity(GO:0004046) |
| 0.7 | 32.3 | GO:0003785 | actin monomer binding(GO:0003785) |
| 0.7 | 2.8 | GO:0005412 | glucose:sodium symporter activity(GO:0005412) |
| 0.6 | 11.8 | GO:0048156 | tau protein binding(GO:0048156) |
| 0.6 | 4.9 | GO:0008379 | thioredoxin peroxidase activity(GO:0008379) |
| 0.6 | 7.2 | GO:0016423 | tRNA (guanine) methyltransferase activity(GO:0016423) |
| 0.6 | 3.5 | GO:0050291 | sphingosine N-acyltransferase activity(GO:0050291) |
| 0.6 | 2.8 | GO:0018479 | benzaldehyde dehydrogenase (NAD+) activity(GO:0018479) |
| 0.6 | 2.8 | GO:0071535 | RING-like zinc finger domain binding(GO:0071535) |
| 0.6 | 3.4 | GO:0008079 | translation release factor activity(GO:0003747) translation termination factor activity(GO:0008079) |
| 0.5 | 16.2 | GO:0070003 | threonine-type endopeptidase activity(GO:0004298) threonine-type peptidase activity(GO:0070003) |
| 0.5 | 14.4 | GO:0019198 | transmembrane receptor protein tyrosine phosphatase activity(GO:0005001) transmembrane receptor protein phosphatase activity(GO:0019198) |
| 0.5 | 5.5 | GO:0097016 | L27 domain binding(GO:0097016) |
| 0.5 | 2.9 | GO:0034511 | U3 snoRNA binding(GO:0034511) |
| 0.5 | 2.4 | GO:0038062 | protein tyrosine kinase collagen receptor activity(GO:0038062) |
| 0.5 | 12.5 | GO:0017075 | syntaxin-1 binding(GO:0017075) |
| 0.5 | 12.9 | GO:0005527 | macrolide binding(GO:0005527) FK506 binding(GO:0005528) |
| 0.4 | 11.4 | GO:0070064 | proline-rich region binding(GO:0070064) |
| 0.4 | 3.1 | GO:0008109 | N-acetyllactosaminide beta-1,6-N-acetylglucosaminyltransferase activity(GO:0008109) |
| 0.4 | 0.9 | GO:0010861 | thyroid hormone receptor activator activity(GO:0010861) thyroid hormone receptor coactivator activity(GO:0030375) |
| 0.4 | 3.5 | GO:0089720 | caspase binding(GO:0089720) |
| 0.4 | 2.1 | GO:0015087 | cadmium ion transmembrane transporter activity(GO:0015086) cobalt ion transmembrane transporter activity(GO:0015087) lead ion transmembrane transporter activity(GO:0015094) ferrous iron uptake transmembrane transporter activity(GO:0015639) |
| 0.4 | 4.1 | GO:0042731 | PH domain binding(GO:0042731) |
| 0.4 | 4.0 | GO:0019237 | satellite DNA binding(GO:0003696) centromeric DNA binding(GO:0019237) |
| 0.4 | 5.6 | GO:0031432 | titin binding(GO:0031432) |
| 0.4 | 3.6 | GO:0032036 | myosin heavy chain binding(GO:0032036) |
| 0.4 | 1.6 | GO:0004449 | isocitrate dehydrogenase (NAD+) activity(GO:0004449) |
| 0.4 | 5.4 | GO:0004726 | non-membrane spanning protein tyrosine phosphatase activity(GO:0004726) |
| 0.4 | 4.2 | GO:0034452 | dynactin binding(GO:0034452) |
| 0.4 | 5.9 | GO:0008179 | adenylate cyclase binding(GO:0008179) |
| 0.4 | 6.3 | GO:0017049 | GTP-Rho binding(GO:0017049) |
| 0.3 | 9.2 | GO:0005523 | tropomyosin binding(GO:0005523) |
| 0.3 | 1.4 | GO:0016979 | lipoate-protein ligase activity(GO:0016979) |
| 0.3 | 10.4 | GO:0005212 | structural constituent of eye lens(GO:0005212) |
| 0.3 | 8.7 | GO:0008574 | ATP-dependent microtubule motor activity, plus-end-directed(GO:0008574) |
| 0.3 | 1.0 | GO:0047275 | glucosaminylgalactosylglucosylceramide beta-galactosyltransferase activity(GO:0047275) |
| 0.3 | 1.9 | GO:0008597 | calcium-dependent protein serine/threonine phosphatase regulator activity(GO:0008597) |
| 0.3 | 13.6 | GO:0030507 | spectrin binding(GO:0030507) |
| 0.3 | 0.9 | GO:0047493 | sphingomyelin synthase activity(GO:0033188) ceramide cholinephosphotransferase activity(GO:0047493) |
| 0.3 | 1.6 | GO:0030151 | molybdenum ion binding(GO:0030151) |
| 0.3 | 7.9 | GO:0016628 | oxidoreductase activity, acting on the CH-CH group of donors, NAD or NADP as acceptor(GO:0016628) |
| 0.3 | 2.3 | GO:0086056 | voltage-gated calcium channel activity involved in AV node cell action potential(GO:0086056) |
| 0.3 | 5.2 | GO:0004861 | cyclin-dependent protein serine/threonine kinase inhibitor activity(GO:0004861) |
| 0.3 | 1.6 | GO:0008440 | inositol-1,4,5-trisphosphate 3-kinase activity(GO:0008440) |
| 0.3 | 0.5 | GO:0043532 | angiostatin binding(GO:0043532) |
| 0.3 | 12.9 | GO:0008536 | Ran GTPase binding(GO:0008536) |
| 0.3 | 7.7 | GO:0015002 | cytochrome-c oxidase activity(GO:0004129) heme-copper terminal oxidase activity(GO:0015002) oxidoreductase activity, acting on a heme group of donors, oxygen as acceptor(GO:0016676) |
| 0.3 | 5.8 | GO:0008327 | methyl-CpG binding(GO:0008327) |
| 0.3 | 8.9 | GO:0015248 | sterol transporter activity(GO:0015248) |
| 0.3 | 1.0 | GO:0090554 | phosphatidylcholine-translocating ATPase activity(GO:0090554) |
| 0.3 | 3.6 | GO:0030280 | structural constituent of epidermis(GO:0030280) |
| 0.3 | 6.9 | GO:0046933 | proton-transporting ATP synthase activity, rotational mechanism(GO:0046933) |
| 0.3 | 4.5 | GO:0001054 | RNA polymerase I activity(GO:0001054) |
| 0.2 | 13.0 | GO:0008137 | NADH dehydrogenase (ubiquinone) activity(GO:0008137) NADH dehydrogenase (quinone) activity(GO:0050136) |
| 0.2 | 1.0 | GO:0004963 | follicle-stimulating hormone receptor activity(GO:0004963) |
| 0.2 | 3.1 | GO:0022851 | GABA-gated chloride ion channel activity(GO:0022851) |
| 0.2 | 2.9 | GO:0051378 | amine binding(GO:0043176) serotonin binding(GO:0051378) |
| 0.2 | 4.1 | GO:0032454 | histone demethylase activity (H3-K9 specific)(GO:0032454) |
| 0.2 | 8.5 | GO:0043027 | cysteine-type endopeptidase inhibitor activity involved in apoptotic process(GO:0043027) |
| 0.2 | 3.3 | GO:0043495 | protein anchor(GO:0043495) |
| 0.2 | 15.4 | GO:0048306 | calcium-dependent protein binding(GO:0048306) |
| 0.2 | 6.2 | GO:0005540 | hyaluronic acid binding(GO:0005540) |
| 0.2 | 3.9 | GO:0005521 | lamin binding(GO:0005521) |
| 0.2 | 5.2 | GO:0031369 | translation initiation factor binding(GO:0031369) |
| 0.2 | 12.6 | GO:0035064 | methylated histone binding(GO:0035064) |
| 0.2 | 6.5 | GO:0001848 | complement binding(GO:0001848) |
| 0.2 | 6.6 | GO:0001972 | retinoic acid binding(GO:0001972) |
| 0.2 | 0.4 | GO:0016888 | endodeoxyribonuclease activity, producing 5'-phosphomonoesters(GO:0016888) |
| 0.2 | 8.3 | GO:0035255 | ionotropic glutamate receptor binding(GO:0035255) |
| 0.2 | 3.5 | GO:0016881 | acid-amino acid ligase activity(GO:0016881) |
| 0.2 | 5.2 | GO:0097200 | cysteine-type endopeptidase activity involved in execution phase of apoptosis(GO:0097200) |
| 0.2 | 6.5 | GO:0003743 | translation initiation factor activity(GO:0003743) |
| 0.2 | 74.2 | GO:0045296 | cadherin binding(GO:0045296) |
| 0.2 | 1.3 | GO:0001224 | RNA polymerase II transcription cofactor binding(GO:0001224) |
| 0.2 | 0.6 | GO:0004706 | JUN kinase kinase kinase activity(GO:0004706) |
| 0.2 | 13.6 | GO:0004722 | protein serine/threonine phosphatase activity(GO:0004722) |
| 0.2 | 1.1 | GO:0015277 | kainate selective glutamate receptor activity(GO:0015277) |
| 0.2 | 1.4 | GO:0048273 | mitogen-activated protein kinase p38 binding(GO:0048273) |
| 0.1 | 0.7 | GO:0004647 | phosphoserine phosphatase activity(GO:0004647) |
| 0.1 | 5.9 | GO:0031593 | polyubiquitin binding(GO:0031593) |
| 0.1 | 12.6 | GO:0005201 | extracellular matrix structural constituent(GO:0005201) |
| 0.1 | 1.9 | GO:0019707 | protein-cysteine S-palmitoyltransferase activity(GO:0019706) protein-cysteine S-acyltransferase activity(GO:0019707) |
| 0.1 | 4.8 | GO:0070412 | R-SMAD binding(GO:0070412) |
| 0.1 | 18.6 | GO:0004386 | helicase activity(GO:0004386) |
| 0.1 | 4.1 | GO:0005184 | neuropeptide hormone activity(GO:0005184) |
| 0.1 | 2.1 | GO:0034236 | cAMP-dependent protein kinase inhibitor activity(GO:0004862) protein kinase A catalytic subunit binding(GO:0034236) |
| 0.1 | 1.5 | GO:0005158 | insulin receptor binding(GO:0005158) |
| 0.1 | 0.6 | GO:0015252 | hydrogen ion channel activity(GO:0015252) |
| 0.1 | 4.2 | GO:0042974 | retinoic acid receptor binding(GO:0042974) |
| 0.1 | 0.6 | GO:0008948 | malate dehydrogenase (decarboxylating) (NAD+) activity(GO:0004471) malate dehydrogenase (decarboxylating) (NADP+) activity(GO:0004473) oxaloacetate decarboxylase activity(GO:0008948) |
| 0.1 | 3.7 | GO:0047485 | protein N-terminus binding(GO:0047485) |
| 0.1 | 10.2 | GO:0005262 | calcium channel activity(GO:0005262) |
| 0.1 | 7.8 | GO:0016765 | transferase activity, transferring alkyl or aryl (other than methyl) groups(GO:0016765) |
| 0.1 | 1.6 | GO:0046527 | glucosyltransferase activity(GO:0046527) |
| 0.1 | 1.0 | GO:0036122 | BMP binding(GO:0036122) |
| 0.1 | 1.1 | GO:0008093 | cytoskeletal adaptor activity(GO:0008093) |
| 0.1 | 2.9 | GO:0001102 | RNA polymerase II activating transcription factor binding(GO:0001102) |
| 0.1 | 0.5 | GO:0005157 | macrophage colony-stimulating factor receptor binding(GO:0005157) |
| 0.1 | 25.6 | GO:0003924 | GTPase activity(GO:0003924) |
| 0.1 | 1.2 | GO:0002162 | dystroglycan binding(GO:0002162) |
| 0.1 | 2.3 | GO:0004198 | calcium-dependent cysteine-type endopeptidase activity(GO:0004198) |
| 0.1 | 2.7 | GO:0016706 | oxidoreductase activity, acting on paired donors, with incorporation or reduction of molecular oxygen, 2-oxoglutarate as one donor, and incorporation of one atom each of oxygen into both donors(GO:0016706) |
| 0.1 | 0.9 | GO:0030215 | semaphorin receptor binding(GO:0030215) |
| 0.1 | 6.7 | GO:0008565 | protein transporter activity(GO:0008565) |
| 0.1 | 2.9 | GO:0061650 | ubiquitin conjugating enzyme activity(GO:0061631) ubiquitin-like protein conjugating enzyme activity(GO:0061650) |
| 0.1 | 1.4 | GO:0017056 | structural constituent of nuclear pore(GO:0017056) |
| 0.1 | 11.8 | GO:0008017 | microtubule binding(GO:0008017) |
| 0.1 | 0.8 | GO:0043522 | leucine zipper domain binding(GO:0043522) |
| 0.1 | 4.5 | GO:0001085 | RNA polymerase II transcription factor binding(GO:0001085) |
| 0.1 | 0.5 | GO:0042809 | vitamin D receptor binding(GO:0042809) |
| 0.1 | 1.1 | GO:0001671 | ATPase activator activity(GO:0001671) |
| 0.1 | 0.3 | GO:0005127 | ciliary neurotrophic factor receptor binding(GO:0005127) |
| 0.1 | 0.4 | GO:0015038 | glutathione disulfide oxidoreductase activity(GO:0015038) |
| 0.0 | 4.0 | GO:0001618 | virus receptor activity(GO:0001618) |
| 0.0 | 18.8 | GO:0003779 | actin binding(GO:0003779) |
| 0.0 | 0.1 | GO:0004914 | interleukin-5 receptor activity(GO:0004914) |
| 0.0 | 2.6 | GO:0043130 | ubiquitin binding(GO:0043130) |
| 0.0 | 2.3 | GO:0030170 | pyridoxal phosphate binding(GO:0030170) |
| 0.0 | 9.2 | GO:0003729 | mRNA binding(GO:0003729) poly(A) RNA binding(GO:0044822) |
| 0.0 | 3.7 | GO:0005070 | SH3/SH2 adaptor activity(GO:0005070) |
| 0.0 | 1.1 | GO:0005388 | calcium-transporting ATPase activity(GO:0005388) |
| 0.0 | 1.0 | GO:0004709 | MAP kinase kinase kinase activity(GO:0004709) |
| 0.0 | 3.0 | GO:0005089 | Rho guanyl-nucleotide exchange factor activity(GO:0005089) |
| 0.0 | 0.5 | GO:0004185 | serine-type carboxypeptidase activity(GO:0004185) |
| 0.0 | 0.6 | GO:0051400 | BH domain binding(GO:0051400) |
| 0.0 | 0.2 | GO:0090599 | alpha-glucosidase activity(GO:0090599) |
| 0.0 | 0.5 | GO:0042043 | neurexin family protein binding(GO:0042043) |
| 0.0 | 0.8 | GO:0047555 | 3',5'-cyclic-GMP phosphodiesterase activity(GO:0047555) |
| 0.0 | 3.1 | GO:0004867 | serine-type endopeptidase inhibitor activity(GO:0004867) |
| 0.0 | 1.8 | GO:0030165 | PDZ domain binding(GO:0030165) |
| 0.0 | 3.1 | GO:0001078 | transcriptional repressor activity, RNA polymerase II core promoter proximal region sequence-specific binding(GO:0001078) |
| 0.0 | 1.7 | GO:0051082 | unfolded protein binding(GO:0051082) |
| 0.0 | 0.3 | GO:0004065 | arylsulfatase activity(GO:0004065) |
| 0.0 | 0.2 | GO:0080025 | phosphatidylinositol-3,5-bisphosphate binding(GO:0080025) |
| 0.0 | 0.9 | GO:0005179 | hormone activity(GO:0005179) |
| 0.0 | 2.3 | GO:0003735 | structural constituent of ribosome(GO:0003735) |
| 0.0 | 1.0 | GO:0101005 | thiol-dependent ubiquitinyl hydrolase activity(GO:0036459) ubiquitinyl hydrolase activity(GO:0101005) |
| 0.0 | 1.0 | GO:0019903 | protein phosphatase binding(GO:0019903) |
| 0.0 | 0.3 | GO:0005104 | fibroblast growth factor receptor binding(GO:0005104) |
Gene overrepresentation in C2:CP category:
| Log-likelihood per target | Total log-likelihood | Term | Description |
|---|---|---|---|
| 0.9 | 104.7 | PID P75 NTR PATHWAY | p75(NTR)-mediated signaling |
| 0.9 | 59.7 | PID ECADHERIN STABILIZATION PATHWAY | Stabilization and expansion of the E-cadherin adherens junction |
| 0.8 | 18.7 | SA REG CASCADE OF CYCLIN EXPR | Expression of cyclins regulates progression through the cell cycle by activating cyclin-dependent kinases. |
| 0.4 | 11.9 | PID ERBB NETWORK PATHWAY | ErbB receptor signaling network |
| 0.4 | 8.2 | SA CASPASE CASCADE | Apoptosis is mediated by caspases, cysteine proteases arranged in a proteolytic cascade. |
| 0.4 | 20.5 | PID SYNDECAN 4 PATHWAY | Syndecan-4-mediated signaling events |
| 0.3 | 27.9 | PID CD8 TCR DOWNSTREAM PATHWAY | Downstream signaling in naïve CD8+ T cells |
| 0.3 | 8.5 | SA B CELL RECEPTOR COMPLEXES | Antigen binding to B cell receptors activates protein tyrosine kinases, such as the Src family, which ultimate activate MAP kinases. |
| 0.3 | 20.3 | PID AURORA B PATHWAY | Aurora B signaling |
| 0.3 | 12.8 | PID P38 MK2 PATHWAY | p38 signaling mediated by MAPKAP kinases |
| 0.2 | 12.2 | PID ATR PATHWAY | ATR signaling pathway |
| 0.2 | 5.9 | PID FOXM1 PATHWAY | FOXM1 transcription factor network |
| 0.2 | 2.5 | ST TYPE I INTERFERON PATHWAY | Type I Interferon (alpha/beta IFN) Pathway |
| 0.2 | 3.5 | ST G ALPHA S PATHWAY | G alpha s Pathway |
| 0.2 | 6.2 | PID AVB3 OPN PATHWAY | Osteopontin-mediated events |
| 0.2 | 7.6 | ST G ALPHA I PATHWAY | G alpha i Pathway |
| 0.2 | 6.6 | SIG BCR SIGNALING PATHWAY | Members of the BCR signaling pathway |
| 0.2 | 14.6 | PID VEGFR1 2 PATHWAY | Signaling events mediated by VEGFR1 and VEGFR2 |
| 0.2 | 8.2 | PID CERAMIDE PATHWAY | Ceramide signaling pathway |
| 0.2 | 5.5 | PID ECADHERIN NASCENT AJ PATHWAY | E-cadherin signaling in the nascent adherens junction |
| 0.2 | 10.9 | PID TGFBR PATHWAY | TGF-beta receptor signaling |
| 0.1 | 11.2 | PID HNF3A PATHWAY | FOXA1 transcription factor network |
| 0.1 | 5.5 | PID MYC PATHWAY | C-MYC pathway |
| 0.1 | 4.5 | PID CDC42 REG PATHWAY | Regulation of CDC42 activity |
| 0.1 | 11.4 | PID HIF1 TFPATHWAY | HIF-1-alpha transcription factor network |
| 0.1 | 4.2 | PID FGF PATHWAY | FGF signaling pathway |
| 0.1 | 6.8 | PID HEDGEHOG GLI PATHWAY | Hedgehog signaling events mediated by Gli proteins |
| 0.1 | 2.8 | SIG CD40PATHWAYMAP | Genes related to CD40 signaling |
| 0.1 | 1.5 | PID HIV NEF PATHWAY | HIV-1 Nef: Negative effector of Fas and TNF-alpha |
| 0.1 | 1.8 | ST GA13 PATHWAY | G alpha 13 Pathway |
| 0.1 | 1.3 | PID CIRCADIAN PATHWAY | Circadian rhythm pathway |
| 0.1 | 2.1 | PID HIF2PATHWAY | HIF-2-alpha transcription factor network |
| 0.1 | 0.9 | PID KIT PATHWAY | Signaling events mediated by Stem cell factor receptor (c-Kit) |
| 0.1 | 6.5 | PID MYC ACTIV PATHWAY | Validated targets of C-MYC transcriptional activation |
| 0.1 | 3.8 | PID ARF6 TRAFFICKING PATHWAY | Arf6 trafficking events |
| 0.1 | 3.4 | NABA COLLAGENS | Genes encoding collagen proteins |
| 0.1 | 2.0 | ST WNT BETA CATENIN PATHWAY | Wnt/beta-catenin Pathway |
| 0.1 | 1.8 | PID RHOA PATHWAY | RhoA signaling pathway |
| 0.1 | 1.5 | PID RET PATHWAY | Signaling events regulated by Ret tyrosine kinase |
| 0.1 | 1.6 | PID ATM PATHWAY | ATM pathway |
| 0.1 | 2.2 | SIG PIP3 SIGNALING IN CARDIAC MYOCTES | Genes related to PIP3 signaling in cardiac myocytes |
| 0.1 | 0.9 | PID IL2 PI3K PATHWAY | IL2 signaling events mediated by PI3K |
| 0.1 | 2.6 | PID INTEGRIN3 PATHWAY | Beta3 integrin cell surface interactions |
| 0.1 | 3.8 | PID CDC42 PATHWAY | CDC42 signaling events |
| 0.1 | 1.8 | PID FANCONI PATHWAY | Fanconi anemia pathway |
| 0.1 | 3.9 | PID MYC REPRESS PATHWAY | Validated targets of C-MYC transcriptional repression |
| 0.0 | 0.8 | ST WNT CA2 CYCLIC GMP PATHWAY | Wnt/Ca2+/cyclic GMP signaling. |
| 0.0 | 0.1 | PID IL5 PATHWAY | IL5-mediated signaling events |
| 0.0 | 2.6 | PID AR PATHWAY | Coregulation of Androgen receptor activity |
| 0.0 | 1.2 | PID LKB1 PATHWAY | LKB1 signaling events |
| 0.0 | 0.6 | PID BCR 5PATHWAY | BCR signaling pathway |
| 0.0 | 5.4 | NABA ECM GLYCOPROTEINS | Genes encoding structural ECM glycoproteins |
| 0.0 | 0.5 | PID TCPTP PATHWAY | Signaling events mediated by TCPTP |
| 0.0 | 1.3 | PID RHOA REG PATHWAY | Regulation of RhoA activity |
| 0.0 | 0.2 | PID BMP PATHWAY | BMP receptor signaling |
Gene overrepresentation in C2:CP:REACTOME category:
| Log-likelihood per target | Total log-likelihood | Term | Description |
|---|---|---|---|
| 1.1 | 36.5 | REACTOME REGULATION OF IFNA SIGNALING | Genes involved in Regulation of IFNA signaling |
| 0.8 | 18.9 | REACTOME TETRAHYDROBIOPTERIN BH4 SYNTHESIS RECYCLING SALVAGE AND REGULATION | Genes involved in Tetrahydrobiopterin (BH4) synthesis, recycling, salvage and regulation |
| 0.8 | 22.8 | REACTOME CELL EXTRACELLULAR MATRIX INTERACTIONS | Genes involved in Cell-extracellular matrix interactions |
| 0.8 | 17.4 | REACTOME JNK C JUN KINASES PHOSPHORYLATION AND ACTIVATION MEDIATED BY ACTIVATED HUMAN TAK1 | Genes involved in JNK (c-Jun kinases) phosphorylation and activation mediated by activated human TAK1 |
| 0.8 | 10.8 | REACTOME NEF MEDIATED DOWNREGULATION OF MHC CLASS I COMPLEX CELL SURFACE EXPRESSION | Genes involved in Nef mediated downregulation of MHC class I complex cell surface expression |
| 0.8 | 43.3 | REACTOME INTERFERON ALPHA BETA SIGNALING | Genes involved in Interferon alpha/beta signaling |
| 0.7 | 14.8 | REACTOME ENDOSOMAL SORTING COMPLEX REQUIRED FOR TRANSPORT ESCRT | Genes involved in Endosomal Sorting Complex Required For Transport (ESCRT) |
| 0.7 | 11.8 | REACTOME NOREPINEPHRINE NEUROTRANSMITTER RELEASE CYCLE | Genes involved in Norepinephrine Neurotransmitter Release Cycle |
| 0.6 | 18.1 | REACTOME TRAF6 MEDIATED NFKB ACTIVATION | Genes involved in TRAF6 mediated NF-kB activation |
| 0.6 | 15.3 | REACTOME METABOLISM OF POLYAMINES | Genes involved in Metabolism of polyamines |
| 0.6 | 65.7 | REACTOME P75 NTR RECEPTOR MEDIATED SIGNALLING | Genes involved in p75 NTR receptor-mediated signalling |
| 0.5 | 15.0 | REACTOME HORMONE SENSITIVE LIPASE HSL MEDIATED TRIACYLGLYCEROL HYDROLYSIS | Genes involved in Hormone-sensitive lipase (HSL)-mediated triacylglycerol hydrolysis |
| 0.5 | 43.5 | REACTOME DESTABILIZATION OF MRNA BY AUF1 HNRNP D0 | Genes involved in Destabilization of mRNA by AUF1 (hnRNP D0) |
| 0.4 | 27.0 | REACTOME G1 PHASE | Genes involved in G1 Phase |
| 0.4 | 6.6 | REACTOME IONOTROPIC ACTIVITY OF KAINATE RECEPTORS | Genes involved in Ionotropic activity of Kainate Receptors |
| 0.3 | 6.5 | REACTOME HYALURONAN UPTAKE AND DEGRADATION | Genes involved in Hyaluronan uptake and degradation |
| 0.3 | 8.7 | REACTOME KINESINS | Genes involved in Kinesins |
| 0.3 | 24.6 | REACTOME ANTIVIRAL MECHANISM BY IFN STIMULATED GENES | Genes involved in Antiviral mechanism by IFN-stimulated genes |
| 0.3 | 2.3 | REACTOME INHIBITION OF INSULIN SECRETION BY ADRENALINE NORADRENALINE | Genes involved in Inhibition of Insulin Secretion by Adrenaline/Noradrenaline |
| 0.3 | 8.5 | REACTOME ERK MAPK TARGETS | Genes involved in ERK/MAPK targets |
| 0.3 | 15.8 | REACTOME SMOOTH MUSCLE CONTRACTION | Genes involved in Smooth Muscle Contraction |
| 0.3 | 5.6 | REACTOME SHC1 EVENTS IN EGFR SIGNALING | Genes involved in SHC1 events in EGFR signaling |
| 0.3 | 8.9 | REACTOME PYRIMIDINE METABOLISM | Genes involved in Pyrimidine metabolism |
| 0.3 | 7.9 | REACTOME CHOLESTEROL BIOSYNTHESIS | Genes involved in Cholesterol biosynthesis |
| 0.2 | 8.2 | REACTOME CASPASE MEDIATED CLEAVAGE OF CYTOSKELETAL PROTEINS | Genes involved in Caspase-mediated cleavage of cytoskeletal proteins |
| 0.2 | 20.7 | REACTOME RESPIRATORY ELECTRON TRANSPORT | Genes involved in Respiratory electron transport |
| 0.2 | 3.6 | REACTOME UNWINDING OF DNA | Genes involved in Unwinding of DNA |
| 0.2 | 2.9 | REACTOME SEROTONIN RECEPTORS | Genes involved in Serotonin receptors |
| 0.2 | 11.2 | REACTOME BMAL1 CLOCK NPAS2 ACTIVATES CIRCADIAN EXPRESSION | Genes involved in BMAL1:CLOCK/NPAS2 Activates Circadian Expression |
| 0.2 | 8.1 | REACTOME SMAD2 SMAD3 SMAD4 HETEROTRIMER REGULATES TRANSCRIPTION | Genes involved in SMAD2/SMAD3:SMAD4 heterotrimer regulates transcription |
| 0.2 | 12.4 | REACTOME MRNA SPLICING MINOR PATHWAY | Genes involved in mRNA Splicing - Minor Pathway |
| 0.2 | 6.6 | REACTOME ADHERENS JUNCTIONS INTERACTIONS | Genes involved in Adherens junctions interactions |
| 0.2 | 7.3 | REACTOME STEROID HORMONES | Genes involved in Steroid hormones |
| 0.2 | 1.9 | REACTOME P53 INDEPENDENT G1 S DNA DAMAGE CHECKPOINT | Genes involved in p53-Independent G1/S DNA damage checkpoint |
| 0.2 | 4.3 | REACTOME FORMATION OF ATP BY CHEMIOSMOTIC COUPLING | Genes involved in Formation of ATP by chemiosmotic coupling |
| 0.2 | 6.7 | REACTOME EXTENSION OF TELOMERES | Genes involved in Extension of Telomeres |
| 0.2 | 4.2 | REACTOME HS GAG DEGRADATION | Genes involved in HS-GAG degradation |
| 0.2 | 1.2 | REACTOME CELL SURFACE INTERACTIONS AT THE VASCULAR WALL | Genes involved in Cell surface interactions at the vascular wall |
| 0.2 | 2.3 | REACTOME GABA SYNTHESIS RELEASE REUPTAKE AND DEGRADATION | Genes involved in GABA synthesis, release, reuptake and degradation |
| 0.1 | 4.5 | REACTOME SPHINGOLIPID DE NOVO BIOSYNTHESIS | Genes involved in Sphingolipid de novo biosynthesis |
| 0.1 | 1.0 | REACTOME ETHANOL OXIDATION | Genes involved in Ethanol oxidation |
| 0.1 | 7.2 | REACTOME G ALPHA Z SIGNALLING EVENTS | Genes involved in G alpha (z) signalling events |
| 0.1 | 2.4 | REACTOME INSULIN SYNTHESIS AND PROCESSING | Genes involved in Insulin Synthesis and Processing |
| 0.1 | 3.1 | REACTOME GABA A RECEPTOR ACTIVATION | Genes involved in GABA A receptor activation |
| 0.1 | 7.7 | REACTOME ACTIVATION OF CHAPERONE GENES BY XBP1S | Genes involved in Activation of Chaperone Genes by XBP1(S) |
| 0.1 | 1.0 | REACTOME ABACAVIR TRANSPORT AND METABOLISM | Genes involved in Abacavir transport and metabolism |
| 0.1 | 1.4 | REACTOME HORMONE LIGAND BINDING RECEPTORS | Genes involved in Hormone ligand-binding receptors |
| 0.1 | 1.6 | REACTOME INTEGRATION OF PROVIRUS | Genes involved in Integration of provirus |
| 0.1 | 1.6 | REACTOME CITRIC ACID CYCLE TCA CYCLE | Genes involved in Citric acid cycle (TCA cycle) |
| 0.1 | 1.3 | REACTOME DEADENYLATION OF MRNA | Genes involved in Deadenylation of mRNA |
| 0.1 | 1.3 | REACTOME GAP JUNCTION ASSEMBLY | Genes involved in Gap junction assembly |
| 0.1 | 7.1 | REACTOME FACTORS INVOLVED IN MEGAKARYOCYTE DEVELOPMENT AND PLATELET PRODUCTION | Genes involved in Factors involved in megakaryocyte development and platelet production |
| 0.1 | 3.7 | REACTOME NCAM1 INTERACTIONS | Genes involved in NCAM1 interactions |
| 0.1 | 1.6 | REACTOME BIOSYNTHESIS OF THE N GLYCAN PRECURSOR DOLICHOL LIPID LINKED OLIGOSACCHARIDE LLO AND TRANSFER TO A NASCENT PROTEIN | Genes involved in Biosynthesis of the N-glycan precursor (dolichol lipid-linked oligosaccharide, LLO) and transfer to a nascent protein |
| 0.1 | 1.5 | REACTOME EXTRINSIC PATHWAY FOR APOPTOSIS | Genes involved in Extrinsic Pathway for Apoptosis |
| 0.1 | 2.1 | REACTOME CYTOSOLIC TRNA AMINOACYLATION | Genes involved in Cytosolic tRNA aminoacylation |
| 0.1 | 4.5 | REACTOME NUCLEAR RECEPTOR TRANSCRIPTION PATHWAY | Genes involved in Nuclear Receptor transcription pathway |
| 0.1 | 0.9 | REACTOME SEMA3A PLEXIN REPULSION SIGNALING BY INHIBITING INTEGRIN ADHESION | Genes involved in SEMA3A-Plexin repulsion signaling by inhibiting Integrin adhesion |
| 0.0 | 1.1 | REACTOME PRE NOTCH PROCESSING IN GOLGI | Genes involved in Pre-NOTCH Processing in Golgi |
| 0.0 | 1.7 | REACTOME SIGNALING BY ROBO RECEPTOR | Genes involved in Signaling by Robo receptor |
| 0.0 | 1.1 | REACTOME METABOLISM OF PORPHYRINS | Genes involved in Metabolism of porphyrins |
| 0.0 | 2.2 | REACTOME DEPOSITION OF NEW CENPA CONTAINING NUCLEOSOMES AT THE CENTROMERE | Genes involved in Deposition of New CENPA-containing Nucleosomes at the Centromere |
| 0.0 | 1.0 | REACTOME FORMATION OF FIBRIN CLOT CLOTTING CASCADE | Genes involved in Formation of Fibrin Clot (Clotting Cascade) |
| 0.0 | 3.3 | REACTOME MRNA SPLICING | Genes involved in mRNA Splicing |
| 0.0 | 0.6 | REACTOME PD1 SIGNALING | Genes involved in PD-1 signaling |
| 0.0 | 1.0 | REACTOME GLUTATHIONE CONJUGATION | Genes involved in Glutathione conjugation |
| 0.0 | 1.4 | REACTOME TRANSCRIPTIONAL REGULATION OF WHITE ADIPOCYTE DIFFERENTIATION | Genes involved in Transcriptional Regulation of White Adipocyte Differentiation |
| 0.0 | 1.6 | REACTOME METABOLISM OF VITAMINS AND COFACTORS | Genes involved in Metabolism of vitamins and cofactors |
| 0.0 | 0.5 | REACTOME SIGNALING BY BMP | Genes involved in Signaling by BMP |
| 0.0 | 2.1 | REACTOME MHC CLASS II ANTIGEN PRESENTATION | Genes involved in MHC class II antigen presentation |
| 0.0 | 0.3 | REACTOME THE ACTIVATION OF ARYLSULFATASES | Genes involved in The activation of arylsulfatases |
| 0.0 | 3.2 | REACTOME ANTIGEN PROCESSING UBIQUITINATION PROTEASOME DEGRADATION | Genes involved in Antigen processing: Ubiquitination & Proteasome degradation |
| 0.0 | 0.5 | REACTOME RNA POL II TRANSCRIPTION PRE INITIATION AND PROMOTER OPENING | Genes involved in RNA Polymerase II Transcription Pre-Initiation And Promoter Opening |
| 0.0 | 2.8 | REACTOME NONSENSE MEDIATED DECAY ENHANCED BY THE EXON JUNCTION COMPLEX | Genes involved in Nonsense Mediated Decay Enhanced by the Exon Junction Complex |
| 0.0 | 0.3 | REACTOME ACTIVATED POINT MUTANTS OF FGFR2 | Genes involved in Activated point mutants of FGFR2 |
| 0.0 | 0.2 | REACTOME CALNEXIN CALRETICULIN CYCLE | Genes involved in Calnexin/calreticulin cycle |
| 0.0 | 0.4 | REACTOME SYNTHESIS AND INTERCONVERSION OF NUCLEOTIDE DI AND TRIPHOSPHATES | Genes involved in Synthesis and interconversion of nucleotide di- and triphosphates |