Project
GNF SymAtlas + NCI-60 cancer cell lines, comparison of cancers vs non-cancers, human (Su, 2004; Ross, 2000)
Navigation
Downloads
Results for IRF9
Z-value: 0.27
Motif logo

Transcription factors associated with IRF9
| Gene Symbol | Gene ID | Gene Info |
|---|---|---|
|
IRF9
|
ENSG00000213928.4 | interferon regulatory factor 9 |
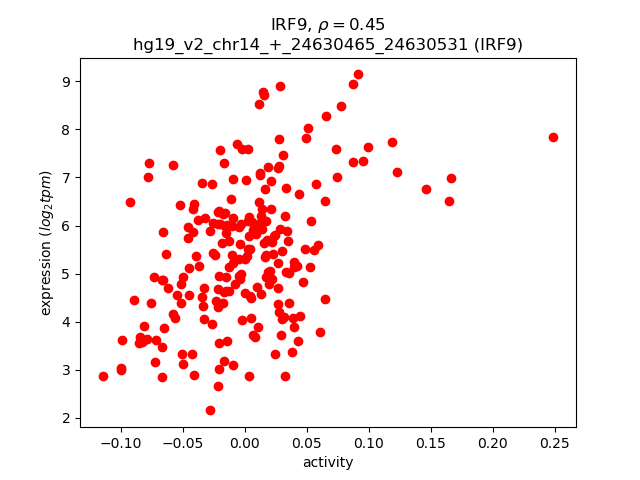
Activity-expression correlation:
| Gene | Promoter | Pearson corr. coef. | P-value | Plot |
|---|---|---|---|---|
| IRF9 | hg19_v2_chr14_+_24630465_24630531 | 0.45 | 5.0e-12 | Click! |
Activity profile of IRF9 motif
Sorted Z-values of IRF9 motif
| Promoter | Log-likelihood | Transcript | Gene | Gene Info |
|---|---|---|---|---|
| chr21_+_42798094 | 24.23 |
ENST00000398598.3
ENST00000455164.2 ENST00000424365.1 |
MX1
|
myxovirus (influenza virus) resistance 1, interferon-inducible protein p78 (mouse) |
| chr21_+_42733870 | 23.83 |
ENST00000330714.3
ENST00000436410.1 ENST00000435611.1 |
MX2
|
myxovirus (influenza virus) resistance 2 (mouse) |
| chr12_+_113344755 | 14.22 |
ENST00000550883.1
|
OAS1
|
2'-5'-oligoadenylate synthetase 1, 40/46kDa |
| chr1_+_79115503 | 10.21 |
ENST00000370747.4
ENST00000438486.1 ENST00000545124.1 |
IFI44
|
interferon-induced protein 44 |
| chr1_+_79086088 | 9.85 |
ENST00000370751.5
ENST00000342282.3 |
IFI44L
|
interferon-induced protein 44-like |
| chr12_+_113344582 | 9.71 |
ENST00000202917.5
ENST00000445409.2 ENST00000452357.2 |
OAS1
|
2'-5'-oligoadenylate synthetase 1, 40/46kDa |
| chr8_-_27941380 | 9.00 |
ENST00000413272.2
ENST00000341513.6 |
NUGGC
|
nuclear GTPase, germinal center associated |
| chr9_-_32526184 | 8.73 |
ENST00000545044.1
ENST00000379868.1 |
DDX58
|
DEAD (Asp-Glu-Ala-Asp) box polypeptide 58 |
| chr11_-_615570 | 8.63 |
ENST00000525445.1
ENST00000348655.6 ENST00000397566.1 |
IRF7
|
interferon regulatory factor 7 |
| chr6_+_6588902 | 8.41 |
ENST00000230568.4
|
LY86
|
lymphocyte antigen 86 |
| chr3_-_121379739 | 8.35 |
ENST00000428394.2
ENST00000314583.3 |
HCLS1
|
hematopoietic cell-specific Lyn substrate 1 |
| chr19_-_17516449 | 7.98 |
ENST00000252593.6
|
BST2
|
bone marrow stromal cell antigen 2 |
| chr11_-_615942 | 7.98 |
ENST00000397562.3
ENST00000330243.5 ENST00000397570.1 ENST00000397574.2 |
IRF7
|
interferon regulatory factor 7 |
| chr1_-_150738261 | 7.86 |
ENST00000448301.2
ENST00000368985.3 |
CTSS
|
cathepsin S |
| chr1_+_158979792 | 7.70 |
ENST00000359709.3
ENST00000430894.2 |
IFI16
|
interferon, gamma-inducible protein 16 |
| chr12_+_113344811 | 7.61 |
ENST00000551241.1
ENST00000553185.1 ENST00000550689.1 |
OAS1
|
2'-5'-oligoadenylate synthetase 1, 40/46kDa |
| chr12_-_121477039 | 7.50 |
ENST00000257570.5
|
OASL
|
2'-5'-oligoadenylate synthetase-like |
| chr14_+_24630465 | 7.42 |
ENST00000557894.1
ENST00000559284.1 ENST00000560275.1 |
IRF9
|
interferon regulatory factor 9 |
| chr1_+_158979680 | 7.19 |
ENST00000368131.4
ENST00000340979.6 |
IFI16
|
interferon, gamma-inducible protein 16 |
| chr17_+_6659153 | 7.17 |
ENST00000441631.1
ENST00000438512.1 ENST00000346752.4 ENST00000361842.3 |
XAF1
|
XIAP associated factor 1 |
| chr13_+_50070491 | 7.04 |
ENST00000496612.1
ENST00000357596.3 ENST00000485919.1 ENST00000442195.1 |
PHF11
|
PHD finger protein 11 |
| chr1_+_158979686 | 6.97 |
ENST00000368132.3
ENST00000295809.7 |
IFI16
|
interferon, gamma-inducible protein 16 |
| chr3_-_122283100 | 6.81 |
ENST00000492382.1
ENST00000462315.1 |
PARP9
|
poly (ADP-ribose) polymerase family, member 9 |
| chr2_-_55920952 | 6.67 |
ENST00000447944.2
|
PNPT1
|
polyribonucleotide nucleotidyltransferase 1 |
| chr13_+_50070077 | 6.55 |
ENST00000378319.3
ENST00000426879.1 |
PHF11
|
PHD finger protein 11 |
| chr12_-_121476959 | 5.90 |
ENST00000339275.5
|
OASL
|
2'-5'-oligoadenylate synthetase-like |
| chr11_-_57335280 | 5.76 |
ENST00000287156.4
|
UBE2L6
|
ubiquitin-conjugating enzyme E2L 6 |
| chr10_+_91092241 | 5.06 |
ENST00000371811.4
|
IFIT3
|
interferon-induced protein with tetratricopeptide repeats 3 |
| chr1_-_161600990 | 5.06 |
ENST00000531221.1
|
FCGR3B
|
Fc fragment of IgG, low affinity IIIb, receptor (CD16b) |
| chr4_-_76944621 | 5.03 |
ENST00000306602.1
|
CXCL10
|
chemokine (C-X-C motif) ligand 10 |
| chr1_-_161600942 | 4.87 |
ENST00000421702.2
|
FCGR3B
|
Fc fragment of IgG, low affinity IIIb, receptor (CD16b) |
| chr6_-_31324943 | 4.55 |
ENST00000412585.2
ENST00000434333.1 |
HLA-B
|
major histocompatibility complex, class I, B |
| chr3_-_146262428 | 4.54 |
ENST00000486631.1
|
PLSCR1
|
phospholipid scramblase 1 |
| chr14_+_94577074 | 4.39 |
ENST00000444961.1
ENST00000448882.1 ENST00000557098.1 ENST00000554800.1 ENST00000556544.1 ENST00000298902.5 ENST00000555819.1 ENST00000557634.1 ENST00000555744.1 |
IFI27
|
interferon, alpha-inducible protein 27 |
| chr6_-_24936170 | 4.28 |
ENST00000538035.1
|
FAM65B
|
family with sequence similarity 65, member B |
| chr1_+_948803 | 4.21 |
ENST00000379389.4
|
ISG15
|
ISG15 ubiquitin-like modifier |
| chr5_-_95297534 | 4.20 |
ENST00000513343.1
ENST00000431061.2 |
ELL2
|
elongation factor, RNA polymerase II, 2 |
| chr1_-_161600822 | 4.11 |
ENST00000534776.1
ENST00000540048.1 |
FCGR3B
FCGR3A
|
Fc fragment of IgG, low affinity IIIb, receptor (CD16b) Fc fragment of IgG, low affinity IIIa, receptor (CD16a) |
| chr2_-_152146385 | 4.11 |
ENST00000414946.1
ENST00000243346.5 |
NMI
|
N-myc (and STAT) interactor |
| chr9_-_32526299 | 3.91 |
ENST00000379882.1
ENST00000379883.2 |
DDX58
|
DEAD (Asp-Glu-Ala-Asp) box polypeptide 58 |
| chrX_+_37639264 | 3.72 |
ENST00000378588.4
|
CYBB
|
cytochrome b-245, beta polypeptide |
| chr5_-_95297678 | 3.66 |
ENST00000237853.4
|
ELL2
|
elongation factor, RNA polymerase II, 2 |
| chr3_-_146262352 | 3.65 |
ENST00000462666.1
|
PLSCR1
|
phospholipid scramblase 1 |
| chr12_+_113376157 | 3.60 |
ENST00000228928.7
|
OAS3
|
2'-5'-oligoadenylate synthetase 3, 100kDa |
| chr2_-_163175133 | 3.36 |
ENST00000421365.2
ENST00000263642.2 |
IFIH1
|
interferon induced with helicase C domain 1 |
| chr4_-_169239921 | 3.31 |
ENST00000514995.1
ENST00000393743.3 |
DDX60
|
DEAD (Asp-Glu-Ala-Asp) box polypeptide 60 |
| chrX_+_37639302 | 3.01 |
ENST00000545017.1
ENST00000536160.1 |
CYBB
|
cytochrome b-245, beta polypeptide |
| chr4_+_89378261 | 2.82 |
ENST00000264350.3
|
HERC5
|
HECT and RLD domain containing E3 ubiquitin protein ligase 5 |
| chr13_-_46961580 | 2.80 |
ENST00000378787.3
ENST00000378797.2 ENST00000429979.1 ENST00000378781.3 |
KIAA0226L
|
KIAA0226-like |
| chr11_+_5646213 | 2.75 |
ENST00000429814.2
|
TRIM34
|
tripartite motif containing 34 |
| chr18_+_42260861 | 2.73 |
ENST00000282030.5
|
SETBP1
|
SET binding protein 1 |
| chr16_-_15736881 | 2.71 |
ENST00000540441.2
|
KIAA0430
|
KIAA0430 |
| chr3_-_146262637 | 2.56 |
ENST00000472349.1
ENST00000342435.4 |
PLSCR1
|
phospholipid scramblase 1 |
| chr3_-_146262365 | 2.54 |
ENST00000448787.2
|
PLSCR1
|
phospholipid scramblase 1 |
| chr3_+_151986709 | 2.53 |
ENST00000495875.2
ENST00000493459.1 ENST00000324210.5 ENST00000459747.1 |
MBNL1
|
muscleblind-like splicing regulator 1 |
| chr11_-_4414880 | 2.32 |
ENST00000254436.7
ENST00000543625.1 |
TRIM21
|
tripartite motif containing 21 |
| chr3_-_146262488 | 2.27 |
ENST00000487389.1
|
PLSCR1
|
phospholipid scramblase 1 |
| chr15_+_91643442 | 2.22 |
ENST00000394232.1
|
SV2B
|
synaptic vesicle glycoprotein 2B |
| chr17_-_40264692 | 2.22 |
ENST00000591220.1
ENST00000251642.3 |
DHX58
|
DEXH (Asp-Glu-X-His) box polypeptide 58 |
| chr19_+_10196981 | 2.21 |
ENST00000591813.1
|
C19orf66
|
chromosome 19 open reading frame 66 |
| chr1_+_162602244 | 2.18 |
ENST00000367922.3
ENST00000367921.3 |
DDR2
|
discoidin domain receptor tyrosine kinase 2 |
| chr6_+_106546808 | 2.07 |
ENST00000369089.3
|
PRDM1
|
PR domain containing 1, with ZNF domain |
| chr10_+_91174314 | 2.03 |
ENST00000371795.4
|
IFIT5
|
interferon-induced protein with tetratricopeptide repeats 5 |
| chr3_-_146262293 | 1.94 |
ENST00000448205.1
|
PLSCR1
|
phospholipid scramblase 1 |
| chr15_+_45003675 | 1.86 |
ENST00000558401.1
ENST00000559916.1 ENST00000544417.1 |
B2M
|
beta-2-microglobulin |
| chr2_+_7017796 | 1.85 |
ENST00000382040.3
|
RSAD2
|
radical S-adenosyl methionine domain containing 2 |
| chr12_-_56753858 | 1.85 |
ENST00000314128.4
ENST00000557235.1 ENST00000418572.2 |
STAT2
|
signal transducer and activator of transcription 2, 113kDa |
| chr1_+_154377669 | 1.79 |
ENST00000368485.3
ENST00000344086.4 |
IL6R
|
interleukin 6 receptor |
| chr16_+_28962128 | 1.45 |
ENST00000564978.1
ENST00000320805.4 |
NFATC2IP
|
nuclear factor of activated T-cells, cytoplasmic, calcineurin-dependent 2 interacting protein |
| chr5_-_142783694 | 1.44 |
ENST00000394466.2
|
NR3C1
|
nuclear receptor subfamily 3, group C, member 1 (glucocorticoid receptor) |
| chr16_+_28875126 | 1.30 |
ENST00000359285.5
ENST00000538342.1 |
SH2B1
|
SH2B adaptor protein 1 |
| chr20_-_56195525 | 1.25 |
ENST00000371173.3
ENST00000395822.3 ENST00000340462.4 ENST00000343535.4 |
ZBP1
|
Z-DNA binding protein 1 |
| chr10_-_91174215 | 1.25 |
ENST00000371837.1
|
LIPA
|
lipase A, lysosomal acid, cholesterol esterase |
| chr22_+_40297105 | 1.24 |
ENST00000540310.1
|
GRAP2
|
GRB2-related adaptor protein 2 |
| chr3_-_142166904 | 1.16 |
ENST00000264951.4
|
XRN1
|
5'-3' exoribonuclease 1 |
| chr12_-_121476750 | 1.12 |
ENST00000543677.1
|
OASL
|
2'-5'-oligoadenylate synthetase-like |
| chr12_+_113376249 | 1.06 |
ENST00000551007.1
ENST00000548514.1 |
OAS3
|
2'-5'-oligoadenylate synthetase 3, 100kDa |
| chr22_+_40297079 | 1.05 |
ENST00000344138.4
ENST00000543252.1 |
GRAP2
|
GRB2-related adaptor protein 2 |
| chr10_+_91061712 | 1.04 |
ENST00000371826.3
|
IFIT2
|
interferon-induced protein with tetratricopeptide repeats 2 |
| chr6_-_82462425 | 0.89 |
ENST00000369754.3
ENST00000320172.6 ENST00000369756.3 |
FAM46A
|
family with sequence similarity 46, member A |
| chr1_+_241695424 | 0.89 |
ENST00000366558.3
ENST00000366559.4 |
KMO
|
kynurenine 3-monooxygenase (kynurenine 3-hydroxylase) |
| chr1_+_241695670 | 0.89 |
ENST00000366557.4
|
KMO
|
kynurenine 3-monooxygenase (kynurenine 3-hydroxylase) |
| chr6_-_32806506 | 0.83 |
ENST00000374897.2
ENST00000452392.2 |
TAP2
TAP2
|
transporter 2, ATP-binding cassette, sub-family B (MDR/TAP) Uncharacterized protein |
| chr20_+_61436146 | 0.81 |
ENST00000290291.6
|
OGFR
|
opioid growth factor receptor |
| chr6_+_72922505 | 0.74 |
ENST00000401910.3
|
RIMS1
|
regulating synaptic membrane exocytosis 1 |
| chr6_+_126240442 | 0.71 |
ENST00000448104.1
ENST00000438495.1 ENST00000444128.1 |
NCOA7
|
nuclear receptor coactivator 7 |
| chr6_+_72922590 | 0.68 |
ENST00000523963.1
|
RIMS1
|
regulating synaptic membrane exocytosis 1 |
| chr19_+_10222189 | 0.67 |
ENST00000321826.4
|
P2RY11
|
purinergic receptor P2Y, G-protein coupled, 11 |
| chr17_-_4167142 | 0.66 |
ENST00000570535.1
ENST00000574367.1 ENST00000341657.4 ENST00000433651.1 |
ANKFY1
|
ankyrin repeat and FYVE domain containing 1 |
| chr17_-_54991369 | 0.61 |
ENST00000537230.1
|
TRIM25
|
tripartite motif containing 25 |
| chr17_+_38296576 | 0.58 |
ENST00000264645.7
|
CASC3
|
cancer susceptibility candidate 3 |
| chr14_+_100531615 | 0.54 |
ENST00000392920.3
|
EVL
|
Enah/Vasp-like |
| chr2_-_152118352 | 0.44 |
ENST00000331426.5
|
RBM43
|
RNA binding motif protein 43 |
| chr19_+_17516494 | 0.39 |
ENST00000534306.1
|
CTD-2521M24.9
|
CTD-2521M24.9 |
| chrX_-_48858667 | 0.34 |
ENST00000376423.4
ENST00000376441.1 |
GRIPAP1
|
GRIP1 associated protein 1 |
| chr7_+_134832808 | 0.33 |
ENST00000275767.3
|
TMEM140
|
transmembrane protein 140 |
| chr9_+_102668915 | 0.31 |
ENST00000259400.6
ENST00000531035.1 ENST00000525640.1 ENST00000534052.1 ENST00000526607.1 |
STX17
|
syntaxin 17 |
| chr9_+_70971815 | 0.28 |
ENST00000396392.1
ENST00000396396.1 |
PGM5
|
phosphoglucomutase 5 |
| chr18_-_67624160 | 0.28 |
ENST00000581982.1
ENST00000280200.4 |
CD226
|
CD226 molecule |
| chr15_-_26108355 | 0.27 |
ENST00000356865.6
|
ATP10A
|
ATPase, class V, type 10A |
| chr11_-_67141090 | 0.20 |
ENST00000312438.7
|
CLCF1
|
cardiotrophin-like cytokine factor 1 |
| chr5_-_142783175 | 0.20 |
ENST00000231509.3
ENST00000394464.2 |
NR3C1
|
nuclear receptor subfamily 3, group C, member 1 (glucocorticoid receptor) |
| chr1_-_207119738 | 0.11 |
ENST00000356495.4
|
PIGR
|
polymeric immunoglobulin receptor |
| chr3_-_28390581 | 0.07 |
ENST00000479665.1
|
AZI2
|
5-azacytidine induced 2 |
| chr17_+_41363854 | 0.07 |
ENST00000588693.1
ENST00000588659.1 ENST00000541594.1 ENST00000536052.1 ENST00000331615.3 |
TMEM106A
|
transmembrane protein 106A |
| chr9_-_33264676 | 0.07 |
ENST00000472232.3
ENST00000379704.2 |
BAG1
|
BCL2-associated athanogene |
| chrX_+_22056165 | 0.05 |
ENST00000535894.1
|
PHEX
|
phosphate regulating endopeptidase homolog, X-linked |
| chr9_-_33264557 | 0.04 |
ENST00000473781.1
ENST00000488499.1 |
BAG1
|
BCL2-associated athanogene |
| chr5_-_59481406 | 0.03 |
ENST00000546160.1
|
PDE4D
|
phosphodiesterase 4D, cAMP-specific |
| chr19_+_17516531 | 0.02 |
ENST00000528911.1
ENST00000528604.1 ENST00000595892.1 ENST00000500836.2 ENST00000598546.1 ENST00000600369.1 ENST00000598356.1 ENST00000594426.1 |
MVB12A
CTD-2521M24.9
|
multivesicular body subunit 12A CTD-2521M24.9 |
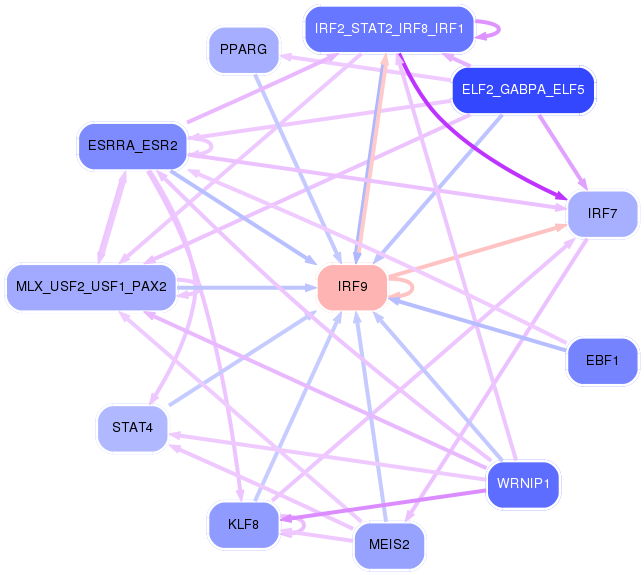
Network of associatons between targets according to the STRING database.

First level regulatory network of IRF9
Gene Ontology Analysis
Gene overrepresentation in biological_process category:
| Log-likelihood per target | Total log-likelihood | Term | Description |
|---|---|---|---|
| 4.4 | 48.1 | GO:0003374 | dynamin polymerization involved in membrane fission(GO:0003373) dynamin polymerization involved in mitochondrial fission(GO:0003374) |
| 3.5 | 13.9 | GO:0034344 | type III interferon production(GO:0034343) regulation of type III interferon production(GO:0034344) |
| 3.3 | 16.6 | GO:2000110 | regulation of MyD88-dependent toll-like receptor signaling pathway(GO:0034124) negative regulation of macrophage apoptotic process(GO:2000110) |
| 2.7 | 8.0 | GO:1901253 | negative regulation of dendritic cell cytokine production(GO:0002731) negative regulation of intracellular transport of viral material(GO:1901253) |
| 2.2 | 6.7 | GO:0000965 | mitochondrial RNA 3'-end processing(GO:0000965) rRNA import into mitochondrion(GO:0035928) |
| 2.2 | 17.5 | GO:0006659 | phosphatidylserine biosynthetic process(GO:0006659) |
| 1.6 | 12.8 | GO:0032020 | ISG15-protein conjugation(GO:0032020) |
| 1.4 | 5.5 | GO:1900245 | positive regulation of MDA-5 signaling pathway(GO:1900245) |
| 1.4 | 4.1 | GO:0032687 | negative regulation of interferon-alpha production(GO:0032687) |
| 1.3 | 6.7 | GO:1904845 | response to L-glutamine(GO:1904844) cellular response to L-glutamine(GO:1904845) |
| 1.1 | 6.8 | GO:0070212 | protein poly-ADP-ribosylation(GO:0070212) |
| 1.0 | 5.0 | GO:1901509 | regulation of endothelial tube morphogenesis(GO:1901509) |
| 1.0 | 72.8 | GO:0045071 | negative regulation of viral genome replication(GO:0045071) |
| 0.9 | 8.4 | GO:0031666 | positive regulation of lipopolysaccharide-mediated signaling pathway(GO:0031666) |
| 0.6 | 6.4 | GO:0002480 | antigen processing and presentation of exogenous peptide antigen via MHC class I, TAP-independent(GO:0002480) |
| 0.6 | 1.8 | GO:0002384 | hepatic immune response(GO:0002384) |
| 0.6 | 2.3 | GO:0090086 | negative regulation of protein deubiquitination(GO:0090086) |
| 0.5 | 8.4 | GO:0045651 | positive regulation of macrophage differentiation(GO:0045651) |
| 0.5 | 6.1 | GO:0035457 | cellular response to interferon-alpha(GO:0035457) |
| 0.4 | 2.1 | GO:0033078 | extrathymic T cell differentiation(GO:0033078) |
| 0.4 | 1.2 | GO:0071409 | cellular response to cycloheximide(GO:0071409) |
| 0.4 | 1.8 | GO:0019805 | quinolinate biosynthetic process(GO:0019805) |
| 0.3 | 7.2 | GO:0035456 | response to interferon-beta(GO:0035456) |
| 0.3 | 7.6 | GO:0097067 | cellular response to thyroid hormone stimulus(GO:0097067) |
| 0.2 | 1.6 | GO:0043402 | glucocorticoid mediated signaling pathway(GO:0043402) |
| 0.2 | 11.9 | GO:0060337 | type I interferon signaling pathway(GO:0060337) cellular response to type I interferon(GO:0071357) |
| 0.2 | 14.0 | GO:0006501 | C-terminal protein lipidation(GO:0006501) |
| 0.2 | 2.2 | GO:0090091 | positive regulation of extracellular matrix disassembly(GO:0090091) |
| 0.2 | 0.7 | GO:0048549 | positive regulation of pinocytosis(GO:0048549) |
| 0.1 | 0.3 | GO:0002428 | antigen processing and presentation of peptide antigen via MHC class Ib(GO:0002428) antigen processing and presentation of endogenous peptide antigen via MHC class Ib(GO:0002476) |
| 0.1 | 0.3 | GO:0060369 | natural killer cell cytokine production(GO:0002370) regulation of natural killer cell cytokine production(GO:0002727) positive regulation of Fc receptor mediated stimulatory signaling pathway(GO:0060369) |
| 0.1 | 7.9 | GO:0009301 | snRNA transcription(GO:0009301) snRNA transcription from RNA polymerase II promoter(GO:0042795) |
| 0.1 | 1.4 | GO:0098828 | positive regulation of inhibitory postsynaptic potential(GO:0097151) modulation of inhibitory postsynaptic potential(GO:0098828) |
| 0.1 | 0.1 | GO:0032607 | interferon-alpha production(GO:0032607) |
| 0.1 | 0.3 | GO:1905244 | regulation of modification of synaptic structure(GO:1905244) |
| 0.1 | 0.3 | GO:0016240 | autophagosome docking(GO:0016240) |
| 0.1 | 0.8 | GO:0038003 | opioid receptor signaling pathway(GO:0038003) |
| 0.1 | 2.8 | GO:0070206 | protein trimerization(GO:0070206) |
| 0.1 | 0.7 | GO:0023041 | neuronal signal transduction(GO:0023041) |
| 0.1 | 0.2 | GO:0048295 | positive regulation of isotype switching to IgE isotypes(GO:0048295) |
| 0.0 | 0.6 | GO:0008298 | intracellular mRNA localization(GO:0008298) |
| 0.0 | 0.5 | GO:1900028 | negative regulation of ruffle assembly(GO:1900028) |
| 0.0 | 0.7 | GO:1902083 | negative regulation of peptidyl-cysteine S-nitrosylation(GO:1902083) |
| 0.0 | 1.3 | GO:0048873 | homeostasis of number of cells within a tissue(GO:0048873) |
| 0.0 | 13.1 | GO:0009615 | response to virus(GO:0009615) |
| 0.0 | 1.3 | GO:0032481 | positive regulation of type I interferon production(GO:0032481) |
| 0.0 | 2.3 | GO:0038083 | peptidyl-tyrosine autophosphorylation(GO:0038083) |
| 0.0 | 2.5 | GO:0045445 | myoblast differentiation(GO:0045445) |
| 0.0 | 0.3 | GO:0019388 | galactose catabolic process(GO:0019388) |
| 0.0 | 0.1 | GO:0002415 | immune response in mucosal-associated lymphoid tissue(GO:0002386) immunoglobulin transcytosis in epithelial cells mediated by polymeric immunoglobulin receptor(GO:0002415) |
| 0.0 | 1.3 | GO:0030032 | lamellipodium assembly(GO:0030032) |
| 0.0 | 1.4 | GO:0016925 | protein sumoylation(GO:0016925) |
| 0.0 | 0.1 | GO:1904383 | response to sodium phosphate(GO:1904383) |
Gene overrepresentation in cellular_component category:
| Log-likelihood per target | Total log-likelihood | Term | Description |
|---|---|---|---|
| 1.1 | 7.9 | GO:0036021 | endolysosome lumen(GO:0036021) |
| 0.6 | 6.7 | GO:0042788 | polysomal ribosome(GO:0042788) |
| 0.6 | 6.4 | GO:0042612 | MHC class I protein complex(GO:0042612) |
| 0.4 | 1.8 | GO:0005896 | interleukin-6 receptor complex(GO:0005896) |
| 0.4 | 6.7 | GO:0043020 | NADPH oxidase complex(GO:0043020) |
| 0.2 | 0.2 | GO:0097059 | CNTFR-CLCF1 complex(GO:0097059) |
| 0.2 | 23.6 | GO:0005643 | nuclear pore(GO:0005643) |
| 0.2 | 2.0 | GO:0008385 | IkappaB kinase complex(GO:0008385) |
| 0.1 | 7.9 | GO:0008023 | transcription elongation factor complex(GO:0008023) |
| 0.1 | 22.0 | GO:0031225 | anchored component of membrane(GO:0031225) |
| 0.1 | 0.7 | GO:0044354 | pinosome(GO:0044352) macropinosome(GO:0044354) |
| 0.1 | 34.7 | GO:0031965 | nuclear membrane(GO:0031965) |
| 0.1 | 12.6 | GO:0032587 | ruffle membrane(GO:0032587) |
| 0.1 | 0.3 | GO:0098837 | postsynaptic recycling endosome(GO:0098837) |
| 0.1 | 31.2 | GO:0016607 | nuclear speck(GO:0016607) |
| 0.0 | 2.5 | GO:0010494 | cytoplasmic stress granule(GO:0010494) |
| 0.0 | 16.4 | GO:0045121 | membrane raft(GO:0045121) |
| 0.0 | 0.3 | GO:0097425 | smooth endoplasmic reticulum membrane(GO:0030868) smooth endoplasmic reticulum part(GO:0097425) |
| 0.0 | 3.5 | GO:0000932 | cytoplasmic mRNA processing body(GO:0000932) |
| 0.0 | 2.2 | GO:0001669 | acrosomal vesicle(GO:0001669) |
| 0.0 | 1.4 | GO:0048786 | presynaptic active zone(GO:0048786) |
| 0.0 | 1.9 | GO:0005811 | lipid particle(GO:0005811) |
| 0.0 | 39.5 | GO:0005739 | mitochondrion(GO:0005739) |
| 0.0 | 3.3 | GO:0045111 | intermediate filament cytoskeleton(GO:0045111) |
| 0.0 | 1.3 | GO:0001650 | fibrillar center(GO:0001650) |
| 0.0 | 2.3 | GO:0031234 | extrinsic component of cytoplasmic side of plasma membrane(GO:0031234) |
| 0.0 | 0.3 | GO:0016010 | dystrophin-associated glycoprotein complex(GO:0016010) glycoprotein complex(GO:0090665) |
| 0.0 | 4.1 | GO:0009897 | external side of plasma membrane(GO:0009897) |
| 0.0 | 39.5 | GO:0005654 | nucleoplasm(GO:0005654) |
Gene overrepresentation in molecular_function category:
| Log-likelihood per target | Total log-likelihood | Term | Description |
|---|---|---|---|
| 5.1 | 50.7 | GO:0001730 | 2'-5'-oligoadenylate synthetase activity(GO:0001730) |
| 1.6 | 17.5 | GO:0017128 | phospholipid scramblase activity(GO:0017128) |
| 1.4 | 8.6 | GO:0042296 | ISG15 transferase activity(GO:0042296) |
| 1.3 | 6.7 | GO:0034046 | poly(G) binding(GO:0034046) |
| 1.0 | 5.0 | GO:0048248 | CXCR3 chemokine receptor binding(GO:0048248) |
| 0.8 | 2.5 | GO:0001069 | regulatory region RNA binding(GO:0001069) |
| 0.8 | 14.0 | GO:0019864 | IgG binding(GO:0019864) |
| 0.6 | 1.8 | GO:0004915 | interleukin-6 receptor activity(GO:0004915) interleukin-6 binding(GO:0019981) |
| 0.5 | 5.7 | GO:0031386 | protein tag(GO:0031386) |
| 0.4 | 2.2 | GO:0038062 | protein tyrosine kinase collagen receptor activity(GO:0038062) |
| 0.3 | 6.7 | GO:0016175 | superoxide-generating NADPH oxidase activity(GO:0016175) |
| 0.3 | 1.6 | GO:0038051 | glucocorticoid receptor activity(GO:0004883) glucocorticoid-activated RNA polymerase II transcription factor binding transcription factor activity(GO:0038051) |
| 0.3 | 8.0 | GO:0008191 | metalloendopeptidase inhibitor activity(GO:0008191) |
| 0.3 | 7.9 | GO:0001968 | fibronectin binding(GO:0001968) |
| 0.3 | 1.2 | GO:0051880 | G-quadruplex DNA binding(GO:0051880) |
| 0.3 | 1.3 | GO:0004771 | sterol esterase activity(GO:0004771) |
| 0.2 | 6.8 | GO:0003950 | NAD+ ADP-ribosyltransferase activity(GO:0003950) |
| 0.2 | 23.6 | GO:0003727 | single-stranded RNA binding(GO:0003727) |
| 0.2 | 1.8 | GO:0016174 | NAD(P)H oxidase activity(GO:0016174) |
| 0.2 | 48.1 | GO:0008017 | microtubule binding(GO:0008017) |
| 0.2 | 43.7 | GO:0001047 | core promoter binding(GO:0001047) |
| 0.2 | 0.6 | GO:0003726 | double-stranded RNA adenosine deaminase activity(GO:0003726) |
| 0.2 | 4.4 | GO:0005521 | lamin binding(GO:0005521) |
| 0.1 | 0.3 | GO:0046977 | peptide antigen-transporting ATPase activity(GO:0015433) TAP binding(GO:0046977) TAP1 binding(GO:0046978) |
| 0.1 | 0.7 | GO:0001609 | G-protein coupled adenosine receptor activity(GO:0001609) |
| 0.1 | 2.9 | GO:0042605 | peptide antigen binding(GO:0042605) |
| 0.1 | 2.1 | GO:1990841 | promoter-specific chromatin binding(GO:1990841) |
| 0.1 | 0.8 | GO:0004985 | opioid receptor activity(GO:0004985) |
| 0.1 | 8.4 | GO:0001085 | RNA polymerase II transcription factor binding(GO:0001085) |
| 0.1 | 0.1 | GO:0019763 | immunoglobulin receptor activity(GO:0019763) |
| 0.1 | 0.2 | GO:0005127 | ciliary neurotrophic factor receptor binding(GO:0005127) |
| 0.0 | 0.3 | GO:0004614 | phosphoglucomutase activity(GO:0004614) |
| 0.0 | 0.5 | GO:1904264 | ubiquitin protein ligase activity involved in ERAD pathway(GO:1904264) |
| 0.0 | 18.9 | GO:0005525 | GTP binding(GO:0005525) |
| 0.0 | 1.9 | GO:0051539 | 4 iron, 4 sulfur cluster binding(GO:0051539) |
| 0.0 | 0.5 | GO:0005522 | profilin binding(GO:0005522) |
| 0.0 | 2.1 | GO:0004715 | non-membrane spanning protein tyrosine kinase activity(GO:0004715) |
| 0.0 | 0.7 | GO:0030374 | ligand-dependent nuclear receptor transcription coactivator activity(GO:0030374) |
| 0.0 | 0.3 | GO:0004012 | phospholipid-translocating ATPase activity(GO:0004012) |
Gene overrepresentation in C2:CP category:
| Log-likelihood per target | Total log-likelihood | Term | Description |
|---|---|---|---|
| 0.7 | 9.3 | ST TYPE I INTERFERON PATHWAY | Type I Interferon (alpha/beta IFN) Pathway |
| 0.2 | 5.9 | SA MMP CYTOKINE CONNECTION | Cytokines can induce activation of matrix metalloproteinases, which degrade extracellular matrix. |
| 0.2 | 11.5 | SIG PIP3 SIGNALING IN B LYMPHOCYTES | Genes related to PIP3 signaling in B lymphocytes |
| 0.1 | 18.2 | PID SMAD2 3NUCLEAR PATHWAY | Regulation of nuclear SMAD2/3 signaling |
| 0.1 | 8.4 | PID FCER1 PATHWAY | Fc-epsilon receptor I signaling in mast cells |
| 0.1 | 2.3 | PID TCR JNK PATHWAY | JNK signaling in the CD4+ TCR pathway |
| 0.1 | 6.7 | PID RAC1 PATHWAY | RAC1 signaling pathway |
| 0.1 | 5.0 | PID CXCR3 PATHWAY | CXCR3-mediated signaling events |
| 0.1 | 4.4 | SIG PIP3 SIGNALING IN CARDIAC MYOCTES | Genes related to PIP3 signaling in cardiac myocytes |
| 0.0 | 1.9 | PID CD8 TCR PATHWAY | TCR signaling in naïve CD8+ T cells |
| 0.0 | 7.9 | NABA ECM REGULATORS | Genes encoding enzymes and their regulators involved in the remodeling of the extracellular matrix |
| 0.0 | 1.3 | PID TRKR PATHWAY | Neurotrophic factor-mediated Trk receptor signaling |
Gene overrepresentation in C2:CP:REACTOME category:
| Log-likelihood per target | Total log-likelihood | Term | Description |
|---|---|---|---|
| 2.4 | 9.7 | REACTOME ENDOSOMAL VACUOLAR PATHWAY | Genes involved in Endosomal/Vacuolar pathway |
| 1.7 | 33.1 | REACTOME TRAF3 DEPENDENT IRF ACTIVATION PATHWAY | Genes involved in TRAF3-dependent IRF activation pathway |
| 1.5 | 129.2 | REACTOME INTERFERON ALPHA BETA SIGNALING | Genes involved in Interferon alpha/beta signaling |
| 1.3 | 1.3 | REACTOME RIP MEDIATED NFKB ACTIVATION VIA DAI | Genes involved in RIP-mediated NFkB activation via DAI |
| 0.2 | 8.6 | REACTOME NEGATIVE REGULATORS OF RIG I MDA5 SIGNALING | Genes involved in Negative regulators of RIG-I/MDA5 signaling |
| 0.2 | 1.8 | REACTOME IL 6 SIGNALING | Genes involved in Interleukin-6 signaling |
| 0.2 | 6.7 | REACTOME LATENT INFECTION OF HOMO SAPIENS WITH MYCOBACTERIUM TUBERCULOSIS | Genes involved in Latent infection of Homo sapiens with Mycobacterium tuberculosis |
| 0.1 | 1.4 | REACTOME DOPAMINE NEUROTRANSMITTER RELEASE CYCLE | Genes involved in Dopamine Neurotransmitter Release Cycle |
| 0.1 | 5.0 | REACTOME CHEMOKINE RECEPTORS BIND CHEMOKINES | Genes involved in Chemokine receptors bind chemokines |
| 0.1 | 1.2 | REACTOME MRNA DECAY BY 5 TO 3 EXORIBONUCLEASE | Genes involved in mRNA Decay by 5' to 3' Exoribonuclease |
| 0.1 | 4.4 | REACTOME IMMUNOREGULATORY INTERACTIONS BETWEEN A LYMPHOID AND A NON LYMPHOID CELL | Genes involved in Immunoregulatory interactions between a Lymphoid and a non-Lymphoid cell |
| 0.1 | 1.3 | REACTOME PROLACTIN RECEPTOR SIGNALING | Genes involved in Prolactin receptor signaling |
| 0.1 | 2.8 | REACTOME GENERATION OF SECOND MESSENGER MOLECULES | Genes involved in Generation of second messenger molecules |
| 0.1 | 2.2 | REACTOME RIG I MDA5 MEDIATED INDUCTION OF IFN ALPHA BETA PATHWAYS | Genes involved in RIG-I/MDA5 mediated induction of IFN-alpha/beta pathways |
| 0.0 | 6.4 | REACTOME TOLL RECEPTOR CASCADES | Genes involved in Toll Receptor Cascades |
| 0.0 | 0.7 | REACTOME P2Y RECEPTORS | Genes involved in P2Y receptors |
| 0.0 | 1.6 | REACTOME BMAL1 CLOCK NPAS2 ACTIVATES CIRCADIAN EXPRESSION | Genes involved in BMAL1:CLOCK/NPAS2 Activates Circadian Expression |
| 0.0 | 0.3 | REACTOME ANTIGEN PRESENTATION FOLDING ASSEMBLY AND PEPTIDE LOADING OF CLASS I MHC | Genes involved in Antigen Presentation: Folding, assembly and peptide loading of class I MHC |