Project
GNF SymAtlas + NCI-60 cancer cell lines, comparison of cancers vs non-cancers, human (Su, 2004; Ross, 2000)
Navigation
Downloads
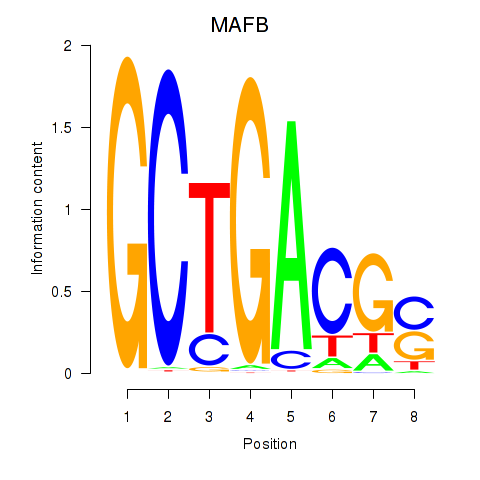
Results for MAFB
Z-value: 0.04
Motif logo
Transcription factors associated with MAFB
| Gene Symbol | Gene ID | Gene Info |
|---|---|---|
|
MAFB
|
ENSG00000204103.2 | MAF bZIP transcription factor B |
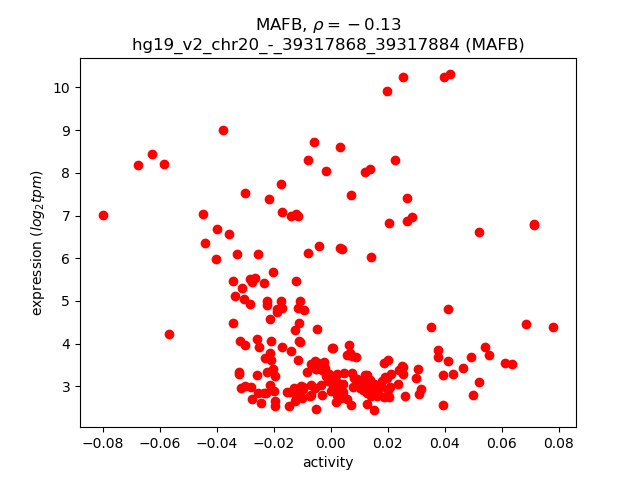
Activity-expression correlation:
| Gene | Promoter | Pearson corr. coef. | P-value | Plot |
|---|---|---|---|---|
| MAFB | hg19_v2_chr20_-_39317868_39317884 | -0.13 | 5.1e-02 | Click! |
Activity profile of MAFB motif
Sorted Z-values of MAFB motif
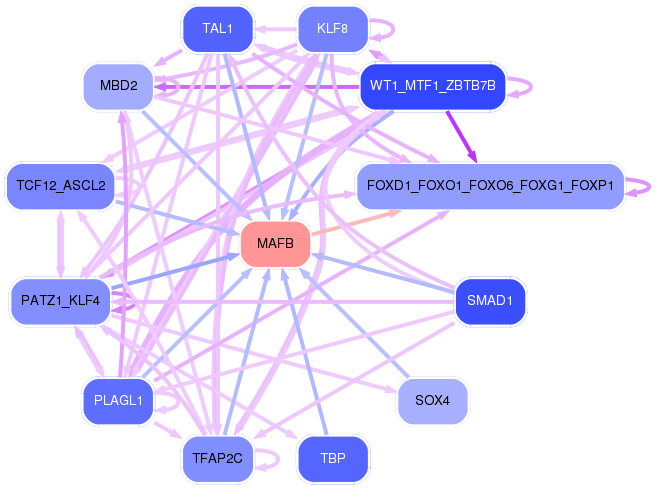
Network of associatons between targets according to the STRING database.

First level regulatory network of MAFB
Gene Ontology Analysis
Gene overrepresentation in biological_process category:
| Log-likelihood per target | Total log-likelihood | Term | Description |
|---|---|---|---|
| 12.1 | 36.3 | GO:1905205 | positive regulation of connective tissue replacement(GO:1905205) |
| 9.7 | 87.1 | GO:0071787 | endoplasmic reticulum tubular network assembly(GO:0071787) |
| 3.7 | 11.0 | GO:1902938 | regulation of intracellular calcium activated chloride channel activity(GO:1902938) |
| 3.5 | 17.4 | GO:1904207 | regulation of chemokine (C-C motif) ligand 2 secretion(GO:1904207) positive regulation of chemokine (C-C motif) ligand 2 secretion(GO:1904209) |
| 3.2 | 29.0 | GO:0030091 | protein repair(GO:0030091) |
| 3.1 | 9.2 | GO:0035408 | histone H3-T6 phosphorylation(GO:0035408) |
| 3.0 | 12.1 | GO:0006542 | glutamine biosynthetic process(GO:0006542) |
| 2.7 | 13.3 | GO:0006543 | glutamine catabolic process(GO:0006543) |
| 2.6 | 15.5 | GO:2001181 | positive regulation of interleukin-10 secretion(GO:2001181) |
| 2.6 | 7.7 | GO:2000374 | regulation of oxygen metabolic process(GO:2000374) |
| 2.5 | 7.5 | GO:1904647 | response to rotenone(GO:1904647) |
| 2.5 | 19.7 | GO:2000766 | negative regulation of cytoplasmic translation(GO:2000766) |
| 2.5 | 7.4 | GO:1905166 | negative regulation of protein catabolic process in the vacuole(GO:1904351) negative regulation of lysosomal protein catabolic process(GO:1905166) |
| 2.3 | 23.2 | GO:0051610 | negative regulation of neurotransmitter uptake(GO:0051581) serotonin uptake(GO:0051610) regulation of serotonin uptake(GO:0051611) negative regulation of serotonin uptake(GO:0051612) |
| 2.2 | 6.6 | GO:0016185 | synaptic vesicle budding from presynaptic endocytic zone membrane(GO:0016185) |
| 2.2 | 8.7 | GO:1903644 | regulation of chaperone-mediated protein folding(GO:1903644) |
| 2.2 | 24.0 | GO:2000582 | positive regulation of microtubule motor activity(GO:2000576) regulation of ATP-dependent microtubule motor activity, plus-end-directed(GO:2000580) positive regulation of ATP-dependent microtubule motor activity, plus-end-directed(GO:2000582) |
| 2.1 | 6.4 | GO:0038060 | nitric oxide-cGMP-mediated signaling pathway(GO:0038060) |
| 2.1 | 6.4 | GO:0048936 | neurofilament bundle assembly(GO:0033693) peripheral nervous system neuron axonogenesis(GO:0048936) |
| 2.1 | 6.2 | GO:0097112 | gamma-aminobutyric acid receptor clustering(GO:0097112) |
| 1.9 | 5.8 | GO:1903697 | negative regulation of microvillus assembly(GO:1903697) |
| 1.9 | 17.1 | GO:0097091 | synaptic vesicle clustering(GO:0097091) |
| 1.8 | 7.1 | GO:0015965 | diadenosine polyphosphate biosynthetic process(GO:0015960) diadenosine tetraphosphate metabolic process(GO:0015965) diadenosine tetraphosphate biosynthetic process(GO:0015966) |
| 1.7 | 5.2 | GO:0051066 | dihydrobiopterin metabolic process(GO:0051066) |
| 1.6 | 11.2 | GO:0040032 | post-embryonic body morphogenesis(GO:0040032) |
| 1.5 | 7.7 | GO:1902904 | negative regulation of fibril organization(GO:1902904) chaperone-mediated autophagy translocation complex disassembly(GO:1904764) |
| 1.5 | 34.2 | GO:0070262 | peptidyl-serine dephosphorylation(GO:0070262) |
| 1.5 | 6.0 | GO:0030644 | cellular chloride ion homeostasis(GO:0030644) |
| 1.4 | 20.1 | GO:0070050 | neuron cellular homeostasis(GO:0070050) |
| 1.4 | 5.7 | GO:0071492 | cellular response to UV-A(GO:0071492) |
| 1.4 | 4.3 | GO:0046098 | hypoxanthine salvage(GO:0043103) guanine metabolic process(GO:0046098) |
| 1.4 | 17.1 | GO:1900028 | negative regulation of ruffle assembly(GO:1900028) |
| 1.4 | 4.2 | GO:0050916 | sensory perception of sweet taste(GO:0050916) |
| 1.4 | 7.0 | GO:0099551 | synaptic signaling via neuropeptide(GO:0099538) trans-synaptic signaling by neuropeptide(GO:0099540) trans-synaptic signaling by neuropeptide, modulating synaptic transmission(GO:0099551) |
| 1.4 | 28.6 | GO:0001829 | trophectodermal cell differentiation(GO:0001829) |
| 1.4 | 5.4 | GO:2001206 | positive regulation of osteoclast development(GO:2001206) |
| 1.3 | 6.7 | GO:0071874 | cellular response to norepinephrine stimulus(GO:0071874) |
| 1.3 | 2.6 | GO:1903181 | detoxification of mercury ion(GO:0050787) regulation of dopamine biosynthetic process(GO:1903179) positive regulation of dopamine biosynthetic process(GO:1903181) |
| 1.3 | 5.3 | GO:2000538 | regulation of cGMP-mediated signaling(GO:0010752) regulation of B cell chemotaxis(GO:2000537) positive regulation of B cell chemotaxis(GO:2000538) |
| 1.3 | 1.3 | GO:1901631 | positive regulation of presynaptic membrane organization(GO:1901631) |
| 1.3 | 3.9 | GO:0032707 | negative regulation of interleukin-23 production(GO:0032707) |
| 1.3 | 3.8 | GO:0006597 | spermine biosynthetic process(GO:0006597) |
| 1.3 | 6.4 | GO:0019255 | glucose 1-phosphate metabolic process(GO:0019255) |
| 1.3 | 8.8 | GO:0032914 | positive regulation of transforming growth factor beta1 production(GO:0032914) |
| 1.3 | 5.0 | GO:1903288 | positive regulation of potassium ion import(GO:1903288) |
| 1.2 | 3.6 | GO:0021966 | corticospinal neuron axon guidance(GO:0021966) |
| 1.2 | 1.2 | GO:0010807 | regulation of synaptic vesicle priming(GO:0010807) |
| 1.2 | 3.6 | GO:0042727 | flavin-containing compound biosynthetic process(GO:0042727) |
| 1.2 | 3.6 | GO:0035948 | positive regulation of gluconeogenesis by positive regulation of transcription from RNA polymerase II promoter(GO:0035948) |
| 1.2 | 5.8 | GO:2001074 | regulation of metanephric ureteric bud development(GO:2001074) positive regulation of metanephric ureteric bud development(GO:2001076) |
| 1.2 | 2.3 | GO:0021823 | cerebral cortex tangential migration using cell-cell interactions(GO:0021823) postnatal olfactory bulb interneuron migration(GO:0021827) chemorepulsion involved in postnatal olfactory bulb interneuron migration(GO:0021836) regulation of negative chemotaxis(GO:0050923) |
| 1.1 | 5.7 | GO:1990034 | calcium ion export from cell(GO:1990034) |
| 1.1 | 2.2 | GO:0007206 | phospholipase C-activating G-protein coupled glutamate receptor signaling pathway(GO:0007206) |
| 1.1 | 5.6 | GO:2000639 | regulation of SREBP signaling pathway(GO:2000638) negative regulation of SREBP signaling pathway(GO:2000639) |
| 1.1 | 10.1 | GO:2001015 | negative regulation of skeletal muscle cell differentiation(GO:2001015) |
| 1.1 | 3.3 | GO:1901624 | negative regulation of lymphocyte chemotaxis(GO:1901624) |
| 1.1 | 7.6 | GO:0006498 | N-terminal protein lipidation(GO:0006498) |
| 1.1 | 3.2 | GO:0031630 | regulation of synaptic vesicle fusion to presynaptic membrane(GO:0031630) |
| 1.1 | 6.4 | GO:0045162 | clustering of voltage-gated sodium channels(GO:0045162) |
| 1.1 | 2.1 | GO:0031133 | regulation of axon diameter(GO:0031133) |
| 1.0 | 4.2 | GO:1903778 | protein localization to vacuolar membrane(GO:1903778) |
| 1.0 | 5.8 | GO:0035965 | cardiolipin acyl-chain remodeling(GO:0035965) |
| 0.9 | 3.8 | GO:1900186 | negative regulation of clathrin-mediated endocytosis(GO:1900186) |
| 0.9 | 4.6 | GO:1990834 | response to odorant(GO:1990834) |
| 0.9 | 5.5 | GO:0045964 | positive regulation of catecholamine metabolic process(GO:0045915) positive regulation of dopamine metabolic process(GO:0045964) |
| 0.9 | 2.7 | GO:0021718 | superior olivary nucleus development(GO:0021718) superior olivary nucleus maturation(GO:0021722) |
| 0.9 | 3.6 | GO:0008628 | hormone-mediated apoptotic signaling pathway(GO:0008628) |
| 0.9 | 4.5 | GO:2000574 | regulation of microtubule motor activity(GO:2000574) |
| 0.9 | 2.7 | GO:0051311 | meiotic metaphase I plate congression(GO:0043060) meiotic spindle midzone assembly(GO:0051257) meiotic metaphase plate congression(GO:0051311) |
| 0.9 | 15.9 | GO:0021681 | cerebellar granular layer development(GO:0021681) |
| 0.9 | 2.6 | GO:0033159 | negative regulation of protein import into nucleus, translocation(GO:0033159) |
| 0.9 | 2.6 | GO:0033140 | negative regulation of peptidyl-serine phosphorylation of STAT protein(GO:0033140) |
| 0.9 | 7.8 | GO:0038007 | netrin-activated signaling pathway(GO:0038007) |
| 0.9 | 5.2 | GO:0031914 | negative regulation of synaptic plasticity(GO:0031914) |
| 0.9 | 0.9 | GO:0002188 | translation reinitiation(GO:0002188) |
| 0.9 | 6.9 | GO:0042985 | negative regulation of amyloid precursor protein biosynthetic process(GO:0042985) |
| 0.8 | 7.6 | GO:0016188 | synaptic vesicle maturation(GO:0016188) |
| 0.8 | 10.1 | GO:2001224 | positive regulation of neuron migration(GO:2001224) |
| 0.8 | 3.3 | GO:0043456 | regulation of pentose-phosphate shunt(GO:0043456) |
| 0.8 | 3.3 | GO:0030242 | pexophagy(GO:0030242) |
| 0.8 | 27.8 | GO:0090383 | phagosome acidification(GO:0090383) |
| 0.8 | 2.4 | GO:0093001 | glycolysis from storage polysaccharide through glucose-1-phosphate(GO:0093001) |
| 0.8 | 10.3 | GO:0021514 | ventral spinal cord interneuron differentiation(GO:0021514) |
| 0.8 | 5.5 | GO:0034316 | negative regulation of Arp2/3 complex-mediated actin nucleation(GO:0034316) |
| 0.8 | 4.7 | GO:0002175 | protein localization to paranode region of axon(GO:0002175) |
| 0.8 | 3.9 | GO:1903587 | regulation of blood vessel endothelial cell proliferation involved in sprouting angiogenesis(GO:1903587) negative regulation of blood vessel endothelial cell proliferation involved in sprouting angiogenesis(GO:1903588) |
| 0.8 | 7.6 | GO:0070973 | protein localization to endoplasmic reticulum exit site(GO:0070973) |
| 0.8 | 3.0 | GO:0035426 | extracellular matrix-cell signaling(GO:0035426) |
| 0.8 | 4.5 | GO:0019367 | fatty acid elongation, saturated fatty acid(GO:0019367) fatty acid elongation, unsaturated fatty acid(GO:0019368) fatty acid elongation, monounsaturated fatty acid(GO:0034625) fatty acid elongation, polyunsaturated fatty acid(GO:0034626) |
| 0.8 | 13.6 | GO:0007021 | tubulin complex assembly(GO:0007021) |
| 0.7 | 3.0 | GO:0035711 | plasmacytoid dendritic cell activation(GO:0002270) T cell mediated immune response to tumor cell(GO:0002424) regulation of T cell mediated immune response to tumor cell(GO:0002840) regulation of restriction endodeoxyribonuclease activity(GO:0032072) T-helper 1 cell activation(GO:0035711) negative regulation of apoptotic cell clearance(GO:2000426) |
| 0.7 | 2.2 | GO:1990502 | dense core granule maturation(GO:1990502) |
| 0.7 | 5.1 | GO:0071442 | positive regulation of histone H3-K14 acetylation(GO:0071442) |
| 0.7 | 0.7 | GO:1900454 | positive regulation of long term synaptic depression(GO:1900454) |
| 0.7 | 5.8 | GO:0090063 | positive regulation of microtubule nucleation(GO:0090063) |
| 0.7 | 2.2 | GO:0051685 | maintenance of ER location(GO:0051685) |
| 0.7 | 2.2 | GO:0050760 | negative regulation of thymidylate synthase biosynthetic process(GO:0050760) |
| 0.7 | 2.1 | GO:0070142 | synaptic vesicle budding(GO:0070142) |
| 0.7 | 6.4 | GO:0002315 | marginal zone B cell differentiation(GO:0002315) |
| 0.7 | 2.1 | GO:0051083 | 'de novo' cotranslational protein folding(GO:0051083) |
| 0.7 | 2.1 | GO:0098935 | dendritic transport(GO:0098935) anterograde dendritic transport(GO:0098937) |
| 0.7 | 2.8 | GO:0000960 | mitochondrial RNA catabolic process(GO:0000957) regulation of mitochondrial RNA catabolic process(GO:0000960) |
| 0.7 | 2.1 | GO:0023016 | signal transduction by trans-phosphorylation(GO:0023016) |
| 0.7 | 2.1 | GO:1904530 | negative regulation of actin filament binding(GO:1904530) negative regulation of actin binding(GO:1904617) |
| 0.7 | 3.4 | GO:0031022 | nuclear migration along microfilament(GO:0031022) |
| 0.7 | 6.7 | GO:0010265 | SCF complex assembly(GO:0010265) |
| 0.7 | 0.7 | GO:0001927 | exocyst assembly(GO:0001927) |
| 0.7 | 5.3 | GO:0090043 | regulation of tubulin deacetylation(GO:0090043) |
| 0.7 | 0.7 | GO:0070093 | negative regulation of glucagon secretion(GO:0070093) |
| 0.7 | 2.0 | GO:0006041 | glucosamine metabolic process(GO:0006041) |
| 0.7 | 1.3 | GO:0043400 | cortisol secretion(GO:0043400) regulation of cortisol secretion(GO:0051462) |
| 0.6 | 1.9 | GO:1901350 | cell-cell signaling involved in cell-cell junction organization(GO:1901350) |
| 0.6 | 2.6 | GO:0048388 | endosomal lumen acidification(GO:0048388) |
| 0.6 | 0.6 | GO:0010726 | positive regulation of hydrogen peroxide metabolic process(GO:0010726) |
| 0.6 | 5.0 | GO:0032482 | Rab protein signal transduction(GO:0032482) |
| 0.6 | 3.7 | GO:0035694 | mitochondrial protein catabolic process(GO:0035694) |
| 0.6 | 5.0 | GO:0097106 | postsynaptic density organization(GO:0097106) postsynaptic density assembly(GO:0097107) gephyrin clustering involved in postsynaptic density assembly(GO:0097116) neuroligin clustering involved in postsynaptic membrane assembly(GO:0097118) |
| 0.6 | 1.9 | GO:0006419 | alanyl-tRNA aminoacylation(GO:0006419) |
| 0.6 | 1.8 | GO:0031627 | telomeric loop formation(GO:0031627) negative regulation of protein localization to chromosome, telomeric region(GO:1904815) |
| 0.6 | 1.8 | GO:0006420 | arginyl-tRNA aminoacylation(GO:0006420) |
| 0.6 | 8.0 | GO:1900038 | negative regulation of cellular response to hypoxia(GO:1900038) |
| 0.6 | 4.2 | GO:1904925 | positive regulation of macromitophagy(GO:1901526) positive regulation of mitophagy in response to mitochondrial depolarization(GO:1904925) |
| 0.6 | 4.8 | GO:0051388 | positive regulation of neurotrophin TRK receptor signaling pathway(GO:0051388) |
| 0.6 | 6.5 | GO:0070863 | positive regulation of protein exit from endoplasmic reticulum(GO:0070863) |
| 0.6 | 1.8 | GO:0043490 | malate-aspartate shuttle(GO:0043490) |
| 0.6 | 10.0 | GO:0043562 | cellular response to nitrogen starvation(GO:0006995) cellular response to nitrogen levels(GO:0043562) |
| 0.6 | 1.2 | GO:0007497 | posterior midgut development(GO:0007497) |
| 0.6 | 1.8 | GO:0006422 | aspartyl-tRNA aminoacylation(GO:0006422) |
| 0.6 | 1.8 | GO:0060559 | positive regulation of vitamin metabolic process(GO:0046136) positive regulation of vitamin D biosynthetic process(GO:0060557) positive regulation of calcidiol 1-monooxygenase activity(GO:0060559) |
| 0.6 | 9.3 | GO:0000338 | protein deneddylation(GO:0000338) |
| 0.6 | 4.6 | GO:0006013 | mannose metabolic process(GO:0006013) |
| 0.6 | 2.3 | GO:1903677 | regulation of cap-independent translational initiation(GO:1903677) positive regulation of cap-independent translational initiation(GO:1903679) regulation of cytoplasmic translational initiation(GO:1904688) positive regulation of cytoplasmic translational initiation(GO:1904690) |
| 0.6 | 1.1 | GO:2000820 | negative regulation of transcription from RNA polymerase II promoter involved in smooth muscle cell differentiation(GO:2000820) |
| 0.6 | 1.1 | GO:1903336 | negative regulation of vacuolar transport(GO:1903336) |
| 0.6 | 4.5 | GO:0032020 | ISG15-protein conjugation(GO:0032020) |
| 0.6 | 1.1 | GO:0021817 | nucleokinesis involved in cell motility in cerebral cortex radial glia guided migration(GO:0021817) nuclear migration along microtubule(GO:0030473) |
| 0.6 | 2.8 | GO:0002032 | desensitization of G-protein coupled receptor protein signaling pathway by arrestin(GO:0002032) |
| 0.5 | 2.2 | GO:0006072 | glycerol-3-phosphate metabolic process(GO:0006072) |
| 0.5 | 5.5 | GO:0051005 | nerve growth factor signaling pathway(GO:0038180) negative regulation of lipoprotein lipase activity(GO:0051005) |
| 0.5 | 8.8 | GO:0007158 | neuron cell-cell adhesion(GO:0007158) |
| 0.5 | 7.1 | GO:0090361 | platelet-derived growth factor production(GO:0090360) regulation of platelet-derived growth factor production(GO:0090361) |
| 0.5 | 2.2 | GO:0072660 | positive regulation of cell communication by electrical coupling(GO:0010650) maintenance of protein location in membrane(GO:0072658) maintenance of protein location in plasma membrane(GO:0072660) positive regulation of membrane depolarization during cardiac muscle cell action potential(GO:1900827) |
| 0.5 | 3.8 | GO:0033029 | regulation of neutrophil apoptotic process(GO:0033029) |
| 0.5 | 2.7 | GO:0061198 | fungiform papilla formation(GO:0061198) |
| 0.5 | 6.4 | GO:0001915 | negative regulation of T cell mediated cytotoxicity(GO:0001915) |
| 0.5 | 1.6 | GO:0016344 | meiotic chromosome movement towards spindle pole(GO:0016344) |
| 0.5 | 4.2 | GO:2000786 | positive regulation of autophagosome assembly(GO:2000786) |
| 0.5 | 4.2 | GO:0051386 | regulation of neurotrophin TRK receptor signaling pathway(GO:0051386) |
| 0.5 | 1.5 | GO:1900369 | adenosine to inosine editing(GO:0006382) regulation of RNA interference(GO:1900368) negative regulation of RNA interference(GO:1900369) |
| 0.5 | 2.6 | GO:0009438 | methylglyoxal metabolic process(GO:0009438) |
| 0.5 | 1.5 | GO:0035927 | RNA import into mitochondrion(GO:0035927) |
| 0.5 | 18.4 | GO:0035235 | ionotropic glutamate receptor signaling pathway(GO:0035235) |
| 0.5 | 1.5 | GO:1903347 | negative regulation of bicellular tight junction assembly(GO:1903347) |
| 0.5 | 2.9 | GO:0097428 | protein maturation by iron-sulfur cluster transfer(GO:0097428) |
| 0.5 | 3.4 | GO:0006933 | negative regulation of cell adhesion involved in substrate-bound cell migration(GO:0006933) |
| 0.5 | 2.4 | GO:0048102 | autophagic cell death(GO:0048102) |
| 0.5 | 2.4 | GO:0019348 | dolichol metabolic process(GO:0019348) |
| 0.5 | 0.5 | GO:0090385 | phagosome-lysosome fusion(GO:0090385) |
| 0.4 | 3.1 | GO:0032097 | positive regulation of response to food(GO:0032097) positive regulation of appetite(GO:0032100) |
| 0.4 | 4.9 | GO:0001731 | formation of translation preinitiation complex(GO:0001731) |
| 0.4 | 2.2 | GO:1904578 | response to thapsigargin(GO:1904578) cellular response to thapsigargin(GO:1904579) |
| 0.4 | 0.9 | GO:0051444 | negative regulation of ubiquitin-protein transferase activity(GO:0051444) |
| 0.4 | 2.2 | GO:0015961 | diadenosine polyphosphate catabolic process(GO:0015961) diphosphoinositol polyphosphate metabolic process(GO:0071543) diadenosine pentaphosphate metabolic process(GO:1901906) diadenosine pentaphosphate catabolic process(GO:1901907) diadenosine hexaphosphate metabolic process(GO:1901908) diadenosine hexaphosphate catabolic process(GO:1901909) adenosine 5'-(hexahydrogen pentaphosphate) metabolic process(GO:1901910) adenosine 5'-(hexahydrogen pentaphosphate) catabolic process(GO:1901911) |
| 0.4 | 2.6 | GO:0048172 | regulation of short-term neuronal synaptic plasticity(GO:0048172) |
| 0.4 | 7.6 | GO:0002021 | response to dietary excess(GO:0002021) |
| 0.4 | 2.5 | GO:0006003 | fructose 2,6-bisphosphate metabolic process(GO:0006003) |
| 0.4 | 1.3 | GO:0036071 | N-glycan fucosylation(GO:0036071) |
| 0.4 | 9.2 | GO:0000715 | nucleotide-excision repair, DNA damage recognition(GO:0000715) |
| 0.4 | 0.4 | GO:0050917 | sensory perception of umami taste(GO:0050917) |
| 0.4 | 1.2 | GO:0002232 | leukocyte chemotaxis involved in inflammatory response(GO:0002232) cell surface pattern recognition receptor signaling pathway(GO:0002752) |
| 0.4 | 2.9 | GO:0021999 | neural plate anterior/posterior regionalization(GO:0021999) |
| 0.4 | 1.6 | GO:0035507 | regulation of myosin-light-chain-phosphatase activity(GO:0035507) |
| 0.4 | 2.0 | GO:0018125 | peptidyl-cysteine methylation(GO:0018125) |
| 0.4 | 2.0 | GO:0019323 | pentose catabolic process(GO:0019323) |
| 0.4 | 2.4 | GO:0090382 | phagosome maturation(GO:0090382) |
| 0.4 | 2.3 | GO:1903599 | positive regulation of mitophagy(GO:1903599) |
| 0.4 | 1.2 | GO:0031117 | positive regulation of microtubule depolymerization(GO:0031117) |
| 0.4 | 1.6 | GO:0060179 | male mating behavior(GO:0060179) |
| 0.4 | 1.9 | GO:0070314 | G1 to G0 transition(GO:0070314) |
| 0.4 | 2.7 | GO:0098814 | spontaneous neurotransmitter secretion(GO:0061669) spontaneous synaptic transmission(GO:0098814) |
| 0.4 | 5.7 | GO:0016024 | CDP-diacylglycerol biosynthetic process(GO:0016024) |
| 0.4 | 1.1 | GO:0009212 | dTTP biosynthetic process(GO:0006235) pyrimidine deoxyribonucleoside triphosphate biosynthetic process(GO:0009212) |
| 0.4 | 3.0 | GO:0090666 | scaRNA localization to Cajal body(GO:0090666) |
| 0.4 | 4.5 | GO:0016081 | synaptic vesicle docking(GO:0016081) |
| 0.4 | 2.2 | GO:0051823 | regulation of synapse structural plasticity(GO:0051823) |
| 0.4 | 3.3 | GO:0090084 | negative regulation of inclusion body assembly(GO:0090084) |
| 0.4 | 0.7 | GO:0070256 | negative regulation of circadian sleep/wake cycle, non-REM sleep(GO:0042323) negative regulation of mucus secretion(GO:0070256) |
| 0.4 | 1.1 | GO:0006478 | peptidyl-tyrosine sulfation(GO:0006478) |
| 0.4 | 1.1 | GO:0032489 | regulation of Cdc42 protein signal transduction(GO:0032489) |
| 0.4 | 2.5 | GO:0033353 | S-adenosylmethionine cycle(GO:0033353) |
| 0.4 | 1.4 | GO:1900245 | positive regulation of MDA-5 signaling pathway(GO:1900245) |
| 0.3 | 2.1 | GO:0061084 | regulation of protein refolding(GO:0061083) negative regulation of protein refolding(GO:0061084) |
| 0.3 | 2.1 | GO:0061343 | cell adhesion involved in heart morphogenesis(GO:0061343) |
| 0.3 | 0.7 | GO:2001187 | positive regulation of CD8-positive, alpha-beta T cell proliferation(GO:2000566) positive regulation of CD8-positive, alpha-beta T cell activation(GO:2001187) |
| 0.3 | 1.4 | GO:0061092 | regulation of phospholipid translocation(GO:0061091) positive regulation of phospholipid translocation(GO:0061092) |
| 0.3 | 3.4 | GO:1901409 | positive regulation of phosphorylation of RNA polymerase II C-terminal domain(GO:1901409) |
| 0.3 | 0.3 | GO:0021592 | fourth ventricle development(GO:0021592) third ventricle development(GO:0021678) |
| 0.3 | 7.3 | GO:0021952 | central nervous system projection neuron axonogenesis(GO:0021952) |
| 0.3 | 2.0 | GO:1903593 | regulation of histamine secretion by mast cell(GO:1903593) |
| 0.3 | 0.3 | GO:0046684 | response to pyrethroid(GO:0046684) |
| 0.3 | 2.6 | GO:0016559 | peroxisome fission(GO:0016559) |
| 0.3 | 2.0 | GO:0008090 | retrograde axonal transport(GO:0008090) |
| 0.3 | 1.3 | GO:0044027 | hypermethylation of CpG island(GO:0044027) |
| 0.3 | 3.8 | GO:0030422 | production of siRNA involved in RNA interference(GO:0030422) |
| 0.3 | 6.6 | GO:0061157 | mRNA destabilization(GO:0061157) |
| 0.3 | 0.6 | GO:0051866 | general adaptation syndrome(GO:0051866) |
| 0.3 | 3.1 | GO:0045198 | establishment of epithelial cell apical/basal polarity(GO:0045198) |
| 0.3 | 1.2 | GO:0051490 | negative regulation of filopodium assembly(GO:0051490) |
| 0.3 | 5.8 | GO:0051764 | actin crosslink formation(GO:0051764) |
| 0.3 | 1.8 | GO:0035709 | memory T cell activation(GO:0035709) regulation of memory T cell activation(GO:2000567) positive regulation of memory T cell activation(GO:2000568) |
| 0.3 | 2.1 | GO:0050915 | sensory perception of sour taste(GO:0050915) |
| 0.3 | 0.3 | GO:0010732 | protein glutathionylation(GO:0010731) regulation of protein glutathionylation(GO:0010732) negative regulation of protein glutathionylation(GO:0010734) |
| 0.3 | 1.5 | GO:0046477 | glycosylceramide catabolic process(GO:0046477) |
| 0.3 | 1.8 | GO:2000323 | negative regulation of glucocorticoid receptor signaling pathway(GO:2000323) |
| 0.3 | 1.8 | GO:0010724 | regulation of definitive erythrocyte differentiation(GO:0010724) |
| 0.3 | 2.3 | GO:0043402 | glucocorticoid mediated signaling pathway(GO:0043402) |
| 0.3 | 2.0 | GO:0044803 | multi-organism membrane organization(GO:0044803) |
| 0.3 | 6.6 | GO:2000114 | regulation of establishment of cell polarity(GO:2000114) |
| 0.3 | 0.6 | GO:0070253 | somatostatin secretion(GO:0070253) |
| 0.3 | 1.1 | GO:0006432 | phenylalanyl-tRNA aminoacylation(GO:0006432) |
| 0.3 | 2.0 | GO:0043144 | snoRNA processing(GO:0043144) |
| 0.3 | 0.9 | GO:0006686 | sphingomyelin biosynthetic process(GO:0006686) |
| 0.3 | 1.1 | GO:0001911 | negative regulation of leukocyte mediated cytotoxicity(GO:0001911) negative regulation of natural killer cell mediated cytotoxicity(GO:0045953) |
| 0.3 | 1.1 | GO:0019249 | lactate biosynthetic process(GO:0019249) |
| 0.3 | 6.1 | GO:0006646 | phosphatidylethanolamine biosynthetic process(GO:0006646) |
| 0.3 | 3.3 | GO:0006122 | mitochondrial electron transport, ubiquinol to cytochrome c(GO:0006122) |
| 0.3 | 0.6 | GO:0033861 | negative regulation of NAD(P)H oxidase activity(GO:0033861) |
| 0.3 | 4.3 | GO:2000480 | negative regulation of cAMP-dependent protein kinase activity(GO:2000480) |
| 0.3 | 1.6 | GO:0046940 | nucleoside monophosphate phosphorylation(GO:0046940) |
| 0.3 | 3.7 | GO:1904776 | regulation of protein localization to cell cortex(GO:1904776) positive regulation of protein localization to cell cortex(GO:1904778) |
| 0.3 | 0.3 | GO:0032898 | neurotrophin production(GO:0032898) |
| 0.3 | 0.8 | GO:0060615 | fibroblast growth factor receptor signaling pathway involved in negative regulation of apoptotic process in bone marrow(GO:0035602) fibroblast growth factor receptor signaling pathway involved in hemopoiesis(GO:0035603) fibroblast growth factor receptor signaling pathway involved in positive regulation of cell proliferation in bone marrow(GO:0035604) mammary gland specification(GO:0060594) fibroblast growth factor receptor signaling pathway involved in mammary gland specification(GO:0060595) mammary gland bud formation(GO:0060615) branch elongation involved in salivary gland morphogenesis(GO:0060667) mesenchymal cell differentiation involved in lung development(GO:0060915) |
| 0.3 | 1.0 | GO:0043162 | ubiquitin-dependent protein catabolic process via the multivesicular body sorting pathway(GO:0043162) |
| 0.3 | 2.3 | GO:0045716 | positive regulation of low-density lipoprotein particle receptor biosynthetic process(GO:0045716) |
| 0.3 | 5.6 | GO:0095500 | acetylcholine receptor signaling pathway(GO:0095500) postsynaptic signal transduction(GO:0098926) signal transduction involved in cellular response to ammonium ion(GO:1903831) response to acetylcholine(GO:1905144) cellular response to acetylcholine(GO:1905145) |
| 0.3 | 9.6 | GO:0000027 | ribosomal large subunit assembly(GO:0000027) |
| 0.3 | 1.5 | GO:0043316 | cytotoxic T cell degranulation(GO:0043316) positive regulation of constitutive secretory pathway(GO:1903435) |
| 0.2 | 3.2 | GO:0051683 | establishment of Golgi localization(GO:0051683) |
| 0.2 | 1.0 | GO:0036228 | protein targeting to nuclear inner membrane(GO:0036228) |
| 0.2 | 1.0 | GO:0010915 | regulation of very-low-density lipoprotein particle clearance(GO:0010915) negative regulation of very-low-density lipoprotein particle clearance(GO:0010916) |
| 0.2 | 1.9 | GO:0007258 | JUN phosphorylation(GO:0007258) |
| 0.2 | 1.2 | GO:1902474 | positive regulation of protein localization to synapse(GO:1902474) |
| 0.2 | 0.7 | GO:0060370 | susceptibility to T cell mediated cytotoxicity(GO:0060370) |
| 0.2 | 4.4 | GO:1901897 | regulation of relaxation of cardiac muscle(GO:1901897) |
| 0.2 | 0.5 | GO:0021815 | modulation of microtubule cytoskeleton involved in cerebral cortex radial glia guided migration(GO:0021815) |
| 0.2 | 2.8 | GO:0036376 | sodium ion export from cell(GO:0036376) |
| 0.2 | 8.5 | GO:0042407 | cristae formation(GO:0042407) |
| 0.2 | 1.6 | GO:0044341 | sodium-dependent phosphate transport(GO:0044341) |
| 0.2 | 0.9 | GO:0038026 | reelin-mediated signaling pathway(GO:0038026) |
| 0.2 | 3.3 | GO:1904754 | positive regulation of vascular associated smooth muscle cell migration(GO:1904754) |
| 0.2 | 0.9 | GO:0050882 | voluntary musculoskeletal movement(GO:0050882) |
| 0.2 | 1.3 | GO:0006540 | glutamate decarboxylation to succinate(GO:0006540) |
| 0.2 | 3.5 | GO:0032802 | low-density lipoprotein particle receptor catabolic process(GO:0032802) |
| 0.2 | 2.6 | GO:0032026 | response to magnesium ion(GO:0032026) |
| 0.2 | 2.8 | GO:0046855 | inositol phosphate dephosphorylation(GO:0046855) |
| 0.2 | 1.5 | GO:0032510 | endosome to lysosome transport via multivesicular body sorting pathway(GO:0032510) |
| 0.2 | 0.6 | GO:1903348 | positive regulation of bicellular tight junction assembly(GO:1903348) |
| 0.2 | 1.9 | GO:0010764 | negative regulation of fibroblast migration(GO:0010764) |
| 0.2 | 2.5 | GO:0006670 | sphingosine metabolic process(GO:0006670) diol metabolic process(GO:0034311) |
| 0.2 | 1.9 | GO:0042355 | fucose catabolic process(GO:0019317) L-fucose metabolic process(GO:0042354) L-fucose catabolic process(GO:0042355) |
| 0.2 | 1.0 | GO:0006398 | mRNA 3'-end processing by stem-loop binding and cleavage(GO:0006398) |
| 0.2 | 3.3 | GO:2000311 | regulation of alpha-amino-3-hydroxy-5-methyl-4-isoxazole propionate selective glutamate receptor activity(GO:2000311) |
| 0.2 | 0.8 | GO:0006556 | S-adenosylmethionine biosynthetic process(GO:0006556) |
| 0.2 | 1.2 | GO:2000270 | negative regulation of fibroblast apoptotic process(GO:2000270) |
| 0.2 | 1.4 | GO:1903818 | positive regulation of voltage-gated potassium channel activity(GO:1903818) |
| 0.2 | 6.3 | GO:0046676 | negative regulation of insulin secretion(GO:0046676) |
| 0.2 | 0.6 | GO:0046900 | tetrahydrofolylpolyglutamate metabolic process(GO:0046900) |
| 0.2 | 1.0 | GO:0006436 | tryptophanyl-tRNA aminoacylation(GO:0006436) |
| 0.2 | 6.0 | GO:0048168 | regulation of neuronal synaptic plasticity(GO:0048168) |
| 0.2 | 0.6 | GO:1990168 | protein K33-linked deubiquitination(GO:1990168) |
| 0.2 | 2.0 | GO:0045329 | carnitine biosynthetic process(GO:0045329) |
| 0.2 | 5.2 | GO:0036257 | multivesicular body organization(GO:0036257) |
| 0.2 | 5.4 | GO:0007194 | negative regulation of adenylate cyclase activity(GO:0007194) |
| 0.2 | 2.7 | GO:0061003 | positive regulation of dendritic spine morphogenesis(GO:0061003) |
| 0.2 | 2.7 | GO:0006703 | estrogen biosynthetic process(GO:0006703) |
| 0.2 | 0.4 | GO:0046337 | phosphatidylethanolamine metabolic process(GO:0046337) |
| 0.2 | 1.0 | GO:0071233 | cellular response to leucine(GO:0071233) |
| 0.2 | 1.1 | GO:0006177 | GMP biosynthetic process(GO:0006177) |
| 0.2 | 0.2 | GO:0019858 | cytosine metabolic process(GO:0019858) |
| 0.2 | 5.1 | GO:0010832 | negative regulation of myotube differentiation(GO:0010832) |
| 0.2 | 0.6 | GO:0098968 | neurotransmitter receptor transport postsynaptic membrane to endosome(GO:0098968) |
| 0.2 | 1.9 | GO:0030951 | establishment or maintenance of microtubule cytoskeleton polarity(GO:0030951) |
| 0.2 | 0.7 | GO:2000074 | regulation of type B pancreatic cell development(GO:2000074) |
| 0.2 | 0.4 | GO:0051036 | regulation of endosome size(GO:0051036) |
| 0.2 | 1.8 | GO:1902455 | negative regulation of stem cell population maintenance(GO:1902455) |
| 0.2 | 2.5 | GO:2000369 | regulation of clathrin-mediated endocytosis(GO:2000369) |
| 0.2 | 2.1 | GO:0006570 | tyrosine metabolic process(GO:0006570) |
| 0.2 | 1.2 | GO:1990564 | protein polyufmylation(GO:1990564) protein K69-linked ufmylation(GO:1990592) |
| 0.2 | 0.5 | GO:1904885 | beta-catenin destruction complex assembly(GO:1904885) |
| 0.2 | 2.1 | GO:0070327 | thyroid hormone transport(GO:0070327) |
| 0.2 | 4.0 | GO:0042417 | dopamine metabolic process(GO:0042417) |
| 0.2 | 3.3 | GO:0016540 | protein autoprocessing(GO:0016540) |
| 0.2 | 2.6 | GO:0002566 | somatic diversification of immune receptors via somatic mutation(GO:0002566) somatic hypermutation of immunoglobulin genes(GO:0016446) |
| 0.2 | 6.1 | GO:0061718 | NADH regeneration(GO:0006735) canonical glycolysis(GO:0061621) glucose catabolic process to pyruvate(GO:0061718) |
| 0.2 | 1.2 | GO:0006379 | mRNA cleavage(GO:0006379) |
| 0.2 | 6.1 | GO:0000188 | inactivation of MAPK activity(GO:0000188) |
| 0.2 | 2.9 | GO:1902857 | positive regulation of nonmotile primary cilium assembly(GO:1902857) |
| 0.2 | 2.9 | GO:0031468 | nuclear envelope reassembly(GO:0031468) |
| 0.2 | 5.0 | GO:0060765 | regulation of androgen receptor signaling pathway(GO:0060765) |
| 0.2 | 2.2 | GO:0043248 | proteasome assembly(GO:0043248) |
| 0.2 | 1.4 | GO:0006491 | N-glycan processing(GO:0006491) |
| 0.2 | 1.7 | GO:0090527 | actin filament reorganization(GO:0090527) |
| 0.2 | 4.7 | GO:0007026 | negative regulation of microtubule depolymerization(GO:0007026) regulation of microtubule depolymerization(GO:0031114) |
| 0.2 | 1.7 | GO:0007028 | cytoplasm organization(GO:0007028) |
| 0.2 | 7.8 | GO:0070534 | protein K63-linked ubiquitination(GO:0070534) |
| 0.2 | 5.1 | GO:0007212 | dopamine receptor signaling pathway(GO:0007212) |
| 0.2 | 0.3 | GO:0046075 | dTTP metabolic process(GO:0046075) |
| 0.2 | 5.0 | GO:0008542 | visual learning(GO:0008542) |
| 0.2 | 0.3 | GO:2000364 | regulation of STAT protein import into nucleus(GO:2000364) positive regulation of STAT protein import into nucleus(GO:2000366) |
| 0.2 | 0.5 | GO:0006620 | posttranslational protein targeting to membrane(GO:0006620) |
| 0.1 | 3.9 | GO:0007032 | endosome organization(GO:0007032) |
| 0.1 | 2.8 | GO:0030866 | cortical actin cytoskeleton organization(GO:0030866) |
| 0.1 | 0.3 | GO:0038028 | insulin receptor signaling pathway via phosphatidylinositol 3-kinase(GO:0038028) |
| 0.1 | 0.6 | GO:0034498 | early endosome to Golgi transport(GO:0034498) |
| 0.1 | 1.3 | GO:0048268 | clathrin coat assembly(GO:0048268) |
| 0.1 | 1.0 | GO:0035331 | negative regulation of hippo signaling(GO:0035331) |
| 0.1 | 3.3 | GO:0072384 | organelle transport along microtubule(GO:0072384) |
| 0.1 | 0.3 | GO:0060447 | bud outgrowth involved in lung branching(GO:0060447) |
| 0.1 | 1.3 | GO:2000465 | regulation of glycogen (starch) synthase activity(GO:2000465) positive regulation of glycogen (starch) synthase activity(GO:2000467) |
| 0.1 | 1.5 | GO:0061051 | positive regulation of cell growth involved in cardiac muscle cell development(GO:0061051) |
| 0.1 | 1.8 | GO:0033235 | positive regulation of protein sumoylation(GO:0033235) |
| 0.1 | 2.9 | GO:0008089 | anterograde axonal transport(GO:0008089) |
| 0.1 | 1.5 | GO:0010739 | positive regulation of protein kinase A signaling(GO:0010739) |
| 0.1 | 0.5 | GO:0033484 | nitric oxide homeostasis(GO:0033484) |
| 0.1 | 3.0 | GO:0046854 | phosphatidylinositol phosphorylation(GO:0046854) |
| 0.1 | 0.9 | GO:0046174 | polyol catabolic process(GO:0046174) |
| 0.1 | 0.5 | GO:0045876 | positive regulation of sister chromatid cohesion(GO:0045876) |
| 0.1 | 3.8 | GO:0035418 | protein localization to synapse(GO:0035418) |
| 0.1 | 1.8 | GO:0045199 | maintenance of apical/basal cell polarity(GO:0035090) maintenance of epithelial cell apical/basal polarity(GO:0045199) |
| 0.1 | 0.8 | GO:0030043 | actin filament fragmentation(GO:0030043) |
| 0.1 | 1.7 | GO:0015732 | prostaglandin transport(GO:0015732) |
| 0.1 | 0.5 | GO:0006391 | transcription initiation from mitochondrial promoter(GO:0006391) |
| 0.1 | 0.3 | GO:0090235 | regulation of metaphase plate congression(GO:0090235) |
| 0.1 | 0.6 | GO:0021853 | cerebral cortex GABAergic interneuron migration(GO:0021853) interneuron migration(GO:1904936) |
| 0.1 | 0.4 | GO:0090234 | regulation of kinetochore assembly(GO:0090234) |
| 0.1 | 2.2 | GO:0042276 | error-prone translesion synthesis(GO:0042276) |
| 0.1 | 0.4 | GO:1901873 | regulation of post-translational protein modification(GO:1901873) |
| 0.1 | 0.7 | GO:0032926 | negative regulation of activin receptor signaling pathway(GO:0032926) |
| 0.1 | 2.5 | GO:0046475 | glycerophospholipid catabolic process(GO:0046475) |
| 0.1 | 0.8 | GO:0003096 | renal sodium ion transport(GO:0003096) renal sodium ion absorption(GO:0070294) |
| 0.1 | 0.2 | GO:0006007 | glucose catabolic process(GO:0006007) |
| 0.1 | 0.8 | GO:0048104 | establishment of body hair or bristle planar orientation(GO:0048104) establishment of body hair planar orientation(GO:0048105) |
| 0.1 | 0.4 | GO:1902031 | regulation of NADP metabolic process(GO:1902031) |
| 0.1 | 0.2 | GO:0061743 | motor learning(GO:0061743) |
| 0.1 | 3.3 | GO:0050885 | neuromuscular process controlling balance(GO:0050885) |
| 0.1 | 2.2 | GO:0032211 | negative regulation of telomere maintenance via telomerase(GO:0032211) |
| 0.1 | 0.3 | GO:0071480 | cellular response to gamma radiation(GO:0071480) |
| 0.1 | 0.3 | GO:1904338 | regulation of dopaminergic neuron differentiation(GO:1904338) |
| 0.1 | 1.2 | GO:0070200 | establishment of protein localization to telomere(GO:0070200) |
| 0.1 | 0.9 | GO:0035457 | cellular response to interferon-alpha(GO:0035457) |
| 0.1 | 0.3 | GO:1900075 | regulation of neuromuscular synaptic transmission(GO:1900073) positive regulation of neuromuscular synaptic transmission(GO:1900075) |
| 0.1 | 2.1 | GO:0006123 | mitochondrial electron transport, cytochrome c to oxygen(GO:0006123) |
| 0.1 | 3.8 | GO:0071377 | cellular response to glucagon stimulus(GO:0071377) |
| 0.1 | 2.8 | GO:0060261 | positive regulation of transcription initiation from RNA polymerase II promoter(GO:0060261) |
| 0.1 | 1.5 | GO:0060292 | long term synaptic depression(GO:0060292) |
| 0.1 | 0.7 | GO:0035405 | histone-threonine phosphorylation(GO:0035405) |
| 0.1 | 0.6 | GO:0072641 | type I interferon secretion(GO:0072641) interferon-alpha secretion(GO:0072642) regulation of interferon-alpha secretion(GO:1902739) positive regulation of interferon-alpha secretion(GO:1902741) |
| 0.1 | 0.6 | GO:1901881 | positive regulation of protein depolymerization(GO:1901881) |
| 0.1 | 1.1 | GO:2001014 | regulation of skeletal muscle cell differentiation(GO:2001014) |
| 0.1 | 0.4 | GO:1904566 | response to 1-oleoyl-sn-glycerol 3-phosphate(GO:1904565) cellular response to 1-oleoyl-sn-glycerol 3-phosphate(GO:1904566) |
| 0.1 | 7.6 | GO:0030705 | cytoskeleton-dependent intracellular transport(GO:0030705) |
| 0.1 | 5.6 | GO:1903779 | regulation of cardiac conduction(GO:1903779) |
| 0.1 | 1.4 | GO:0034975 | protein folding in endoplasmic reticulum(GO:0034975) |
| 0.1 | 1.4 | GO:0006622 | protein targeting to lysosome(GO:0006622) |
| 0.1 | 0.6 | GO:0032468 | Golgi calcium ion homeostasis(GO:0032468) |
| 0.1 | 4.7 | GO:0051865 | protein autoubiquitination(GO:0051865) |
| 0.1 | 0.2 | GO:0006272 | leading strand elongation(GO:0006272) |
| 0.1 | 0.6 | GO:0006196 | AMP catabolic process(GO:0006196) |
| 0.1 | 1.0 | GO:0015939 | pantothenate metabolic process(GO:0015939) |
| 0.1 | 0.4 | GO:0014835 | myoblast differentiation involved in skeletal muscle regeneration(GO:0014835) |
| 0.1 | 0.6 | GO:0035372 | protein localization to microtubule(GO:0035372) |
| 0.1 | 1.5 | GO:0006012 | galactose metabolic process(GO:0006012) |
| 0.1 | 1.0 | GO:2000785 | regulation of autophagosome assembly(GO:2000785) |
| 0.1 | 5.6 | GO:0006120 | mitochondrial electron transport, NADH to ubiquinone(GO:0006120) |
| 0.1 | 0.4 | GO:0036414 | protein citrullination(GO:0018101) histone citrullination(GO:0036414) |
| 0.1 | 1.2 | GO:1902083 | negative regulation of peptidyl-cysteine S-nitrosylation(GO:1902083) |
| 0.1 | 0.7 | GO:0009113 | purine nucleobase biosynthetic process(GO:0009113) |
| 0.1 | 4.6 | GO:0006891 | intra-Golgi vesicle-mediated transport(GO:0006891) |
| 0.1 | 2.1 | GO:0007040 | lysosome organization(GO:0007040) lytic vacuole organization(GO:0080171) |
| 0.1 | 2.6 | GO:0005980 | glycogen catabolic process(GO:0005980) |
| 0.1 | 0.3 | GO:0033634 | positive regulation of cell-cell adhesion mediated by integrin(GO:0033634) |
| 0.1 | 1.5 | GO:0050812 | regulation of acetyl-CoA biosynthetic process from pyruvate(GO:0010510) regulation of acyl-CoA biosynthetic process(GO:0050812) |
| 0.1 | 2.0 | GO:0045948 | positive regulation of translational initiation(GO:0045948) |
| 0.1 | 0.5 | GO:0035280 | miRNA loading onto RISC involved in gene silencing by miRNA(GO:0035280) |
| 0.1 | 0.5 | GO:0051382 | kinetochore assembly(GO:0051382) |
| 0.1 | 8.0 | GO:0048024 | regulation of mRNA splicing, via spliceosome(GO:0048024) |
| 0.1 | 0.3 | GO:0002949 | tRNA threonylcarbamoyladenosine modification(GO:0002949) |
| 0.1 | 0.3 | GO:0090261 | positive regulation of inclusion body assembly(GO:0090261) |
| 0.1 | 0.3 | GO:0002184 | cytoplasmic translational termination(GO:0002184) |
| 0.1 | 0.4 | GO:1903385 | regulation of homophilic cell adhesion(GO:1903385) |
| 0.1 | 0.8 | GO:0018026 | peptidyl-lysine monomethylation(GO:0018026) |
| 0.1 | 0.5 | GO:1904381 | Golgi apparatus mannose trimming(GO:1904381) |
| 0.1 | 0.3 | GO:2000671 | regulation of motor neuron apoptotic process(GO:2000671) negative regulation of motor neuron apoptotic process(GO:2000672) |
| 0.1 | 0.3 | GO:0051494 | negative regulation of cytoskeleton organization(GO:0051494) |
| 0.1 | 0.8 | GO:0006069 | ethanol oxidation(GO:0006069) |
| 0.1 | 0.7 | GO:0015866 | ADP transport(GO:0015866) |
| 0.1 | 1.1 | GO:0038063 | collagen-activated tyrosine kinase receptor signaling pathway(GO:0038063) |
| 0.1 | 0.2 | GO:0002855 | natural killer cell mediated cytotoxicity directed against tumor cell target(GO:0002420) natural killer cell mediated immune response to tumor cell(GO:0002423) regulation of natural killer cell mediated immune response to tumor cell(GO:0002855) positive regulation of natural killer cell mediated immune response to tumor cell(GO:0002857) regulation of natural killer cell mediated cytotoxicity directed against tumor cell target(GO:0002858) positive regulation of natural killer cell mediated cytotoxicity directed against tumor cell target(GO:0002860) |
| 0.1 | 1.9 | GO:0043949 | regulation of cAMP-mediated signaling(GO:0043949) |
| 0.1 | 0.4 | GO:0007468 | regulation of rhodopsin gene expression(GO:0007468) |
| 0.1 | 0.2 | GO:0060406 | positive regulation of penile erection(GO:0060406) |
| 0.1 | 1.2 | GO:0006743 | ubiquinone metabolic process(GO:0006743) ubiquinone biosynthetic process(GO:0006744) quinone biosynthetic process(GO:1901663) |
| 0.1 | 0.3 | GO:0070601 | centromeric sister chromatid cohesion(GO:0070601) |
| 0.1 | 1.3 | GO:2000637 | positive regulation of posttranscriptional gene silencing(GO:0060148) positive regulation of gene silencing by miRNA(GO:2000637) |
| 0.1 | 0.1 | GO:0032759 | TRAIL production(GO:0032639) regulation of TRAIL production(GO:0032679) positive regulation of TRAIL production(GO:0032759) |
| 0.1 | 3.3 | GO:0010923 | negative regulation of phosphatase activity(GO:0010923) |
| 0.1 | 0.1 | GO:0007023 | post-chaperonin tubulin folding pathway(GO:0007023) |
| 0.1 | 1.6 | GO:0048745 | smooth muscle tissue development(GO:0048745) |
| 0.1 | 0.5 | GO:0060632 | regulation of microtubule-based movement(GO:0060632) |
| 0.1 | 0.3 | GO:0046013 | regulation of T cell homeostatic proliferation(GO:0046013) |
| 0.1 | 1.2 | GO:0002089 | lens morphogenesis in camera-type eye(GO:0002089) |
| 0.1 | 5.2 | GO:1903955 | positive regulation of protein targeting to mitochondrion(GO:1903955) |
| 0.1 | 8.4 | GO:0006334 | nucleosome assembly(GO:0006334) |
| 0.1 | 1.7 | GO:0050912 | detection of chemical stimulus involved in sensory perception of taste(GO:0050912) |
| 0.1 | 4.2 | GO:1901379 | regulation of potassium ion transmembrane transport(GO:1901379) |
| 0.1 | 0.6 | GO:0006268 | DNA unwinding involved in DNA replication(GO:0006268) |
| 0.1 | 0.1 | GO:0051541 | elastin metabolic process(GO:0051541) |
| 0.1 | 0.1 | GO:1903056 | regulation of melanosome organization(GO:1903056) |
| 0.1 | 0.9 | GO:0031122 | cytoplasmic microtubule organization(GO:0031122) |
| 0.1 | 1.0 | GO:0006750 | glutathione biosynthetic process(GO:0006750) |
| 0.1 | 3.9 | GO:0031146 | SCF-dependent proteasomal ubiquitin-dependent protein catabolic process(GO:0031146) |
| 0.1 | 0.3 | GO:0090074 | negative regulation of protein homodimerization activity(GO:0090074) |
| 0.1 | 1.6 | GO:0050982 | detection of mechanical stimulus(GO:0050982) |
| 0.1 | 1.3 | GO:1903206 | negative regulation of hydrogen peroxide-induced cell death(GO:1903206) |
| 0.1 | 0.9 | GO:0010765 | positive regulation of sodium ion transport(GO:0010765) |
| 0.1 | 1.2 | GO:0005977 | glycogen metabolic process(GO:0005977) |
| 0.1 | 2.9 | GO:0043631 | RNA polyadenylation(GO:0043631) |
| 0.1 | 0.1 | GO:0014859 | negative regulation of skeletal muscle cell proliferation(GO:0014859) negative regulation of skeletal muscle satellite cell proliferation(GO:1902723) |
| 0.1 | 1.4 | GO:0071364 | cellular response to epidermal growth factor stimulus(GO:0071364) |
| 0.1 | 0.2 | GO:0050884 | neuromuscular process controlling posture(GO:0050884) |
| 0.1 | 1.2 | GO:0042026 | protein refolding(GO:0042026) |
| 0.1 | 1.8 | GO:0032784 | regulation of DNA-templated transcription, elongation(GO:0032784) |
| 0.1 | 0.2 | GO:1905098 | negative regulation of guanyl-nucleotide exchange factor activity(GO:1905098) |
| 0.1 | 0.2 | GO:0042938 | dipeptide transport(GO:0042938) |
| 0.1 | 3.1 | GO:0016266 | O-glycan processing(GO:0016266) |
| 0.1 | 0.9 | GO:0032012 | regulation of ARF protein signal transduction(GO:0032012) |
| 0.1 | 0.2 | GO:0033563 | dorsal/ventral axon guidance(GO:0033563) |
| 0.1 | 0.7 | GO:0097503 | sialylation(GO:0097503) |
| 0.1 | 0.7 | GO:0008543 | fibroblast growth factor receptor signaling pathway(GO:0008543) |
| 0.1 | 2.2 | GO:0006626 | protein targeting to mitochondrion(GO:0006626) |
| 0.1 | 1.3 | GO:0007190 | activation of adenylate cyclase activity(GO:0007190) |
| 0.1 | 0.1 | GO:0031394 | maternal aggressive behavior(GO:0002125) positive regulation of prostaglandin biosynthetic process(GO:0031394) positive regulation of unsaturated fatty acid biosynthetic process(GO:2001280) |
| 0.1 | 0.2 | GO:0031666 | positive regulation of lipopolysaccharide-mediated signaling pathway(GO:0031666) |
| 0.1 | 0.2 | GO:0001694 | histamine biosynthetic process(GO:0001694) |
| 0.1 | 0.5 | GO:0071219 | cellular response to molecule of bacterial origin(GO:0071219) cellular response to lipopolysaccharide(GO:0071222) |
| 0.0 | 1.5 | GO:0000460 | maturation of 5.8S rRNA(GO:0000460) |
| 0.0 | 0.8 | GO:0010971 | positive regulation of G2/M transition of mitotic cell cycle(GO:0010971) |
| 0.0 | 0.3 | GO:0015712 | hexose phosphate transport(GO:0015712) glucose-6-phosphate transport(GO:0015760) |
| 0.0 | 2.8 | GO:0042308 | negative regulation of protein import into nucleus(GO:0042308) negative regulation of protein import(GO:1904590) |
| 0.0 | 0.2 | GO:0046600 | negative regulation of centriole replication(GO:0046600) |
| 0.0 | 1.2 | GO:0007274 | neuromuscular synaptic transmission(GO:0007274) |
| 0.0 | 0.3 | GO:0043486 | histone exchange(GO:0043486) |
| 0.0 | 0.6 | GO:1900027 | regulation of ruffle assembly(GO:1900027) |
| 0.0 | 1.1 | GO:0050690 | regulation of defense response to virus by virus(GO:0050690) |
| 0.0 | 5.9 | GO:0007156 | homophilic cell adhesion via plasma membrane adhesion molecules(GO:0007156) |
| 0.0 | 0.4 | GO:0019509 | L-methionine biosynthetic process from methylthioadenosine(GO:0019509) |
| 0.0 | 0.8 | GO:0034629 | cellular protein complex localization(GO:0034629) |
| 0.0 | 0.1 | GO:0032930 | positive regulation of superoxide anion generation(GO:0032930) |
| 0.0 | 0.7 | GO:0006688 | glycosphingolipid biosynthetic process(GO:0006688) |
| 0.0 | 2.1 | GO:0035773 | insulin secretion involved in cellular response to glucose stimulus(GO:0035773) |
| 0.0 | 0.4 | GO:0048311 | mitochondrion distribution(GO:0048311) |
| 0.0 | 0.1 | GO:0045956 | positive regulation of calcium ion-dependent exocytosis(GO:0045956) |
| 0.0 | 0.4 | GO:0032703 | negative regulation of interleukin-2 production(GO:0032703) |
| 0.0 | 0.4 | GO:0009143 | nucleoside triphosphate catabolic process(GO:0009143) |
| 0.0 | 1.9 | GO:0032006 | regulation of TOR signaling(GO:0032006) |
| 0.0 | 1.0 | GO:1902230 | negative regulation of intrinsic apoptotic signaling pathway in response to DNA damage(GO:1902230) |
| 0.0 | 0.2 | GO:0033211 | adiponectin-activated signaling pathway(GO:0033211) |
| 0.0 | 0.0 | GO:2000157 | negative regulation of protein deubiquitination(GO:0090086) regulation of protein K48-linked deubiquitination(GO:1903093) negative regulation of protein K48-linked deubiquitination(GO:1903094) negative regulation of ubiquitin-specific protease activity(GO:2000157) |
| 0.0 | 0.4 | GO:0032780 | negative regulation of ATPase activity(GO:0032780) |
| 0.0 | 0.5 | GO:0006450 | regulation of translational fidelity(GO:0006450) |
| 0.0 | 0.2 | GO:0048820 | hair follicle maturation(GO:0048820) |
| 0.0 | 0.2 | GO:0033120 | positive regulation of RNA splicing(GO:0033120) |
| 0.0 | 0.1 | GO:0015888 | thiamine transport(GO:0015888) thiamine transmembrane transport(GO:0071934) |
| 0.0 | 0.4 | GO:1904707 | positive regulation of vascular smooth muscle cell proliferation(GO:1904707) |
| 0.0 | 0.4 | GO:0034776 | response to histamine(GO:0034776) |
| 0.0 | 1.1 | GO:0046323 | glucose import(GO:0046323) |
| 0.0 | 0.1 | GO:0060800 | regulation of cell differentiation involved in embryonic placenta development(GO:0060800) |
| 0.0 | 0.2 | GO:0051443 | positive regulation of ubiquitin-protein transferase activity(GO:0051443) |
| 0.0 | 0.6 | GO:0006418 | tRNA aminoacylation for protein translation(GO:0006418) |
| 0.0 | 0.4 | GO:0016254 | preassembly of GPI anchor in ER membrane(GO:0016254) |
| 0.0 | 0.1 | GO:0038169 | somatostatin receptor signaling pathway(GO:0038169) somatostatin signaling pathway(GO:0038170) |
| 0.0 | 0.1 | GO:0016322 | neuron remodeling(GO:0016322) |
| 0.0 | 0.1 | GO:0060356 | tryptophan transport(GO:0015827) leucine import(GO:0060356) |
| 0.0 | 4.7 | GO:0051056 | regulation of small GTPase mediated signal transduction(GO:0051056) |
| 0.0 | 1.2 | GO:0007018 | microtubule-based movement(GO:0007018) |
| 0.0 | 0.1 | GO:0042771 | intrinsic apoptotic signaling pathway in response to DNA damage by p53 class mediator(GO:0042771) |
| 0.0 | 0.1 | GO:0003418 | growth plate cartilage chondrocyte differentiation(GO:0003418) |
| 0.0 | 0.6 | GO:0006369 | termination of RNA polymerase II transcription(GO:0006369) |
| 0.0 | 0.7 | GO:0006165 | nucleoside diphosphate phosphorylation(GO:0006165) |
| 0.0 | 0.0 | GO:2001183 | negative regulation of interleukin-12 secretion(GO:2001183) |
| 0.0 | 0.3 | GO:0006699 | bile acid biosynthetic process(GO:0006699) |
| 0.0 | 0.4 | GO:0006370 | 7-methylguanosine mRNA capping(GO:0006370) |
| 0.0 | 0.0 | GO:0031657 | regulation of cyclin-dependent protein serine/threonine kinase activity involved in G1/S transition of mitotic cell cycle(GO:0031657) positive regulation of cyclin-dependent protein serine/threonine kinase activity involved in G1/S transition of mitotic cell cycle(GO:0031659) |
| 0.0 | 0.1 | GO:0032411 | positive regulation of transporter activity(GO:0032411) |
| 0.0 | 0.1 | GO:0071475 | cellular hyperosmotic salinity response(GO:0071475) |
| 0.0 | 0.8 | GO:0044070 | regulation of anion transport(GO:0044070) |
| 0.0 | 0.0 | GO:1902525 | regulation of protein monoubiquitination(GO:1902525) |
| 0.0 | 0.4 | GO:0006409 | tRNA export from nucleus(GO:0006409) tRNA transport(GO:0051031) tRNA-containing ribonucleoprotein complex export from nucleus(GO:0071431) |
| 0.0 | 0.0 | GO:2000320 | negative regulation of T-helper 17 type immune response(GO:2000317) negative regulation of T-helper 17 cell differentiation(GO:2000320) |
| 0.0 | 1.8 | GO:0006457 | protein folding(GO:0006457) |
| 0.0 | 0.4 | GO:0042273 | ribosomal large subunit biogenesis(GO:0042273) |
| 0.0 | 0.0 | GO:0032690 | negative regulation of interleukin-1 alpha production(GO:0032690) negative regulation of interleukin-1 alpha secretion(GO:0050712) |
| 0.0 | 0.4 | GO:0014003 | oligodendrocyte development(GO:0014003) |
| 0.0 | 0.1 | GO:0042574 | retinal metabolic process(GO:0042574) |
| 0.0 | 0.2 | GO:0061099 | negative regulation of protein tyrosine kinase activity(GO:0061099) |
| 0.0 | 0.1 | GO:0060074 | synapse maturation(GO:0060074) |
Gene overrepresentation in cellular_component category:
| Log-likelihood per target | Total log-likelihood | Term | Description |
|---|---|---|---|
| 5.1 | 25.4 | GO:0098843 | postsynaptic endocytic zone(GO:0098843) |
| 4.7 | 42.2 | GO:0005955 | calcineurin complex(GO:0005955) |
| 3.6 | 72.7 | GO:0071782 | endoplasmic reticulum tubular network(GO:0071782) |
| 2.7 | 19.1 | GO:0033269 | internode region of axon(GO:0033269) |
| 2.5 | 7.4 | GO:0019034 | viral replication complex(GO:0019034) |
| 2.1 | 6.2 | GO:0016935 | glycine-gated chloride channel complex(GO:0016935) |
| 2.0 | 6.1 | GO:0038039 | G-protein coupled receptor heterodimeric complex(GO:0038039) |
| 2.0 | 7.9 | GO:0016533 | cyclin-dependent protein kinase 5 holoenzyme complex(GO:0016533) |
| 1.8 | 7.4 | GO:0031166 | integral component of vacuolar membrane(GO:0031166) |
| 1.7 | 13.9 | GO:0045179 | apical cortex(GO:0045179) |
| 1.5 | 4.5 | GO:0060053 | neurofilament cytoskeleton(GO:0060053) |
| 1.5 | 4.5 | GO:0097447 | dendritic tree(GO:0097447) |
| 1.4 | 4.3 | GO:0033565 | ESCRT-0 complex(GO:0033565) |
| 1.3 | 1.3 | GO:1990752 | microtubule end(GO:1990752) |
| 1.1 | 7.7 | GO:0098575 | lumenal side of lysosomal membrane(GO:0098575) |
| 1.1 | 10.8 | GO:0033178 | proton-transporting two-sector ATPase complex, catalytic domain(GO:0033178) |
| 1.1 | 4.3 | GO:0070985 | TFIIK complex(GO:0070985) |
| 1.1 | 6.4 | GO:0097418 | neurofibrillary tangle(GO:0097418) |
| 1.0 | 53.2 | GO:0005834 | heterotrimeric G-protein complex(GO:0005834) |
| 0.9 | 5.6 | GO:0070381 | endosome to plasma membrane transport vesicle(GO:0070381) |
| 0.9 | 31.6 | GO:0000159 | protein phosphatase type 2A complex(GO:0000159) |
| 0.9 | 7.1 | GO:0005786 | signal recognition particle, endoplasmic reticulum targeting(GO:0005786) |
| 0.9 | 2.7 | GO:0005715 | late recombination nodule(GO:0005715) |
| 0.8 | 11.8 | GO:0033179 | proton-transporting V-type ATPase, V0 domain(GO:0033179) |
| 0.8 | 14.3 | GO:1990124 | messenger ribonucleoprotein complex(GO:1990124) |
| 0.8 | 2.4 | GO:0005953 | CAAX-protein geranylgeranyltransferase complex(GO:0005953) |
| 0.8 | 5.6 | GO:1990452 | Parkin-FBXW7-Cul1 ubiquitin ligase complex(GO:1990452) |
| 0.8 | 2.4 | GO:0072534 | perineuronal net(GO:0072534) |
| 0.8 | 2.4 | GO:0031372 | UBC13-MMS2 complex(GO:0031372) |
| 0.8 | 16.2 | GO:0097440 | apical dendrite(GO:0097440) |
| 0.8 | 13.7 | GO:0033176 | proton-transporting V-type ATPase complex(GO:0033176) |
| 0.8 | 22.6 | GO:0005868 | cytoplasmic dynein complex(GO:0005868) |
| 0.7 | 5.9 | GO:0016012 | sarcoglycan complex(GO:0016012) |
| 0.7 | 6.7 | GO:0031467 | Cul7-RING ubiquitin ligase complex(GO:0031467) |
| 0.7 | 5.1 | GO:0070852 | cell body fiber(GO:0070852) |
| 0.7 | 2.9 | GO:1990730 | VCP-NSFL1C complex(GO:1990730) |
| 0.7 | 12.3 | GO:0097386 | glial cell projection(GO:0097386) |
| 0.7 | 2.2 | GO:1990812 | growth cone filopodium(GO:1990812) |
| 0.7 | 4.1 | GO:0031313 | extrinsic component of endosome membrane(GO:0031313) |
| 0.6 | 1.9 | GO:0033185 | dolichol-phosphate-mannose synthase complex(GO:0033185) |
| 0.6 | 10.0 | GO:0031362 | anchored component of external side of plasma membrane(GO:0031362) |
| 0.6 | 2.4 | GO:0005967 | mitochondrial pyruvate dehydrogenase complex(GO:0005967) |
| 0.6 | 3.0 | GO:0045272 | plasma membrane respiratory chain complex I(GO:0045272) |
| 0.6 | 2.3 | GO:0031673 | H zone(GO:0031673) |
| 0.5 | 6.9 | GO:0005869 | dynactin complex(GO:0005869) |
| 0.5 | 1.0 | GO:0005683 | U7 snRNP(GO:0005683) |
| 0.5 | 4.1 | GO:0033391 | chromatoid body(GO:0033391) |
| 0.5 | 6.6 | GO:0030130 | clathrin coat of trans-Golgi network vesicle(GO:0030130) |
| 0.5 | 2.4 | GO:0005945 | 6-phosphofructokinase complex(GO:0005945) |
| 0.5 | 7.6 | GO:0043194 | axon initial segment(GO:0043194) |
| 0.5 | 43.2 | GO:0043195 | terminal bouton(GO:0043195) |
| 0.5 | 1.8 | GO:0031510 | SUMO activating enzyme complex(GO:0031510) |
| 0.4 | 2.1 | GO:0034457 | Mpp10 complex(GO:0034457) |
| 0.4 | 2.6 | GO:0097129 | cyclin D2-CDK4 complex(GO:0097129) |
| 0.4 | 6.7 | GO:0097512 | cardiac myofibril(GO:0097512) |
| 0.4 | 11.8 | GO:0032839 | dendrite cytoplasm(GO:0032839) |
| 0.4 | 2.0 | GO:0045323 | interleukin-1 receptor complex(GO:0045323) |
| 0.4 | 5.1 | GO:0097433 | dense body(GO:0097433) |
| 0.4 | 7.8 | GO:0005890 | sodium:potassium-exchanging ATPase complex(GO:0005890) |
| 0.4 | 12.0 | GO:0030687 | preribosome, large subunit precursor(GO:0030687) |
| 0.4 | 5.0 | GO:0034993 | microtubule organizing center attachment site(GO:0034992) LINC complex(GO:0034993) |
| 0.4 | 20.4 | GO:0005871 | kinesin complex(GO:0005871) |
| 0.4 | 2.2 | GO:1990316 | ATG1/ULK1 kinase complex(GO:1990316) |
| 0.4 | 2.2 | GO:0009331 | glycerol-3-phosphate dehydrogenase complex(GO:0009331) |
| 0.4 | 0.7 | GO:0005639 | integral component of nuclear inner membrane(GO:0005639) intrinsic component of nuclear inner membrane(GO:0031229) nuclear membrane part(GO:0044453) |
| 0.4 | 4.7 | GO:0033270 | paranode region of axon(GO:0033270) |
| 0.4 | 3.2 | GO:0000125 | PCAF complex(GO:0000125) |
| 0.4 | 2.8 | GO:0036057 | filtration diaphragm(GO:0036056) slit diaphragm(GO:0036057) |
| 0.3 | 1.0 | GO:0034657 | GID complex(GO:0034657) |
| 0.3 | 4.1 | GO:0043073 | germ cell nucleus(GO:0043073) |
| 0.3 | 5.7 | GO:0030904 | retromer complex(GO:0030904) |
| 0.3 | 5.1 | GO:0043198 | dendritic shaft(GO:0043198) |
| 0.3 | 1.3 | GO:0005797 | Golgi medial cisterna(GO:0005797) |
| 0.3 | 4.7 | GO:0030122 | AP-2 adaptor complex(GO:0030122) |
| 0.3 | 3.4 | GO:0001518 | voltage-gated sodium channel complex(GO:0001518) |
| 0.3 | 7.1 | GO:0005753 | mitochondrial proton-transporting ATP synthase complex(GO:0005753) |
| 0.3 | 4.3 | GO:0070578 | RISC-loading complex(GO:0070578) |
| 0.3 | 3.0 | GO:0016593 | Cdc73/Paf1 complex(GO:0016593) |
| 0.3 | 1.2 | GO:0070876 | SOSS complex(GO:0070876) |
| 0.3 | 2.1 | GO:0072357 | PTW/PP1 phosphatase complex(GO:0072357) |
| 0.3 | 3.3 | GO:0005750 | mitochondrial respiratory chain complex III(GO:0005750) respiratory chain complex III(GO:0045275) |
| 0.3 | 3.0 | GO:0098799 | outer mitochondrial membrane protein complex(GO:0098799) |
| 0.3 | 0.3 | GO:0031415 | NatA complex(GO:0031415) |
| 0.3 | 4.2 | GO:0099738 | cell cortex region(GO:0099738) |
| 0.3 | 4.3 | GO:0005662 | DNA replication factor A complex(GO:0005662) |
| 0.3 | 1.4 | GO:0005594 | collagen type IX trimer(GO:0005594) |
| 0.3 | 3.1 | GO:0035371 | microtubule plus-end(GO:0035371) |
| 0.3 | 7.0 | GO:0008074 | guanylate cyclase complex, soluble(GO:0008074) |
| 0.3 | 0.8 | GO:0048269 | methionine adenosyltransferase complex(GO:0048269) |
| 0.3 | 0.8 | GO:0060187 | cell pole(GO:0060187) |
| 0.3 | 2.5 | GO:0030864 | cortical actin cytoskeleton(GO:0030864) |
| 0.3 | 12.6 | GO:0008180 | COP9 signalosome(GO:0008180) |
| 0.3 | 3.7 | GO:0097038 | perinuclear endoplasmic reticulum(GO:0097038) |
| 0.3 | 8.0 | GO:0000421 | autophagosome membrane(GO:0000421) |
| 0.3 | 3.3 | GO:0032281 | AMPA glutamate receptor complex(GO:0032281) |
| 0.3 | 5.4 | GO:0017101 | aminoacyl-tRNA synthetase multienzyme complex(GO:0017101) |
| 0.3 | 8.3 | GO:0044322 | endoplasmic reticulum quality control compartment(GO:0044322) |
| 0.3 | 3.0 | GO:0002199 | zona pellucida receptor complex(GO:0002199) |
| 0.3 | 1.0 | GO:0071439 | clathrin complex(GO:0071439) |
| 0.2 | 15.2 | GO:0005881 | cytoplasmic microtubule(GO:0005881) |
| 0.2 | 16.7 | GO:0043197 | dendritic spine(GO:0043197) |
| 0.2 | 0.7 | GO:0031466 | Cul5-RING ubiquitin ligase complex(GO:0031466) |
| 0.2 | 1.0 | GO:0048237 | rough endoplasmic reticulum lumen(GO:0048237) |
| 0.2 | 4.8 | GO:0005952 | cAMP-dependent protein kinase complex(GO:0005952) |
| 0.2 | 34.0 | GO:0030176 | integral component of endoplasmic reticulum membrane(GO:0030176) |
| 0.2 | 5.3 | GO:0032591 | dendritic spine membrane(GO:0032591) |
| 0.2 | 4.5 | GO:0005885 | Arp2/3 protein complex(GO:0005885) |
| 0.2 | 2.3 | GO:0030126 | COPI vesicle coat(GO:0030126) |
| 0.2 | 51.3 | GO:0099572 | postsynaptic density(GO:0014069) postsynaptic specialization(GO:0099572) |
| 0.2 | 37.0 | GO:0030427 | site of polarized growth(GO:0030427) |
| 0.2 | 1.1 | GO:0005672 | transcription factor TFIIA complex(GO:0005672) |
| 0.2 | 1.1 | GO:0032389 | MutLalpha complex(GO:0032389) |
| 0.2 | 2.0 | GO:0060077 | inhibitory synapse(GO:0060077) |
| 0.2 | 2.2 | GO:0008541 | proteasome regulatory particle, lid subcomplex(GO:0008541) |
| 0.2 | 4.9 | GO:0005838 | proteasome regulatory particle(GO:0005838) |
| 0.2 | 1.1 | GO:0035976 | AP1 complex(GO:0035976) |
| 0.2 | 10.7 | GO:0042645 | nucleoid(GO:0009295) mitochondrial nucleoid(GO:0042645) |
| 0.2 | 1.2 | GO:0071203 | WASH complex(GO:0071203) |
| 0.2 | 0.4 | GO:0044297 | cell body(GO:0044297) |
| 0.2 | 13.1 | GO:0030658 | transport vesicle membrane(GO:0030658) |
| 0.2 | 3.3 | GO:0030140 | trans-Golgi network transport vesicle(GO:0030140) |
| 0.2 | 1.4 | GO:0061617 | MICOS complex(GO:0061617) |
| 0.2 | 1.8 | GO:0070187 | telosome(GO:0070187) |
| 0.2 | 2.2 | GO:0042575 | DNA polymerase complex(GO:0042575) |
| 0.2 | 6.1 | GO:0005798 | Golgi-associated vesicle(GO:0005798) |
| 0.2 | 3.7 | GO:0031258 | lamellipodium membrane(GO:0031258) |
| 0.2 | 1.0 | GO:1990131 | EGO complex(GO:0034448) Gtr1-Gtr2 GTPase complex(GO:1990131) |
| 0.1 | 1.8 | GO:0030008 | TRAPP complex(GO:0030008) |
| 0.1 | 10.3 | GO:0101003 | ficolin-1-rich granule membrane(GO:0101003) |
| 0.1 | 3.4 | GO:0005686 | U2 snRNP(GO:0005686) |
| 0.1 | 17.4 | GO:0008021 | synaptic vesicle(GO:0008021) |
| 0.1 | 2.0 | GO:0045009 | melanosome membrane(GO:0033162) chitosome(GO:0045009) |
| 0.1 | 1.0 | GO:0000813 | ESCRT I complex(GO:0000813) |
| 0.1 | 1.3 | GO:0016013 | syntrophin complex(GO:0016013) |
| 0.1 | 2.0 | GO:0031089 | platelet dense granule lumen(GO:0031089) |
| 0.1 | 0.6 | GO:0032777 | Piccolo NuA4 histone acetyltransferase complex(GO:0032777) |
| 0.1 | 3.7 | GO:0030119 | AP-type membrane coat adaptor complex(GO:0030119) |
| 0.1 | 2.1 | GO:0045277 | respiratory chain complex IV(GO:0045277) |
| 0.1 | 1.4 | GO:0097255 | R2TP complex(GO:0097255) |
| 0.1 | 1.7 | GO:0005664 | origin recognition complex(GO:0000808) nuclear origin of replication recognition complex(GO:0005664) |
| 0.1 | 20.5 | GO:0005802 | trans-Golgi network(GO:0005802) |
| 0.1 | 2.6 | GO:0031307 | integral component of mitochondrial outer membrane(GO:0031307) |
| 0.1 | 6.4 | GO:0005776 | autophagosome(GO:0005776) |
| 0.1 | 0.7 | GO:0005787 | signal peptidase complex(GO:0005787) |
| 0.1 | 0.6 | GO:0044530 | supraspliceosomal complex(GO:0044530) |
| 0.1 | 0.6 | GO:0046581 | intercellular canaliculus(GO:0046581) |
| 0.1 | 0.3 | GO:0099634 | postsynaptic specialization membrane(GO:0099634) |
| 0.1 | 1.7 | GO:0031254 | uropod(GO:0001931) cell trailing edge(GO:0031254) |
| 0.1 | 0.2 | GO:0044232 | organelle membrane contact site(GO:0044232) |
| 0.1 | 0.8 | GO:0005827 | polar microtubule(GO:0005827) |
| 0.1 | 5.1 | GO:0031965 | nuclear membrane(GO:0031965) |
| 0.1 | 7.4 | GO:0031252 | cell leading edge(GO:0031252) |
| 0.1 | 0.8 | GO:0030673 | axolemma(GO:0030673) |
| 0.1 | 4.8 | GO:0008076 | voltage-gated potassium channel complex(GO:0008076) potassium channel complex(GO:0034705) |
| 0.1 | 1.2 | GO:1904115 | axon cytoplasm(GO:1904115) |
| 0.1 | 26.2 | GO:0098852 | lysosomal membrane(GO:0005765) lytic vacuole membrane(GO:0098852) |
| 0.1 | 2.4 | GO:0035098 | ESC/E(Z) complex(GO:0035098) |
| 0.1 | 38.1 | GO:0045202 | synapse(GO:0045202) |
| 0.1 | 0.6 | GO:0005689 | U12-type spliceosomal complex(GO:0005689) |
| 0.1 | 0.3 | GO:0018444 | translation release factor complex(GO:0018444) |
| 0.1 | 1.7 | GO:0097228 | sperm principal piece(GO:0097228) |
| 0.1 | 1.1 | GO:0031618 | nuclear pericentric heterochromatin(GO:0031618) |
| 0.1 | 1.0 | GO:0044613 | nuclear pore central transport channel(GO:0044613) |
| 0.1 | 9.7 | GO:0030496 | midbody(GO:0030496) |
| 0.1 | 3.5 | GO:0005875 | microtubule associated complex(GO:0005875) |
| 0.1 | 0.8 | GO:0005682 | U5 snRNP(GO:0005682) |
| 0.1 | 1.9 | GO:0005697 | telomerase holoenzyme complex(GO:0005697) |
| 0.1 | 1.1 | GO:0071011 | precatalytic spliceosome(GO:0071011) |
| 0.1 | 5.3 | GO:0048770 | melanosome(GO:0042470) pigment granule(GO:0048770) |
| 0.1 | 1.2 | GO:0030139 | endocytic vesicle(GO:0030139) |
| 0.1 | 1.5 | GO:0005921 | gap junction(GO:0005921) |
| 0.1 | 14.6 | GO:0000151 | ubiquitin ligase complex(GO:0000151) |
| 0.1 | 6.5 | GO:0030424 | axon(GO:0030424) |
| 0.1 | 5.0 | GO:0000922 | spindle pole(GO:0000922) |
| 0.1 | 0.3 | GO:0010369 | chromocenter(GO:0010369) |
| 0.1 | 0.4 | GO:0032045 | guanyl-nucleotide exchange factor complex(GO:0032045) |
| 0.1 | 1.5 | GO:0035869 | ciliary transition zone(GO:0035869) |
| 0.1 | 0.4 | GO:0005851 | eukaryotic translation initiation factor 2B complex(GO:0005851) |
| 0.1 | 0.3 | GO:0005865 | striated muscle thin filament(GO:0005865) |
| 0.0 | 5.0 | GO:0043209 | myelin sheath(GO:0043209) |
| 0.0 | 6.0 | GO:0005874 | microtubule(GO:0005874) |
| 0.0 | 0.5 | GO:0005847 | mRNA cleavage and polyadenylation specificity factor complex(GO:0005847) |
| 0.0 | 1.0 | GO:0044665 | MLL1/2 complex(GO:0044665) MLL1 complex(GO:0071339) |
| 0.0 | 0.1 | GO:0032593 | insulin-responsive compartment(GO:0032593) |
| 0.0 | 0.3 | GO:0031105 | septin complex(GO:0031105) |
| 0.0 | 2.5 | GO:0032580 | Golgi cisterna membrane(GO:0032580) |
| 0.0 | 0.3 | GO:0042382 | paraspeckles(GO:0042382) |
| 0.0 | 0.3 | GO:0033276 | transcription factor TFTC complex(GO:0033276) |
| 0.0 | 3.1 | GO:0031234 | extrinsic component of cytoplasmic side of plasma membrane(GO:0031234) |
| 0.0 | 0.9 | GO:0000178 | exosome (RNase complex)(GO:0000178) |
| 0.0 | 0.1 | GO:0008274 | gamma-tubulin large complex(GO:0000931) gamma-tubulin ring complex(GO:0008274) |
| 0.0 | 0.9 | GO:0002102 | podosome(GO:0002102) |
| 0.0 | 1.1 | GO:0045171 | intercellular bridge(GO:0045171) |
| 0.0 | 0.1 | GO:1990075 | periciliary membrane compartment(GO:1990075) |
| 0.0 | 0.3 | GO:0005771 | multivesicular body(GO:0005771) |
| 0.0 | 2.0 | GO:0030136 | clathrin-coated vesicle(GO:0030136) |
| 0.0 | 0.2 | GO:0032039 | integrator complex(GO:0032039) |
| 0.0 | 13.7 | GO:0048471 | perinuclear region of cytoplasm(GO:0048471) |
| 0.0 | 0.9 | GO:0005665 | DNA-directed RNA polymerase II, core complex(GO:0005665) |
| 0.0 | 0.2 | GO:0000974 | Prp19 complex(GO:0000974) |
| 0.0 | 0.7 | GO:0031904 | endosome lumen(GO:0031904) |
| 0.0 | 0.4 | GO:0097342 | ripoptosome(GO:0097342) |
| 0.0 | 0.0 | GO:0035253 | ciliary rootlet(GO:0035253) |
| 0.0 | 0.3 | GO:0031588 | nucleotide-activated protein kinase complex(GO:0031588) |
| 0.0 | 3.4 | GO:0098857 | membrane raft(GO:0045121) membrane microdomain(GO:0098857) |
| 0.0 | 0.2 | GO:0097550 | transcriptional preinitiation complex(GO:0097550) |
| 0.0 | 0.3 | GO:0009925 | basal plasma membrane(GO:0009925) |
| 0.0 | 5.4 | GO:0000139 | Golgi membrane(GO:0000139) |
| 0.0 | 0.1 | GO:0043564 | Ku70:Ku80 complex(GO:0043564) |
| 0.0 | 0.5 | GO:0000502 | proteasome complex(GO:0000502) |
Gene overrepresentation in molecular_function category:
| Log-likelihood per target | Total log-likelihood | Term | Description |
|---|---|---|---|
| 9.9 | 29.8 | GO:0004719 | protein-L-isoaspartate (D-aspartate) O-methyltransferase activity(GO:0004719) |
| 4.3 | 42.6 | GO:0033192 | calmodulin-dependent protein phosphatase activity(GO:0033192) |
| 3.5 | 21.1 | GO:1903135 | cupric ion binding(GO:1903135) |
| 3.1 | 9.2 | GO:0035403 | histone kinase activity (H3-T6 specific)(GO:0035403) |
| 3.0 | 12.1 | GO:0016880 | glutamate-ammonia ligase activity(GO:0004356) ammonia ligase activity(GO:0016211) acid-ammonia (or amide) ligase activity(GO:0016880) |
| 2.6 | 13.1 | GO:0004359 | glutaminase activity(GO:0004359) |
| 2.2 | 6.7 | GO:0004618 | phosphoglycerate kinase activity(GO:0004618) |
| 2.1 | 6.4 | GO:0051748 | UTP:glucose-1-phosphate uridylyltransferase activity(GO:0003983) UTP-monosaccharide-1-phosphate uridylyltransferase activity(GO:0051748) |
| 2.0 | 6.1 | GO:0004965 | G-protein coupled GABA receptor activity(GO:0004965) |
| 2.0 | 12.0 | GO:0008553 | hydrogen-exporting ATPase activity, phosphorylative mechanism(GO:0008553) |
| 1.9 | 21.1 | GO:0031681 | G-protein beta-subunit binding(GO:0031681) |
| 1.8 | 5.3 | GO:0043423 | 3-phosphoinositide-dependent protein kinase binding(GO:0043423) |
| 1.7 | 8.5 | GO:0016509 | long-chain-3-hydroxyacyl-CoA dehydrogenase activity(GO:0016509) |
| 1.7 | 10.1 | GO:0099602 | acetylcholine receptor regulator activity(GO:0030548) neurotransmitter receptor regulator activity(GO:0099602) |
| 1.6 | 8.0 | GO:0016403 | dimethylargininase activity(GO:0016403) |
| 1.6 | 19.1 | GO:0019911 | structural constituent of myelin sheath(GO:0019911) |
| 1.6 | 17.4 | GO:0051429 | corticotropin-releasing hormone receptor binding(GO:0051429) corticotropin-releasing hormone receptor 1 binding(GO:0051430) |
| 1.6 | 18.8 | GO:0004971 | AMPA glutamate receptor activity(GO:0004971) |
| 1.5 | 7.7 | GO:0071074 | eukaryotic initiation factor eIF2 binding(GO:0071074) |
| 1.4 | 7.1 | GO:0030942 | endoplasmic reticulum signal peptide binding(GO:0030942) |
| 1.4 | 7.0 | GO:0060175 | brain-derived neurotrophic factor-activated receptor activity(GO:0060175) |
| 1.3 | 4.0 | GO:0016838 | carbon-oxygen lyase activity, acting on phosphates(GO:0016838) |
| 1.2 | 6.2 | GO:0016933 | extracellular-glycine-gated ion channel activity(GO:0016933) extracellular-glycine-gated chloride channel activity(GO:0016934) |
| 1.2 | 3.6 | GO:0086062 | voltage-gated sodium channel activity involved in Purkinje myocyte action potential(GO:0086062) |
| 1.1 | 4.6 | GO:0031694 | alpha-2A adrenergic receptor binding(GO:0031694) |
| 1.1 | 6.6 | GO:0031802 | type 5 metabotropic glutamate receptor binding(GO:0031802) |
| 1.1 | 5.5 | GO:0010465 | nerve growth factor receptor activity(GO:0010465) |
| 1.1 | 5.4 | GO:0034046 | poly(G) binding(GO:0034046) |
| 1.0 | 5.2 | GO:0070404 | NADH binding(GO:0070404) |
| 1.0 | 8.1 | GO:0050816 | phosphothreonine binding(GO:0050816) |
| 1.0 | 4.1 | GO:0003960 | NADPH:quinone reductase activity(GO:0003960) |
| 1.0 | 3.0 | GO:0016309 | 1-phosphatidylinositol-5-phosphate 4-kinase activity(GO:0016309) |
| 1.0 | 4.0 | GO:0004723 | calcium-dependent protein serine/threonine phosphatase activity(GO:0004723) |
| 1.0 | 2.0 | GO:0045294 | alpha-catenin binding(GO:0045294) |
| 1.0 | 3.9 | GO:0051021 | GDP-dissociation inhibitor binding(GO:0051021) Rho GDP-dissociation inhibitor binding(GO:0051022) |
| 0.9 | 9.5 | GO:0031821 | G-protein coupled serotonin receptor binding(GO:0031821) |
| 0.9 | 12.2 | GO:1990247 | N6-methyladenosine-containing RNA binding(GO:1990247) |
| 0.9 | 2.7 | GO:0016534 | cyclin-dependent protein kinase 5 activator activity(GO:0016534) |
| 0.9 | 2.7 | GO:0010698 | acetyltransferase activator activity(GO:0010698) |
| 0.9 | 14.0 | GO:0035925 | mRNA 3'-UTR AU-rich region binding(GO:0035925) |
| 0.8 | 3.3 | GO:0046538 | bisphosphoglycerate mutase activity(GO:0004082) phosphoglycerate mutase activity(GO:0004619) 2,3-bisphosphoglycerate-dependent phosphoglycerate mutase activity(GO:0046538) |
| 0.8 | 2.4 | GO:0016418 | S-acetyltransferase activity(GO:0016418) |
| 0.8 | 4.0 | GO:1903136 | cuprous ion binding(GO:1903136) |
| 0.8 | 16.2 | GO:0043560 | insulin receptor substrate binding(GO:0043560) |
| 0.8 | 2.3 | GO:0005150 | interleukin-1, Type I receptor binding(GO:0005150) |
| 0.8 | 4.5 | GO:0102336 | fatty acid elongase activity(GO:0009922) 3-oxo-arachidoyl-CoA synthase activity(GO:0102336) 3-oxo-cerotoyl-CoA synthase activity(GO:0102337) 3-oxo-lignoceronyl-CoA synthase activity(GO:0102338) |
| 0.8 | 2.3 | GO:0042134 | rRNA primary transcript binding(GO:0042134) |
| 0.8 | 4.5 | GO:0042296 | ISG15 transferase activity(GO:0042296) |
| 0.7 | 3.6 | GO:0004668 | protein-arginine deiminase activity(GO:0004668) |
| 0.7 | 7.7 | GO:0055131 | C3HC4-type RING finger domain binding(GO:0055131) |
| 0.7 | 16.1 | GO:0036442 | hydrogen-exporting ATPase activity(GO:0036442) proton-transporting ATPase activity, rotational mechanism(GO:0046961) |
| 0.7 | 4.2 | GO:0050291 | sphingosine N-acyltransferase activity(GO:0050291) |
| 0.7 | 2.1 | GO:0008192 | RNA guanylyltransferase activity(GO:0008192) |
| 0.7 | 21.4 | GO:0008574 | ATP-dependent microtubule motor activity, plus-end-directed(GO:0008574) |
| 0.7 | 13.0 | GO:0048156 | tau protein binding(GO:0048156) |
| 0.7 | 2.0 | GO:0070699 | type II activin receptor binding(GO:0070699) |
| 0.7 | 2.0 | GO:0032427 | GBD domain binding(GO:0032427) |
| 0.7 | 2.0 | GO:0030272 | 5-formyltetrahydrofolate cyclo-ligase activity(GO:0030272) |
| 0.6 | 2.6 | GO:0008889 | glycerophosphodiester phosphodiesterase activity(GO:0008889) |
| 0.6 | 1.9 | GO:0004582 | dolichyl-phosphate beta-D-mannosyltransferase activity(GO:0004582) |
| 0.6 | 10.1 | GO:0008432 | JUN kinase binding(GO:0008432) |
| 0.6 | 1.9 | GO:0004813 | alanine-tRNA ligase activity(GO:0004813) |
| 0.6 | 1.8 | GO:0004814 | arginine-tRNA ligase activity(GO:0004814) |
| 0.6 | 15.2 | GO:0070840 | dynein complex binding(GO:0070840) |
| 0.6 | 11.9 | GO:0050811 | GABA receptor binding(GO:0050811) |
| 0.5 | 5.5 | GO:0005225 | volume-sensitive anion channel activity(GO:0005225) |
| 0.5 | 3.3 | GO:0004839 | ubiquitin activating enzyme activity(GO:0004839) |
| 0.5 | 1.6 | GO:0003974 | UDP-N-acetylglucosamine 4-epimerase activity(GO:0003974) UDP-glucose 4-epimerase activity(GO:0003978) |
| 0.5 | 2.2 | GO:0008466 | glycogenin glucosyltransferase activity(GO:0008466) |
| 0.5 | 14.6 | GO:0005388 | calcium-transporting ATPase activity(GO:0005388) |
| 0.5 | 1.6 | GO:0001025 | RNA polymerase III transcription factor binding(GO:0001025) |
| 0.5 | 2.6 | GO:0004468 | lysine N-acetyltransferase activity, acting on acetyl phosphate as donor(GO:0004468) |
| 0.5 | 4.6 | GO:0000182 | rDNA binding(GO:0000182) |
| 0.5 | 2.0 | GO:0001512 | dihydronicotinamide riboside quinone reductase activity(GO:0001512) melatonin binding(GO:1904408) |
| 0.5 | 3.0 | GO:0010858 | calcium-dependent protein kinase regulator activity(GO:0010858) |
| 0.5 | 6.4 | GO:0086080 | protein binding involved in heterotypic cell-cell adhesion(GO:0086080) |
| 0.5 | 2.0 | GO:0015319 | sodium:inorganic phosphate symporter activity(GO:0015319) |
| 0.5 | 16.4 | GO:0001671 | ATPase activator activity(GO:0001671) |
| 0.5 | 3.3 | GO:0008121 | ubiquinol-cytochrome-c reductase activity(GO:0008121) oxidoreductase activity, acting on diphenols and related substances as donors, cytochrome as acceptor(GO:0016681) |
| 0.5 | 1.9 | GO:0017040 | ceramidase activity(GO:0017040) |
| 0.5 | 3.7 | GO:0004176 | ATP-dependent peptidase activity(GO:0004176) |
| 0.5 | 11.6 | GO:0043014 | alpha-tubulin binding(GO:0043014) |
| 0.5 | 2.8 | GO:0008440 | inositol-1,4,5-trisphosphate 3-kinase activity(GO:0008440) |
| 0.4 | 1.8 | GO:0052798 | beta-galactoside alpha-2,3-sialyltransferase activity(GO:0052798) |
| 0.4 | 8.2 | GO:0097602 | cullin family protein binding(GO:0097602) |
| 0.4 | 2.2 | GO:0008486 | endopolyphosphatase activity(GO:0000298) diphosphoinositol-polyphosphate diphosphatase activity(GO:0008486) bis(5'-adenosyl)-hexaphosphatase activity(GO:0034431) bis(5'-adenosyl)-pentaphosphatase activity(GO:0034432) inositol diphosphate tetrakisphosphate diphosphatase activity(GO:0052840) inositol bisdiphosphate tetrakisphosphate diphosphatase activity(GO:0052841) inositol diphosphate pentakisphosphate diphosphatase activity(GO:0052842) inositol-1-diphosphate-2,3,4,5,6-pentakisphosphate diphosphatase activity(GO:0052843) inositol-3-diphosphate-1,2,4,5,6-pentakisphosphate diphosphatase activity(GO:0052844) inositol-5-diphosphate-1,2,3,4,6-pentakisphosphate diphosphatase activity(GO:0052845) inositol-1,5-bisdiphosphate-2,3,4,6-tetrakisphosphate 1-diphosphatase activity(GO:0052846) inositol-1,5-bisdiphosphate-2,3,4,6-tetrakisphosphate 5-diphosphatase activity(GO:0052847) inositol-3,5-bisdiphosphate-2,3,4,6-tetrakisphosphate 5-diphosphatase activity(GO:0052848) |
| 0.4 | 1.3 | GO:0001665 | alpha-N-acetylgalactosaminide alpha-2,6-sialyltransferase activity(GO:0001665) |
| 0.4 | 3.8 | GO:0070883 | pre-miRNA binding(GO:0070883) |
| 0.4 | 2.5 | GO:0003873 | 6-phosphofructo-2-kinase activity(GO:0003873) fructose-2,6-bisphosphate 2-phosphatase activity(GO:0004331) |
| 0.4 | 1.3 | GO:0046921 | glycoprotein 6-alpha-L-fucosyltransferase activity(GO:0008424) alpha-(1->6)-fucosyltransferase activity(GO:0046921) |
| 0.4 | 2.1 | GO:0044736 | acid-sensing ion channel activity(GO:0044736) |
| 0.4 | 1.2 | GO:0004103 | choline kinase activity(GO:0004103) |
| 0.4 | 3.3 | GO:0071933 | Arp2/3 complex binding(GO:0071933) |
| 0.4 | 2.5 | GO:0004013 | adenosylhomocysteinase activity(GO:0004013) trialkylsulfonium hydrolase activity(GO:0016802) |
| 0.4 | 4.9 | GO:0032407 | MutSalpha complex binding(GO:0032407) |
| 0.4 | 1.2 | GO:0071566 | UFM1 activating enzyme activity(GO:0071566) |
| 0.4 | 2.0 | GO:0038051 | glucocorticoid receptor activity(GO:0004883) glucocorticoid-activated RNA polymerase II transcription factor binding transcription factor activity(GO:0038051) |
| 0.4 | 2.4 | GO:0008443 | 6-phosphofructokinase activity(GO:0003872) phosphofructokinase activity(GO:0008443) |
| 0.4 | 5.1 | GO:0015924 | mannosyl-oligosaccharide mannosidase activity(GO:0015924) |
| 0.4 | 1.2 | GO:0004962 | endothelin receptor activity(GO:0004962) |
| 0.4 | 4.7 | GO:0032050 | clathrin heavy chain binding(GO:0032050) |
| 0.4 | 1.5 | GO:0003726 | double-stranded RNA adenosine deaminase activity(GO:0003726) |
| 0.4 | 1.9 | GO:0030060 | L-malate dehydrogenase activity(GO:0030060) |
| 0.4 | 7.5 | GO:1990939 | ATP-dependent microtubule motor activity(GO:1990939) |
| 0.4 | 4.8 | GO:0004716 | receptor signaling protein tyrosine kinase activity(GO:0004716) |
| 0.4 | 1.1 | GO:0008476 | protein-tyrosine sulfotransferase activity(GO:0008476) |
| 0.4 | 2.2 | GO:0004118 | cGMP-stimulated cyclic-nucleotide phosphodiesterase activity(GO:0004118) |
| 0.4 | 11.9 | GO:0003777 | microtubule motor activity(GO:0003777) |
| 0.4 | 1.8 | GO:0015183 | L-aspartate transmembrane transporter activity(GO:0015183) |
| 0.4 | 1.8 | GO:0004815 | aspartate-tRNA ligase activity(GO:0004815) |
| 0.4 | 2.1 | GO:0004447 | iodide peroxidase activity(GO:0004447) |
| 0.4 | 1.8 | GO:0045134 | uridine-diphosphatase activity(GO:0045134) |
| 0.3 | 1.0 | GO:0071209 | U7 snRNA binding(GO:0071209) |
| 0.3 | 7.6 | GO:0008239 | dipeptidyl-peptidase activity(GO:0008239) |
| 0.3 | 3.1 | GO:0043426 | MRF binding(GO:0043426) |
| 0.3 | 3.4 | GO:0042731 | PH domain binding(GO:0042731) |
| 0.3 | 2.1 | GO:0003747 | translation release factor activity(GO:0003747) translation termination factor activity(GO:0008079) |
| 0.3 | 0.7 | GO:0046790 | virion binding(GO:0046790) |
| 0.3 | 5.4 | GO:0008179 | adenylate cyclase binding(GO:0008179) |
| 0.3 | 6.1 | GO:0031683 | G-protein beta/gamma-subunit complex binding(GO:0031683) |
| 0.3 | 2.0 | GO:0004430 | 1-phosphatidylinositol 4-kinase activity(GO:0004430) |
| 0.3 | 15.3 | GO:0042169 | SH2 domain binding(GO:0042169) |
| 0.3 | 6.9 | GO:0044769 | ATPase activity, coupled to transmembrane movement of ions, rotational mechanism(GO:0044769) |
| 0.3 | 1.3 | GO:0004351 | glutamate decarboxylase activity(GO:0004351) |
| 0.3 | 2.2 | GO:0035256 | G-protein coupled glutamate receptor binding(GO:0035256) |
| 0.3 | 2.2 | GO:0043533 | inositol 1,3,4,5 tetrakisphosphate binding(GO:0043533) |
| 0.3 | 2.6 | GO:0016846 | carbon-sulfur lyase activity(GO:0016846) |
| 0.3 | 5.0 | GO:0097109 | neuroligin family protein binding(GO:0097109) |
| 0.3 | 1.2 | GO:0015232 | heme transporter activity(GO:0015232) |
| 0.3 | 3.1 | GO:0098505 | G-rich strand telomeric DNA binding(GO:0098505) |
| 0.3 | 1.8 | GO:0023025 | MHC class Ib protein complex binding(GO:0023025) MHC class Ib protein binding, via antigen binding groove(GO:0023030) |
| 0.3 | 2.7 | GO:0031078 | histone deacetylase activity (H3-K14 specific)(GO:0031078) NAD-dependent histone deacetylase activity (H3-K14 specific)(GO:0032041) |
| 0.3 | 32.0 | GO:0019888 | protein phosphatase regulator activity(GO:0019888) |
| 0.3 | 1.5 | GO:0035252 | UDP-xylosyltransferase activity(GO:0035252) xylosyltransferase activity(GO:0042285) |
| 0.3 | 0.9 | GO:0008195 | phosphatidate phosphatase activity(GO:0008195) |
| 0.3 | 1.2 | GO:0004348 | glucosylceramidase activity(GO:0004348) |
| 0.3 | 1.1 | GO:0004826 | phenylalanine-tRNA ligase activity(GO:0004826) |
| 0.3 | 1.1 | GO:0003938 | IMP dehydrogenase activity(GO:0003938) |
| 0.3 | 0.9 | GO:0033188 | sphingomyelin synthase activity(GO:0033188) ceramide cholinephosphotransferase activity(GO:0047493) |
| 0.3 | 1.1 | GO:0004307 | ethanolaminephosphotransferase activity(GO:0004307) |
| 0.3 | 3.1 | GO:0004551 | nucleotide diphosphatase activity(GO:0004551) |
| 0.3 | 5.8 | GO:0050750 | low-density lipoprotein particle receptor binding(GO:0050750) |
| 0.3 | 8.3 | GO:0005212 | structural constituent of eye lens(GO:0005212) |
| 0.3 | 1.6 | GO:0050145 | nucleoside phosphate kinase activity(GO:0050145) |
| 0.3 | 5.3 | GO:0048487 | beta-tubulin binding(GO:0048487) |
| 0.3 | 8.1 | GO:0017075 | syntaxin-1 binding(GO:0017075) |
| 0.3 | 9.4 | GO:0030544 | Hsp70 protein binding(GO:0030544) |
| 0.3 | 5.7 | GO:0003841 | 1-acylglycerol-3-phosphate O-acyltransferase activity(GO:0003841) |
| 0.3 | 5.1 | GO:0051537 | 2 iron, 2 sulfur cluster binding(GO:0051537) |
| 0.3 | 5.8 | GO:0004383 | guanylate cyclase activity(GO:0004383) |
| 0.3 | 2.5 | GO:0010314 | phosphatidylinositol-5-phosphate binding(GO:0010314) |
| 0.3 | 0.8 | GO:0003870 | 5-aminolevulinate synthase activity(GO:0003870) N-succinyltransferase activity(GO:0016749) |
| 0.2 | 2.0 | GO:0004017 | adenylate kinase activity(GO:0004017) |
| 0.2 | 1.5 | GO:0030160 | GKAP/Homer scaffold activity(GO:0030160) |
| 0.2 | 9.3 | GO:0008139 | nuclear localization sequence binding(GO:0008139) |
| 0.2 | 1.2 | GO:0048039 | ubiquinone binding(GO:0048039) |
| 0.2 | 1.0 | GO:0071987 | WD40-repeat domain binding(GO:0071987) |
| 0.2 | 5.3 | GO:0001965 | G-protein alpha-subunit binding(GO:0001965) |
| 0.2 | 10.7 | GO:0003785 | actin monomer binding(GO:0003785) |
| 0.2 | 0.5 | GO:0035651 | AP-3 adaptor complex binding(GO:0035651) |
| 0.2 | 5.6 | GO:0005092 | GDP-dissociation inhibitor activity(GO:0005092) |
| 0.2 | 1.9 | GO:0046920 | alpha-(1->3)-fucosyltransferase activity(GO:0046920) |
| 0.2 | 4.6 | GO:0008603 | cAMP-dependent protein kinase inhibitor activity(GO:0004862) cAMP-dependent protein kinase regulator activity(GO:0008603) |
| 0.2 | 1.2 | GO:0033592 | RNA strand annealing activity(GO:0033592) |
| 0.2 | 3.7 | GO:0051010 | microtubule plus-end binding(GO:0051010) |
| 0.2 | 3.4 | GO:0005095 | GTPase inhibitor activity(GO:0005095) |
| 0.2 | 0.9 | GO:0004457 | lactate dehydrogenase activity(GO:0004457) L-lactate dehydrogenase activity(GO:0004459) |
| 0.2 | 0.9 | GO:0038025 | reelin receptor activity(GO:0038025) |
| 0.2 | 3.5 | GO:0031435 | mitogen-activated protein kinase kinase kinase binding(GO:0031435) |
| 0.2 | 2.4 | GO:0019870 | potassium channel inhibitor activity(GO:0019870) |
| 0.2 | 1.9 | GO:0009975 | cyclase activity(GO:0009975) |
| 0.2 | 14.0 | GO:0019003 | GDP binding(GO:0019003) |
| 0.2 | 2.3 | GO:0015379 | potassium:chloride symporter activity(GO:0015379) potassium ion symporter activity(GO:0022820) |
| 0.2 | 2.1 | GO:0070324 | thyroid hormone binding(GO:0070324) |
| 0.2 | 1.5 | GO:0017134 | fibroblast growth factor binding(GO:0017134) |
| 0.2 | 0.6 | GO:0032422 | purine-rich negative regulatory element binding(GO:0032422) |
| 0.2 | 4.5 | GO:0005521 | lamin binding(GO:0005521) |
| 0.2 | 1.0 | GO:0004830 | tryptophan-tRNA ligase activity(GO:0004830) |
| 0.2 | 1.8 | GO:0016857 | racemase and epimerase activity, acting on carbohydrates and derivatives(GO:0016857) |
| 0.2 | 6.8 | GO:0005184 | neuropeptide hormone activity(GO:0005184) |
| 0.2 | 5.0 | GO:0008191 | metalloendopeptidase inhibitor activity(GO:0008191) |
| 0.2 | 1.5 | GO:0004565 | beta-galactosidase activity(GO:0004565) |
| 0.2 | 1.0 | GO:0017159 | pantetheine hydrolase activity(GO:0017159) |
| 0.2 | 2.3 | GO:0005522 | profilin binding(GO:0005522) |
| 0.2 | 0.9 | GO:0050508 | glucuronosyl-N-acetylglucosaminyl-proteoglycan 4-alpha-N-acetylglucosaminyltransferase activity(GO:0050508) |
| 0.2 | 5.0 | GO:0031624 | ubiquitin conjugating enzyme binding(GO:0031624) |
| 0.2 | 2.1 | GO:0031386 | protein tag(GO:0031386) |
| 0.2 | 1.4 | GO:0050542 | icosanoid binding(GO:0050542) arachidonic acid binding(GO:0050544) fatty acid derivative binding(GO:1901567) |
| 0.2 | 2.8 | GO:0034185 | apolipoprotein binding(GO:0034185) |
| 0.2 | 1.0 | GO:0035374 | chondroitin sulfate binding(GO:0035374) |
| 0.2 | 0.9 | GO:0005219 | ryanodine-sensitive calcium-release channel activity(GO:0005219) |
| 0.2 | 12.4 | GO:0048306 | calcium-dependent protein binding(GO:0048306) |
| 0.2 | 1.7 | GO:0051525 | NFAT protein binding(GO:0051525) |
| 0.2 | 5.2 | GO:0008536 | Ran GTPase binding(GO:0008536) |
| 0.2 | 0.3 | GO:0086006 | voltage-gated sodium channel activity involved in cardiac muscle cell action potential(GO:0086006) |
| 0.2 | 1.6 | GO:0004028 | 3-chloroallyl aldehyde dehydrogenase activity(GO:0004028) |
| 0.2 | 2.1 | GO:0001087 | transcription factor activity, sequence-specific DNA binding, RNA polymerase recruiting(GO:0001011) transcription factor activity, TFIIB-class binding(GO:0001087) |
| 0.2 | 1.1 | GO:0001727 | lipid kinase activity(GO:0001727) |
| 0.2 | 1.0 | GO:0000774 | adenyl-nucleotide exchange factor activity(GO:0000774) |
| 0.2 | 3.5 | GO:0000339 | RNA cap binding(GO:0000339) |
| 0.2 | 1.1 | GO:0001517 | N-acetylglucosamine 6-O-sulfotransferase activity(GO:0001517) |
| 0.2 | 70.3 | GO:0045296 | cadherin binding(GO:0045296) |
| 0.2 | 0.8 | GO:0047134 | protein-disulfide reductase activity(GO:0047134) |
| 0.2 | 2.0 | GO:0031489 | myosin V binding(GO:0031489) |
| 0.2 | 0.6 | GO:0008384 | IkappaB kinase activity(GO:0008384) |
| 0.2 | 1.1 | GO:0000268 | peroxisome targeting sequence binding(GO:0000268) |
| 0.2 | 4.9 | GO:0004115 | 3',5'-cyclic-AMP phosphodiesterase activity(GO:0004115) |
| 0.2 | 2.1 | GO:0005545 | 1-phosphatidylinositol binding(GO:0005545) |
| 0.2 | 1.4 | GO:1990239 | steroid hormone binding(GO:1990239) |
| 0.2 | 1.1 | GO:1990226 | histone methyltransferase binding(GO:1990226) |
| 0.1 | 4.5 | GO:0004198 | calcium-dependent cysteine-type endopeptidase activity(GO:0004198) |
| 0.1 | 0.7 | GO:0033857 | inositol-1,3,4,5,6-pentakisphosphate kinase activity(GO:0000827) inositol hexakisphosphate kinase activity(GO:0000828) inositol heptakisphosphate kinase activity(GO:0000829) inositol hexakisphosphate 5-kinase activity(GO:0000832) diphosphoinositol-pentakisphosphate kinase activity(GO:0033857) inositol hexakisphosphate 1-kinase activity(GO:0052723) inositol hexakisphosphate 3-kinase activity(GO:0052724) |
| 0.1 | 0.4 | GO:0003976 | UDP-N-acetylglucosamine-lysosomal-enzyme N-acetylglucosaminephosphotransferase activity(GO:0003976) |
| 0.1 | 1.5 | GO:0001730 | 2'-5'-oligoadenylate synthetase activity(GO:0001730) |
| 0.1 | 8.0 | GO:0001540 | beta-amyloid binding(GO:0001540) |
| 0.1 | 1.5 | GO:0016290 | palmitoyl-CoA hydrolase activity(GO:0016290) |
| 0.1 | 1.1 | GO:0004340 | glucokinase activity(GO:0004340) hexokinase activity(GO:0004396) fructokinase activity(GO:0008865) mannokinase activity(GO:0019158) |
| 0.1 | 2.2 | GO:0005149 | interleukin-1 receptor binding(GO:0005149) |
| 0.1 | 0.5 | GO:0019862 | IgA binding(GO:0019862) |
| 0.1 | 1.1 | GO:0035612 | AP-2 adaptor complex binding(GO:0035612) |
| 0.1 | 1.3 | GO:0051011 | microtubule minus-end binding(GO:0051011) |
| 0.1 | 11.4 | GO:0005525 | GTP binding(GO:0005525) |
| 0.1 | 1.1 | GO:1990446 | U1 snRNP binding(GO:1990446) |
| 0.1 | 1.7 | GO:0031432 | titin binding(GO:0031432) |
| 0.1 | 5.5 | GO:0061631 | ubiquitin conjugating enzyme activity(GO:0061631) |
| 0.1 | 1.3 | GO:0050998 | nitric-oxide synthase binding(GO:0050998) |
| 0.1 | 26.7 | GO:0003924 | GTPase activity(GO:0003924) |
| 0.1 | 1.1 | GO:0008526 | phosphatidylinositol transporter activity(GO:0008526) |
| 0.1 | 1.7 | GO:0008527 | taste receptor activity(GO:0008527) |
| 0.1 | 2.2 | GO:0017091 | AU-rich element binding(GO:0017091) |
| 0.1 | 1.7 | GO:0004861 | cyclin-dependent protein serine/threonine kinase inhibitor activity(GO:0004861) |
| 0.1 | 5.5 | GO:0017112 | Rab guanyl-nucleotide exchange factor activity(GO:0017112) |
| 0.1 | 0.3 | GO:0004040 | amidase activity(GO:0004040) |
| 0.1 | 0.3 | GO:0015440 | peptide-transporting ATPase activity(GO:0015440) |
| 0.1 | 3.1 | GO:0008188 | neuropeptide receptor activity(GO:0008188) |
| 0.1 | 0.9 | GO:0015288 | porin activity(GO:0015288) |
| 0.1 | 0.5 | GO:0099529 | neurotransmitter receptor activity involved in regulation of postsynaptic membrane potential(GO:0099529) transmitter-gated ion channel activity involved in regulation of postsynaptic membrane potential(GO:1904315) |
| 0.1 | 0.3 | GO:0004345 | glucose-6-phosphate dehydrogenase activity(GO:0004345) |
| 0.1 | 1.4 | GO:0017017 | MAP kinase tyrosine/serine/threonine phosphatase activity(GO:0017017) |
| 0.1 | 2.9 | GO:0016922 | ligand-dependent nuclear receptor binding(GO:0016922) |
| 0.1 | 0.7 | GO:0017160 | Ral GTPase binding(GO:0017160) |
| 0.1 | 1.4 | GO:0005351 | sugar:proton symporter activity(GO:0005351) cation:sugar symporter activity(GO:0005402) |
| 0.1 | 2.1 | GO:0016538 | cyclin-dependent protein serine/threonine kinase regulator activity(GO:0016538) |
| 0.1 | 0.7 | GO:0035184 | histone threonine kinase activity(GO:0035184) |
| 0.1 | 1.0 | GO:0016755 | transferase activity, transferring amino-acyl groups(GO:0016755) |
| 0.1 | 4.1 | GO:0016763 | transferase activity, transferring pentosyl groups(GO:0016763) |
| 0.1 | 0.7 | GO:0015216 | adenine nucleotide transmembrane transporter activity(GO:0000295) purine ribonucleotide transmembrane transporter activity(GO:0005346) ATP transmembrane transporter activity(GO:0005347) purine nucleotide transmembrane transporter activity(GO:0015216) ADP transmembrane transporter activity(GO:0015217) |
| 0.1 | 4.9 | GO:0017124 | SH3 domain binding(GO:0017124) |
| 0.1 | 1.9 | GO:0030507 | spectrin binding(GO:0030507) |
| 0.1 | 0.4 | GO:0048406 | nerve growth factor binding(GO:0048406) |
| 0.1 | 1.0 | GO:0009881 | photoreceptor activity(GO:0009881) |
| 0.1 | 0.9 | GO:0008199 | ferric iron binding(GO:0008199) |
| 0.1 | 0.2 | GO:0004802 | transketolase activity(GO:0004802) |
| 0.1 | 0.5 | GO:0004741 | [pyruvate dehydrogenase (lipoamide)] phosphatase activity(GO:0004741) |
| 0.1 | 2.7 | GO:0043175 | RNA polymerase core enzyme binding(GO:0043175) |
| 0.1 | 1.7 | GO:0019198 | transmembrane receptor protein tyrosine phosphatase activity(GO:0005001) transmembrane receptor protein phosphatase activity(GO:0019198) |
| 0.1 | 0.8 | GO:0036402 | proteasome-activating ATPase activity(GO:0036402) |
| 0.1 | 2.1 | GO:0016676 | cytochrome-c oxidase activity(GO:0004129) heme-copper terminal oxidase activity(GO:0015002) oxidoreductase activity, acting on a heme group of donors, oxygen as acceptor(GO:0016676) |
| 0.1 | 0.3 | GO:0050309 | glucose-6-phosphatase activity(GO:0004346) sugar-terminal-phosphatase activity(GO:0050309) |
| 0.1 | 0.9 | GO:0031593 | polyubiquitin binding(GO:0031593) |
| 0.1 | 0.3 | GO:0019976 | interleukin-2 receptor activity(GO:0004911) interleukin-2 binding(GO:0019976) |
| 0.1 | 0.4 | GO:0060590 | ATPase regulator activity(GO:0060590) |
| 0.1 | 0.2 | GO:0032184 | SUMO polymer binding(GO:0032184) |
| 0.1 | 0.7 | GO:0003831 | beta-N-acetylglucosaminylglycopeptide beta-1,4-galactosyltransferase activity(GO:0003831) |
| 0.1 | 0.6 | GO:0047623 | AMP deaminase activity(GO:0003876) adenosine-phosphate deaminase activity(GO:0047623) |
| 0.1 | 8.5 | GO:0008017 | microtubule binding(GO:0008017) |
| 0.1 | 0.9 | GO:0070410 | co-SMAD binding(GO:0070410) |
| 0.1 | 1.6 | GO:0070034 | telomerase RNA binding(GO:0070034) |
| 0.1 | 10.3 | GO:0005057 | receptor signaling protein activity(GO:0005057) |
| 0.1 | 6.6 | GO:1901981 | phosphatidylinositol phosphate binding(GO:1901981) |
| 0.1 | 0.9 | GO:0048531 | beta-1,3-galactosyltransferase activity(GO:0048531) |
| 0.1 | 0.6 | GO:0035613 | RNA stem-loop binding(GO:0035613) |
| 0.1 | 0.4 | GO:0008948 | malic enzyme activity(GO:0004470) malate dehydrogenase (decarboxylating) (NAD+) activity(GO:0004471) malate dehydrogenase (decarboxylating) (NADP+) activity(GO:0004473) oxaloacetate decarboxylase activity(GO:0008948) |
| 0.1 | 0.2 | GO:0015563 | uptake transmembrane transporter activity(GO:0015563) |
| 0.1 | 0.9 | GO:0005086 | ARF guanyl-nucleotide exchange factor activity(GO:0005086) |
| 0.1 | 0.3 | GO:0008113 | peptide-methionine (S)-S-oxide reductase activity(GO:0008113) |
| 0.1 | 0.3 | GO:0051787 | misfolded protein binding(GO:0051787) |
| 0.1 | 1.1 | GO:0019239 | deaminase activity(GO:0019239) |
| 0.1 | 0.3 | GO:0033130 | acetylcholine receptor binding(GO:0033130) |
| 0.1 | 2.6 | GO:0050136 | NADH dehydrogenase (ubiquinone) activity(GO:0008137) NADH dehydrogenase (quinone) activity(GO:0050136) |
| 0.1 | 0.5 | GO:0002161 | aminoacyl-tRNA editing activity(GO:0002161) |
| 0.1 | 0.2 | GO:0031685 | adenosine receptor binding(GO:0031685) |
| 0.1 | 0.3 | GO:0019103 | pyrimidine nucleotide binding(GO:0019103) |
| 0.1 | 0.8 | GO:0030742 | GTP-dependent protein binding(GO:0030742) |
| 0.1 | 0.6 | GO:0008429 | phosphatidylethanolamine binding(GO:0008429) |
| 0.1 | 1.1 | GO:0042288 | MHC class I protein binding(GO:0042288) |
| 0.1 | 0.4 | GO:0004563 | beta-N-acetylhexosaminidase activity(GO:0004563) |
| 0.0 | 0.1 | GO:0008332 | low voltage-gated calcium channel activity(GO:0008332) |
| 0.0 | 0.4 | GO:0047499 | calcium-independent phospholipase A2 activity(GO:0047499) |
| 0.0 | 2.9 | GO:0019843 | rRNA binding(GO:0019843) |
| 0.0 | 0.4 | GO:0022851 | GABA-gated chloride ion channel activity(GO:0022851) |
| 0.0 | 0.5 | GO:0035198 | miRNA binding(GO:0035198) |
| 0.0 | 0.4 | GO:0001786 | phosphatidylserine binding(GO:0001786) |
| 0.0 | 0.2 | GO:0035939 | microsatellite binding(GO:0035939) |
| 0.0 | 0.9 | GO:0001055 | RNA polymerase II activity(GO:0001055) |
| 0.0 | 1.4 | GO:0017080 | sodium channel regulator activity(GO:0017080) |
| 0.0 | 3.0 | GO:0004867 | serine-type endopeptidase inhibitor activity(GO:0004867) |
| 0.0 | 0.5 | GO:0004691 | cAMP-dependent protein kinase activity(GO:0004691) |
| 0.0 | 0.2 | GO:0008494 | translation activator activity(GO:0008494) |
| 0.0 | 0.1 | GO:0005502 | 11-cis retinal binding(GO:0005502) |
| 0.0 | 0.5 | GO:0005542 | folic acid binding(GO:0005542) |
| 0.0 | 0.1 | GO:0030109 | HLA-B specific inhibitory MHC class I receptor activity(GO:0030109) inhibitory MHC class I receptor activity(GO:0032396) |
| 0.0 | 0.2 | GO:0070878 | primary miRNA binding(GO:0070878) |
| 0.0 | 0.6 | GO:0005544 | calcium-dependent phospholipid binding(GO:0005544) |
| 0.0 | 0.2 | GO:0030020 | extracellular matrix structural constituent conferring tensile strength(GO:0030020) |
| 0.0 | 0.3 | GO:0016929 | SUMO-specific protease activity(GO:0016929) |
| 0.0 | 1.3 | GO:0030276 | clathrin binding(GO:0030276) |
| 0.0 | 0.2 | GO:0016286 | small conductance calcium-activated potassium channel activity(GO:0016286) |
| 0.0 | 1.3 | GO:0051540 | iron-sulfur cluster binding(GO:0051536) metal cluster binding(GO:0051540) |
| 0.0 | 0.0 | GO:0036435 | K48-linked polyubiquitin binding(GO:0036435) |
| 0.0 | 0.9 | GO:0004181 | metallocarboxypeptidase activity(GO:0004181) |
| 0.0 | 0.4 | GO:0005487 | nucleocytoplasmic transporter activity(GO:0005487) |
| 0.0 | 5.2 | GO:0044822 | mRNA binding(GO:0003729) poly(A) RNA binding(GO:0044822) |
| 0.0 | 0.2 | GO:0005143 | interleukin-12 receptor binding(GO:0005143) |
| 0.0 | 4.0 | GO:0008237 | metallopeptidase activity(GO:0008237) |
| 0.0 | 0.7 | GO:0044183 | protein binding involved in protein folding(GO:0044183) |
| 0.0 | 0.3 | GO:0043395 | heparan sulfate proteoglycan binding(GO:0043395) |
| 0.0 | 0.7 | GO:0004364 | glutathione transferase activity(GO:0004364) |
| 0.0 | 0.2 | GO:0019992 | diacylglycerol binding(GO:0019992) |
| 0.0 | 0.7 | GO:0042626 | ATPase activity, coupled to transmembrane movement of substances(GO:0042626) |
| 0.0 | 0.4 | GO:0097200 | cysteine-type endopeptidase activity involved in execution phase of apoptosis(GO:0097200) |
| 0.0 | 0.1 | GO:0042287 | MHC protein binding(GO:0042287) |
| 0.0 | 0.3 | GO:0043539 | protein serine/threonine kinase activator activity(GO:0043539) |
| 0.0 | 0.1 | GO:1904264 | ubiquitin protein ligase activity involved in ERAD pathway(GO:1904264) |
| 0.0 | 0.3 | GO:0000049 | tRNA binding(GO:0000049) |
Gene overrepresentation in C2:CP category:
| Log-likelihood per target | Total log-likelihood | Term | Description |
|---|---|---|---|
| 1.0 | 20.4 | PID S1P S1P4 PATHWAY | S1P4 pathway |
| 0.8 | 95.3 | PID P75 NTR PATHWAY | p75(NTR)-mediated signaling |
| 0.7 | 29.8 | PID NCADHERIN PATHWAY | N-cadherin signaling events |
| 0.6 | 9.7 | PID TCR RAS PATHWAY | Ras signaling in the CD4+ TCR pathway |
| 0.6 | 1.9 | PID MET PATHWAY | Signaling events mediated by Hepatocyte Growth Factor Receptor (c-Met) |
| 0.6 | 31.6 | PID IL12 STAT4 PATHWAY | IL12 signaling mediated by STAT4 |
| 0.6 | 1.7 | PID IL2 PI3K PATHWAY | IL2 signaling events mediated by PI3K |
| 0.5 | 33.7 | PID ATR PATHWAY | ATR signaling pathway |
| 0.5 | 25.3 | PID AURORA A PATHWAY | Aurora A signaling |
| 0.4 | 4.4 | ST PAC1 RECEPTOR PATHWAY | PAC1 Receptor Pathway |
| 0.4 | 19.8 | SIG REGULATION OF THE ACTIN CYTOSKELETON BY RHO GTPASES | Genes related to regulation of the actin cytoskeleton |
| 0.4 | 12.4 | ST DIFFERENTIATION PATHWAY IN PC12 CELLS | Differentiation Pathway in PC12 Cells; this is a specific case of PAC1 Receptor Pathway. |
| 0.3 | 8.4 | PID ARF 3PATHWAY | Arf1 pathway |
| 0.3 | 18.5 | PID FAS PATHWAY | FAS (CD95) signaling pathway |
| 0.3 | 16.8 | PID INTEGRIN A4B1 PATHWAY | Alpha4 beta1 integrin signaling events |
| 0.3 | 8.7 | PID REELIN PATHWAY | Reelin signaling pathway |
| 0.2 | 8.6 | PID ECADHERIN NASCENT AJ PATHWAY | E-cadherin signaling in the nascent adherens junction |
| 0.2 | 8.6 | PID HIF1A PATHWAY | Hypoxic and oxygen homeostasis regulation of HIF-1-alpha |
| 0.2 | 2.8 | PID NEPHRIN NEPH1 PATHWAY | Nephrin/Neph1 signaling in the kidney podocyte |
| 0.2 | 7.7 | PID CDC42 REG PATHWAY | Regulation of CDC42 activity |
| 0.2 | 3.7 | PID BETA CATENIN DEG PATHWAY | Degradation of beta catenin |
| 0.2 | 5.8 | PID RETINOIC ACID PATHWAY | Retinoic acid receptors-mediated signaling |
| 0.2 | 9.3 | PID TRKR PATHWAY | Neurotrophic factor-mediated Trk receptor signaling |
| 0.2 | 0.8 | PID INSULIN PATHWAY | Insulin Pathway |
| 0.2 | 6.5 | PID MYC PATHWAY | C-MYC pathway |
| 0.1 | 6.4 | PID PLK1 PATHWAY | PLK1 signaling events |
| 0.1 | 5.8 | PID GLYPICAN 1PATHWAY | Glypican 1 network |
| 0.1 | 1.3 | PID P38 GAMMA DELTA PATHWAY | Signaling mediated by p38-gamma and p38-delta |
| 0.1 | 7.2 | PID RHOA REG PATHWAY | Regulation of RhoA activity |
| 0.1 | 1.8 | PID CIRCADIAN PATHWAY | Circadian rhythm pathway |
| 0.1 | 1.9 | PID IL27 PATHWAY | IL27-mediated signaling events |
| 0.1 | 5.2 | PID SHP2 PATHWAY | SHP2 signaling |
| 0.1 | 2.9 | PID AJDISS 2PATHWAY | Posttranslational regulation of adherens junction stability and dissassembly |
| 0.1 | 4.7 | PID ARF6 TRAFFICKING PATHWAY | Arf6 trafficking events |
| 0.1 | 1.6 | PID RAC1 REG PATHWAY | Regulation of RAC1 activity |
| 0.1 | 2.9 | PID HEDGEHOG GLI PATHWAY | Hedgehog signaling events mediated by Gli proteins |
| 0.1 | 3.0 | PID HDAC CLASSII PATHWAY | Signaling events mediated by HDAC Class II |
| 0.1 | 0.3 | PID ERBB NETWORK PATHWAY | ErbB receptor signaling network |
| 0.1 | 2.3 | PID ENDOTHELIN PATHWAY | Endothelins |
| 0.1 | 5.7 | PID MYC REPRESS PATHWAY | Validated targets of C-MYC transcriptional repression |
| 0.1 | 1.4 | PID ECADHERIN STABILIZATION PATHWAY | Stabilization and expansion of the E-cadherin adherens junction |
| 0.0 | 1.4 | PID HIF2PATHWAY | HIF-2-alpha transcription factor network |
| 0.0 | 1.0 | PID FOXO PATHWAY | FoxO family signaling |
| 0.0 | 1.5 | PID CDC42 PATHWAY | CDC42 signaling events |
| 0.0 | 2.7 | PID INTEGRIN3 PATHWAY | Beta3 integrin cell surface interactions |
| 0.0 | 0.8 | PID IL2 1PATHWAY | IL2-mediated signaling events |
| 0.0 | 0.9 | PID PI3K PLC TRK PATHWAY | Trk receptor signaling mediated by PI3K and PLC-gamma |
| 0.0 | 0.7 | PID RET PATHWAY | Signaling events regulated by Ret tyrosine kinase |
| 0.0 | 0.5 | PID P38 ALPHA BETA PATHWAY | Regulation of p38-alpha and p38-beta |
| 0.0 | 0.8 | PID FAK PATHWAY | Signaling events mediated by focal adhesion kinase |
| 0.0 | 0.3 | PID MAPK TRK PATHWAY | Trk receptor signaling mediated by the MAPK pathway |
| 0.0 | 0.0 | PID IGF1 PATHWAY | IGF1 pathway |
| 0.0 | 0.4 | PID DNA PK PATHWAY | DNA-PK pathway in nonhomologous end joining |
| 0.0 | 0.2 | PID TRAIL PATHWAY | TRAIL signaling pathway |
| 0.0 | 0.7 | PID MTOR 4PATHWAY | mTOR signaling pathway |
| 0.0 | 0.5 | PID ERBB1 INTERNALIZATION PATHWAY | Internalization of ErbB1 |
Gene overrepresentation in C2:CP:REACTOME category:
| Log-likelihood per target | Total log-likelihood | Term | Description |
|---|---|---|---|
| 1.1 | 31.9 | REACTOME TRAFFICKING OF GLUR2 CONTAINING AMPA RECEPTORS | Genes involved in Trafficking of GluR2-containing AMPA receptors |
| 1.1 | 63.4 | REACTOME DARPP 32 EVENTS | Genes involved in DARPP-32 events |
| 0.9 | 15.5 | REACTOME TGF BETA RECEPTOR SIGNALING IN EMT EPITHELIAL TO MESENCHYMAL TRANSITION | Genes involved in TGF-beta receptor signaling in EMT (epithelial to mesenchymal transition) |
| 0.9 | 7.0 | REACTOME INFLUENZA VIRAL RNA TRANSCRIPTION AND REPLICATION | Genes involved in Influenza Viral RNA Transcription and Replication |
| 0.8 | 23.6 | REACTOME AMINO ACID SYNTHESIS AND INTERCONVERSION TRANSAMINATION | Genes involved in Amino acid synthesis and interconversion (transamination) |
| 0.8 | 6.1 | REACTOME INHIBITION OF INSULIN SECRETION BY ADRENALINE NORADRENALINE | Genes involved in Inhibition of Insulin Secretion by Adrenaline/Noradrenaline |
| 0.6 | 75.8 | REACTOME P75 NTR RECEPTOR MEDIATED SIGNALLING | Genes involved in p75 NTR receptor-mediated signalling |
| 0.6 | 19.1 | REACTOME FORMATION OF TUBULIN FOLDING INTERMEDIATES BY CCT TRIC | Genes involved in Formation of tubulin folding intermediates by CCT/TriC |
| 0.6 | 18.7 | REACTOME ADVANCED GLYCOSYLATION ENDPRODUCT RECEPTOR SIGNALING | Genes involved in Advanced glycosylation endproduct receptor signaling |
| 0.6 | 17.2 | REACTOME INSULIN RECEPTOR RECYCLING | Genes involved in Insulin receptor recycling |
| 0.6 | 10.2 | REACTOME DOPAMINE NEUROTRANSMITTER RELEASE CYCLE | Genes involved in Dopamine Neurotransmitter Release Cycle |
| 0.6 | 26.6 | REACTOME SIGNALING BY ROBO RECEPTOR | Genes involved in Signaling by Robo receptor |
| 0.5 | 29.0 | REACTOME G ALPHA Z SIGNALLING EVENTS | Genes involved in G alpha (z) signalling events |
| 0.5 | 9.1 | REACTOME GABA SYNTHESIS RELEASE REUPTAKE AND DEGRADATION | Genes involved in GABA synthesis, release, reuptake and degradation |
| 0.5 | 2.3 | REACTOME REGULATION OF INSULIN SECRETION BY ACETYLCHOLINE | Genes involved in Regulation of Insulin Secretion by Acetylcholine |
| 0.4 | 14.5 | REACTOME SIGNAL REGULATORY PROTEIN SIRP FAMILY INTERACTIONS | Genes involved in Signal regulatory protein (SIRP) family interactions |
| 0.4 | 7.5 | REACTOME TRAFFICKING OF AMPA RECEPTORS | Genes involved in Trafficking of AMPA receptors |
| 0.4 | 7.0 | REACTOME THROMBIN SIGNALLING THROUGH PROTEINASE ACTIVATED RECEPTORS PARS | Genes involved in Thrombin signalling through proteinase activated receptors (PARs) |
| 0.4 | 10.0 | REACTOME KINESINS | Genes involved in Kinesins |
| 0.4 | 12.8 | REACTOME INTERACTION BETWEEN L1 AND ANKYRINS | Genes involved in Interaction between L1 and Ankyrins |
| 0.4 | 3.7 | REACTOME COPI MEDIATED TRANSPORT | Genes involved in COPI Mediated Transport |
| 0.4 | 8.5 | REACTOME FORMATION OF ATP BY CHEMIOSMOTIC COUPLING | Genes involved in Formation of ATP by chemiosmotic coupling |
| 0.3 | 9.3 | REACTOME PLATELET CALCIUM HOMEOSTASIS | Genes involved in Platelet calcium homeostasis |
| 0.3 | 7.2 | REACTOME SYNTHESIS OF VERY LONG CHAIN FATTY ACYL COAS | Genes involved in Synthesis of very long-chain fatty acyl-CoAs |
| 0.3 | 34.6 | REACTOME MHC CLASS II ANTIGEN PRESENTATION | Genes involved in MHC class II antigen presentation |
| 0.3 | 6.1 | REACTOME ACTIVATION OF KAINATE RECEPTORS UPON GLUTAMATE BINDING | Genes involved in Activation of Kainate Receptors upon glutamate binding |
| 0.3 | 1.3 | REACTOME ADENYLATE CYCLASE ACTIVATING PATHWAY | Genes involved in Adenylate cyclase activating pathway |
| 0.3 | 11.4 | REACTOME CYTOSOLIC TRNA AMINOACYLATION | Genes involved in Cytosolic tRNA aminoacylation |
| 0.3 | 10.3 | REACTOME OXYGEN DEPENDENT PROLINE HYDROXYLATION OF HYPOXIA INDUCIBLE FACTOR ALPHA | Genes involved in Oxygen-dependent Proline Hydroxylation of Hypoxia-inducible Factor Alpha |
| 0.3 | 8.3 | REACTOME CRMPS IN SEMA3A SIGNALING | Genes involved in CRMPs in Sema3A signaling |
| 0.3 | 3.6 | REACTOME NOTCH HLH TRANSCRIPTION PATHWAY | Genes involved in Notch-HLH transcription pathway |
| 0.3 | 5.1 | REACTOME CLASS C 3 METABOTROPIC GLUTAMATE PHEROMONE RECEPTORS | Genes involved in Class C/3 (Metabotropic glutamate/pheromone receptors) |
| 0.3 | 1.1 | REACTOME ARMS MEDIATED ACTIVATION | Genes involved in ARMS-mediated activation |
| 0.3 | 5.5 | REACTOME ASSOCIATION OF TRIC CCT WITH TARGET PROTEINS DURING BIOSYNTHESIS | Genes involved in Association of TriC/CCT with target proteins during biosynthesis |
| 0.3 | 11.8 | REACTOME GLYCOLYSIS | Genes involved in Glycolysis |
| 0.3 | 10.1 | REACTOME RAP1 SIGNALLING | Genes involved in Rap1 signalling |
| 0.3 | 7.9 | REACTOME SYNTHESIS OF PA | Genes involved in Synthesis of PA |
| 0.2 | 10.1 | REACTOME IL1 SIGNALING | Genes involved in Interleukin-1 signaling |
| 0.2 | 4.3 | REACTOME ENDOSOMAL SORTING COMPLEX REQUIRED FOR TRANSPORT ESCRT | Genes involved in Endosomal Sorting Complex Required For Transport (ESCRT) |
| 0.2 | 4.9 | REACTOME PURINE SALVAGE | Genes involved in Purine salvage |
| 0.2 | 1.7 | REACTOME CDC6 ASSOCIATION WITH THE ORC ORIGIN COMPLEX | Genes involved in CDC6 association with the ORC:origin complex |
| 0.2 | 3.4 | REACTOME MITOCHONDRIAL FATTY ACID BETA OXIDATION | Genes involved in Mitochondrial Fatty Acid Beta-Oxidation |
| 0.2 | 6.7 | REACTOME NEGATIVE REGULATORS OF RIG I MDA5 SIGNALING | Genes involved in Negative regulators of RIG-I/MDA5 signaling |
| 0.2 | 39.6 | REACTOME ANTIGEN PROCESSING UBIQUITINATION PROTEASOME DEGRADATION | Genes involved in Antigen processing: Ubiquitination & Proteasome degradation |
| 0.2 | 7.3 | REACTOME ION TRANSPORT BY P TYPE ATPASES | Genes involved in Ion transport by P-type ATPases |
| 0.2 | 6.6 | REACTOME LIGAND GATED ION CHANNEL TRANSPORT | Genes involved in Ligand-gated ion channel transport |
| 0.2 | 0.8 | REACTOME TRANSFERRIN ENDOCYTOSIS AND RECYCLING | Genes involved in Transferrin endocytosis and recycling |
| 0.2 | 3.2 | REACTOME NEPHRIN INTERACTIONS | Genes involved in Nephrin interactions |
| 0.2 | 8.1 | REACTOME GLUCOSE METABOLISM | Genes involved in Glucose metabolism |
| 0.2 | 8.1 | REACTOME NITRIC OXIDE STIMULATES GUANYLATE CYCLASE | Genes involved in Nitric oxide stimulates guanylate cyclase |
| 0.2 | 1.1 | REACTOME GAP JUNCTION DEGRADATION | Genes involved in Gap junction degradation |
| 0.1 | 7.2 | REACTOME GOLGI ASSOCIATED VESICLE BIOGENESIS | Genes involved in Golgi Associated Vesicle Biogenesis |
| 0.1 | 6.6 | REACTOME G1 PHASE | Genes involved in G1 Phase |
| 0.1 | 1.7 | REACTOME THE NLRP3 INFLAMMASOME | Genes involved in The NLRP3 inflammasome |
| 0.1 | 1.8 | REACTOME SIGNALLING TO P38 VIA RIT AND RIN | Genes involved in Signalling to p38 via RIT and RIN |
| 0.1 | 2.6 | REACTOME REGULATION OF RHEB GTPASE ACTIVITY BY AMPK | Genes involved in Regulation of Rheb GTPase activity by AMPK |
| 0.1 | 0.1 | REACTOME SEMA3A PLEXIN REPULSION SIGNALING BY INHIBITING INTEGRIN ADHESION | Genes involved in SEMA3A-Plexin repulsion signaling by inhibiting Integrin adhesion |
| 0.1 | 11.0 | REACTOME RESPIRATORY ELECTRON TRANSPORT | Genes involved in Respiratory electron transport |
| 0.1 | 1.5 | REACTOME SEMA3A PAK DEPENDENT AXON REPULSION | Genes involved in Sema3A PAK dependent Axon repulsion |
| 0.1 | 5.4 | REACTOME GLYCOSPHINGOLIPID METABOLISM | Genes involved in Glycosphingolipid metabolism |
| 0.1 | 2.1 | REACTOME PURINE RIBONUCLEOSIDE MONOPHOSPHATE BIOSYNTHESIS | Genes involved in Purine ribonucleoside monophosphate biosynthesis |
| 0.1 | 1.9 | REACTOME APOPTOTIC CLEAVAGE OF CELL ADHESION PROTEINS | Genes involved in Apoptotic cleavage of cell adhesion proteins |
| 0.1 | 7.0 | REACTOME NCAM1 INTERACTIONS | Genes involved in NCAM1 interactions |
| 0.1 | 2.2 | REACTOME INSULIN SYNTHESIS AND PROCESSING | Genes involved in Insulin Synthesis and Processing |
| 0.1 | 2.0 | REACTOME SYNTHESIS OF PIPS AT THE GOLGI MEMBRANE | Genes involved in Synthesis of PIPs at the Golgi membrane |
| 0.1 | 2.1 | REACTOME SYNTHESIS OF PE | Genes involved in Synthesis of PE |
| 0.1 | 4.7 | REACTOME REGULATION OF INSULIN SECRETION | Genes involved in Regulation of Insulin Secretion |
| 0.1 | 1.3 | REACTOME PLATELET SENSITIZATION BY LDL | Genes involved in Platelet sensitization by LDL |
| 0.1 | 0.5 | REACTOME ADP SIGNALLING THROUGH P2RY1 | Genes involved in ADP signalling through P2Y purinoceptor 1 |
| 0.1 | 0.8 | REACTOME ETHANOL OXIDATION | Genes involved in Ethanol oxidation |
| 0.1 | 1.2 | REACTOME IRON UPTAKE AND TRANSPORT | Genes involved in Iron uptake and transport |
| 0.1 | 4.8 | REACTOME MITOCHONDRIAL PROTEIN IMPORT | Genes involved in Mitochondrial Protein Import |
| 0.1 | 1.3 | REACTOME REGULATION OF GENE EXPRESSION IN BETA CELLS | Genes involved in Regulation of gene expression in beta cells |
| 0.1 | 1.4 | REACTOME PRE NOTCH PROCESSING IN GOLGI | Genes involved in Pre-NOTCH Processing in Golgi |
| 0.1 | 17.4 | REACTOME G ALPHA I SIGNALLING EVENTS | Genes involved in G alpha (i) signalling events |
| 0.1 | 3.1 | REACTOME SYNTHESIS AND INTERCONVERSION OF NUCLEOTIDE DI AND TRIPHOSPHATES | Genes involved in Synthesis and interconversion of nucleotide di- and triphosphates |
| 0.1 | 1.5 | REACTOME REGULATION OF PYRUVATE DEHYDROGENASE PDH COMPLEX | Genes involved in Regulation of pyruvate dehydrogenase (PDH) complex |
| 0.1 | 2.1 | REACTOME NONSENSE MEDIATED DECAY ENHANCED BY THE EXON JUNCTION COMPLEX | Genes involved in Nonsense Mediated Decay Enhanced by the Exon Junction Complex |
| 0.1 | 2.7 | REACTOME SPHINGOLIPID DE NOVO BIOSYNTHESIS | Genes involved in Sphingolipid de novo biosynthesis |
| 0.1 | 1.8 | REACTOME TRANSPORT OF ORGANIC ANIONS | Genes involved in Transport of organic anions |
| 0.1 | 1.2 | REACTOME SYNTHESIS OF SUBSTRATES IN N GLYCAN BIOSYTHESIS | Genes involved in Synthesis of substrates in N-glycan biosythesis |
| 0.1 | 1.5 | REACTOME SYNTHESIS OF BILE ACIDS AND BILE SALTS VIA 7ALPHA HYDROXYCHOLESTEROL | Genes involved in Synthesis of bile acids and bile salts via 7alpha-hydroxycholesterol |
| 0.1 | 5.4 | REACTOME MITOTIC PROMETAPHASE | Genes involved in Mitotic Prometaphase |
| 0.1 | 1.0 | REACTOME SLBP DEPENDENT PROCESSING OF REPLICATION DEPENDENT HISTONE PRE MRNAS | Genes involved in SLBP Dependent Processing of Replication-Dependent Histone Pre-mRNAs |
| 0.1 | 1.5 | REACTOME SEMA4D INDUCED CELL MIGRATION AND GROWTH CONE COLLAPSE | Genes involved in Sema4D induced cell migration and growth-cone collapse |
| 0.1 | 0.4 | REACTOME UNBLOCKING OF NMDA RECEPTOR GLUTAMATE BINDING AND ACTIVATION | Genes involved in Unblocking of NMDA receptor, glutamate binding and activation |
| 0.1 | 0.9 | REACTOME DOWNREGULATION OF SMAD2 3 SMAD4 TRANSCRIPTIONAL ACTIVITY | Genes involved in Downregulation of SMAD2/3:SMAD4 transcriptional activity |
| 0.1 | 0.6 | REACTOME ROLE OF DCC IN REGULATING APOPTOSIS | Genes involved in Role of DCC in regulating apoptosis |
| 0.0 | 2.1 | REACTOME MRNA SPLICING MINOR PATHWAY | Genes involved in mRNA Splicing - Minor Pathway |
| 0.0 | 0.3 | REACTOME PKA MEDIATED PHOSPHORYLATION OF CREB | Genes involved in PKA-mediated phosphorylation of CREB |
| 0.0 | 0.4 | REACTOME BIOSYNTHESIS OF THE N GLYCAN PRECURSOR DOLICHOL LIPID LINKED OLIGOSACCHARIDE LLO AND TRANSFER TO A NASCENT PROTEIN | Genes involved in Biosynthesis of the N-glycan precursor (dolichol lipid-linked oligosaccharide, LLO) and transfer to a nascent protein |
| 0.0 | 2.0 | REACTOME BMAL1 CLOCK NPAS2 ACTIVATES CIRCADIAN EXPRESSION | Genes involved in BMAL1:CLOCK/NPAS2 Activates Circadian Expression |
| 0.0 | 1.0 | REACTOME METABOLISM OF POLYAMINES | Genes involved in Metabolism of polyamines |
| 0.0 | 1.1 | REACTOME SIGNALING BY NODAL | Genes involved in Signaling by NODAL |
| 0.0 | 0.6 | REACTOME GLUCAGON TYPE LIGAND RECEPTORS | Genes involved in Glucagon-type ligand receptors |
| 0.0 | 1.8 | REACTOME PACKAGING OF TELOMERE ENDS | Genes involved in Packaging Of Telomere Ends |
| 0.0 | 3.8 | REACTOME SIGNALING BY RHO GTPASES | Genes involved in Signaling by Rho GTPases |
| 0.0 | 0.5 | REACTOME FGFR2C LIGAND BINDING AND ACTIVATION | Genes involved in FGFR2c ligand binding and activation |
| 0.0 | 0.4 | REACTOME ACYL CHAIN REMODELLING OF PE | Genes involved in Acyl chain remodelling of PE |
| 0.0 | 0.3 | REACTOME PECAM1 INTERACTIONS | Genes involved in PECAM1 interactions |
| 0.0 | 0.2 | REACTOME DOWNSTREAM SIGNALING EVENTS OF B CELL RECEPTOR BCR | Genes involved in Downstream Signaling Events Of B Cell Receptor (BCR) |
| 0.0 | 1.0 | REACTOME GLUTATHIONE CONJUGATION | Genes involved in Glutathione conjugation |
| 0.0 | 2.2 | REACTOME INTERFERON ALPHA BETA SIGNALING | Genes involved in Interferon alpha/beta signaling |
| 0.0 | 0.4 | REACTOME MEIOSIS | Genes involved in Meiosis |
| 0.0 | 0.8 | REACTOME ANTIVIRAL MECHANISM BY IFN STIMULATED GENES | Genes involved in Antiviral mechanism by IFN-stimulated genes |
| 0.0 | 0.2 | REACTOME REGULATION OF AMPK ACTIVITY VIA LKB1 | Genes involved in Regulation of AMPK activity via LKB1 |
| 0.0 | 0.6 | REACTOME AMINE DERIVED HORMONES | Genes involved in Amine-derived hormones |
| 0.0 | 0.6 | REACTOME KERATAN SULFATE BIOSYNTHESIS | Genes involved in Keratan sulfate biosynthesis |
| 0.0 | 0.8 | REACTOME PI METABOLISM | Genes involved in PI Metabolism |
| 0.0 | 1.4 | REACTOME PEPTIDE LIGAND BINDING RECEPTORS | Genes involved in Peptide ligand-binding receptors |
| 0.0 | 0.4 | REACTOME EXTRINSIC PATHWAY FOR APOPTOSIS | Genes involved in Extrinsic Pathway for Apoptosis |
| 0.0 | 0.1 | REACTOME CREATION OF C4 AND C2 ACTIVATORS | Genes involved in Creation of C4 and C2 activators |
| 0.0 | 0.4 | REACTOME GLUCOSE TRANSPORT | Genes involved in Glucose transport |
| 0.0 | 0.0 | REACTOME TRAF6 MEDIATED IRF7 ACTIVATION IN TLR7 8 OR 9 SIGNALING | Genes involved in TRAF6 mediated IRF7 activation in TLR7/8 or 9 signaling |