Project
GNF SymAtlas + NCI-60 cancer cell lines, comparison of cancers vs non-cancers, human (Su, 2004; Ross, 2000)
Navigation
Downloads
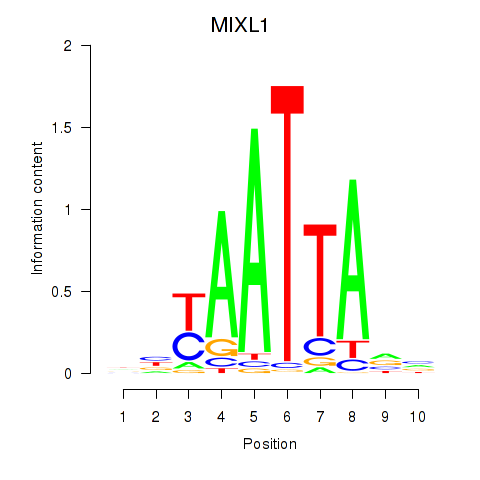
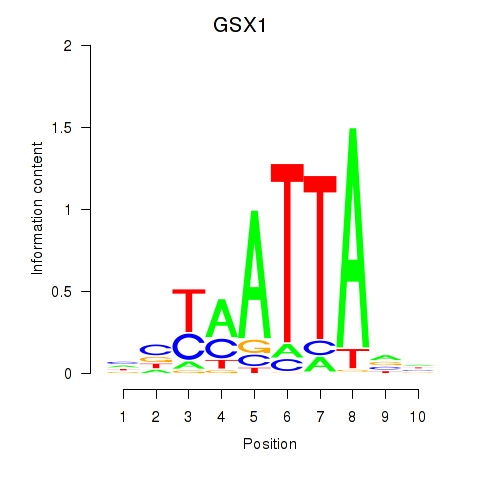
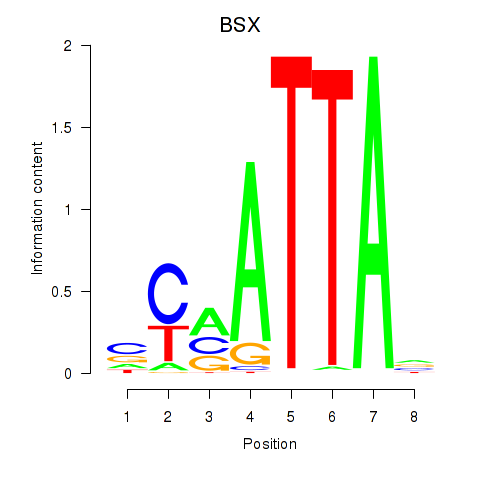
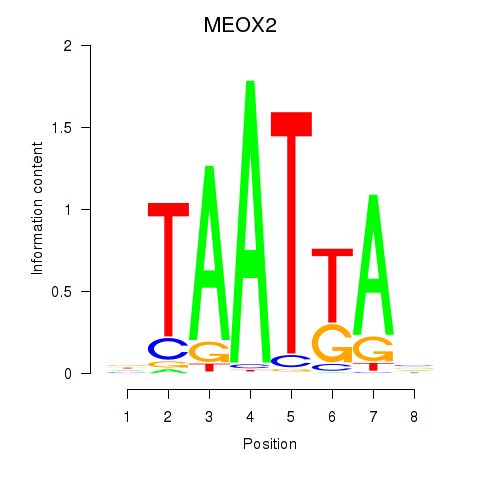
Results for MIXL1_GSX1_BSX_MEOX2_LHX4
Z-value: 0.93
Motif logo
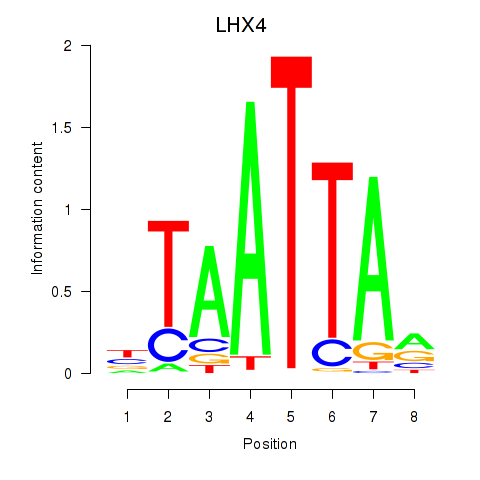
Transcription factors associated with MIXL1_GSX1_BSX_MEOX2_LHX4
| Gene Symbol | Gene ID | Gene Info |
|---|---|---|
|
MIXL1
|
ENSG00000185155.7 | Mix paired-like homeobox |
|
GSX1
|
ENSG00000169840.4 | GS homeobox 1 |
|
BSX
|
ENSG00000188909.4 | brain specific homeobox |
|
MEOX2
|
ENSG00000106511.5 | mesenchyme homeobox 2 |
|
LHX4
|
ENSG00000121454.4 | LIM homeobox 4 |
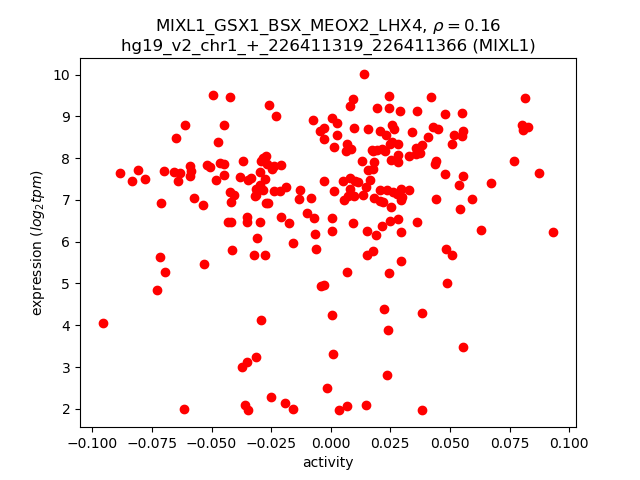
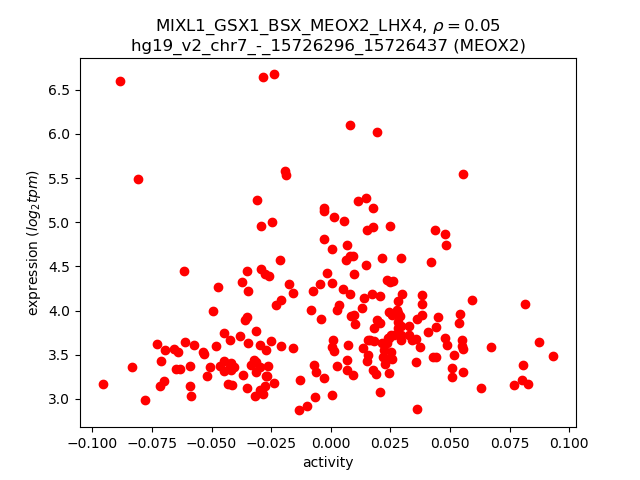
Activity-expression correlation:
| Gene | Promoter | Pearson corr. coef. | P-value | Plot |
|---|---|---|---|---|
| MIXL1 | hg19_v2_chr1_+_226411319_226411366 | 0.16 | 1.7e-02 | Click! |
| MEOX2 | hg19_v2_chr7_-_15726296_15726437 | 0.05 | 4.9e-01 | Click! |
Activity profile of MIXL1_GSX1_BSX_MEOX2_LHX4 motif
Sorted Z-values of MIXL1_GSX1_BSX_MEOX2_LHX4 motif
| Promoter | Log-likelihood | Transcript | Gene | Gene Info |
|---|---|---|---|---|
| chrX_-_13835147 | 34.84 |
ENST00000493677.1
ENST00000355135.2 |
GPM6B
|
glycoprotein M6B |
| chr11_-_117748138 | 34.05 |
ENST00000527717.1
|
FXYD6
|
FXYD domain containing ion transport regulator 6 |
| chr11_-_117747607 | 32.29 |
ENST00000540359.1
ENST00000539526.1 |
FXYD6
|
FXYD domain containing ion transport regulator 6 |
| chr11_-_117747434 | 31.51 |
ENST00000529335.2
ENST00000530956.1 ENST00000260282.4 |
FXYD6
|
FXYD domain containing ion transport regulator 6 |
| chr2_+_90248739 | 22.24 |
ENST00000468879.1
|
IGKV1D-43
|
immunoglobulin kappa variable 1D-43 |
| chr2_+_68962014 | 17.73 |
ENST00000467265.1
|
ARHGAP25
|
Rho GTPase activating protein 25 |
| chr16_-_4852915 | 16.49 |
ENST00000322048.7
|
ROGDI
|
rogdi homolog (Drosophila) |
| chr5_+_66300446 | 16.06 |
ENST00000261569.7
|
MAST4
|
microtubule associated serine/threonine kinase family member 4 |
| chr18_+_32556892 | 15.56 |
ENST00000591734.1
ENST00000413393.1 ENST00000589180.1 ENST00000587359.1 |
MAPRE2
|
microtubule-associated protein, RP/EB family, member 2 |
| chr3_-_18480260 | 15.50 |
ENST00000454909.2
|
SATB1
|
SATB homeobox 1 |
| chr2_+_68961934 | 15.41 |
ENST00000409202.3
|
ARHGAP25
|
Rho GTPase activating protein 25 |
| chr13_-_46716969 | 15.14 |
ENST00000435666.2
|
LCP1
|
lymphocyte cytosolic protein 1 (L-plastin) |
| chr11_-_111794446 | 15.12 |
ENST00000527950.1
|
CRYAB
|
crystallin, alpha B |
| chr2_+_68961905 | 15.06 |
ENST00000295381.3
|
ARHGAP25
|
Rho GTPase activating protein 25 |
| chr12_-_6233828 | 14.88 |
ENST00000572068.1
ENST00000261405.5 |
VWF
|
von Willebrand factor |
| chr4_+_40198527 | 14.01 |
ENST00000381799.5
|
RHOH
|
ras homolog family member H |
| chr6_-_32908765 | 13.94 |
ENST00000416244.2
|
HLA-DMB
|
major histocompatibility complex, class II, DM beta |
| chr6_-_32908792 | 13.78 |
ENST00000418107.2
|
HLA-DMB
|
major histocompatibility complex, class II, DM beta |
| chr2_-_158300556 | 12.38 |
ENST00000264192.3
|
CYTIP
|
cytohesin 1 interacting protein |
| chr11_-_33913708 | 12.38 |
ENST00000257818.2
|
LMO2
|
LIM domain only 2 (rhombotin-like 1) |
| chr12_+_81110684 | 12.15 |
ENST00000228644.3
|
MYF5
|
myogenic factor 5 |
| chr2_-_89340242 | 11.85 |
ENST00000480492.1
|
IGKV1-12
|
immunoglobulin kappa variable 1-12 |
| chr3_+_111718036 | 11.47 |
ENST00000455401.2
|
TAGLN3
|
transgelin 3 |
| chr18_+_71815743 | 10.67 |
ENST00000169551.6
ENST00000580087.1 |
TIMM21
|
translocase of inner mitochondrial membrane 21 homolog (yeast) |
| chr3_+_111717600 | 10.60 |
ENST00000273368.4
|
TAGLN3
|
transgelin 3 |
| chr3_+_111718173 | 10.51 |
ENST00000494932.1
|
TAGLN3
|
transgelin 3 |
| chr5_+_156696362 | 10.45 |
ENST00000377576.3
|
CYFIP2
|
cytoplasmic FMR1 interacting protein 2 |
| chrX_+_13671225 | 10.39 |
ENST00000545566.1
ENST00000544987.1 ENST00000314720.4 |
TCEANC
|
transcription elongation factor A (SII) N-terminal and central domain containing |
| chr2_+_90273679 | 10.28 |
ENST00000423080.2
|
IGKV3D-7
|
immunoglobulin kappa variable 3D-7 |
| chr3_-_39321512 | 10.14 |
ENST00000399220.2
|
CX3CR1
|
chemokine (C-X3-C motif) receptor 1 |
| chr2_-_136288113 | 10.05 |
ENST00000401392.1
|
ZRANB3
|
zinc finger, RAN-binding domain containing 3 |
| chr13_-_88323218 | 10.01 |
ENST00000436290.2
ENST00000453832.2 ENST00000606590.1 |
MIR4500HG
|
MIR4500 host gene (non-protein coding) |
| chr3_+_35722487 | 9.95 |
ENST00000441454.1
|
ARPP21
|
cAMP-regulated phosphoprotein, 21kDa |
| chr3_+_111717511 | 9.91 |
ENST00000478951.1
ENST00000393917.2 |
TAGLN3
|
transgelin 3 |
| chr1_+_111415757 | 9.89 |
ENST00000429072.2
ENST00000271324.5 |
CD53
|
CD53 molecule |
| chr2_+_90211643 | 9.81 |
ENST00000390277.2
|
IGKV3D-11
|
immunoglobulin kappa variable 3D-11 |
| chr8_-_27468842 | 9.58 |
ENST00000523500.1
|
CLU
|
clusterin |
| chr5_-_24645078 | 9.51 |
ENST00000264463.4
|
CDH10
|
cadherin 10, type 2 (T2-cadherin) |
| chr11_-_129062093 | 9.35 |
ENST00000310343.9
|
ARHGAP32
|
Rho GTPase activating protein 32 |
| chr6_+_151042224 | 9.16 |
ENST00000358517.2
|
PLEKHG1
|
pleckstrin homology domain containing, family G (with RhoGef domain) member 1 |
| chr1_+_174844645 | 9.14 |
ENST00000486220.1
|
RABGAP1L
|
RAB GTPase activating protein 1-like |
| chr4_-_46911248 | 8.90 |
ENST00000355591.3
ENST00000505102.1 |
COX7B2
|
cytochrome c oxidase subunit VIIb2 |
| chr6_-_152639479 | 8.76 |
ENST00000356820.4
|
SYNE1
|
spectrin repeat containing, nuclear envelope 1 |
| chr19_+_50016610 | 8.60 |
ENST00000596975.1
|
FCGRT
|
Fc fragment of IgG, receptor, transporter, alpha |
| chr1_-_92952433 | 8.57 |
ENST00000294702.5
|
GFI1
|
growth factor independent 1 transcription repressor |
| chr4_-_87028478 | 8.56 |
ENST00000515400.1
ENST00000395157.3 |
MAPK10
|
mitogen-activated protein kinase 10 |
| chr8_+_28748765 | 8.51 |
ENST00000355231.5
|
HMBOX1
|
homeobox containing 1 |
| chr3_+_115342349 | 8.35 |
ENST00000393780.3
|
GAP43
|
growth associated protein 43 |
| chr1_-_150738261 | 8.33 |
ENST00000448301.2
ENST00000368985.3 |
CTSS
|
cathepsin S |
| chr11_+_121447469 | 8.27 |
ENST00000532694.1
ENST00000534286.1 |
SORL1
|
sortilin-related receptor, L(DLR class) A repeats containing |
| chr3_+_108541545 | 8.22 |
ENST00000295756.6
|
TRAT1
|
T cell receptor associated transmembrane adaptor 1 |
| chr5_+_36608422 | 8.21 |
ENST00000381918.3
|
SLC1A3
|
solute carrier family 1 (glial high affinity glutamate transporter), member 3 |
| chr2_-_208031943 | 8.19 |
ENST00000421199.1
ENST00000457962.1 |
KLF7
|
Kruppel-like factor 7 (ubiquitous) |
| chr2_+_196313239 | 8.12 |
ENST00000413290.1
|
AC064834.1
|
AC064834.1 |
| chr11_-_5255861 | 8.11 |
ENST00000380299.3
|
HBD
|
hemoglobin, delta |
| chr3_+_108541608 | 8.06 |
ENST00000426646.1
|
TRAT1
|
T cell receptor associated transmembrane adaptor 1 |
| chrX_-_19988382 | 7.97 |
ENST00000356980.3
ENST00000379687.3 ENST00000379682.4 |
CXorf23
|
chromosome X open reading frame 23 |
| chr4_-_120243545 | 7.90 |
ENST00000274024.3
|
FABP2
|
fatty acid binding protein 2, intestinal |
| chr11_-_104972158 | 7.80 |
ENST00000598974.1
ENST00000593315.1 ENST00000594519.1 ENST00000415981.2 ENST00000525374.1 ENST00000375707.1 |
CASP1
CARD16
CARD17
|
caspase 1, apoptosis-related cysteine peptidase caspase recruitment domain family, member 16 caspase recruitment domain family, member 17 |
| chr12_-_16761007 | 7.64 |
ENST00000354662.1
ENST00000441439.2 |
LMO3
|
LIM domain only 3 (rhombotin-like 2) |
| chr10_-_71169031 | 7.63 |
ENST00000373307.1
|
TACR2
|
tachykinin receptor 2 |
| chr4_-_170897045 | 7.61 |
ENST00000508313.1
|
RP11-205M3.3
|
RP11-205M3.3 |
| chr1_-_152386732 | 7.52 |
ENST00000271835.3
|
CRNN
|
cornulin |
| chr6_+_31583761 | 7.42 |
ENST00000376049.4
|
AIF1
|
allograft inflammatory factor 1 |
| chr12_-_112123524 | 7.41 |
ENST00000327551.6
|
BRAP
|
BRCA1 associated protein |
| chr2_+_103035102 | 7.26 |
ENST00000264260.2
|
IL18RAP
|
interleukin 18 receptor accessory protein |
| chr13_-_99910673 | 7.25 |
ENST00000397473.2
ENST00000397470.2 |
GPR18
|
G protein-coupled receptor 18 |
| chr18_+_32558208 | 7.06 |
ENST00000436190.2
|
MAPRE2
|
microtubule-associated protein, RP/EB family, member 2 |
| chr14_-_101295407 | 7.04 |
ENST00000596284.1
|
AL117190.2
|
AL117190.2 |
| chr3_+_35721106 | 7.00 |
ENST00000474696.1
ENST00000412048.1 ENST00000396482.2 ENST00000432682.1 |
ARPP21
|
cAMP-regulated phosphoprotein, 21kDa |
| chr1_+_198608146 | 6.86 |
ENST00000367376.2
ENST00000352140.3 ENST00000594404.1 ENST00000598951.1 ENST00000530727.1 ENST00000442510.2 ENST00000367367.4 ENST00000348564.6 ENST00000367364.1 ENST00000413409.2 |
PTPRC
|
protein tyrosine phosphatase, receptor type, C |
| chr7_+_50348268 | 6.79 |
ENST00000438033.1
ENST00000439701.1 |
IKZF1
|
IKAROS family zinc finger 1 (Ikaros) |
| chr11_-_108093329 | 6.73 |
ENST00000278612.8
|
NPAT
|
nuclear protein, ataxia-telangiectasia locus |
| chr2_+_169926047 | 6.70 |
ENST00000428522.1
ENST00000450153.1 ENST00000421653.1 |
DHRS9
|
dehydrogenase/reductase (SDR family) member 9 |
| chr21_-_42219065 | 6.55 |
ENST00000400454.1
|
DSCAM
|
Down syndrome cell adhesion molecule |
| chr12_-_16759711 | 6.47 |
ENST00000447609.1
|
LMO3
|
LIM domain only 3 (rhombotin-like 2) |
| chr12_+_26348246 | 6.45 |
ENST00000422622.2
|
SSPN
|
sarcospan |
| chr2_-_89292422 | 6.43 |
ENST00000495489.1
|
IGKV1-8
|
immunoglobulin kappa variable 1-8 |
| chr2_-_89399845 | 6.35 |
ENST00000479981.1
|
IGKV1-16
|
immunoglobulin kappa variable 1-16 |
| chrX_-_13835461 | 6.35 |
ENST00000316715.4
ENST00000356942.5 |
GPM6B
|
glycoprotein M6B |
| chr12_-_91546926 | 6.35 |
ENST00000550758.1
|
DCN
|
decorin |
| chr20_+_45947246 | 6.33 |
ENST00000599904.1
|
AL031666.2
|
HCG2018772; Uncharacterized protein; cDNA FLJ31609 fis, clone NT2RI2002852 |
| chr16_+_8768422 | 6.32 |
ENST00000268251.8
ENST00000564714.1 |
ABAT
|
4-aminobutyrate aminotransferase |
| chr1_+_101003687 | 6.28 |
ENST00000315033.4
|
GPR88
|
G protein-coupled receptor 88 |
| chrX_-_73512411 | 6.25 |
ENST00000602576.1
ENST00000429124.1 |
FTX
|
FTX transcript, XIST regulator (non-protein coding) |
| chr14_+_61654271 | 6.17 |
ENST00000555185.1
ENST00000557294.1 ENST00000556778.1 |
PRKCH
|
protein kinase C, eta |
| chr8_+_117950422 | 6.11 |
ENST00000378279.3
|
AARD
|
alanine and arginine rich domain containing protein |
| chr12_-_114841703 | 6.01 |
ENST00000526441.1
|
TBX5
|
T-box 5 |
| chr8_-_90769422 | 5.93 |
ENST00000524190.1
ENST00000523859.1 |
RP11-37B2.1
|
RP11-37B2.1 |
| chrX_-_92928557 | 5.91 |
ENST00000373079.3
ENST00000475430.2 |
NAP1L3
|
nucleosome assembly protein 1-like 3 |
| chr4_+_88754113 | 5.89 |
ENST00000560249.1
ENST00000540395.1 ENST00000511670.1 ENST00000361056.3 |
MEPE
|
matrix extracellular phosphoglycoprotein |
| chr6_-_39693111 | 5.84 |
ENST00000373215.3
ENST00000538893.1 ENST00000287152.7 ENST00000373216.3 |
KIF6
|
kinesin family member 6 |
| chr12_-_15103621 | 5.76 |
ENST00000536592.1
|
ARHGDIB
|
Rho GDP dissociation inhibitor (GDI) beta |
| chr11_+_28129795 | 5.68 |
ENST00000406787.3
ENST00000342303.5 ENST00000403099.1 ENST00000407364.3 |
METTL15
|
methyltransferase like 15 |
| chr2_-_89327228 | 5.68 |
ENST00000483158.1
|
IGKV3-11
|
immunoglobulin kappa variable 3-11 |
| chr14_+_22977587 | 5.65 |
ENST00000390504.1
|
TRAJ33
|
T cell receptor alpha joining 33 |
| chr18_+_29027696 | 5.59 |
ENST00000257189.4
|
DSG3
|
desmoglein 3 |
| chr18_-_5396271 | 5.58 |
ENST00000579951.1
|
EPB41L3
|
erythrocyte membrane protein band 4.1-like 3 |
| chr10_+_18549645 | 5.53 |
ENST00000396576.2
|
CACNB2
|
calcium channel, voltage-dependent, beta 2 subunit |
| chr16_+_22501658 | 5.49 |
ENST00000415833.2
|
NPIPB5
|
nuclear pore complex interacting protein family, member B5 |
| chr13_-_41593425 | 5.48 |
ENST00000239882.3
|
ELF1
|
E74-like factor 1 (ets domain transcription factor) |
| chr6_-_52705641 | 5.45 |
ENST00000370989.2
|
GSTA5
|
glutathione S-transferase alpha 5 |
| chrX_+_55478538 | 5.37 |
ENST00000342972.1
|
MAGEH1
|
melanoma antigen family H, 1 |
| chr5_-_39219641 | 5.37 |
ENST00000509072.1
ENST00000504542.1 ENST00000505428.1 ENST00000506557.1 |
FYB
|
FYN binding protein |
| chr1_+_180601139 | 5.35 |
ENST00000367590.4
ENST00000367589.3 |
XPR1
|
xenotropic and polytropic retrovirus receptor 1 |
| chr7_+_97361218 | 5.33 |
ENST00000319273.5
|
TAC1
|
tachykinin, precursor 1 |
| chr8_-_86253888 | 5.27 |
ENST00000522389.1
ENST00000432364.2 ENST00000517618.1 |
CA1
|
carbonic anhydrase I |
| chr13_-_36788718 | 5.26 |
ENST00000317764.6
ENST00000379881.3 |
SOHLH2
|
spermatogenesis and oogenesis specific basic helix-loop-helix 2 |
| chr14_+_22337014 | 5.19 |
ENST00000390436.2
|
TRAV13-1
|
T cell receptor alpha variable 13-1 |
| chr2_+_113763031 | 5.09 |
ENST00000259211.6
|
IL36A
|
interleukin 36, alpha |
| chr1_+_84609944 | 5.09 |
ENST00000370685.3
|
PRKACB
|
protein kinase, cAMP-dependent, catalytic, beta |
| chr11_-_128894053 | 5.02 |
ENST00000392657.3
|
ARHGAP32
|
Rho GTPase activating protein 32 |
| chr7_+_149535455 | 4.95 |
ENST00000223210.4
ENST00000460379.1 |
ZNF862
|
zinc finger protein 862 |
| chr8_-_27469196 | 4.92 |
ENST00000546343.1
ENST00000560566.1 |
CLU
|
clusterin |
| chrM_+_12331 | 4.92 |
ENST00000361567.2
|
MT-ND5
|
mitochondrially encoded NADH dehydrogenase 5 |
| chrX_-_73512177 | 4.89 |
ENST00000603672.1
ENST00000418855.1 |
FTX
|
FTX transcript, XIST regulator (non-protein coding) |
| chr12_+_25205568 | 4.84 |
ENST00000548766.1
ENST00000556887.1 |
LRMP
|
lymphoid-restricted membrane protein |
| chr6_-_25042231 | 4.83 |
ENST00000510784.2
|
FAM65B
|
family with sequence similarity 65, member B |
| chr19_-_7968427 | 4.81 |
ENST00000539278.1
|
AC010336.1
|
Uncharacterized protein |
| chrX_-_138724994 | 4.79 |
ENST00000536274.1
|
MCF2
|
MCF.2 cell line derived transforming sequence |
| chr1_-_25291475 | 4.69 |
ENST00000338888.3
ENST00000399916.1 |
RUNX3
|
runt-related transcription factor 3 |
| chr4_-_89205879 | 4.67 |
ENST00000608933.1
ENST00000315194.4 ENST00000514204.1 |
PPM1K
|
protein phosphatase, Mg2+/Mn2+ dependent, 1K |
| chr10_-_50970322 | 4.66 |
ENST00000374103.4
|
OGDHL
|
oxoglutarate dehydrogenase-like |
| chr16_-_66584059 | 4.62 |
ENST00000417693.3
ENST00000544898.1 ENST00000569718.1 ENST00000527284.1 ENST00000299697.7 ENST00000451102.2 |
TK2
|
thymidine kinase 2, mitochondrial |
| chr1_+_117963209 | 4.61 |
ENST00000449370.2
|
MAN1A2
|
mannosidase, alpha, class 1A, member 2 |
| chr17_+_45000483 | 4.59 |
ENST00000576910.2
ENST00000439730.2 ENST00000393456.2 ENST00000415811.2 ENST00000575949.1 ENST00000225567.4 ENST00000572403.1 ENST00000570879.1 |
GOSR2
|
golgi SNAP receptor complex member 2 |
| chr7_+_100136811 | 4.56 |
ENST00000300176.4
ENST00000262935.4 |
AGFG2
|
ArfGAP with FG repeats 2 |
| chr1_+_84630645 | 4.53 |
ENST00000394839.2
|
PRKACB
|
protein kinase, cAMP-dependent, catalytic, beta |
| chr4_-_57547870 | 4.52 |
ENST00000381260.3
ENST00000420433.1 ENST00000554144.1 ENST00000557328.1 |
HOPX
|
HOP homeobox |
| chr1_+_36789335 | 4.46 |
ENST00000373137.2
|
RP11-268J15.5
|
RP11-268J15.5 |
| chr6_-_32557610 | 4.45 |
ENST00000360004.5
|
HLA-DRB1
|
major histocompatibility complex, class II, DR beta 1 |
| chr14_-_106926724 | 4.44 |
ENST00000434710.1
|
IGHV3-43
|
immunoglobulin heavy variable 3-43 |
| chr4_-_57524061 | 4.41 |
ENST00000508121.1
|
HOPX
|
HOP homeobox |
| chr14_+_22931924 | 4.41 |
ENST00000390477.2
|
TRDC
|
T cell receptor delta constant |
| chrX_+_37639264 | 4.38 |
ENST00000378588.4
|
CYBB
|
cytochrome b-245, beta polypeptide |
| chr12_+_56325812 | 4.31 |
ENST00000394147.1
ENST00000551156.1 ENST00000553783.1 ENST00000557080.1 ENST00000432422.3 ENST00000556001.1 |
DGKA
|
diacylglycerol kinase, alpha 80kDa |
| chr2_+_90077680 | 4.29 |
ENST00000390270.2
|
IGKV3D-20
|
immunoglobulin kappa variable 3D-20 |
| chr6_-_170101749 | 4.28 |
ENST00000448612.1
|
WDR27
|
WD repeat domain 27 |
| chr2_-_50574856 | 4.22 |
ENST00000342183.5
|
NRXN1
|
neurexin 1 |
| chr9_-_95166841 | 4.21 |
ENST00000262551.4
|
OGN
|
osteoglycin |
| chr6_+_72926145 | 4.20 |
ENST00000425662.2
ENST00000453976.2 |
RIMS1
|
regulating synaptic membrane exocytosis 1 |
| chr4_-_57547454 | 4.16 |
ENST00000556376.2
|
HOPX
|
HOP homeobox |
| chr19_-_53758094 | 4.15 |
ENST00000601828.1
ENST00000598513.1 ENST00000599012.1 ENST00000333952.4 ENST00000598806.1 |
ZNF677
|
zinc finger protein 677 |
| chr7_-_73038822 | 4.14 |
ENST00000414749.2
ENST00000429400.2 ENST00000434326.1 |
MLXIPL
|
MLX interacting protein-like |
| chr11_-_104905840 | 4.08 |
ENST00000526568.1
ENST00000393136.4 ENST00000531166.1 ENST00000534497.1 ENST00000527979.1 ENST00000446369.1 ENST00000353247.5 ENST00000528974.1 ENST00000533400.1 ENST00000525825.1 ENST00000436863.3 |
CASP1
|
caspase 1, apoptosis-related cysteine peptidase |
| chr13_+_49551020 | 4.08 |
ENST00000541916.1
|
FNDC3A
|
fibronectin type III domain containing 3A |
| chr8_-_102803163 | 4.06 |
ENST00000523645.1
ENST00000520346.1 ENST00000220931.6 ENST00000522448.1 ENST00000522951.1 ENST00000522252.1 ENST00000519098.1 |
NCALD
|
neurocalcin delta |
| chr18_-_53177984 | 4.04 |
ENST00000543082.1
|
TCF4
|
transcription factor 4 |
| chr5_+_54398463 | 3.99 |
ENST00000274306.6
|
GZMA
|
granzyme A (granzyme 1, cytotoxic T-lymphocyte-associated serine esterase 3) |
| chr6_+_26365443 | 3.93 |
ENST00000527422.1
ENST00000356386.2 ENST00000396934.3 ENST00000377708.2 ENST00000396948.1 ENST00000508906.2 |
BTN3A2
|
butyrophilin, subfamily 3, member A2 |
| chr5_+_176853702 | 3.92 |
ENST00000507633.1
ENST00000393576.3 ENST00000355958.5 ENST00000528793.1 ENST00000512684.1 |
GRK6
|
G protein-coupled receptor kinase 6 |
| chr6_-_32784687 | 3.92 |
ENST00000447394.1
ENST00000438763.2 |
HLA-DOB
|
major histocompatibility complex, class II, DO beta |
| chr1_-_48937821 | 3.92 |
ENST00000396199.3
|
SPATA6
|
spermatogenesis associated 6 |
| chr12_-_23737534 | 3.91 |
ENST00000396007.2
|
SOX5
|
SRY (sex determining region Y)-box 5 |
| chr4_-_176733897 | 3.90 |
ENST00000393658.2
|
GPM6A
|
glycoprotein M6A |
| chr2_-_89442621 | 3.90 |
ENST00000492167.1
|
IGKV3-20
|
immunoglobulin kappa variable 3-20 |
| chr18_+_32173276 | 3.90 |
ENST00000591816.1
ENST00000588125.1 ENST00000598334.1 ENST00000588684.1 ENST00000554864.3 ENST00000399121.5 ENST00000595022.1 ENST00000269190.7 ENST00000399097.3 |
DTNA
|
dystrobrevin, alpha |
| chr1_-_45956822 | 3.89 |
ENST00000372086.3
ENST00000341771.6 |
TESK2
|
testis-specific kinase 2 |
| chr14_-_104181771 | 3.87 |
ENST00000554913.1
ENST00000554974.1 ENST00000553361.1 ENST00000555055.1 ENST00000555964.1 ENST00000556682.1 ENST00000445556.1 ENST00000553332.1 ENST00000352127.7 |
XRCC3
|
X-ray repair complementing defective repair in Chinese hamster cells 3 |
| chr7_-_73038867 | 3.85 |
ENST00000313375.3
ENST00000354613.1 ENST00000395189.1 ENST00000453275.1 |
MLXIPL
|
MLX interacting protein-like |
| chr17_-_9929581 | 3.84 |
ENST00000437099.2
ENST00000396115.2 |
GAS7
|
growth arrest-specific 7 |
| chr8_+_38585704 | 3.84 |
ENST00000519416.1
ENST00000520615.1 |
TACC1
|
transforming, acidic coiled-coil containing protein 1 |
| chr10_+_18629628 | 3.79 |
ENST00000377329.4
|
CACNB2
|
calcium channel, voltage-dependent, beta 2 subunit |
| chr13_-_41706864 | 3.76 |
ENST00000379485.1
ENST00000499385.2 |
KBTBD6
|
kelch repeat and BTB (POZ) domain containing 6 |
| chr8_-_101571964 | 3.75 |
ENST00000520552.1
ENST00000521345.1 ENST00000523000.1 ENST00000335659.3 ENST00000358990.3 ENST00000519597.1 |
ANKRD46
|
ankyrin repeat domain 46 |
| chr13_+_31309645 | 3.75 |
ENST00000380490.3
|
ALOX5AP
|
arachidonate 5-lipoxygenase-activating protein |
| chr7_-_37488834 | 3.74 |
ENST00000310758.4
|
ELMO1
|
engulfment and cell motility 1 |
| chr12_-_118796910 | 3.72 |
ENST00000541186.1
ENST00000539872.1 |
TAOK3
|
TAO kinase 3 |
| chr1_+_183774240 | 3.71 |
ENST00000360851.3
|
RGL1
|
ral guanine nucleotide dissociation stimulator-like 1 |
| chr3_-_98241358 | 3.71 |
ENST00000503004.1
ENST00000506575.1 ENST00000513452.1 ENST00000515620.1 |
CLDND1
|
claudin domain containing 1 |
| chr12_-_30887948 | 3.70 |
ENST00000433722.2
|
CAPRIN2
|
caprin family member 2 |
| chr7_+_97361388 | 3.69 |
ENST00000350485.4
ENST00000346867.4 |
TAC1
|
tachykinin, precursor 1 |
| chr1_-_48937838 | 3.69 |
ENST00000371847.3
|
SPATA6
|
spermatogenesis associated 6 |
| chr12_-_10282836 | 3.68 |
ENST00000304084.8
ENST00000353231.5 ENST00000525605.1 |
CLEC7A
|
C-type lectin domain family 7, member A |
| chr6_-_22297730 | 3.68 |
ENST00000306482.1
|
PRL
|
prolactin |
| chrX_+_77166172 | 3.68 |
ENST00000343533.5
ENST00000350425.4 ENST00000341514.6 |
ATP7A
|
ATPase, Cu++ transporting, alpha polypeptide |
| chr6_+_26402517 | 3.67 |
ENST00000414912.2
|
BTN3A1
|
butyrophilin, subfamily 3, member A1 |
| chr8_+_119294456 | 3.67 |
ENST00000366457.2
|
AC023590.1
|
Uncharacterized protein |
| chr12_-_22063787 | 3.66 |
ENST00000544039.1
|
ABCC9
|
ATP-binding cassette, sub-family C (CFTR/MRP), member 9 |
| chr10_+_13142075 | 3.63 |
ENST00000378757.2
ENST00000430081.1 ENST00000378752.3 ENST00000378748.3 |
OPTN
|
optineurin |
| chr8_-_87755878 | 3.63 |
ENST00000320005.5
|
CNGB3
|
cyclic nucleotide gated channel beta 3 |
| chr10_-_115904361 | 3.63 |
ENST00000428953.1
ENST00000543782.1 |
C10orf118
|
chromosome 10 open reading frame 118 |
| chrX_+_37639302 | 3.62 |
ENST00000545017.1
ENST00000536160.1 |
CYBB
|
cytochrome b-245, beta polypeptide |
| chr4_+_3388057 | 3.59 |
ENST00000538395.1
|
RGS12
|
regulator of G-protein signaling 12 |
| chrX_+_15808569 | 3.59 |
ENST00000380308.3
ENST00000307771.7 |
ZRSR2
|
zinc finger (CCCH type), RNA-binding motif and serine/arginine rich 2 |
| chr9_-_95166884 | 3.58 |
ENST00000375561.5
|
OGN
|
osteoglycin |
| chr6_-_32157947 | 3.58 |
ENST00000375050.4
|
PBX2
|
pre-B-cell leukemia homeobox 2 |
| chr4_+_88754069 | 3.55 |
ENST00000395102.4
ENST00000497649.2 |
MEPE
|
matrix extracellular phosphoglycoprotein |
| chr9_-_21368075 | 3.54 |
ENST00000449498.1
|
IFNA13
|
interferon, alpha 13 |
| chr7_-_137028534 | 3.53 |
ENST00000348225.2
|
PTN
|
pleiotrophin |
| chr1_-_160681593 | 3.50 |
ENST00000368045.3
ENST00000368046.3 |
CD48
|
CD48 molecule |
| chr4_-_89205705 | 3.48 |
ENST00000295908.7
ENST00000510548.2 ENST00000508256.1 |
PPM1K
|
protein phosphatase, Mg2+/Mn2+ dependent, 1K |
| chr18_-_21977748 | 3.47 |
ENST00000399441.4
ENST00000319481.3 |
OSBPL1A
|
oxysterol binding protein-like 1A |
| chr6_+_28317685 | 3.45 |
ENST00000252211.2
ENST00000341464.5 ENST00000377255.3 |
ZKSCAN3
|
zinc finger with KRAB and SCAN domains 3 |
| chr13_-_46626847 | 3.42 |
ENST00000242848.4
ENST00000282007.3 |
ZC3H13
|
zinc finger CCCH-type containing 13 |
| chr7_-_105029812 | 3.41 |
ENST00000482897.1
|
SRPK2
|
SRSF protein kinase 2 |
| chr12_+_7014064 | 3.39 |
ENST00000443597.2
|
LRRC23
|
leucine rich repeat containing 23 |
| chr12_-_9760482 | 3.39 |
ENST00000229402.3
|
KLRB1
|
killer cell lectin-like receptor subfamily B, member 1 |
| chr7_-_87342564 | 3.38 |
ENST00000265724.3
ENST00000416177.1 |
ABCB1
|
ATP-binding cassette, sub-family B (MDR/TAP), member 1 |
| chr7_-_137028498 | 3.36 |
ENST00000393083.2
|
PTN
|
pleiotrophin |
Network of associatons between targets according to the STRING database.

First level regulatory network of MIXL1_GSX1_BSX_MEOX2_LHX4
Gene Ontology Analysis
Gene overrepresentation in biological_process category:
| Log-likelihood per target | Total log-likelihood | Term | Description |
|---|---|---|---|
| 9.2 | 27.7 | GO:2001190 | positive regulation of T cell activation via T cell receptor contact with antigen bound to MHC molecule on antigen presenting cell(GO:2001190) |
| 4.3 | 42.7 | GO:0051581 | negative regulation of neurotransmitter uptake(GO:0051581) serotonin uptake(GO:0051610) regulation of serotonin uptake(GO:0051611) negative regulation of serotonin uptake(GO:0051612) |
| 3.4 | 10.1 | GO:0002881 | negative regulation of chronic inflammatory response to non-antigenic stimulus(GO:0002881) |
| 3.0 | 9.0 | GO:2000854 | positive regulation of corticosterone secretion(GO:2000854) |
| 3.0 | 11.9 | GO:0050717 | positive regulation of interleukin-1 alpha secretion(GO:0050717) |
| 2.9 | 22.9 | GO:0001920 | negative regulation of receptor recycling(GO:0001920) |
| 2.9 | 8.6 | GO:0070105 | positive regulation of interleukin-6-mediated signaling pathway(GO:0070105) |
| 2.8 | 8.3 | GO:1902997 | regulation of choline O-acetyltransferase activity(GO:1902769) positive regulation of choline O-acetyltransferase activity(GO:1902771) negative regulation of tau-protein kinase activity(GO:1902948) positive regulation of early endosome to recycling endosome transport(GO:1902955) negative regulation of aspartic-type endopeptidase activity involved in amyloid precursor protein catabolic process(GO:1902960) negative regulation of neurofibrillary tangle assembly(GO:1902997) negative regulation of aspartic-type peptidase activity(GO:1905246) |
| 2.5 | 7.6 | GO:0014057 | positive regulation of acetylcholine secretion, neurotransmission(GO:0014057) |
| 2.4 | 14.5 | GO:1902996 | regulation of neurofibrillary tangle assembly(GO:1902996) |
| 2.4 | 14.1 | GO:2000324 | positive regulation of glucocorticoid receptor signaling pathway(GO:2000324) |
| 2.3 | 6.9 | GO:1904395 | retinal rod cell differentiation(GO:0060221) positive regulation of skeletal muscle acetylcholine-gated channel clustering(GO:1904395) negative regulation of neuromuscular junction development(GO:1904397) |
| 2.1 | 14.5 | GO:0009449 | gamma-aminobutyric acid biosynthetic process(GO:0009449) |
| 2.0 | 10.1 | GO:0048478 | replication fork protection(GO:0048478) |
| 2.0 | 6.0 | GO:0003218 | cardiac left ventricle formation(GO:0003218) |
| 1.9 | 9.6 | GO:0097338 | response to clozapine(GO:0097338) |
| 1.7 | 13.4 | GO:0007258 | JUN phosphorylation(GO:0007258) |
| 1.6 | 4.9 | GO:0000294 | nuclear-transcribed mRNA catabolic process, endonucleolytic cleavage-dependent decay(GO:0000294) |
| 1.6 | 11.3 | GO:0002414 | immunoglobulin transcytosis in epithelial cells(GO:0002414) |
| 1.6 | 6.4 | GO:0046104 | thymidine metabolic process(GO:0046104) pyrimidine deoxyribonucleoside metabolic process(GO:0046125) |
| 1.6 | 8.0 | GO:1904844 | response to L-glutamine(GO:1904844) cellular response to L-glutamine(GO:1904845) |
| 1.6 | 6.3 | GO:0061743 | motor learning(GO:0061743) |
| 1.6 | 9.3 | GO:1904879 | positive regulation of calcium ion transmembrane transport via high voltage-gated calcium channel(GO:1904879) |
| 1.5 | 7.4 | GO:0014738 | regulation of muscle hyperplasia(GO:0014738) |
| 1.5 | 4.4 | GO:0002399 | MHC class II protein complex assembly(GO:0002399) |
| 1.4 | 5.8 | GO:0071461 | cellular response to redox state(GO:0071461) |
| 1.4 | 22.8 | GO:0043374 | CD8-positive, alpha-beta T cell differentiation(GO:0043374) |
| 1.4 | 6.9 | GO:0048539 | immunoglobulin biosynthetic process(GO:0002378) bone marrow development(GO:0048539) |
| 1.3 | 9.3 | GO:0048743 | positive regulation of skeletal muscle fiber development(GO:0048743) |
| 1.3 | 3.9 | GO:0002581 | negative regulation of antigen processing and presentation of peptide or polysaccharide antigen via MHC class II(GO:0002581) |
| 1.3 | 10.5 | GO:0051388 | positive regulation of neurotrophin TRK receptor signaling pathway(GO:0051388) |
| 1.3 | 6.5 | GO:0035063 | nuclear speck organization(GO:0035063) |
| 1.3 | 3.9 | GO:0071139 | resolution of recombination intermediates(GO:0071139) resolution of mitotic recombination intermediates(GO:0071140) |
| 1.3 | 98.1 | GO:2000649 | regulation of sodium ion transmembrane transporter activity(GO:2000649) |
| 1.3 | 2.5 | GO:2001027 | negative regulation of endothelial cell chemotaxis(GO:2001027) |
| 1.2 | 3.7 | GO:0071284 | cellular response to lead ion(GO:0071284) |
| 1.2 | 1.2 | GO:0014835 | myoblast differentiation involved in skeletal muscle regeneration(GO:0014835) |
| 1.1 | 4.6 | GO:1902261 | positive regulation of delayed rectifier potassium channel activity(GO:1902261) |
| 1.1 | 8.0 | GO:0090324 | negative regulation of oxidative phosphorylation(GO:0090324) |
| 1.1 | 3.3 | GO:0002384 | hepatic immune response(GO:0002384) |
| 1.1 | 3.2 | GO:0030311 | poly-N-acetyllactosamine metabolic process(GO:0030309) poly-N-acetyllactosamine biosynthetic process(GO:0030311) |
| 1.0 | 3.1 | GO:0051697 | protein delipidation(GO:0051697) |
| 1.0 | 10.2 | GO:0016198 | axon choice point recognition(GO:0016198) |
| 1.0 | 7.1 | GO:0048280 | vesicle fusion with Golgi apparatus(GO:0048280) |
| 1.0 | 12.0 | GO:1900747 | negative regulation of vascular endothelial growth factor signaling pathway(GO:1900747) |
| 1.0 | 3.0 | GO:0048382 | mesendoderm development(GO:0048382) |
| 1.0 | 6.9 | GO:0002175 | protein localization to paranode region of axon(GO:0002175) |
| 0.9 | 17.1 | GO:0071803 | positive regulation of podosome assembly(GO:0071803) |
| 0.9 | 13.1 | GO:0097151 | positive regulation of inhibitory postsynaptic potential(GO:0097151) modulation of inhibitory postsynaptic potential(GO:0098828) |
| 0.9 | 4.6 | GO:0035934 | corticosterone secretion(GO:0035934) regulation of corticosterone secretion(GO:2000852) |
| 0.9 | 9.3 | GO:0090292 | nuclear matrix anchoring at nuclear membrane(GO:0090292) |
| 0.9 | 2.6 | GO:1904647 | response to rotenone(GO:1904647) |
| 0.9 | 1.7 | GO:0044828 | negative regulation by host of viral genome replication(GO:0044828) |
| 0.9 | 6.8 | GO:0097116 | gephyrin clustering involved in postsynaptic density assembly(GO:0097116) |
| 0.8 | 15.1 | GO:0007021 | tubulin complex assembly(GO:0007021) |
| 0.8 | 1.7 | GO:0090090 | negative regulation of canonical Wnt signaling pathway(GO:0090090) |
| 0.8 | 10.7 | GO:0033617 | mitochondrial respiratory chain complex IV assembly(GO:0033617) mitochondrial respiratory chain complex IV biogenesis(GO:0097034) |
| 0.8 | 3.2 | GO:1902748 | positive regulation of lens fiber cell differentiation(GO:1902748) |
| 0.8 | 20.7 | GO:0097067 | cellular response to thyroid hormone stimulus(GO:0097067) |
| 0.8 | 4.0 | GO:2001106 | regulation of Rho guanyl-nucleotide exchange factor activity(GO:2001106) |
| 0.8 | 6.2 | GO:0050861 | positive regulation of B cell receptor signaling pathway(GO:0050861) |
| 0.8 | 4.6 | GO:1904381 | Golgi apparatus mannose trimming(GO:1904381) |
| 0.8 | 2.3 | GO:1902956 | neuron intrinsic apoptotic signaling pathway in response to hydrogen peroxide(GO:0036482) positive regulation of cellular respiration(GO:1901857) regulation of mitochondrial electron transport, NADH to ubiquinone(GO:1902956) positive regulation of mitochondrial electron transport, NADH to ubiquinone(GO:1902958) regulation of hydrogen peroxide-induced neuron intrinsic apoptotic signaling pathway(GO:1903383) negative regulation of hydrogen peroxide-induced neuron intrinsic apoptotic signaling pathway(GO:1903384) |
| 0.8 | 2.3 | GO:0019417 | sulfur oxidation(GO:0019417) |
| 0.7 | 2.2 | GO:0015888 | thiamine transport(GO:0015888) thiamine transmembrane transport(GO:0071934) |
| 0.7 | 5.7 | GO:0070475 | rRNA base methylation(GO:0070475) |
| 0.7 | 4.8 | GO:0072501 | cellular divalent inorganic anion homeostasis(GO:0072501) |
| 0.7 | 2.0 | GO:0006258 | UDP-glucose catabolic process(GO:0006258) galactose catabolic process via UDP-galactose(GO:0033499) |
| 0.7 | 2.0 | GO:0032641 | negative regulation of tolerance induction(GO:0002644) lymphotoxin A production(GO:0032641) interleukin-4 biosynthetic process(GO:0042097) lymphotoxin A biosynthetic process(GO:0042109) regulation of interleukin-4 biosynthetic process(GO:0045402) positive regulation of interleukin-4 biosynthetic process(GO:0045404) |
| 0.7 | 12.8 | GO:1901741 | positive regulation of myoblast fusion(GO:1901741) |
| 0.7 | 3.9 | GO:0055059 | asymmetric neuroblast division(GO:0055059) |
| 0.6 | 1.9 | GO:1904897 | regulation of hepatic stellate cell proliferation(GO:1904897) positive regulation of hepatic stellate cell proliferation(GO:1904899) hepatic stellate cell proliferation(GO:1990922) |
| 0.6 | 1.9 | GO:0090526 | regulation of gluconeogenesis involved in cellular glucose homeostasis(GO:0090526) |
| 0.6 | 6.7 | GO:0042908 | xenobiotic transport(GO:0042908) |
| 0.6 | 0.6 | GO:0070662 | mast cell proliferation(GO:0070662) regulation of mast cell proliferation(GO:0070666) positive regulation of mast cell proliferation(GO:0070668) |
| 0.6 | 1.2 | GO:2001186 | negative regulation of CD8-positive, alpha-beta T cell activation(GO:2001186) |
| 0.6 | 6.7 | GO:0042904 | 9-cis-retinoic acid biosynthetic process(GO:0042904) 9-cis-retinoic acid metabolic process(GO:0042905) |
| 0.6 | 1.8 | GO:0000354 | cis assembly of pre-catalytic spliceosome(GO:0000354) |
| 0.6 | 13.7 | GO:0072643 | interferon-gamma secretion(GO:0072643) |
| 0.6 | 2.3 | GO:1990418 | response to insulin-like growth factor stimulus(GO:1990418) |
| 0.6 | 2.8 | GO:0014809 | regulation of skeletal muscle contraction by regulation of release of sequestered calcium ion(GO:0014809) |
| 0.6 | 2.8 | GO:0010746 | regulation of plasma membrane long-chain fatty acid transport(GO:0010746) negative regulation of plasma membrane long-chain fatty acid transport(GO:0010748) |
| 0.6 | 1.7 | GO:0001694 | histamine biosynthetic process(GO:0001694) |
| 0.6 | 2.2 | GO:0072166 | posterior mesonephric tubule development(GO:0072166) negative regulation of metanephric glomerulus development(GO:0072299) negative regulation of metanephric glomerular mesangial cell proliferation(GO:0072302) |
| 0.6 | 2.8 | GO:0060662 | tube lumen cavitation(GO:0060605) salivary gland cavitation(GO:0060662) |
| 0.6 | 1.1 | GO:0035356 | cellular triglyceride homeostasis(GO:0035356) |
| 0.5 | 8.1 | GO:0015671 | oxygen transport(GO:0015671) |
| 0.5 | 2.6 | GO:0010958 | regulation of amino acid import(GO:0010958) L-arginine import(GO:0043091) arginine import(GO:0090467) L-arginine transport(GO:1902023) |
| 0.5 | 1.1 | GO:0030199 | collagen fibril organization(GO:0030199) |
| 0.5 | 2.1 | GO:0086097 | phospholipase C-activating angiotensin-activated signaling pathway(GO:0086097) |
| 0.5 | 1.6 | GO:0021555 | midbrain-hindbrain boundary morphogenesis(GO:0021555) fourth ventricle development(GO:0021592) third ventricle development(GO:0021678) |
| 0.5 | 6.5 | GO:0048842 | positive regulation of axon extension involved in axon guidance(GO:0048842) |
| 0.5 | 1.5 | GO:0044771 | meiotic cell cycle phase transition(GO:0044771) establishment of meiotic spindle localization(GO:0051295) regulation of meiotic cell cycle phase transition(GO:1901993) negative regulation of meiotic cell cycle phase transition(GO:1901994) |
| 0.5 | 5.0 | GO:1902083 | negative regulation of peptidyl-cysteine S-nitrosylation(GO:1902083) |
| 0.5 | 1.0 | GO:1904252 | negative regulation of bile acid biosynthetic process(GO:0070858) negative regulation of bile acid metabolic process(GO:1904252) |
| 0.5 | 3.9 | GO:1900113 | negative regulation of histone H3-K9 trimethylation(GO:1900113) |
| 0.5 | 0.5 | GO:0007356 | thorax and anterior abdomen determination(GO:0007356) |
| 0.5 | 1.9 | GO:0072674 | multinuclear osteoclast differentiation(GO:0072674) osteoclast fusion(GO:0072675) |
| 0.5 | 2.4 | GO:1904823 | pyrimidine nucleobase transport(GO:0015855) urea transmembrane transport(GO:0071918) purine nucleobase transmembrane transport(GO:1904823) |
| 0.5 | 2.3 | GO:2000301 | negative regulation of synaptic vesicle exocytosis(GO:2000301) |
| 0.5 | 1.4 | GO:0030327 | prenylated protein catabolic process(GO:0030327) |
| 0.5 | 2.3 | GO:1901509 | regulation of endothelial tube morphogenesis(GO:1901509) |
| 0.5 | 0.9 | GO:0070309 | lens fiber cell morphogenesis(GO:0070309) |
| 0.5 | 9.2 | GO:0007095 | mitotic G2 DNA damage checkpoint(GO:0007095) |
| 0.5 | 10.0 | GO:0030502 | negative regulation of bone mineralization(GO:0030502) |
| 0.5 | 4.1 | GO:0019722 | calcium-mediated signaling(GO:0019722) |
| 0.4 | 2.2 | GO:0042421 | norepinephrine biosynthetic process(GO:0042421) |
| 0.4 | 1.3 | GO:0036309 | protein localization to M-band(GO:0036309) protein localization to T-tubule(GO:0036371) |
| 0.4 | 1.3 | GO:0034146 | toll-like receptor 5 signaling pathway(GO:0034146) |
| 0.4 | 3.4 | GO:2000773 | negative regulation of cellular senescence(GO:2000773) |
| 0.4 | 8.5 | GO:0035563 | positive regulation of chromatin binding(GO:0035563) |
| 0.4 | 13.1 | GO:0051131 | chaperone-mediated protein complex assembly(GO:0051131) |
| 0.4 | 3.7 | GO:2001300 | lipoxin metabolic process(GO:2001300) |
| 0.4 | 59.6 | GO:0006958 | complement activation, classical pathway(GO:0006958) |
| 0.4 | 1.2 | GO:0002949 | tRNA threonylcarbamoyladenosine modification(GO:0002949) |
| 0.4 | 7.7 | GO:0042340 | keratan sulfate catabolic process(GO:0042340) |
| 0.4 | 1.6 | GO:0060023 | soft palate development(GO:0060023) |
| 0.4 | 1.2 | GO:1901876 | regulation of calcium ion binding(GO:1901876) negative regulation of calcium ion binding(GO:1901877) |
| 0.4 | 3.1 | GO:1903690 | negative regulation of wound healing, spreading of epidermal cells(GO:1903690) |
| 0.4 | 0.4 | GO:0018262 | isopeptide cross-linking via N6-(L-isoglutamyl)-L-lysine(GO:0018153) isopeptide cross-linking(GO:0018262) |
| 0.4 | 0.7 | GO:0015074 | DNA integration(GO:0015074) |
| 0.4 | 3.0 | GO:0098532 | histone H3-K27 trimethylation(GO:0098532) |
| 0.4 | 0.4 | GO:0003404 | optic vesicle morphogenesis(GO:0003404) |
| 0.4 | 2.5 | GO:1903232 | melanosome assembly(GO:1903232) |
| 0.4 | 1.1 | GO:1990414 | replication-born double-strand break repair via sister chromatid exchange(GO:1990414) |
| 0.4 | 5.4 | GO:0016024 | CDP-diacylglycerol biosynthetic process(GO:0016024) |
| 0.4 | 2.5 | GO:0090063 | positive regulation of microtubule nucleation(GO:0090063) |
| 0.4 | 9.6 | GO:0050860 | negative regulation of T cell receptor signaling pathway(GO:0050860) |
| 0.4 | 0.7 | GO:0043524 | negative regulation of neuron apoptotic process(GO:0043524) |
| 0.3 | 0.3 | GO:0060369 | positive regulation of Fc receptor mediated stimulatory signaling pathway(GO:0060369) |
| 0.3 | 2.4 | GO:0032277 | negative regulation of gonadotropin secretion(GO:0032277) |
| 0.3 | 0.7 | GO:0033364 | mast cell secretory granule organization(GO:0033364) |
| 0.3 | 2.3 | GO:0071896 | protein localization to adherens junction(GO:0071896) |
| 0.3 | 1.3 | GO:0007499 | ectoderm and mesoderm interaction(GO:0007499) |
| 0.3 | 1.0 | GO:1901859 | negative regulation of mitochondrial DNA replication(GO:0090298) negative regulation of mitochondrial DNA metabolic process(GO:1901859) |
| 0.3 | 6.9 | GO:1902894 | negative regulation of pri-miRNA transcription from RNA polymerase II promoter(GO:1902894) |
| 0.3 | 1.6 | GO:0033326 | cerebrospinal fluid secretion(GO:0033326) |
| 0.3 | 1.3 | GO:0018076 | N-terminal peptidyl-lysine acetylation(GO:0018076) |
| 0.3 | 3.9 | GO:1902260 | diaphragm development(GO:0060539) negative regulation of delayed rectifier potassium channel activity(GO:1902260) |
| 0.3 | 1.6 | GO:0050955 | thermoception(GO:0050955) |
| 0.3 | 1.3 | GO:0033123 | positive regulation of cyclic nucleotide catabolic process(GO:0030807) positive regulation of cAMP catabolic process(GO:0030822) positive regulation of purine nucleotide catabolic process(GO:0033123) |
| 0.3 | 5.9 | GO:2000353 | positive regulation of endothelial cell apoptotic process(GO:2000353) |
| 0.3 | 5.7 | GO:0035493 | SNARE complex assembly(GO:0035493) |
| 0.3 | 3.3 | GO:0048251 | elastic fiber assembly(GO:0048251) |
| 0.3 | 2.4 | GO:0006883 | cellular sodium ion homeostasis(GO:0006883) |
| 0.3 | 2.4 | GO:0019227 | neuronal action potential propagation(GO:0019227) action potential propagation(GO:0098870) |
| 0.3 | 1.2 | GO:0010700 | negative regulation of norepinephrine secretion(GO:0010700) |
| 0.3 | 2.1 | GO:1902947 | regulation of tau-protein kinase activity(GO:1902947) |
| 0.3 | 2.4 | GO:0034587 | piRNA metabolic process(GO:0034587) |
| 0.3 | 1.5 | GO:0099538 | synaptic signaling via neuropeptide(GO:0099538) trans-synaptic signaling by neuropeptide(GO:0099540) trans-synaptic signaling by neuropeptide, modulating synaptic transmission(GO:0099551) |
| 0.3 | 1.2 | GO:0045872 | positive regulation of rhodopsin gene expression(GO:0045872) |
| 0.3 | 4.6 | GO:0042832 | defense response to protozoan(GO:0042832) |
| 0.3 | 2.0 | GO:0060080 | inhibitory postsynaptic potential(GO:0060080) |
| 0.3 | 0.6 | GO:2000048 | negative regulation of cell-cell adhesion mediated by cadherin(GO:2000048) |
| 0.3 | 1.4 | GO:0072023 | thick ascending limb development(GO:0072023) metanephric thick ascending limb development(GO:0072233) |
| 0.3 | 2.0 | GO:0016098 | monoterpenoid metabolic process(GO:0016098) |
| 0.3 | 1.1 | GO:0036269 | swimming behavior(GO:0036269) |
| 0.3 | 1.4 | GO:0007197 | adenylate cyclase-inhibiting G-protein coupled acetylcholine receptor signaling pathway(GO:0007197) |
| 0.3 | 3.0 | GO:0019800 | peptide cross-linking via chondroitin 4-sulfate glycosaminoglycan(GO:0019800) |
| 0.3 | 1.9 | GO:0039663 | fusion of virus membrane with host plasma membrane(GO:0019064) membrane fusion involved in viral entry into host cell(GO:0039663) multi-organism membrane fusion(GO:0044800) |
| 0.3 | 0.8 | GO:0014807 | regulation of somitogenesis(GO:0014807) |
| 0.3 | 14.0 | GO:0034260 | negative regulation of GTPase activity(GO:0034260) |
| 0.3 | 1.6 | GO:1900165 | negative regulation of interleukin-6 secretion(GO:1900165) |
| 0.3 | 1.1 | GO:0038155 | interleukin-23-mediated signaling pathway(GO:0038155) |
| 0.3 | 4.8 | GO:0030277 | maintenance of gastrointestinal epithelium(GO:0030277) |
| 0.3 | 1.6 | GO:0070172 | positive regulation of tooth mineralization(GO:0070172) |
| 0.3 | 0.8 | GO:0019605 | benzoate metabolic process(GO:0018874) butyrate metabolic process(GO:0019605) |
| 0.3 | 3.0 | GO:0034356 | NAD biosynthesis via nicotinamide riboside salvage pathway(GO:0034356) |
| 0.3 | 2.0 | GO:0045078 | positive regulation of interferon-gamma biosynthetic process(GO:0045078) |
| 0.2 | 5.2 | GO:0007597 | blood coagulation, intrinsic pathway(GO:0007597) |
| 0.2 | 1.2 | GO:0042539 | hypotonic salinity response(GO:0042539) cellular hypotonic salinity response(GO:0071477) |
| 0.2 | 0.7 | GO:0097056 | seryl-tRNA aminoacylation(GO:0006434) selenocysteinyl-tRNA(Sec) biosynthetic process(GO:0097056) |
| 0.2 | 0.7 | GO:0090341 | negative regulation of secretion of lysosomal enzymes(GO:0090341) |
| 0.2 | 2.9 | GO:1901898 | negative regulation of relaxation of muscle(GO:1901078) negative regulation of relaxation of cardiac muscle(GO:1901898) |
| 0.2 | 1.7 | GO:0046849 | bone remodeling(GO:0046849) |
| 0.2 | 1.4 | GO:0006537 | glutamate biosynthetic process(GO:0006537) |
| 0.2 | 6.5 | GO:0044458 | motile cilium assembly(GO:0044458) |
| 0.2 | 0.7 | GO:0001764 | neuron migration(GO:0001764) |
| 0.2 | 2.4 | GO:0048245 | eosinophil chemotaxis(GO:0048245) |
| 0.2 | 1.2 | GO:0051970 | negative regulation of transmission of nerve impulse(GO:0051970) |
| 0.2 | 2.3 | GO:0007016 | cytoskeletal anchoring at plasma membrane(GO:0007016) |
| 0.2 | 0.5 | GO:0010966 | regulation of phosphate transport(GO:0010966) |
| 0.2 | 1.4 | GO:0036444 | calcium ion transmembrane import into mitochondrion(GO:0036444) |
| 0.2 | 2.7 | GO:0008627 | intrinsic apoptotic signaling pathway in response to osmotic stress(GO:0008627) |
| 0.2 | 1.1 | GO:0006265 | DNA topological change(GO:0006265) |
| 0.2 | 4.1 | GO:0060009 | Sertoli cell development(GO:0060009) |
| 0.2 | 1.8 | GO:0001867 | complement activation, lectin pathway(GO:0001867) |
| 0.2 | 0.7 | GO:0010430 | fatty acid omega-oxidation(GO:0010430) |
| 0.2 | 7.1 | GO:0016601 | Rac protein signal transduction(GO:0016601) |
| 0.2 | 1.6 | GO:0034505 | tooth mineralization(GO:0034505) |
| 0.2 | 0.4 | GO:0044339 | canonical Wnt signaling pathway involved in osteoblast differentiation(GO:0044339) |
| 0.2 | 2.2 | GO:0039536 | negative regulation of RIG-I signaling pathway(GO:0039536) |
| 0.2 | 1.7 | GO:0048263 | determination of dorsal identity(GO:0048263) |
| 0.2 | 2.4 | GO:0003351 | epithelial cilium movement(GO:0003351) |
| 0.2 | 0.8 | GO:0035425 | autocrine signaling(GO:0035425) |
| 0.2 | 0.6 | GO:0021913 | regulation of transcription from RNA polymerase II promoter involved in ventral spinal cord interneuron specification(GO:0021913) |
| 0.2 | 0.8 | GO:0033133 | positive regulation of glucokinase activity(GO:0033133) positive regulation of hexokinase activity(GO:1903301) |
| 0.2 | 1.2 | GO:0072733 | response to staurosporine(GO:0072733) cellular response to staurosporine(GO:0072734) negative regulation of mitochondrial membrane permeability involved in apoptotic process(GO:1902109) |
| 0.2 | 72.5 | GO:0051056 | regulation of small GTPase mediated signal transduction(GO:0051056) |
| 0.2 | 3.8 | GO:0009954 | proximal/distal pattern formation(GO:0009954) |
| 0.2 | 0.6 | GO:0021764 | amygdala development(GO:0021764) |
| 0.2 | 1.2 | GO:0000712 | resolution of meiotic recombination intermediates(GO:0000712) |
| 0.2 | 1.3 | GO:0019065 | receptor-mediated endocytosis of virus by host cell(GO:0019065) endocytosis involved in viral entry into host cell(GO:0075509) |
| 0.2 | 0.4 | GO:0051799 | negative regulation of hair follicle development(GO:0051799) |
| 0.2 | 27.5 | GO:0002377 | immunoglobulin production(GO:0002377) |
| 0.2 | 5.7 | GO:0006607 | NLS-bearing protein import into nucleus(GO:0006607) |
| 0.2 | 2.9 | GO:0002819 | regulation of adaptive immune response(GO:0002819) |
| 0.2 | 1.3 | GO:0044245 | polysaccharide digestion(GO:0044245) |
| 0.2 | 0.9 | GO:0000707 | meiotic DNA recombinase assembly(GO:0000707) |
| 0.2 | 0.5 | GO:0030186 | melatonin metabolic process(GO:0030186) melatonin biosynthetic process(GO:0030187) |
| 0.2 | 0.9 | GO:0046618 | drug export(GO:0046618) |
| 0.2 | 9.0 | GO:0015701 | bicarbonate transport(GO:0015701) |
| 0.2 | 0.9 | GO:0006776 | vitamin A metabolic process(GO:0006776) |
| 0.2 | 0.3 | GO:0061113 | pancreas morphogenesis(GO:0061113) |
| 0.2 | 1.9 | GO:0010668 | ectodermal cell differentiation(GO:0010668) |
| 0.2 | 5.2 | GO:0006654 | phosphatidic acid biosynthetic process(GO:0006654) |
| 0.2 | 2.7 | GO:0032515 | negative regulation of phosphoprotein phosphatase activity(GO:0032515) |
| 0.2 | 0.5 | GO:0050869 | negative regulation of B cell activation(GO:0050869) |
| 0.2 | 0.7 | GO:0010519 | negative regulation of phospholipase activity(GO:0010519) |
| 0.2 | 11.8 | GO:0042475 | odontogenesis of dentin-containing tooth(GO:0042475) |
| 0.2 | 0.6 | GO:0003185 | primary heart field specification(GO:0003138) sinoatrial valve development(GO:0003172) sinoatrial valve morphogenesis(GO:0003185) |
| 0.2 | 0.9 | GO:1990253 | cellular response to leucine starvation(GO:1990253) |
| 0.2 | 6.3 | GO:0019433 | triglyceride catabolic process(GO:0019433) |
| 0.2 | 0.5 | GO:0045900 | negative regulation of translational elongation(GO:0045900) |
| 0.2 | 1.2 | GO:1900028 | negative regulation of ruffle assembly(GO:1900028) |
| 0.2 | 0.5 | GO:0051574 | positive regulation of histone H3-K9 methylation(GO:0051574) |
| 0.1 | 1.8 | GO:0001823 | mesonephros development(GO:0001823) |
| 0.1 | 0.6 | GO:0016045 | detection of bacterium(GO:0016045) detection of other organism(GO:0098543) |
| 0.1 | 3.7 | GO:0060397 | JAK-STAT cascade involved in growth hormone signaling pathway(GO:0060397) |
| 0.1 | 0.6 | GO:0007525 | somatic muscle development(GO:0007525) |
| 0.1 | 0.9 | GO:0061737 | leukotriene signaling pathway(GO:0061737) |
| 0.1 | 0.6 | GO:0003183 | mitral valve morphogenesis(GO:0003183) |
| 0.1 | 2.0 | GO:0021702 | cerebellar Purkinje cell layer formation(GO:0021694) cerebellar Purkinje cell differentiation(GO:0021702) |
| 0.1 | 5.2 | GO:0007274 | neuromuscular synaptic transmission(GO:0007274) |
| 0.1 | 0.6 | GO:2000253 | positive regulation of feeding behavior(GO:2000253) |
| 0.1 | 1.5 | GO:0007252 | I-kappaB phosphorylation(GO:0007252) |
| 0.1 | 1.7 | GO:0010457 | centriole-centriole cohesion(GO:0010457) |
| 0.1 | 1.4 | GO:0098719 | sodium ion import(GO:0097369) sodium ion import across plasma membrane(GO:0098719) sodium ion import into cell(GO:1990118) |
| 0.1 | 4.4 | GO:0009081 | branched-chain amino acid metabolic process(GO:0009081) branched-chain amino acid catabolic process(GO:0009083) |
| 0.1 | 21.7 | GO:0007156 | homophilic cell adhesion via plasma membrane adhesion molecules(GO:0007156) |
| 0.1 | 1.3 | GO:0045329 | carnitine biosynthetic process(GO:0045329) |
| 0.1 | 0.5 | GO:2000400 | positive regulation of T cell differentiation in thymus(GO:0033089) positive regulation of thymocyte aggregation(GO:2000400) |
| 0.1 | 0.4 | GO:0072144 | renal interstitial fibroblast development(GO:0072141) mesangial cell development(GO:0072143) glomerular mesangial cell development(GO:0072144) |
| 0.1 | 1.0 | GO:0045919 | positive regulation of cytolysis(GO:0045919) |
| 0.1 | 2.6 | GO:0006646 | phosphatidylethanolamine biosynthetic process(GO:0006646) |
| 0.1 | 1.7 | GO:0071447 | cellular response to hydroperoxide(GO:0071447) |
| 0.1 | 0.8 | GO:0010133 | proline catabolic process to glutamate(GO:0010133) |
| 0.1 | 0.8 | GO:0014043 | negative regulation of neuron maturation(GO:0014043) |
| 0.1 | 1.9 | GO:0051354 | negative regulation of oxidoreductase activity(GO:0051354) |
| 0.1 | 2.4 | GO:0048935 | peripheral nervous system neuron differentiation(GO:0048934) peripheral nervous system neuron development(GO:0048935) |
| 0.1 | 0.4 | GO:0006014 | D-ribose metabolic process(GO:0006014) |
| 0.1 | 1.6 | GO:0051382 | kinetochore assembly(GO:0051382) |
| 0.1 | 0.5 | GO:0048738 | cardiac muscle tissue development(GO:0048738) |
| 0.1 | 16.8 | GO:0008277 | regulation of G-protein coupled receptor protein signaling pathway(GO:0008277) |
| 0.1 | 0.7 | GO:0015012 | heparan sulfate proteoglycan biosynthetic process(GO:0015012) |
| 0.1 | 2.9 | GO:0039694 | viral RNA genome replication(GO:0039694) RNA replication(GO:0039703) |
| 0.1 | 0.7 | GO:0015811 | L-cystine transport(GO:0015811) |
| 0.1 | 1.4 | GO:0048012 | hepatocyte growth factor receptor signaling pathway(GO:0048012) |
| 0.1 | 0.6 | GO:0018231 | peptidyl-L-cysteine S-palmitoylation(GO:0018230) peptidyl-S-diacylglycerol-L-cysteine biosynthetic process from peptidyl-cysteine(GO:0018231) |
| 0.1 | 1.0 | GO:2000467 | insulin receptor signaling pathway via phosphatidylinositol 3-kinase(GO:0038028) positive regulation of glycogen (starch) synthase activity(GO:2000467) |
| 0.1 | 2.7 | GO:0034204 | lipid translocation(GO:0034204) phospholipid translocation(GO:0045332) |
| 0.1 | 1.9 | GO:0060716 | labyrinthine layer blood vessel development(GO:0060716) |
| 0.1 | 3.1 | GO:0042744 | hydrogen peroxide catabolic process(GO:0042744) |
| 0.1 | 0.7 | GO:0030324 | lung development(GO:0030324) |
| 0.1 | 2.4 | GO:0000042 | protein targeting to Golgi(GO:0000042) |
| 0.1 | 0.2 | GO:0000965 | mitochondrial RNA 3'-end processing(GO:0000965) |
| 0.1 | 3.5 | GO:0006699 | bile acid biosynthetic process(GO:0006699) |
| 0.1 | 3.1 | GO:0048268 | clathrin coat assembly(GO:0048268) |
| 0.1 | 2.1 | GO:0006749 | glutathione metabolic process(GO:0006749) |
| 0.1 | 0.5 | GO:0090080 | positive regulation of MAPKKK cascade by fibroblast growth factor receptor signaling pathway(GO:0090080) |
| 0.1 | 0.5 | GO:0060272 | embryonic skeletal joint morphogenesis(GO:0060272) |
| 0.1 | 1.8 | GO:0050930 | induction of positive chemotaxis(GO:0050930) |
| 0.1 | 1.9 | GO:0051412 | response to corticosterone(GO:0051412) |
| 0.1 | 0.2 | GO:0042746 | regulation of circadian sleep/wake cycle, wakefulness(GO:0010840) circadian sleep/wake cycle, wakefulness(GO:0042746) |
| 0.1 | 0.9 | GO:0045766 | positive regulation of angiogenesis(GO:0045766) |
| 0.1 | 0.4 | GO:0010513 | positive regulation of phosphatidylinositol biosynthetic process(GO:0010513) |
| 0.1 | 2.7 | GO:0070207 | protein homotrimerization(GO:0070207) |
| 0.1 | 0.3 | GO:0072709 | cellular response to sorbitol(GO:0072709) |
| 0.1 | 1.9 | GO:0016254 | preassembly of GPI anchor in ER membrane(GO:0016254) |
| 0.1 | 1.6 | GO:0006955 | immune response(GO:0006955) |
| 0.1 | 0.5 | GO:0016973 | poly(A)+ mRNA export from nucleus(GO:0016973) |
| 0.1 | 0.6 | GO:0000160 | phosphorelay signal transduction system(GO:0000160) |
| 0.1 | 0.4 | GO:1905097 | regulation of guanyl-nucleotide exchange factor activity(GO:1905097) |
| 0.1 | 0.6 | GO:0032464 | positive regulation of protein homooligomerization(GO:0032464) |
| 0.1 | 1.1 | GO:0046600 | negative regulation of centriole replication(GO:0046600) |
| 0.1 | 0.3 | GO:0072488 | carnitine shuttle(GO:0006853) ammonium transmembrane transport(GO:0072488) carnitine transmembrane transport(GO:1902603) |
| 0.1 | 0.4 | GO:1902268 | negative regulation of polyamine transmembrane transport(GO:1902268) |
| 0.1 | 0.3 | GO:1901838 | positive regulation of transcription of nuclear large rRNA transcript from RNA polymerase I promoter(GO:1901838) |
| 0.1 | 1.0 | GO:0031167 | rRNA methylation(GO:0031167) |
| 0.1 | 0.3 | GO:0032900 | negative regulation of low-density lipoprotein particle receptor catabolic process(GO:0032804) negative regulation of neurotrophin production(GO:0032900) negative regulation of transforming growth factor beta1 production(GO:0032911) negative regulation of transforming growth factor beta production(GO:0071635) |
| 0.1 | 0.3 | GO:0046013 | T cell homeostatic proliferation(GO:0001777) regulation of T cell homeostatic proliferation(GO:0046013) |
| 0.1 | 2.6 | GO:0018149 | peptide cross-linking(GO:0018149) |
| 0.1 | 2.3 | GO:0006458 | 'de novo' protein folding(GO:0006458) |
| 0.1 | 1.8 | GO:2000249 | regulation of actin cytoskeleton reorganization(GO:2000249) |
| 0.1 | 0.6 | GO:0034058 | endosomal vesicle fusion(GO:0034058) |
| 0.1 | 10.9 | GO:0034605 | cellular response to heat(GO:0034605) |
| 0.1 | 2.5 | GO:1901687 | glutathione derivative metabolic process(GO:1901685) glutathione derivative biosynthetic process(GO:1901687) |
| 0.1 | 0.2 | GO:2000342 | negative regulation of chemokine (C-X-C motif) ligand 2 production(GO:2000342) |
| 0.1 | 1.6 | GO:0036119 | response to platelet-derived growth factor(GO:0036119) cellular response to platelet-derived growth factor stimulus(GO:0036120) |
| 0.1 | 0.2 | GO:0048840 | otolith development(GO:0048840) |
| 0.1 | 1.6 | GO:0097120 | receptor localization to synapse(GO:0097120) |
| 0.1 | 1.2 | GO:1903955 | positive regulation of protein targeting to mitochondrion(GO:1903955) |
| 0.1 | 0.5 | GO:0015712 | hexose phosphate transport(GO:0015712) glucose-6-phosphate transport(GO:0015760) |
| 0.1 | 1.2 | GO:0010569 | regulation of double-strand break repair via homologous recombination(GO:0010569) |
| 0.1 | 0.4 | GO:0046606 | negative regulation of centrosome cycle(GO:0046606) |
| 0.1 | 0.4 | GO:0010927 | cellular component assembly involved in morphogenesis(GO:0010927) |
| 0.1 | 7.5 | GO:0006903 | vesicle targeting(GO:0006903) |
| 0.1 | 0.8 | GO:0032196 | transposition(GO:0032196) |
| 0.1 | 4.0 | GO:0070301 | cellular response to hydrogen peroxide(GO:0070301) |
| 0.1 | 0.8 | GO:0045747 | positive regulation of Notch signaling pathway(GO:0045747) |
| 0.1 | 0.6 | GO:0097190 | apoptotic signaling pathway(GO:0097190) |
| 0.1 | 0.5 | GO:0060484 | lung-associated mesenchyme development(GO:0060484) |
| 0.1 | 0.2 | GO:0038001 | paracrine signaling(GO:0038001) |
| 0.1 | 1.4 | GO:2000114 | regulation of establishment of cell polarity(GO:2000114) |
| 0.1 | 1.4 | GO:0097421 | liver regeneration(GO:0097421) |
| 0.1 | 0.1 | GO:0048537 | mucosal-associated lymphoid tissue development(GO:0048537) Peyer's patch development(GO:0048541) Peyer's patch morphogenesis(GO:0061146) |
| 0.1 | 1.6 | GO:0097503 | sialylation(GO:0097503) |
| 0.1 | 0.8 | GO:0050890 | cognition(GO:0050890) |
| 0.1 | 0.8 | GO:0007625 | grooming behavior(GO:0007625) |
| 0.1 | 2.4 | GO:1904893 | negative regulation of JAK-STAT cascade(GO:0046426) negative regulation of STAT cascade(GO:1904893) |
| 0.1 | 0.3 | GO:0015692 | lead ion transport(GO:0015692) |
| 0.1 | 5.5 | GO:0043547 | positive regulation of GTPase activity(GO:0043547) |
| 0.1 | 0.8 | GO:0070233 | negative regulation of T cell apoptotic process(GO:0070233) |
| 0.1 | 1.2 | GO:0005513 | detection of calcium ion(GO:0005513) |
| 0.1 | 0.4 | GO:0018344 | protein geranylgeranylation(GO:0018344) |
| 0.1 | 0.1 | GO:2000354 | regulation of ovarian follicle development(GO:2000354) |
| 0.1 | 0.8 | GO:0034391 | smooth muscle cell apoptotic process(GO:0034390) regulation of smooth muscle cell apoptotic process(GO:0034391) |
| 0.1 | 6.4 | GO:1902600 | hydrogen ion transmembrane transport(GO:1902600) |
| 0.1 | 0.5 | GO:0010452 | histone H3-K36 methylation(GO:0010452) |
| 0.1 | 0.4 | GO:0030579 | ubiquitin-dependent SMAD protein catabolic process(GO:0030579) |
| 0.1 | 0.4 | GO:0016554 | cytidine to uridine editing(GO:0016554) |
| 0.1 | 0.3 | GO:0045176 | apical protein localization(GO:0045176) |
| 0.1 | 0.6 | GO:0006491 | N-glycan processing(GO:0006491) |
| 0.1 | 2.1 | GO:0003407 | neural retina development(GO:0003407) |
| 0.1 | 0.5 | GO:0002098 | tRNA wobble uridine modification(GO:0002098) |
| 0.1 | 2.6 | GO:0001578 | microtubule bundle formation(GO:0001578) |
| 0.1 | 0.3 | GO:0001554 | luteolysis(GO:0001554) |
| 0.1 | 0.6 | GO:0051457 | maintenance of protein location in nucleus(GO:0051457) |
| 0.1 | 1.6 | GO:0010107 | potassium ion import(GO:0010107) |
| 0.1 | 0.9 | GO:0007169 | transmembrane receptor protein tyrosine kinase signaling pathway(GO:0007169) |
| 0.1 | 0.4 | GO:0060789 | hair follicle placode formation(GO:0060789) |
| 0.1 | 1.4 | GO:0000226 | microtubule cytoskeleton organization(GO:0000226) |
| 0.1 | 1.0 | GO:0007520 | myoblast fusion(GO:0007520) |
| 0.1 | 1.8 | GO:0000083 | regulation of transcription involved in G1/S transition of mitotic cell cycle(GO:0000083) |
| 0.1 | 0.7 | GO:0035435 | phosphate ion transmembrane transport(GO:0035435) |
| 0.1 | 0.5 | GO:0010818 | T cell chemotaxis(GO:0010818) |
| 0.0 | 2.6 | GO:0048477 | oogenesis(GO:0048477) |
| 0.0 | 0.6 | GO:0030202 | heparin metabolic process(GO:0030202) heparin biosynthetic process(GO:0030210) |
| 0.0 | 1.2 | GO:0002223 | stimulatory C-type lectin receptor signaling pathway(GO:0002223) |
| 0.0 | 2.0 | GO:0009408 | response to heat(GO:0009408) |
| 0.0 | 0.9 | GO:0007342 | fusion of sperm to egg plasma membrane(GO:0007342) |
| 0.0 | 0.7 | GO:0006833 | water transport(GO:0006833) |
| 0.0 | 0.6 | GO:0048568 | embryonic organ development(GO:0048568) |
| 0.0 | 0.3 | GO:0030321 | transepithelial chloride transport(GO:0030321) |
| 0.0 | 3.8 | GO:1990830 | response to leukemia inhibitory factor(GO:1990823) cellular response to leukemia inhibitory factor(GO:1990830) |
| 0.0 | 1.0 | GO:2000785 | regulation of autophagosome assembly(GO:2000785) |
| 0.0 | 0.5 | GO:1904896 | ESCRT complex disassembly(GO:1904896) ESCRT III complex disassembly(GO:1904903) |
| 0.0 | 0.6 | GO:0044804 | nucleophagy(GO:0044804) |
| 0.0 | 4.9 | GO:0007265 | Ras protein signal transduction(GO:0007265) |
| 0.0 | 0.2 | GO:2001023 | regulation of response to drug(GO:2001023) |
| 0.0 | 1.5 | GO:0080171 | lysosome organization(GO:0007040) lytic vacuole organization(GO:0080171) |
| 0.0 | 1.2 | GO:0007595 | lactation(GO:0007595) |
| 0.0 | 0.6 | GO:0007616 | long-term memory(GO:0007616) |
| 0.0 | 0.2 | GO:0015842 | aminergic neurotransmitter loading into synaptic vesicle(GO:0015842) |
| 0.0 | 0.2 | GO:0045725 | positive regulation of glycogen biosynthetic process(GO:0045725) |
| 0.0 | 0.2 | GO:0006824 | cobalt ion transport(GO:0006824) |
| 0.0 | 1.9 | GO:0042100 | B cell proliferation(GO:0042100) |
| 0.0 | 2.2 | GO:0030282 | bone mineralization(GO:0030282) |
| 0.0 | 0.8 | GO:0007205 | protein kinase C-activating G-protein coupled receptor signaling pathway(GO:0007205) |
| 0.0 | 1.4 | GO:1903146 | regulation of mitophagy(GO:1903146) |
| 0.0 | 0.8 | GO:0019228 | neuronal action potential(GO:0019228) |
| 0.0 | 0.1 | GO:0043031 | negative regulation of macrophage activation(GO:0043031) |
| 0.0 | 0.2 | GO:0060044 | negative regulation of cardiac muscle cell proliferation(GO:0060044) |
| 0.0 | 0.1 | GO:0045852 | pH elevation(GO:0045852) intracellular pH elevation(GO:0051454) |
| 0.0 | 0.8 | GO:0050901 | leukocyte tethering or rolling(GO:0050901) leukocyte adhesion to vascular endothelial cell(GO:0061756) |
| 0.0 | 3.0 | GO:0048813 | dendrite morphogenesis(GO:0048813) |
| 0.0 | 0.5 | GO:0035418 | protein localization to synapse(GO:0035418) |
| 0.0 | 0.2 | GO:0070424 | regulation of nucleotide-binding oligomerization domain containing signaling pathway(GO:0070424) |
| 0.0 | 1.4 | GO:0007368 | determination of left/right symmetry(GO:0007368) |
| 0.0 | 0.2 | GO:0006848 | pyruvate transport(GO:0006848) pyruvate transmembrane transport(GO:1901475) |
| 0.0 | 3.3 | GO:0006334 | nucleosome assembly(GO:0006334) |
| 0.0 | 1.2 | GO:0045652 | regulation of megakaryocyte differentiation(GO:0045652) |
| 0.0 | 1.2 | GO:0035914 | skeletal muscle cell differentiation(GO:0035914) |
| 0.0 | 0.6 | GO:0042108 | positive regulation of cytokine biosynthetic process(GO:0042108) |
| 0.0 | 1.2 | GO:0060349 | bone morphogenesis(GO:0060349) |
| 0.0 | 0.5 | GO:0015695 | organic cation transport(GO:0015695) |
| 0.0 | 0.1 | GO:0034343 | type III interferon production(GO:0034343) regulation of type III interferon production(GO:0034344) |
| 0.0 | 0.3 | GO:0006611 | protein export from nucleus(GO:0006611) |
| 0.0 | 0.5 | GO:0006068 | ethanol catabolic process(GO:0006068) |
| 0.0 | 1.3 | GO:0042771 | intrinsic apoptotic signaling pathway in response to DNA damage by p53 class mediator(GO:0042771) |
| 0.0 | 0.2 | GO:0006030 | chitin metabolic process(GO:0006030) chitin catabolic process(GO:0006032) |
| 0.0 | 1.9 | GO:0006096 | glycolytic process(GO:0006096) ATP generation from ADP(GO:0006757) |
| 0.0 | 0.6 | GO:0032411 | positive regulation of transporter activity(GO:0032411) |
| 0.0 | 1.9 | GO:0030218 | erythrocyte differentiation(GO:0030218) |
| 0.0 | 0.7 | GO:0051437 | negative regulation of ubiquitin-protein ligase activity involved in mitotic cell cycle(GO:0051436) positive regulation of ubiquitin-protein ligase activity involved in regulation of mitotic cell cycle transition(GO:0051437) regulation of ubiquitin-protein ligase activity involved in mitotic cell cycle(GO:0051439) |
| 0.0 | 0.4 | GO:0046676 | negative regulation of insulin secretion(GO:0046676) |
| 0.0 | 0.0 | GO:0061196 | branch elongation involved in ureteric bud branching(GO:0060681) fungiform papilla development(GO:0061196) negative regulation of mesonephros development(GO:0061218) cranial ganglion development(GO:0061550) trigeminal ganglion development(GO:0061551) regulation of branch elongation involved in ureteric bud branching(GO:0072095) ureter development(GO:0072189) ureter smooth muscle development(GO:0072191) ureter smooth muscle cell differentiation(GO:0072193) mesenchymal cell proliferation involved in ureter development(GO:0072198) regulation of mesenchymal cell proliferation involved in ureter development(GO:0072199) negative regulation of branching involved in ureteric bud morphogenesis(GO:0090191) |
| 0.0 | 2.7 | GO:0007601 | visual perception(GO:0007601) |
| 0.0 | 0.3 | GO:0006295 | nucleotide-excision repair, preincision complex stabilization(GO:0006293) nucleotide-excision repair, DNA incision, 3'-to lesion(GO:0006295) |
| 0.0 | 0.6 | GO:0035196 | production of miRNAs involved in gene silencing by miRNA(GO:0035196) |
| 0.0 | 0.1 | GO:0072332 | intrinsic apoptotic signaling pathway by p53 class mediator(GO:0072332) |
| 0.0 | 0.8 | GO:0035722 | interleukin-12-mediated signaling pathway(GO:0035722) cellular response to interleukin-12(GO:0071349) |
| 0.0 | 0.3 | GO:0001682 | tRNA 5'-leader removal(GO:0001682) |
| 0.0 | 0.6 | GO:0035690 | cellular response to drug(GO:0035690) |
| 0.0 | 0.0 | GO:0007212 | dopamine receptor signaling pathway(GO:0007212) |
| 0.0 | 0.7 | GO:0035308 | negative regulation of dephosphorylation(GO:0035305) negative regulation of protein dephosphorylation(GO:0035308) |
| 0.0 | 0.4 | GO:0030212 | hyaluronan metabolic process(GO:0030212) |
| 0.0 | 0.5 | GO:0006898 | receptor-mediated endocytosis(GO:0006898) |
| 0.0 | 0.1 | GO:0001676 | long-chain fatty acid metabolic process(GO:0001676) |
| 0.0 | 0.8 | GO:0018107 | peptidyl-threonine phosphorylation(GO:0018107) |
| 0.0 | 0.2 | GO:1901652 | response to peptide(GO:1901652) |
| 0.0 | 0.5 | GO:0006813 | potassium ion transport(GO:0006813) |
| 0.0 | 0.1 | GO:0055003 | cardiac myofibril assembly(GO:0055003) |
| 0.0 | 0.1 | GO:0034374 | low-density lipoprotein particle remodeling(GO:0034374) |
| 0.0 | 0.4 | GO:0016486 | peptide hormone processing(GO:0016486) |
Gene overrepresentation in cellular_component category:
| Log-likelihood per target | Total log-likelihood | Term | Description |
|---|---|---|---|
| 2.3 | 11.6 | GO:0097179 | protease inhibitor complex(GO:0097179) |
| 1.9 | 7.6 | GO:0097224 | sperm connecting piece(GO:0097224) |
| 1.7 | 36.1 | GO:0042613 | MHC class II protein complex(GO:0042613) |
| 1.6 | 6.3 | GO:0032144 | 4-aminobutyrate transaminase complex(GO:0032144) |
| 1.5 | 10.2 | GO:0032584 | growth cone membrane(GO:0032584) |
| 1.3 | 3.9 | GO:0071749 | IgA immunoglobulin complex(GO:0071745) IgA immunoglobulin complex, circulating(GO:0071746) monomeric IgA immunoglobulin complex(GO:0071748) polymeric IgA immunoglobulin complex(GO:0071749) secretory IgA immunoglobulin complex(GO:0071751) |
| 1.2 | 3.7 | GO:0008282 | ATP-sensitive potassium channel complex(GO:0008282) |
| 1.2 | 8.3 | GO:0036021 | endolysosome lumen(GO:0036021) |
| 1.1 | 22.6 | GO:0001891 | phagocytic cup(GO:0001891) |
| 1.0 | 5.1 | GO:0005602 | complement component C1 complex(GO:0005602) |
| 1.0 | 4.9 | GO:0044530 | supraspliceosomal complex(GO:0044530) |
| 0.9 | 15.1 | GO:0097512 | cardiac myofibril(GO:0097512) |
| 0.9 | 14.5 | GO:0097418 | neurofibrillary tangle(GO:0097418) |
| 0.9 | 10.7 | GO:0005744 | mitochondrial inner membrane presequence translocase complex(GO:0005744) |
| 0.9 | 6.0 | GO:0045252 | oxoglutarate dehydrogenase complex(GO:0045252) |
| 0.8 | 3.3 | GO:0005896 | interleukin-6 receptor complex(GO:0005896) |
| 0.8 | 4.8 | GO:0033063 | DNA recombinase mediator complex(GO:0033061) Rad51B-Rad51C-Rad51D-XRCC2 complex(GO:0033063) |
| 0.7 | 23.6 | GO:0035371 | microtubule plus-end(GO:0035371) |
| 0.7 | 3.6 | GO:0089701 | U2AF(GO:0089701) |
| 0.7 | 9.3 | GO:1990454 | L-type voltage-gated calcium channel complex(GO:1990454) |
| 0.7 | 9.3 | GO:0034993 | microtubule organizing center attachment site(GO:0034992) LINC complex(GO:0034993) |
| 0.7 | 5.5 | GO:0097504 | Gemini of coiled bodies(GO:0097504) |
| 0.7 | 4.6 | GO:0014701 | junctional sarcoplasmic reticulum membrane(GO:0014701) |
| 0.6 | 9.6 | GO:0005952 | cAMP-dependent protein kinase complex(GO:0005952) |
| 0.6 | 19.0 | GO:0042101 | T cell receptor complex(GO:0042101) |
| 0.6 | 10.0 | GO:0045277 | respiratory chain complex IV(GO:0045277) |
| 0.6 | 8.1 | GO:0005833 | hemoglobin complex(GO:0005833) |
| 0.6 | 2.3 | GO:0097449 | astrocyte projection(GO:0097449) |
| 0.6 | 6.9 | GO:0032045 | guanyl-nucleotide exchange factor complex(GO:0032045) |
| 0.6 | 1.7 | GO:0002945 | cyclin K-CDK13 complex(GO:0002945) |
| 0.6 | 9.6 | GO:0033270 | paranode region of axon(GO:0033270) |
| 0.6 | 7.9 | GO:0098647 | collagen type VI trimer(GO:0005589) collagen beaded filament(GO:0098647) |
| 0.6 | 3.9 | GO:1990635 | proximal dendrite(GO:1990635) |
| 0.5 | 1.6 | GO:0005583 | fibrillar collagen trimer(GO:0005583) banded collagen fibril(GO:0098643) |
| 0.5 | 8.3 | GO:0043020 | NADPH oxidase complex(GO:0043020) |
| 0.5 | 2.4 | GO:0071546 | pi-body(GO:0071546) |
| 0.4 | 3.9 | GO:0005721 | pericentric heterochromatin(GO:0005721) |
| 0.4 | 2.5 | GO:0097442 | CA3 pyramidal cell dendrite(GO:0097442) |
| 0.4 | 3.7 | GO:0016013 | syntrophin complex(GO:0016013) |
| 0.4 | 19.5 | GO:0001772 | immunological synapse(GO:0001772) |
| 0.4 | 2.8 | GO:0014802 | terminal cisterna(GO:0014802) |
| 0.4 | 6.0 | GO:0005641 | nuclear envelope lumen(GO:0005641) |
| 0.4 | 6.3 | GO:0043194 | axon initial segment(GO:0043194) |
| 0.4 | 3.1 | GO:0045180 | basal cortex(GO:0045180) |
| 0.4 | 2.3 | GO:0097025 | MPP7-DLG1-LIN7 complex(GO:0097025) |
| 0.4 | 1.9 | GO:0034688 | integrin alphaM-beta2 complex(GO:0034688) |
| 0.3 | 10.1 | GO:0044298 | neuronal cell body membrane(GO:0032809) cell body membrane(GO:0044298) |
| 0.3 | 1.4 | GO:1990246 | uniplex complex(GO:1990246) |
| 0.3 | 13.6 | GO:0005720 | nuclear heterochromatin(GO:0005720) |
| 0.3 | 0.6 | GO:0043159 | acrosomal matrix(GO:0043159) |
| 0.3 | 13.6 | GO:0048786 | presynaptic active zone(GO:0048786) |
| 0.3 | 0.8 | GO:0005879 | axonemal microtubule(GO:0005879) |
| 0.3 | 4.1 | GO:0030130 | clathrin coat of trans-Golgi network vesicle(GO:0030130) |
| 0.3 | 1.1 | GO:0072536 | interleukin-23 receptor complex(GO:0072536) |
| 0.3 | 12.4 | GO:0042571 | immunoglobulin complex, circulating(GO:0042571) |
| 0.3 | 3.6 | GO:0001673 | male germ cell nucleus(GO:0001673) |
| 0.2 | 1.2 | GO:0000408 | EKC/KEOPS complex(GO:0000408) |
| 0.2 | 1.7 | GO:0031089 | platelet dense granule lumen(GO:0031089) |
| 0.2 | 2.2 | GO:0034399 | nuclear periphery(GO:0034399) |
| 0.2 | 5.0 | GO:0016010 | dystrophin-associated glycoprotein complex(GO:0016010) glycoprotein complex(GO:0090665) |
| 0.2 | 2.5 | GO:0030008 | TRAPP complex(GO:0030008) |
| 0.2 | 9.7 | GO:0043596 | nuclear replication fork(GO:0043596) |
| 0.2 | 3.9 | GO:0030140 | trans-Golgi network transport vesicle(GO:0030140) |
| 0.2 | 2.1 | GO:0071953 | elastic fiber(GO:0071953) |
| 0.2 | 0.6 | GO:0097342 | ripoptosome(GO:0097342) |
| 0.2 | 1.2 | GO:1990357 | terminal web(GO:1990357) |
| 0.2 | 4.9 | GO:0000784 | nuclear chromosome, telomeric region(GO:0000784) |
| 0.2 | 3.9 | GO:0044295 | axonal growth cone(GO:0044295) |
| 0.2 | 1.1 | GO:0042406 | extrinsic component of endoplasmic reticulum membrane(GO:0042406) |
| 0.2 | 2.3 | GO:0033180 | proton-transporting V-type ATPase, V1 domain(GO:0033180) |
| 0.2 | 1.2 | GO:0043240 | Fanconi anaemia nuclear complex(GO:0043240) |
| 0.2 | 37.8 | GO:0043209 | myelin sheath(GO:0043209) |
| 0.2 | 10.3 | GO:0031201 | SNARE complex(GO:0031201) |
| 0.2 | 2.4 | GO:0031045 | dense core granule(GO:0031045) |
| 0.2 | 0.9 | GO:0034448 | EGO complex(GO:0034448) Gtr1-Gtr2 GTPase complex(GO:1990131) |
| 0.2 | 1.5 | GO:0008385 | IkappaB kinase complex(GO:0008385) |
| 0.1 | 1.3 | GO:0000125 | PCAF complex(GO:0000125) |
| 0.1 | 50.8 | GO:0045121 | membrane raft(GO:0045121) |
| 0.1 | 2.9 | GO:0034451 | centriolar satellite(GO:0034451) |
| 0.1 | 7.1 | GO:0001533 | cornified envelope(GO:0001533) |
| 0.1 | 1.1 | GO:0005593 | FACIT collagen trimer(GO:0005593) |
| 0.1 | 14.2 | GO:0031093 | platelet alpha granule lumen(GO:0031093) |
| 0.1 | 0.7 | GO:0005890 | sodium:potassium-exchanging ATPase complex(GO:0005890) |
| 0.1 | 0.5 | GO:0002177 | manchette(GO:0002177) |
| 0.1 | 6.9 | GO:0042734 | presynaptic membrane(GO:0042734) |
| 0.1 | 0.4 | GO:0030895 | apolipoprotein B mRNA editing enzyme complex(GO:0030895) |
| 0.1 | 1.0 | GO:0005579 | membrane attack complex(GO:0005579) |
| 0.1 | 4.9 | GO:0016235 | aggresome(GO:0016235) |
| 0.1 | 4.1 | GO:0001669 | acrosomal vesicle(GO:0001669) |
| 0.1 | 2.7 | GO:0005942 | phosphatidylinositol 3-kinase complex(GO:0005942) |
| 0.1 | 0.4 | GO:0005968 | Rab-protein geranylgeranyltransferase complex(GO:0005968) |
| 0.1 | 5.7 | GO:0055038 | recycling endosome membrane(GO:0055038) |
| 0.1 | 1.7 | GO:0031235 | intrinsic component of the cytoplasmic side of the plasma membrane(GO:0031235) |
| 0.1 | 1.0 | GO:0030914 | STAGA complex(GO:0030914) |
| 0.1 | 0.4 | GO:0030485 | smooth muscle contractile fiber(GO:0030485) |
| 0.1 | 0.3 | GO:0060077 | inhibitory synapse(GO:0060077) |
| 0.1 | 0.6 | GO:0097129 | cyclin D2-CDK4 complex(GO:0097129) |
| 0.1 | 0.5 | GO:0042272 | nuclear RNA export factor complex(GO:0042272) |
| 0.1 | 23.4 | GO:0045211 | postsynaptic membrane(GO:0045211) |
| 0.1 | 5.3 | GO:0043235 | receptor complex(GO:0043235) |
| 0.1 | 3.1 | GO:1904724 | tertiary granule lumen(GO:1904724) |
| 0.1 | 1.9 | GO:0005640 | nuclear outer membrane(GO:0005640) |
| 0.1 | 2.9 | GO:0005891 | voltage-gated calcium channel complex(GO:0005891) |
| 0.1 | 0.8 | GO:0072357 | PTW/PP1 phosphatase complex(GO:0072357) |
| 0.1 | 3.7 | GO:0031904 | endosome lumen(GO:0031904) |
| 0.1 | 9.2 | GO:0016363 | nuclear matrix(GO:0016363) |
| 0.1 | 1.3 | GO:0071437 | invadopodium(GO:0071437) |
| 0.1 | 3.5 | GO:0005801 | cis-Golgi network(GO:0005801) |
| 0.1 | 1.8 | GO:0005719 | nuclear euchromatin(GO:0005719) |
| 0.1 | 1.8 | GO:0005682 | U5 snRNP(GO:0005682) |
| 0.1 | 0.3 | GO:0070826 | paraferritin complex(GO:0070826) |
| 0.1 | 0.4 | GO:0097452 | GAIT complex(GO:0097452) |
| 0.1 | 0.8 | GO:0042622 | photoreceptor outer segment membrane(GO:0042622) |
| 0.1 | 10.4 | GO:0009898 | cytoplasmic side of plasma membrane(GO:0009898) |
| 0.1 | 4.6 | GO:0030176 | integral component of endoplasmic reticulum membrane(GO:0030176) |
| 0.1 | 23.6 | GO:0005635 | nuclear envelope(GO:0005635) |
| 0.1 | 1.5 | GO:0080008 | Cul4-RING E3 ubiquitin ligase complex(GO:0080008) |
| 0.1 | 2.2 | GO:0012507 | ER to Golgi transport vesicle membrane(GO:0012507) |
| 0.0 | 3.2 | GO:0016323 | basolateral plasma membrane(GO:0016323) |
| 0.0 | 2.2 | GO:0005791 | rough endoplasmic reticulum(GO:0005791) |
| 0.0 | 0.2 | GO:0060198 | clathrin-sculpted vesicle(GO:0060198) clathrin-sculpted monoamine transport vesicle(GO:0070081) clathrin-sculpted monoamine transport vesicle membrane(GO:0070083) |
| 0.0 | 5.6 | GO:0072562 | blood microparticle(GO:0072562) |
| 0.0 | 0.3 | GO:0000172 | ribonuclease MRP complex(GO:0000172) |
| 0.0 | 6.1 | GO:0005578 | proteinaceous extracellular matrix(GO:0005578) |
| 0.0 | 3.7 | GO:0035578 | azurophil granule lumen(GO:0035578) |
| 0.0 | 0.1 | GO:0031213 | RSF complex(GO:0031213) |
| 0.0 | 4.1 | GO:0005796 | Golgi lumen(GO:0005796) |
| 0.0 | 0.6 | GO:0034707 | chloride channel complex(GO:0034707) |
| 0.0 | 0.6 | GO:0097225 | sperm midpiece(GO:0097225) |
| 0.0 | 1.6 | GO:0043195 | terminal bouton(GO:0043195) |
| 0.0 | 0.5 | GO:0014704 | intercalated disc(GO:0014704) |
| 0.0 | 1.8 | GO:0045271 | mitochondrial respiratory chain complex I(GO:0005747) NADH dehydrogenase complex(GO:0030964) respiratory chain complex I(GO:0045271) |
| 0.0 | 0.7 | GO:0071564 | SWI/SNF complex(GO:0016514) npBAF complex(GO:0071564) |
| 0.0 | 0.1 | GO:0000308 | cytoplasmic cyclin-dependent protein kinase holoenzyme complex(GO:0000308) |
| 0.0 | 0.6 | GO:0034045 | pre-autophagosomal structure membrane(GO:0034045) |
| 0.0 | 0.3 | GO:0032420 | stereocilium(GO:0032420) |
| 0.0 | 0.2 | GO:0090544 | BAF-type complex(GO:0090544) |
| 0.0 | 0.0 | GO:0090533 | cation-transporting ATPase complex(GO:0090533) |
| 0.0 | 0.8 | GO:0005666 | DNA-directed RNA polymerase III complex(GO:0005666) |
| 0.0 | 46.3 | GO:0031226 | intrinsic component of plasma membrane(GO:0031226) |
| 0.0 | 0.3 | GO:0031588 | nucleotide-activated protein kinase complex(GO:0031588) |
| 0.0 | 0.2 | GO:0097539 | ciliary transition fiber(GO:0097539) |
| 0.0 | 2.2 | GO:0005814 | centriole(GO:0005814) |
| 0.0 | 0.7 | GO:0005680 | anaphase-promoting complex(GO:0005680) |
| 0.0 | 0.1 | GO:0005853 | eukaryotic translation elongation factor 1 complex(GO:0005853) |
| 0.0 | 0.4 | GO:0001917 | photoreceptor inner segment(GO:0001917) |
| 0.0 | 0.2 | GO:0070069 | cytochrome complex(GO:0070069) |
| 0.0 | 0.2 | GO:0030015 | CCR4-NOT core complex(GO:0030015) |
| 0.0 | 21.6 | GO:0005615 | extracellular space(GO:0005615) |
| 0.0 | 0.2 | GO:0031526 | brush border membrane(GO:0031526) |
| 0.0 | 3.7 | GO:0009986 | cell surface(GO:0009986) |
| 0.0 | 0.1 | GO:0044666 | MLL3/4 complex(GO:0044666) |
| 0.0 | 0.9 | GO:0008023 | transcription elongation factor complex(GO:0008023) |
| 0.0 | 1.0 | GO:0055037 | recycling endosome(GO:0055037) |
| 0.0 | 0.6 | GO:1990391 | DNA repair complex(GO:1990391) |
| 0.0 | 0.5 | GO:0043204 | perikaryon(GO:0043204) |
| 0.0 | 0.9 | GO:0032993 | protein-DNA complex(GO:0032993) |
| 0.0 | 0.5 | GO:0031225 | anchored component of membrane(GO:0031225) |
Gene overrepresentation in molecular_function category:
| Log-likelihood per target | Total log-likelihood | Term | Description |
|---|---|---|---|
| 3.4 | 10.1 | GO:0016495 | C-X3-C chemokine receptor activity(GO:0016495) |
| 2.8 | 11.3 | GO:0019770 | IgG receptor activity(GO:0019770) |
| 2.4 | 7.3 | GO:0047696 | beta-adrenergic receptor kinase activity(GO:0047696) |
| 2.2 | 13.4 | GO:0004705 | JUN kinase activity(GO:0004705) SAP kinase activity(GO:0016909) |
| 2.1 | 6.4 | GO:0004797 | deoxycytidine kinase activity(GO:0004137) thymidine kinase activity(GO:0004797) |
| 2.0 | 5.9 | GO:0005174 | CD40 receptor binding(GO:0005174) |
| 1.9 | 5.7 | GO:0016434 | rRNA (cytosine) methyltransferase activity(GO:0016434) |
| 1.8 | 100.7 | GO:0017080 | sodium channel regulator activity(GO:0017080) |
| 1.7 | 6.9 | GO:0035373 | chondroitin sulfate proteoglycan binding(GO:0035373) |
| 1.6 | 8.2 | GO:0048248 | CXCR3 chemokine receptor binding(GO:0048248) |
| 1.6 | 6.3 | GO:0003867 | 4-aminobutyrate transaminase activity(GO:0003867) succinate-semialdehyde dehydrogenase binding(GO:0032145) (S)-3-amino-2-methylpropionate transaminase activity(GO:0047298) |
| 1.5 | 7.6 | GO:0004995 | tachykinin receptor activity(GO:0004995) |
| 1.4 | 6.9 | GO:1990430 | extracellular matrix protein binding(GO:1990430) |
| 1.3 | 5.3 | GO:0000822 | inositol hexakisphosphate binding(GO:0000822) |
| 1.2 | 3.7 | GO:0004464 | leukotriene-C4 synthase activity(GO:0004464) |
| 1.2 | 38.5 | GO:0023026 | MHC class II protein complex binding(GO:0023026) |
| 1.2 | 3.7 | GO:0008321 | Ral guanyl-nucleotide exchange factor activity(GO:0008321) |
| 1.2 | 6.2 | GO:0004699 | calcium-independent protein kinase C activity(GO:0004699) |
| 1.2 | 3.7 | GO:0005148 | prolactin receptor binding(GO:0005148) |
| 1.2 | 3.7 | GO:0032767 | copper-dependent protein binding(GO:0032767) |
| 1.2 | 6.0 | GO:0004591 | oxoglutarate dehydrogenase (succinyl-transferring) activity(GO:0004591) |
| 1.2 | 8.2 | GO:0015501 | glutamate:sodium symporter activity(GO:0015501) |
| 1.2 | 9.3 | GO:0086056 | voltage-gated calcium channel activity involved in AV node cell action potential(GO:0086056) |
| 1.2 | 4.6 | GO:0070996 | type 1 melanocortin receptor binding(GO:0070996) |
| 1.1 | 3.3 | GO:0019981 | interleukin-6 receptor activity(GO:0004915) interleukin-6 binding(GO:0019981) |
| 1.1 | 3.2 | GO:0008532 | N-acetyllactosaminide beta-1,3-N-acetylglucosaminyltransferase activity(GO:0008532) |
| 1.1 | 8.6 | GO:0004064 | arylesterase activity(GO:0004064) |
| 1.0 | 10.1 | GO:0036310 | annealing helicase activity(GO:0036310) |
| 1.0 | 9.8 | GO:0035727 | lysophosphatidic acid binding(GO:0035727) |
| 0.9 | 16.3 | GO:0005068 | transmembrane receptor protein tyrosine kinase adaptor activity(GO:0005068) |
| 0.9 | 8.5 | GO:0003720 | telomerase activity(GO:0003720) RNA-directed DNA polymerase activity(GO:0003964) |
| 0.8 | 5.7 | GO:0030021 | extracellular matrix structural constituent conferring compression resistance(GO:0030021) structural constituent of tooth enamel(GO:0030345) |
| 0.8 | 2.4 | GO:0016838 | carbon-oxygen lyase activity, acting on phosphates(GO:0016838) |
| 0.8 | 11.1 | GO:0050700 | CARD domain binding(GO:0050700) |
| 0.7 | 2.2 | GO:0015234 | thiamine transmembrane transporter activity(GO:0015234) thiamine uptake transmembrane transporter activity(GO:0015403) |
| 0.7 | 7.4 | GO:0004022 | alcohol dehydrogenase (NAD) activity(GO:0004022) |
| 0.7 | 2.2 | GO:0050528 | acyloxyacyl hydrolase activity(GO:0050528) |
| 0.7 | 14.5 | GO:0051787 | misfolded protein binding(GO:0051787) |
| 0.7 | 3.6 | GO:0030628 | pre-mRNA 3'-splice site binding(GO:0030628) |
| 0.7 | 2.1 | GO:0005549 | odorant binding(GO:0005549) |
| 0.7 | 2.1 | GO:0001596 | angiotensin type I receptor activity(GO:0001596) |
| 0.7 | 3.4 | GO:0090554 | phosphatidylcholine-translocating ATPase activity(GO:0090554) |
| 0.7 | 2.0 | GO:0005137 | interleukin-5 receptor binding(GO:0005137) |
| 0.6 | 18.0 | GO:0019865 | immunoglobulin binding(GO:0019865) |
| 0.6 | 14.0 | GO:0005095 | GTPase inhibitor activity(GO:0005095) |
| 0.6 | 7.6 | GO:0032027 | myosin light chain binding(GO:0032027) |
| 0.6 | 8.1 | GO:0005344 | oxygen transporter activity(GO:0005344) |
| 0.6 | 1.9 | GO:0016262 | protein N-acetylglucosaminyltransferase activity(GO:0016262) |
| 0.6 | 9.6 | GO:0004691 | cAMP-dependent protein kinase activity(GO:0004691) |
| 0.6 | 2.4 | GO:0015265 | glycerol channel activity(GO:0015254) urea channel activity(GO:0015265) |
| 0.6 | 2.3 | GO:0005134 | interleukin-2 receptor binding(GO:0005134) |
| 0.6 | 4.6 | GO:0034711 | inhibin binding(GO:0034711) |
| 0.6 | 5.8 | GO:0005094 | Rho GDP-dissociation inhibitor activity(GO:0005094) |
| 0.6 | 7.4 | GO:0001087 | transcription factor activity, sequence-specific DNA binding, RNA polymerase recruiting(GO:0001011) transcription factor activity, TFIIB-class binding(GO:0001087) |
| 0.5 | 110.6 | GO:0003823 | antigen binding(GO:0003823) |
| 0.5 | 3.6 | GO:0005223 | intracellular cGMP activated cation channel activity(GO:0005223) |
| 0.5 | 8.3 | GO:0030306 | ADP-ribosylation factor binding(GO:0030306) |
| 0.5 | 3.9 | GO:0008821 | crossover junction endodeoxyribonuclease activity(GO:0008821) |
| 0.5 | 14.5 | GO:0005212 | structural constituent of eye lens(GO:0005212) |
| 0.4 | 2.2 | GO:0044729 | hemi-methylated DNA-binding(GO:0044729) |
| 0.4 | 3.5 | GO:0051864 | histone demethylase activity (H3-K36 specific)(GO:0051864) |
| 0.4 | 14.5 | GO:0004709 | MAP kinase kinase kinase activity(GO:0004709) |
| 0.4 | 6.8 | GO:0097109 | neuroligin family protein binding(GO:0097109) |
| 0.4 | 1.3 | GO:0004574 | oligo-1,6-glucosidase activity(GO:0004574) |
| 0.4 | 8.3 | GO:0016175 | superoxide-generating NADPH oxidase activity(GO:0016175) |
| 0.4 | 19.4 | GO:0070888 | E-box binding(GO:0070888) |
| 0.4 | 2.9 | GO:0035005 | 1-phosphatidylinositol-4-phosphate 3-kinase activity(GO:0035005) |
| 0.4 | 8.0 | GO:0005149 | interleukin-1 receptor binding(GO:0005149) |
| 0.4 | 1.2 | GO:0032093 | SAM domain binding(GO:0032093) |
| 0.4 | 1.6 | GO:0052798 | beta-galactoside alpha-2,3-sialyltransferase activity(GO:0052798) |
| 0.4 | 2.3 | GO:0000285 | 1-phosphatidylinositol-3-phosphate 5-kinase activity(GO:0000285) |
| 0.4 | 3.8 | GO:0019957 | C-C chemokine binding(GO:0019957) |
| 0.4 | 12.3 | GO:0071889 | 14-3-3 protein binding(GO:0071889) |
| 0.4 | 2.3 | GO:0055131 | C3HC4-type RING finger domain binding(GO:0055131) |
| 0.4 | 2.2 | GO:0016715 | oxidoreductase activity, acting on paired donors, with incorporation or reduction of molecular oxygen, reduced ascorbate as one donor, and incorporation of one atom of oxygen(GO:0016715) |
| 0.4 | 8.4 | GO:0001968 | fibronectin binding(GO:0001968) |
| 0.4 | 2.2 | GO:0039552 | RIG-I binding(GO:0039552) |
| 0.4 | 1.1 | GO:0009378 | four-way junction helicase activity(GO:0009378) |
| 0.4 | 1.1 | GO:0030107 | HLA-A specific inhibitory MHC class I receptor activity(GO:0030107) |
| 0.3 | 6.6 | GO:0070530 | K63-linked polyubiquitin binding(GO:0070530) |
| 0.3 | 1.0 | GO:0016435 | rRNA (guanine) methyltransferase activity(GO:0016435) |
| 0.3 | 1.3 | GO:0008336 | gamma-butyrobetaine dioxygenase activity(GO:0008336) |
| 0.3 | 6.7 | GO:0034237 | protein kinase A regulatory subunit binding(GO:0034237) |
| 0.3 | 9.3 | GO:0005521 | lamin binding(GO:0005521) |
| 0.3 | 1.7 | GO:0002046 | opsin binding(GO:0002046) |
| 0.3 | 0.3 | GO:0008094 | DNA helicase activity(GO:0003678) DNA-dependent ATPase activity(GO:0008094) |
| 0.3 | 5.9 | GO:0005248 | voltage-gated sodium channel activity(GO:0005248) voltage-gated ion channel activity involved in regulation of postsynaptic membrane potential(GO:1905030) |
| 0.3 | 1.6 | GO:0060961 | phospholipase D inhibitor activity(GO:0060961) |
| 0.3 | 10.6 | GO:0071855 | neuropeptide receptor binding(GO:0071855) |
| 0.3 | 3.1 | GO:0043225 | anion transmembrane-transporting ATPase activity(GO:0043225) |
| 0.3 | 3.1 | GO:0004571 | mannosyl-oligosaccharide 1,2-alpha-mannosidase activity(GO:0004571) |
| 0.3 | 2.1 | GO:0030020 | extracellular matrix structural constituent conferring tensile strength(GO:0030020) |
| 0.3 | 1.8 | GO:0008559 | xenobiotic-transporting ATPase activity(GO:0008559) |
| 0.3 | 1.2 | GO:0031685 | adenosine receptor binding(GO:0031685) |
| 0.3 | 1.5 | GO:0060175 | brain-derived neurotrophic factor-activated receptor activity(GO:0060175) |
| 0.3 | 2.0 | GO:0016176 | superoxide-generating NADPH oxidase activator activity(GO:0016176) |
| 0.3 | 1.4 | GO:0043422 | protein kinase B binding(GO:0043422) |
| 0.3 | 5.1 | GO:0004143 | diacylglycerol kinase activity(GO:0004143) |
| 0.3 | 1.4 | GO:0016907 | G-protein coupled acetylcholine receptor activity(GO:0016907) |
| 0.3 | 20.0 | GO:0005089 | Rho guanyl-nucleotide exchange factor activity(GO:0005089) |
| 0.3 | 1.9 | GO:0001515 | opioid peptide activity(GO:0001515) |
| 0.3 | 1.1 | GO:0042020 | interleukin-23 binding(GO:0042019) interleukin-23 receptor activity(GO:0042020) |
| 0.3 | 6.3 | GO:0002162 | dystroglycan binding(GO:0002162) |
| 0.3 | 1.3 | GO:0004468 | lysine N-acetyltransferase activity, acting on acetyl phosphate as donor(GO:0004468) |
| 0.3 | 1.6 | GO:0036312 | phosphatidylinositol 3-kinase regulatory subunit binding(GO:0036312) |
| 0.3 | 7.4 | GO:0015002 | cytochrome-c oxidase activity(GO:0004129) heme-copper terminal oxidase activity(GO:0015002) oxidoreductase activity, acting on a heme group of donors, oxygen as acceptor(GO:0016676) |
| 0.3 | 6.6 | GO:0019198 | transmembrane receptor protein tyrosine phosphatase activity(GO:0005001) transmembrane receptor protein phosphatase activity(GO:0019198) |
| 0.3 | 0.8 | GO:0098640 | integrin binding involved in cell-matrix adhesion(GO:0098640) |
| 0.2 | 5.4 | GO:0003841 | 1-acylglycerol-3-phosphate O-acyltransferase activity(GO:0003841) lysophosphatidic acid acyltransferase activity(GO:0042171) lysophospholipid acyltransferase activity(GO:0071617) |
| 0.2 | 0.7 | GO:0004828 | serine-tRNA ligase activity(GO:0004828) |
| 0.2 | 0.7 | GO:0015018 | galactosylgalactosylxylosylprotein 3-beta-glucuronosyltransferase activity(GO:0015018) |
| 0.2 | 87.8 | GO:0030695 | GTPase regulator activity(GO:0030695) |
| 0.2 | 11.7 | GO:0050840 | extracellular matrix binding(GO:0050840) |
| 0.2 | 10.3 | GO:0005484 | SNAP receptor activity(GO:0005484) |
| 0.2 | 3.4 | GO:0005522 | profilin binding(GO:0005522) |
| 0.2 | 1.1 | GO:0004704 | NF-kappaB-inducing kinase activity(GO:0004704) |
| 0.2 | 0.4 | GO:0004663 | Rab geranylgeranyltransferase activity(GO:0004663) |
| 0.2 | 2.3 | GO:0005451 | monovalent cation:proton antiporter activity(GO:0005451) |
| 0.2 | 7.0 | GO:0008139 | nuclear localization sequence binding(GO:0008139) |
| 0.2 | 1.4 | GO:0016670 | oxidoreductase activity, acting on a sulfur group of donors, oxygen as acceptor(GO:0016670) |
| 0.2 | 2.7 | GO:0004726 | non-membrane spanning protein tyrosine phosphatase activity(GO:0004726) |
| 0.2 | 0.6 | GO:0070697 | activin receptor binding(GO:0070697) |
| 0.2 | 0.8 | GO:0004803 | transposase activity(GO:0004803) |
| 0.2 | 1.9 | GO:0001851 | complement component C3b binding(GO:0001851) |
| 0.2 | 0.8 | GO:0004657 | proline dehydrogenase activity(GO:0004657) |
| 0.2 | 1.9 | GO:0032794 | GTPase activating protein binding(GO:0032794) |
| 0.2 | 2.6 | GO:0016813 | hydrolase activity, acting on carbon-nitrogen (but not peptide) bonds, in linear amidines(GO:0016813) |
| 0.2 | 1.1 | GO:0003917 | DNA topoisomerase type I activity(GO:0003917) |
| 0.2 | 43.5 | GO:0051015 | actin filament binding(GO:0051015) |
| 0.2 | 0.7 | GO:0032810 | sterol response element binding(GO:0032810) |
| 0.2 | 1.8 | GO:0031701 | angiotensin receptor binding(GO:0031701) type 1 angiotensin receptor binding(GO:0031702) |
| 0.2 | 1.9 | GO:0001135 | transcription factor activity, RNA polymerase II transcription factor recruiting(GO:0001135) |
| 0.2 | 4.1 | GO:0043014 | alpha-tubulin binding(GO:0043014) |
| 0.2 | 3.5 | GO:0005545 | 1-phosphatidylinositol binding(GO:0005545) |
| 0.2 | 1.0 | GO:0003910 | DNA ligase (ATP) activity(GO:0003910) |
| 0.2 | 0.7 | GO:0016639 | oxidoreductase activity, acting on the CH-NH2 group of donors, NAD or NADP as acceptor(GO:0016639) |
| 0.2 | 0.8 | GO:0070095 | fructose-6-phosphate binding(GO:0070095) |
| 0.2 | 4.6 | GO:0042287 | MHC protein binding(GO:0042287) |
| 0.2 | 0.8 | GO:0004359 | glutaminase activity(GO:0004359) |
| 0.2 | 0.6 | GO:0000155 | phosphorelay sensor kinase activity(GO:0000155) |
| 0.2 | 3.2 | GO:0050321 | tau-protein kinase activity(GO:0050321) |
| 0.2 | 2.0 | GO:0022851 | GABA-gated chloride ion channel activity(GO:0022851) |
| 0.2 | 3.5 | GO:0005086 | ARF guanyl-nucleotide exchange factor activity(GO:0005086) |
| 0.1 | 0.7 | GO:0008420 | CTD phosphatase activity(GO:0008420) |
| 0.1 | 1.0 | GO:0097157 | pre-mRNA intronic binding(GO:0097157) |
| 0.1 | 1.4 | GO:0031698 | beta-2 adrenergic receptor binding(GO:0031698) |
| 0.1 | 0.4 | GO:0032184 | SUMO polymer binding(GO:0032184) |
| 0.1 | 1.2 | GO:0030215 | semaphorin receptor binding(GO:0030215) |
| 0.1 | 1.5 | GO:0070569 | uridylyltransferase activity(GO:0070569) |
| 0.1 | 2.7 | GO:0004012 | phospholipid-translocating ATPase activity(GO:0004012) |
| 0.1 | 2.1 | GO:0005200 | structural constituent of cytoskeleton(GO:0005200) |
| 0.1 | 0.5 | GO:0008422 | beta-glucosidase activity(GO:0008422) |
| 0.1 | 1.9 | GO:0032454 | histone demethylase activity (H3-K9 specific)(GO:0032454) |
| 0.1 | 1.4 | GO:1904264 | ubiquitin protein ligase activity involved in ERAD pathway(GO:1904264) |
| 0.1 | 0.6 | GO:0097199 | cysteine-type endopeptidase activity involved in apoptotic signaling pathway(GO:0097199) |
| 0.1 | 0.6 | GO:0019531 | oxalate transmembrane transporter activity(GO:0019531) |
| 0.1 | 2.1 | GO:0004993 | G-protein coupled serotonin receptor activity(GO:0004993) |
| 0.1 | 4.4 | GO:0030507 | spectrin binding(GO:0030507) |
| 0.1 | 2.7 | GO:0001056 | RNA polymerase III activity(GO:0001056) |
| 0.1 | 1.4 | GO:0017034 | Rap guanyl-nucleotide exchange factor activity(GO:0017034) |
| 0.1 | 12.6 | GO:0003774 | motor activity(GO:0003774) |
| 0.1 | 3.6 | GO:0003950 | NAD+ ADP-ribosyltransferase activity(GO:0003950) |
| 0.1 | 2.4 | GO:0004550 | nucleoside diphosphate kinase activity(GO:0004550) |
| 0.1 | 0.8 | GO:0048101 | calcium- and calmodulin-regulated 3',5'-cyclic-GMP phosphodiesterase activity(GO:0048101) |
| 0.1 | 1.6 | GO:0016018 | cyclosporin A binding(GO:0016018) |
| 0.1 | 1.2 | GO:0022820 | potassium:chloride symporter activity(GO:0015379) potassium ion symporter activity(GO:0022820) |
| 0.1 | 0.8 | GO:0004652 | polynucleotide adenylyltransferase activity(GO:0004652) |
| 0.1 | 0.5 | GO:0017159 | pantetheine hydrolase activity(GO:0017159) |
| 0.1 | 3.3 | GO:0015248 | sterol transporter activity(GO:0015248) |
| 0.1 | 0.5 | GO:0015562 | efflux transmembrane transporter activity(GO:0015562) |
| 0.1 | 1.2 | GO:0042056 | chemoattractant activity(GO:0042056) |
| 0.1 | 1.3 | GO:0097371 | MDM2/MDM4 family protein binding(GO:0097371) |
| 0.1 | 0.9 | GO:0000150 | recombinase activity(GO:0000150) |
| 0.1 | 0.5 | GO:0016300 | tRNA (uracil) methyltransferase activity(GO:0016300) |
| 0.1 | 1.0 | GO:0017049 | GTP-Rho binding(GO:0017049) |
| 0.1 | 0.6 | GO:0015016 | [heparan sulfate]-glucosamine N-sulfotransferase activity(GO:0015016) |
| 0.1 | 2.3 | GO:0071949 | FAD binding(GO:0071949) |
| 0.1 | 0.8 | GO:0019870 | potassium channel inhibitor activity(GO:0019870) |
| 0.1 | 1.4 | GO:0004602 | glutathione peroxidase activity(GO:0004602) |
| 0.1 | 0.4 | GO:0051373 | FATZ binding(GO:0051373) |
| 0.1 | 2.3 | GO:0046961 | proton-transporting ATPase activity, rotational mechanism(GO:0046961) |
| 0.1 | 1.9 | GO:0004115 | 3',5'-cyclic-AMP phosphodiesterase activity(GO:0004115) |
| 0.1 | 0.4 | GO:0008073 | ornithine decarboxylase inhibitor activity(GO:0008073) |
| 0.1 | 0.3 | GO:0044547 | DNA topoisomerase binding(GO:0044547) |
| 0.1 | 2.9 | GO:0005109 | frizzled binding(GO:0005109) |
| 0.1 | 1.8 | GO:0042609 | CD4 receptor binding(GO:0042609) |
| 0.1 | 6.1 | GO:0004004 | ATP-dependent RNA helicase activity(GO:0004004) |
| 0.1 | 13.9 | GO:0008017 | microtubule binding(GO:0008017) |
| 0.1 | 0.5 | GO:0047894 | flavonol 3-sulfotransferase activity(GO:0047894) steroid sulfotransferase activity(GO:0050294) |
| 0.1 | 3.6 | GO:0004364 | glutathione transferase activity(GO:0004364) |
| 0.1 | 20.6 | GO:0001227 | transcriptional repressor activity, RNA polymerase II transcription regulatory region sequence-specific binding(GO:0001227) |
| 0.1 | 0.7 | GO:0015250 | water transmembrane transporter activity(GO:0005372) water channel activity(GO:0015250) |
| 0.1 | 1.4 | GO:0004869 | cysteine-type endopeptidase inhibitor activity(GO:0004869) |
| 0.1 | 1.7 | GO:0008353 | RNA polymerase II carboxy-terminal domain kinase activity(GO:0008353) |
| 0.1 | 2.4 | GO:0008395 | steroid hydroxylase activity(GO:0008395) |
| 0.1 | 0.5 | GO:0032393 | MHC class I receptor activity(GO:0032393) |
| 0.1 | 7.8 | GO:0004222 | metalloendopeptidase activity(GO:0004222) |
| 0.1 | 2.2 | GO:0031624 | ubiquitin conjugating enzyme binding(GO:0031624) |
| 0.1 | 0.9 | GO:0019841 | retinol binding(GO:0019841) |
| 0.1 | 0.9 | GO:0008201 | heparin binding(GO:0008201) |
| 0.1 | 1.0 | GO:0008327 | methyl-CpG binding(GO:0008327) |
| 0.1 | 2.2 | GO:0030246 | carbohydrate binding(GO:0030246) |
| 0.1 | 11.8 | GO:0004252 | serine-type endopeptidase activity(GO:0004252) |
| 0.1 | 0.2 | GO:0015222 | serotonin transmembrane transporter activity(GO:0015222) |
| 0.1 | 0.3 | GO:0015087 | cadmium ion transmembrane transporter activity(GO:0015086) cobalt ion transmembrane transporter activity(GO:0015087) lead ion transmembrane transporter activity(GO:0015094) ferrous iron uptake transmembrane transporter activity(GO:0015639) |
| 0.1 | 2.5 | GO:0017112 | Rab guanyl-nucleotide exchange factor activity(GO:0017112) |
| 0.1 | 2.2 | GO:0051019 | mitogen-activated protein kinase binding(GO:0051019) |
| 0.1 | 0.7 | GO:0008020 | G-protein coupled photoreceptor activity(GO:0008020) |
| 0.1 | 1.8 | GO:0004683 | calmodulin-dependent protein kinase activity(GO:0004683) |
| 0.1 | 1.4 | GO:0017075 | syntaxin-1 binding(GO:0017075) |
| 0.1 | 0.5 | GO:0046975 | histone methyltransferase activity (H3-K36 specific)(GO:0046975) |
| 0.1 | 3.3 | GO:0015459 | potassium channel regulator activity(GO:0015459) |
| 0.1 | 0.8 | GO:0005243 | gap junction channel activity(GO:0005243) |
| 0.1 | 2.7 | GO:0005178 | integrin binding(GO:0005178) |
| 0.1 | 0.9 | GO:0043522 | leucine zipper domain binding(GO:0043522) |
| 0.1 | 0.2 | GO:0008195 | phosphatidate phosphatase activity(GO:0008195) |
| 0.1 | 0.8 | GO:0008239 | dipeptidyl-peptidase activity(GO:0008239) |
| 0.1 | 0.3 | GO:0045029 | UDP-activated nucleotide receptor activity(GO:0045029) |
| 0.1 | 0.5 | GO:0004321 | fatty-acyl-CoA synthase activity(GO:0004321) |
| 0.1 | 1.2 | GO:0016747 | transferase activity, transferring acyl groups other than amino-acyl groups(GO:0016747) |
| 0.1 | 0.2 | GO:0016499 | orexin receptor activity(GO:0016499) |
| 0.0 | 0.9 | GO:0008510 | sodium:bicarbonate symporter activity(GO:0008510) |
| 0.0 | 0.2 | GO:0005477 | pyruvate secondary active transmembrane transporter activity(GO:0005477) |
| 0.0 | 2.3 | GO:0004693 | cyclin-dependent protein serine/threonine kinase activity(GO:0004693) |
| 0.0 | 1.5 | GO:0005504 | fatty acid binding(GO:0005504) |
| 0.0 | 1.3 | GO:0004385 | guanylate kinase activity(GO:0004385) |
| 0.0 | 1.3 | GO:0036002 | pre-mRNA binding(GO:0036002) |
| 0.0 | 1.9 | GO:0004715 | non-membrane spanning protein tyrosine kinase activity(GO:0004715) |
| 0.0 | 0.7 | GO:0004859 | phospholipase inhibitor activity(GO:0004859) |
| 0.0 | 0.2 | GO:0008508 | bile acid:sodium symporter activity(GO:0008508) |
| 0.0 | 1.8 | GO:0017048 | Rho GTPase binding(GO:0017048) |
| 0.0 | 0.6 | GO:0019706 | protein-cysteine S-palmitoyltransferase activity(GO:0019706) protein-cysteine S-acyltransferase activity(GO:0019707) |
| 0.0 | 0.6 | GO:0071837 | HMG box domain binding(GO:0071837) |
| 0.0 | 1.5 | GO:0019902 | phosphatase binding(GO:0019902) |
| 0.0 | 0.1 | GO:0008502 | melatonin receptor activity(GO:0008502) |
| 0.0 | 3.8 | GO:0017124 | SH3 domain binding(GO:0017124) |
| 0.0 | 1.0 | GO:0043539 | protein serine/threonine kinase activator activity(GO:0043539) |
| 0.0 | 2.0 | GO:0004712 | protein serine/threonine/tyrosine kinase activity(GO:0004712) |
| 0.0 | 0.1 | GO:0001594 | trace-amine receptor activity(GO:0001594) |
| 0.0 | 3.8 | GO:0005262 | calcium channel activity(GO:0005262) |
| 0.0 | 0.3 | GO:0004679 | AMP-activated protein kinase activity(GO:0004679) |
| 0.0 | 0.2 | GO:0031419 | cobalamin binding(GO:0031419) |
| 0.0 | 0.5 | GO:0035613 | RNA stem-loop binding(GO:0035613) |
| 0.0 | 0.8 | GO:0000983 | transcription factor activity, RNA polymerase II core promoter sequence-specific(GO:0000983) |
| 0.0 | 2.6 | GO:0008080 | N-acetyltransferase activity(GO:0008080) |
| 0.0 | 0.5 | GO:0008171 | O-methyltransferase activity(GO:0008171) |
| 0.0 | 1.3 | GO:0003924 | GTPase activity(GO:0003924) |
| 0.0 | 0.1 | GO:0031593 | polyubiquitin binding(GO:0031593) |
| 0.0 | 0.2 | GO:0004969 | histamine receptor activity(GO:0004969) |
| 0.0 | 1.9 | GO:0001618 | virus receptor activity(GO:0001618) |
| 0.0 | 0.1 | GO:0070892 | lipoteichoic acid receptor activity(GO:0070892) |
| 0.0 | 1.7 | GO:0098531 | RNA polymerase II transcription factor activity, ligand-activated sequence-specific DNA binding(GO:0004879) transcription factor activity, direct ligand regulated sequence-specific DNA binding(GO:0098531) |
| 0.0 | 0.2 | GO:0008503 | benzodiazepine receptor activity(GO:0008503) |
| 0.0 | 1.2 | GO:0051117 | ATPase binding(GO:0051117) |
| 0.0 | 0.3 | GO:0004526 | ribonuclease P activity(GO:0004526) |
| 0.0 | 2.3 | GO:0005516 | calmodulin binding(GO:0005516) |
| 0.0 | 0.2 | GO:0008061 | chitinase activity(GO:0004568) chitin binding(GO:0008061) |
| 0.0 | 0.4 | GO:0001784 | phosphotyrosine binding(GO:0001784) |
| 0.0 | 0.3 | GO:0008157 | protein phosphatase 1 binding(GO:0008157) |
| 0.0 | 0.2 | GO:0031435 | mitogen-activated protein kinase kinase kinase binding(GO:0031435) |
| 0.0 | 0.2 | GO:0005132 | type I interferon receptor binding(GO:0005132) |
| 0.0 | 0.2 | GO:0015467 | G-protein activated inward rectifier potassium channel activity(GO:0015467) |
| 0.0 | 0.2 | GO:0008484 | sulfuric ester hydrolase activity(GO:0008484) |
Gene overrepresentation in C2:CP category:
| Log-likelihood per target | Total log-likelihood | Term | Description |
|---|---|---|---|
| 0.5 | 9.2 | PID P38 MKK3 6PATHWAY | p38 MAPK signaling pathway |
| 0.5 | 12.4 | PID ANTHRAX PATHWAY | Cellular roles of Anthrax toxin |
| 0.4 | 19.5 | PID CD40 PATHWAY | CD40/CD40L signaling |
| 0.3 | 13.5 | PID IL12 STAT4 PATHWAY | IL12 signaling mediated by STAT4 |
| 0.3 | 10.8 | PID SYNDECAN 3 PATHWAY | Syndecan-3-mediated signaling events |
| 0.3 | 3.3 | ST STAT3 PATHWAY | STAT3 Pathway |
| 0.3 | 22.7 | PID NFAT TFPATHWAY | Calcineurin-regulated NFAT-dependent transcription in lymphocytes |
| 0.3 | 7.1 | PID ARF 3PATHWAY | Arf1 pathway |
| 0.3 | 14.9 | NABA PROTEOGLYCANS | Genes encoding proteoglycans |
| 0.3 | 18.5 | PID RAC1 PATHWAY | RAC1 signaling pathway |
| 0.3 | 12.7 | PID NCADHERIN PATHWAY | N-cadherin signaling events |
| 0.3 | 15.7 | PID RAC1 REG PATHWAY | Regulation of RAC1 activity |
| 0.2 | 2.3 | PID TCR RAS PATHWAY | Ras signaling in the CD4+ TCR pathway |
| 0.2 | 4.2 | SIG IL4RECEPTOR IN B LYPHOCYTES | Genes related to IL4 rceptor signaling in B lymphocytes |
| 0.2 | 3.8 | PID TCR JNK PATHWAY | JNK signaling in the CD4+ TCR pathway |
| 0.2 | 5.9 | PID IL12 2PATHWAY | IL12-mediated signaling events |
| 0.2 | 4.8 | PID IL3 PATHWAY | IL3-mediated signaling events |
| 0.2 | 6.1 | PID IL2 STAT5 PATHWAY | IL2 signaling events mediated by STAT5 |
| 0.2 | 4.0 | PID CONE PATHWAY | Visual signal transduction: Cones |
| 0.2 | 2.1 | PID ANGIOPOIETIN RECEPTOR PATHWAY | Angiopoietin receptor Tie2-mediated signaling |
| 0.2 | 3.9 | PID IL23 PATHWAY | IL23-mediated signaling events |
| 0.2 | 4.4 | PID CD8 TCR PATHWAY | TCR signaling in naïve CD8+ T cells |
| 0.1 | 14.6 | PID CMYB PATHWAY | C-MYB transcription factor network |
| 0.1 | 11.4 | PID CASPASE PATHWAY | Caspase cascade in apoptosis |
| 0.1 | 1.9 | PID AP1 PATHWAY | AP-1 transcription factor network |
| 0.1 | 15.2 | PID MYC REPRESS PATHWAY | Validated targets of C-MYC transcriptional repression |
| 0.1 | 1.9 | PID INTEGRIN CS PATHWAY | Integrin family cell surface interactions |
| 0.1 | 6.2 | PID ENDOTHELIN PATHWAY | Endothelins |
| 0.1 | 1.4 | PID TCR PATHWAY | TCR signaling in naïve CD4+ T cells |
| 0.1 | 1.8 | PID FAS PATHWAY | FAS (CD95) signaling pathway |
| 0.1 | 1.5 | PID IFNG PATHWAY | IFN-gamma pathway |
| 0.1 | 1.3 | ST G ALPHA S PATHWAY | G alpha s Pathway |
| 0.1 | 3.2 | PID FCER1 PATHWAY | Fc-epsilon receptor I signaling in mast cells |
| 0.1 | 1.9 | ST GA12 PATHWAY | G alpha 12 Pathway |
| 0.1 | 0.8 | PID INTEGRIN5 PATHWAY | Beta5 beta6 beta7 and beta8 integrin cell surface interactions |
| 0.1 | 4.3 | PID P75 NTR PATHWAY | p75(NTR)-mediated signaling |
| 0.1 | 1.0 | PID MYC PATHWAY | C-MYC pathway |
| 0.1 | 1.5 | PID RHODOPSIN PATHWAY | Visual signal transduction: Rods |
| 0.1 | 25.1 | NABA SECRETED FACTORS | Genes encoding secreted soluble factors |
| 0.1 | 2.1 | PID RETINOIC ACID PATHWAY | Retinoic acid receptors-mediated signaling |
| 0.1 | 15.8 | NABA ECM REGULATORS | Genes encoding enzymes and their regulators involved in the remodeling of the extracellular matrix |
| 0.0 | 0.4 | PID FRA PATHWAY | Validated transcriptional targets of AP1 family members Fra1 and Fra2 |
| 0.0 | 0.7 | PID PI3K PLC TRK PATHWAY | Trk receptor signaling mediated by PI3K and PLC-gamma |
| 0.0 | 0.7 | PID SMAD2 3PATHWAY | Regulation of cytoplasmic and nuclear SMAD2/3 signaling |
| 0.0 | 3.5 | PID HIF1 TFPATHWAY | HIF-1-alpha transcription factor network |
| 0.0 | 2.1 | PID HNF3A PATHWAY | FOXA1 transcription factor network |
| 0.0 | 0.3 | PID UPA UPAR PATHWAY | Urokinase-type plasminogen activator (uPA) and uPAR-mediated signaling |
| 0.0 | 2.4 | PID LKB1 PATHWAY | LKB1 signaling events |
| 0.0 | 1.6 | PID ALPHA SYNUCLEIN PATHWAY | Alpha-synuclein signaling |
| 0.0 | 0.3 | ST WNT BETA CATENIN PATHWAY | Wnt/beta-catenin Pathway |
| 0.0 | 1.0 | PID CXCR4 PATHWAY | CXCR4-mediated signaling events |
| 0.0 | 4.9 | NABA ECM AFFILIATED | Genes encoding proteins affiliated structurally or functionally to extracellular matrix proteins |
| 0.0 | 0.4 | PID PRL SIGNALING EVENTS PATHWAY | Signaling events mediated by PRL |
| 0.0 | 0.5 | PID RXR VDR PATHWAY | RXR and RAR heterodimerization with other nuclear receptor |
| 0.0 | 0.2 | PID EPHRINB REV PATHWAY | Ephrin B reverse signaling |
| 0.0 | 0.6 | PID BMP PATHWAY | BMP receptor signaling |
| 0.0 | 0.7 | PID LIS1 PATHWAY | Lissencephaly gene (LIS1) in neuronal migration and development |
| 0.0 | 0.2 | PID ATR PATHWAY | ATR signaling pathway |
| 0.0 | 0.2 | ST DIFFERENTIATION PATHWAY IN PC12 CELLS | Differentiation Pathway in PC12 Cells; this is a specific case of PAC1 Receptor Pathway. |
| 0.0 | 0.4 | PID SHP2 PATHWAY | SHP2 signaling |
| 0.0 | 0.2 | ST TUMOR NECROSIS FACTOR PATHWAY | Tumor Necrosis Factor Pathway. |
| 0.0 | 0.2 | PID INTEGRIN A9B1 PATHWAY | Alpha9 beta1 integrin signaling events |
| 0.0 | 0.1 | PID AR NONGENOMIC PATHWAY | Nongenotropic Androgen signaling |
| 0.0 | 0.6 | PID RHOA REG PATHWAY | Regulation of RhoA activity |
| 0.0 | 0.6 | ST INTEGRIN SIGNALING PATHWAY | Integrin Signaling Pathway |
| 0.0 | 0.3 | PID SMAD2 3NUCLEAR PATHWAY | Regulation of nuclear SMAD2/3 signaling |
| 0.0 | 0.5 | PID TAP63 PATHWAY | Validated transcriptional targets of TAp63 isoforms |
Gene overrepresentation in C2:CP:REACTOME category:
| Log-likelihood per target | Total log-likelihood | Term | Description |
|---|---|---|---|
| 0.9 | 14.9 | REACTOME PLATELET ADHESION TO EXPOSED COLLAGEN | Genes involved in Platelet Adhesion to exposed collagen |
| 0.8 | 8.3 | REACTOME ENDOSOMAL VACUOLAR PATHWAY | Genes involved in Endosomal/Vacuolar pathway |
| 0.7 | 14.9 | REACTOME JNK C JUN KINASES PHOSPHORYLATION AND ACTIVATION MEDIATED BY ACTIVATED HUMAN TAK1 | Genes involved in JNK (c-Jun kinases) phosphorylation and activation mediated by activated human TAK1 |
| 0.6 | 6.9 | REACTOME CREATION OF C4 AND C2 ACTIVATORS | Genes involved in Creation of C4 and C2 activators |
| 0.6 | 11.9 | REACTOME THE NLRP3 INFLAMMASOME | Genes involved in The NLRP3 inflammasome |
| 0.6 | 8.6 | REACTOME REVERSIBLE HYDRATION OF CARBON DIOXIDE | Genes involved in Reversible Hydration of Carbon Dioxide |
| 0.6 | 2.8 | REACTOME PHOSPHORYLATION OF CD3 AND TCR ZETA CHAINS | Genes involved in Phosphorylation of CD3 and TCR zeta chains |
| 0.6 | 10.1 | REACTOME NOREPINEPHRINE NEUROTRANSMITTER RELEASE CYCLE | Genes involved in Norepinephrine Neurotransmitter Release Cycle |
| 0.5 | 13.3 | REACTOME ADHERENS JUNCTIONS INTERACTIONS | Genes involved in Adherens junctions interactions |
| 0.5 | 23.5 | REACTOME DOWNSTREAM TCR SIGNALING | Genes involved in Downstream TCR signaling |
| 0.5 | 1.9 | REACTOME BINDING AND ENTRY OF HIV VIRION | Genes involved in Binding and entry of HIV virion |
| 0.4 | 77.8 | REACTOME SIGNALING BY RHO GTPASES | Genes involved in Signaling by Rho GTPases |
| 0.4 | 7.7 | REACTOME KERATAN SULFATE DEGRADATION | Genes involved in Keratan sulfate degradation |
| 0.4 | 19.2 | REACTOME MYOGENESIS | Genes involved in Myogenesis |
| 0.4 | 5.8 | REACTOME ANDROGEN BIOSYNTHESIS | Genes involved in Androgen biosynthesis |
| 0.4 | 6.5 | REACTOME DSCAM INTERACTIONS | Genes involved in DSCAM interactions |
| 0.3 | 20.2 | REACTOME CHEMOKINE RECEPTORS BIND CHEMOKINES | Genes involved in Chemokine receptors bind chemokines |
| 0.3 | 9.6 | REACTOME HORMONE SENSITIVE LIPASE HSL MEDIATED TRIACYLGLYCEROL HYDROLYSIS | Genes involved in Hormone-sensitive lipase (HSL)-mediated triacylglycerol hydrolysis |
| 0.3 | 11.3 | REACTOME EFFECTS OF PIP2 HYDROLYSIS | Genes involved in Effects of PIP2 hydrolysis |
| 0.3 | 10.5 | REACTOME INHIBITION OF INSULIN SECRETION BY ADRENALINE NORADRENALINE | Genes involved in Inhibition of Insulin Secretion by Adrenaline/Noradrenaline |
| 0.3 | 6.3 | REACTOME GABA SYNTHESIS RELEASE REUPTAKE AND DEGRADATION | Genes involved in GABA synthesis, release, reuptake and degradation |
| 0.3 | 6.9 | REACTOME CS DS DEGRADATION | Genes involved in CS/DS degradation |
| 0.3 | 3.4 | REACTOME ABACAVIR TRANSPORT AND METABOLISM | Genes involved in Abacavir transport and metabolism |
| 0.3 | 3.9 | REACTOME THE ROLE OF NEF IN HIV1 REPLICATION AND DISEASE PATHOGENESIS | Genes involved in The role of Nef in HIV-1 replication and disease pathogenesis |
| 0.3 | 34.8 | REACTOME MHC CLASS II ANTIGEN PRESENTATION | Genes involved in MHC class II antigen presentation |
| 0.3 | 8.2 | REACTOME GENERATION OF SECOND MESSENGER MOLECULES | Genes involved in Generation of second messenger molecules |
| 0.3 | 4.8 | REACTOME IL 6 SIGNALING | Genes involved in Interleukin-6 signaling |
| 0.2 | 5.7 | REACTOME PROTEOLYTIC CLEAVAGE OF SNARE COMPLEX PROTEINS | Genes involved in Proteolytic cleavage of SNARE complex proteins |
| 0.2 | 2.0 | REACTOME CD28 DEPENDENT VAV1 PATHWAY | Genes involved in CD28 dependent Vav1 pathway |
| 0.2 | 3.1 | REACTOME PASSIVE TRANSPORT BY AQUAPORINS | Genes involved in Passive Transport by Aquaporins |
| 0.2 | 4.8 | REACTOME KERATAN SULFATE BIOSYNTHESIS | Genes involved in Keratan sulfate biosynthesis |
| 0.2 | 6.2 | REACTOME SYNTHESIS OF PA | Genes involved in Synthesis of PA |
| 0.2 | 6.6 | REACTOME INTERACTION BETWEEN L1 AND ANKYRINS | Genes involved in Interaction between L1 and Ankyrins |
| 0.2 | 1.2 | REACTOME ADP SIGNALLING THROUGH P2RY1 | Genes involved in ADP signalling through P2Y purinoceptor 1 |
| 0.2 | 6.5 | REACTOME GROWTH HORMONE RECEPTOR SIGNALING | Genes involved in Growth hormone receptor signaling |
| 0.2 | 3.5 | REACTOME SYNTHESIS OF PIPS AT THE GOLGI MEMBRANE | Genes involved in Synthesis of PIPs at the Golgi membrane |
| 0.2 | 8.0 | REACTOME LATENT INFECTION OF HOMO SAPIENS WITH MYCOBACTERIUM TUBERCULOSIS | Genes involved in Latent infection of Homo sapiens with Mycobacterium tuberculosis |
| 0.2 | 6.4 | REACTOME PYRIMIDINE METABOLISM | Genes involved in Pyrimidine metabolism |
| 0.2 | 2.8 | REACTOME APOPTOTIC CLEAVAGE OF CELL ADHESION PROTEINS | Genes involved in Apoptotic cleavage of cell adhesion proteins |
| 0.2 | 23.3 | REACTOME PEPTIDE LIGAND BINDING RECEPTORS | Genes involved in Peptide ligand-binding receptors |
| 0.2 | 0.8 | REACTOME GLUTAMATE NEUROTRANSMITTER RELEASE CYCLE | Genes involved in Glutamate Neurotransmitter Release Cycle |
| 0.2 | 9.9 | REACTOME APOPTOTIC CLEAVAGE OF CELLULAR PROTEINS | Genes involved in Apoptotic cleavage of cellular proteins |
| 0.1 | 1.9 | REACTOME IL 7 SIGNALING | Genes involved in Interleukin-7 signaling |
| 0.1 | 8.9 | REACTOME AMINO ACID AND OLIGOPEPTIDE SLC TRANSPORTERS | Genes involved in Amino acid and oligopeptide SLC transporters |
| 0.1 | 3.9 | REACTOME INWARDLY RECTIFYING K CHANNELS | Genes involved in Inwardly rectifying K+ channels |
| 0.1 | 2.3 | REACTOME SPRY REGULATION OF FGF SIGNALING | Genes involved in Spry regulation of FGF signaling |
| 0.1 | 9.9 | REACTOME IMMUNOREGULATORY INTERACTIONS BETWEEN A LYMPHOID AND A NON LYMPHOID CELL | Genes involved in Immunoregulatory interactions between a Lymphoid and a non-Lymphoid cell |
| 0.1 | 2.9 | REACTOME DARPP 32 EVENTS | Genes involved in DARPP-32 events |
| 0.1 | 4.6 | REACTOME GLUTATHIONE CONJUGATION | Genes involved in Glutathione conjugation |
| 0.1 | 1.5 | REACTOME ROLE OF DCC IN REGULATING APOPTOSIS | Genes involved in Role of DCC in regulating apoptosis |
| 0.1 | 11.5 | REACTOME G ALPHA I SIGNALLING EVENTS | Genes involved in G alpha (i) signalling events |
| 0.1 | 2.7 | REACTOME RNA POL III CHAIN ELONGATION | Genes involved in RNA Polymerase III Chain Elongation |
| 0.1 | 1.3 | REACTOME DIGESTION OF DIETARY CARBOHYDRATE | Genes involved in Digestion of dietary carbohydrate |
| 0.1 | 0.4 | REACTOME G ALPHA S SIGNALLING EVENTS | Genes involved in G alpha (s) signalling events |
| 0.1 | 5.0 | REACTOME VOLTAGE GATED POTASSIUM CHANNELS | Genes involved in Voltage gated Potassium channels |
| 0.1 | 0.5 | REACTOME RETROGRADE NEUROTROPHIN SIGNALLING | Genes involved in Retrograde neurotrophin signalling |
| 0.1 | 2.2 | REACTOME AMINE DERIVED HORMONES | Genes involved in Amine-derived hormones |
| 0.1 | 2.5 | REACTOME REGULATION OF INSULIN LIKE GROWTH FACTOR IGF ACTIVITY BY INSULIN LIKE GROWTH FACTOR BINDING PROTEINS IGFBPS | Genes involved in Regulation of Insulin-like Growth Factor (IGF) Activity by Insulin-like Growth Factor Binding Proteins (IGFBPs) |
| 0.1 | 2.2 | REACTOME INTEGRIN CELL SURFACE INTERACTIONS | Genes involved in Integrin cell surface interactions |
| 0.1 | 0.7 | REACTOME ETHANOL OXIDATION | Genes involved in Ethanol oxidation |
| 0.1 | 1.9 | REACTOME SYNTHESIS OF GLYCOSYLPHOSPHATIDYLINOSITOL GPI | Genes involved in Synthesis of glycosylphosphatidylinositol (GPI) |
| 0.1 | 2.0 | REACTOME IL RECEPTOR SHC SIGNALING | Genes involved in Interleukin receptor SHC signaling |
| 0.1 | 1.8 | REACTOME OTHER SEMAPHORIN INTERACTIONS | Genes involved in Other semaphorin interactions |
| 0.1 | 5.5 | REACTOME NOTCH1 INTRACELLULAR DOMAIN REGULATES TRANSCRIPTION | Genes involved in NOTCH1 Intracellular Domain Regulates Transcription |
| 0.1 | 1.9 | REACTOME AMINE LIGAND BINDING RECEPTORS | Genes involved in Amine ligand-binding receptors |
| 0.1 | 0.6 | REACTOME REGULATION OF KIT SIGNALING | Genes involved in Regulation of KIT signaling |
| 0.1 | 2.2 | REACTOME GABA A RECEPTOR ACTIVATION | Genes involved in GABA A receptor activation |
| 0.1 | 1.8 | REACTOME IONOTROPIC ACTIVITY OF KAINATE RECEPTORS | Genes involved in Ionotropic activity of Kainate Receptors |
| 0.1 | 6.6 | REACTOME INTEGRATION OF ENERGY METABOLISM | Genes involved in Integration of energy metabolism |
| 0.1 | 0.7 | REACTOME NFKB ACTIVATION THROUGH FADD RIP1 PATHWAY MEDIATED BY CASPASE 8 AND10 | Genes involved in NF-kB activation through FADD/RIP-1 pathway mediated by caspase-8 and -10 |
| 0.1 | 8.7 | REACTOME RESPONSE TO ELEVATED PLATELET CYTOSOLIC CA2 | Genes involved in Response to elevated platelet cytosolic Ca2+ |
| 0.1 | 5.5 | REACTOME MEIOTIC SYNAPSIS | Genes involved in Meiotic Synapsis |
| 0.1 | 1.2 | REACTOME POTASSIUM CHANNELS | Genes involved in Potassium Channels |
| 0.0 | 3.3 | REACTOME STRIATED MUSCLE CONTRACTION | Genes involved in Striated Muscle Contraction |
| 0.0 | 0.8 | REACTOME DAG AND IP3 SIGNALING | Genes involved in DAG and IP3 signaling |
| 0.0 | 1.3 | REACTOME SEMA4D IN SEMAPHORIN SIGNALING | Genes involved in Sema4D in semaphorin signaling |
| 0.0 | 2.4 | REACTOME TRANSPORT OF INORGANIC CATIONS ANIONS AND AMINO ACIDS OLIGOPEPTIDES | Genes involved in Transport of inorganic cations/anions and amino acids/oligopeptides |
| 0.0 | 0.2 | REACTOME RECYCLING OF BILE ACIDS AND SALTS | Genes involved in Recycling of bile acids and salts |
| 0.0 | 0.7 | REACTOME MITOCHONDRIAL TRNA AMINOACYLATION | Genes involved in Mitochondrial tRNA aminoacylation |
| 0.0 | 1.2 | REACTOME AMYLOIDS | Genes involved in Amyloids |
| 0.0 | 0.5 | REACTOME BILE SALT AND ORGANIC ANION SLC TRANSPORTERS | Genes involved in Bile salt and organic anion SLC transporters |
| 0.0 | 0.6 | REACTOME SIGNALING BY BMP | Genes involved in Signaling by BMP |
| 0.0 | 0.4 | REACTOME GAMMA CARBOXYLATION TRANSPORT AND AMINO TERMINAL CLEAVAGE OF PROTEINS | Genes involved in Gamma-carboxylation, transport, and amino-terminal cleavage of proteins |
| 0.0 | 1.3 | REACTOME G ALPHA Q SIGNALLING EVENTS | Genes involved in G alpha (q) signalling events |
| 0.0 | 1.2 | REACTOME TRANSPORT TO THE GOLGI AND SUBSEQUENT MODIFICATION | Genes involved in Transport to the Golgi and subsequent modification |
| 0.0 | 0.5 | REACTOME HIGHLY CALCIUM PERMEABLE POSTSYNAPTIC NICOTINIC ACETYLCHOLINE RECEPTORS | Genes involved in Highly calcium permeable postsynaptic nicotinic acetylcholine receptors |
| 0.0 | 0.7 | REACTOME CONVERSION FROM APC C CDC20 TO APC C CDH1 IN LATE ANAPHASE | Genes involved in Conversion from APC/C:Cdc20 to APC/C:Cdh1 in late anaphase |
| 0.0 | 0.5 | REACTOME ENDOSOMAL SORTING COMPLEX REQUIRED FOR TRANSPORT ESCRT | Genes involved in Endosomal Sorting Complex Required For Transport (ESCRT) |
| 0.0 | 0.8 | REACTOME COMPLEMENT CASCADE | Genes involved in Complement cascade |
| 0.0 | 0.7 | REACTOME ABC FAMILY PROTEINS MEDIATED TRANSPORT | Genes involved in ABC-family proteins mediated transport |
| 0.0 | 0.5 | REACTOME CYTOSOLIC SULFONATION OF SMALL MOLECULES | Genes involved in Cytosolic sulfonation of small molecules |
| 0.0 | 1.0 | REACTOME CELL SURFACE INTERACTIONS AT THE VASCULAR WALL | Genes involved in Cell surface interactions at the vascular wall |
| 0.0 | 0.2 | REACTOME NA CL DEPENDENT NEUROTRANSMITTER TRANSPORTERS | Genes involved in Na+/Cl- dependent neurotransmitter transporters |
| 0.0 | 0.2 | REACTOME THE ACTIVATION OF ARYLSULFATASES | Genes involved in The activation of arylsulfatases |