Project
GNF SymAtlas + NCI-60 cancer cell lines, comparison of cancers vs non-cancers, human (Su, 2004; Ross, 2000)
Navigation
Downloads
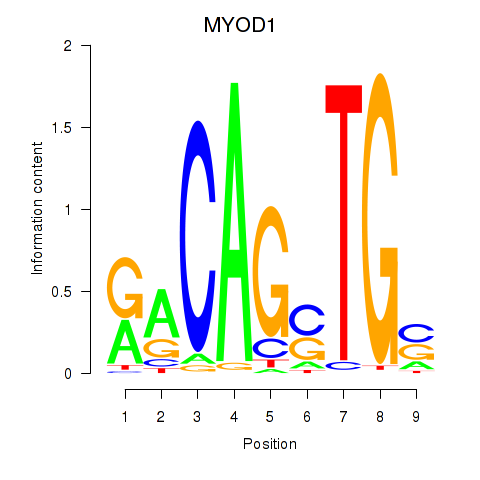
Results for MYOD1
Z-value: 0.55
Motif logo
Transcription factors associated with MYOD1
| Gene Symbol | Gene ID | Gene Info |
|---|---|---|
|
MYOD1
|
ENSG00000129152.3 | myogenic differentiation 1 |
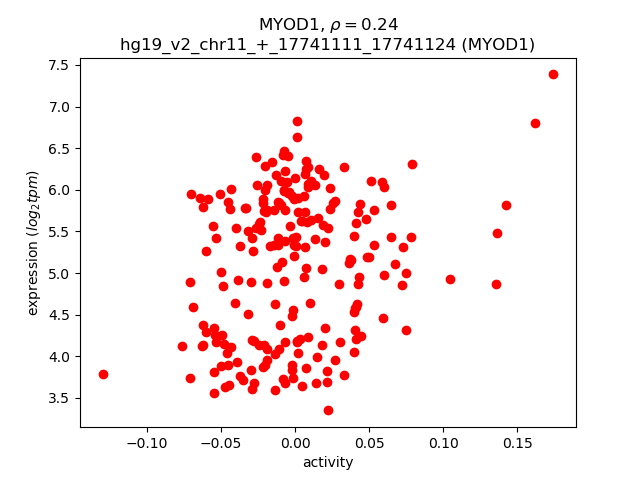
Activity-expression correlation:
| Gene | Promoter | Pearson corr. coef. | P-value | Plot |
|---|---|---|---|---|
| MYOD1 | hg19_v2_chr11_+_17741111_17741124 | 0.24 | 3.3e-04 | Click! |
Activity profile of MYOD1 motif
Sorted Z-values of MYOD1 motif
| Promoter | Log-likelihood | Transcript | Gene | Gene Info |
|---|---|---|---|---|
| chr2_-_152590946 | 20.71 |
ENST00000172853.10
|
NEB
|
nebulin |
| chr11_+_1860200 | 16.75 |
ENST00000381911.1
|
TNNI2
|
troponin I type 2 (skeletal, fast) |
| chrX_-_107018969 | 16.45 |
ENST00000372383.4
|
TSC22D3
|
TSC22 domain family, member 3 |
| chr19_-_45826125 | 15.24 |
ENST00000221476.3
|
CKM
|
creatine kinase, muscle |
| chr16_+_30387141 | 14.70 |
ENST00000566955.1
|
MYLPF
|
myosin light chain, phosphorylatable, fast skeletal muscle |
| chr9_-_35689900 | 13.00 |
ENST00000378300.5
ENST00000329305.2 ENST00000360958.2 |
TPM2
|
tropomyosin 2 (beta) |
| chr2_+_220283091 | 12.32 |
ENST00000373960.3
|
DES
|
desmin |
| chr16_+_30383613 | 12.03 |
ENST00000568749.1
|
MYLPF
|
myosin light chain, phosphorylatable, fast skeletal muscle |
| chr11_+_1860682 | 11.72 |
ENST00000381906.1
|
TNNI2
|
troponin I type 2 (skeletal, fast) |
| chr11_+_1860832 | 11.29 |
ENST00000252898.7
|
TNNI2
|
troponin I type 2 (skeletal, fast) |
| chr5_+_66124590 | 10.98 |
ENST00000490016.2
ENST00000403666.1 ENST00000450827.1 |
MAST4
|
microtubule associated serine/threonine kinase family member 4 |
| chr16_+_30386098 | 10.52 |
ENST00000322861.7
|
MYLPF
|
myosin light chain, phosphorylatable, fast skeletal muscle |
| chr2_-_152590982 | 10.07 |
ENST00000409198.1
ENST00000397345.3 ENST00000427231.2 |
NEB
|
nebulin |
| chr22_-_36013368 | 9.52 |
ENST00000442617.1
ENST00000397326.2 ENST00000397328.1 ENST00000451685.1 |
MB
|
myoglobin |
| chr3_-_52486841 | 9.41 |
ENST00000496590.1
|
TNNC1
|
troponin C type 1 (slow) |
| chr19_+_35739280 | 9.38 |
ENST00000602122.1
|
LSR
|
lipolysis stimulated lipoprotein receptor |
| chr19_+_35739782 | 9.35 |
ENST00000347609.4
|
LSR
|
lipolysis stimulated lipoprotein receptor |
| chr2_-_179672142 | 8.97 |
ENST00000342992.6
ENST00000360870.5 ENST00000460472.2 ENST00000589042.1 ENST00000591111.1 ENST00000342175.6 ENST00000359218.5 |
TTN
|
titin |
| chr3_+_52454971 | 8.96 |
ENST00000465863.1
|
PHF7
|
PHD finger protein 7 |
| chr9_-_35685452 | 8.91 |
ENST00000607559.1
|
TPM2
|
tropomyosin 2 (beta) |
| chr19_+_35739597 | 8.88 |
ENST00000361790.3
|
LSR
|
lipolysis stimulated lipoprotein receptor |
| chr7_-_44105158 | 8.32 |
ENST00000297283.3
|
PGAM2
|
phosphoglycerate mutase 2 (muscle) |
| chr19_+_35739631 | 8.31 |
ENST00000602003.1
ENST00000360798.3 ENST00000354900.3 |
LSR
|
lipolysis stimulated lipoprotein receptor |
| chr20_-_44455976 | 8.13 |
ENST00000372555.3
|
TNNC2
|
troponin C type 2 (fast) |
| chr11_-_66725837 | 7.78 |
ENST00000393958.2
ENST00000393960.1 ENST00000524491.1 ENST00000355677.3 |
PC
|
pyruvate carboxylase |
| chrX_-_107019181 | 7.26 |
ENST00000315660.4
ENST00000372384.2 ENST00000502650.1 ENST00000506724.1 |
TSC22D3
|
TSC22 domain family, member 3 |
| chr6_+_30852130 | 7.24 |
ENST00000428153.2
ENST00000376568.3 ENST00000452441.1 ENST00000515219.1 |
DDR1
|
discoidin domain receptor tyrosine kinase 1 |
| chr11_+_57365150 | 6.80 |
ENST00000457869.1
ENST00000340687.6 ENST00000378323.4 ENST00000378324.2 ENST00000403558.1 |
SERPING1
|
serpin peptidase inhibitor, clade G (C1 inhibitor), member 1 |
| chr17_-_7165662 | 6.78 |
ENST00000571881.2
ENST00000360325.7 |
CLDN7
|
claudin 7 |
| chr14_+_75746340 | 6.72 |
ENST00000555686.1
ENST00000555672.1 |
FOS
|
FBJ murine osteosarcoma viral oncogene homolog |
| chr2_+_170366203 | 6.65 |
ENST00000284669.1
|
KLHL41
|
kelch-like family member 41 |
| chr22_-_36018569 | 6.63 |
ENST00000419229.1
ENST00000406324.1 |
MB
|
myoglobin |
| chr14_+_75746781 | 6.53 |
ENST00000555347.1
|
FOS
|
FBJ murine osteosarcoma viral oncogene homolog |
| chr19_+_50936142 | 6.46 |
ENST00000357701.5
|
MYBPC2
|
myosin binding protein C, fast type |
| chr1_-_16345245 | 6.07 |
ENST00000311890.9
|
HSPB7
|
heat shock 27kDa protein family, member 7 (cardiovascular) |
| chr21_+_27011584 | 5.95 |
ENST00000400532.1
ENST00000480456.1 ENST00000312957.5 |
JAM2
|
junctional adhesion molecule 2 |
| chrX_-_11445856 | 5.82 |
ENST00000380736.1
|
ARHGAP6
|
Rho GTPase activating protein 6 |
| chr1_+_2005425 | 5.77 |
ENST00000461106.2
|
PRKCZ
|
protein kinase C, zeta |
| chr11_+_1942580 | 5.66 |
ENST00000381558.1
|
TNNT3
|
troponin T type 3 (skeletal, fast) |
| chr10_-_103347883 | 5.57 |
ENST00000339310.3
ENST00000370158.3 ENST00000299206.4 ENST00000456836.2 ENST00000413344.1 ENST00000429502.1 ENST00000430045.1 ENST00000370172.1 ENST00000436284.2 ENST00000370162.3 |
POLL
|
polymerase (DNA directed), lambda |
| chr21_+_27011899 | 5.48 |
ENST00000425221.2
|
JAM2
|
junctional adhesion molecule 2 |
| chr11_-_117747607 | 5.43 |
ENST00000540359.1
ENST00000539526.1 |
FXYD6
|
FXYD domain containing ion transport regulator 6 |
| chr12_-_6484715 | 5.41 |
ENST00000228916.2
|
SCNN1A
|
sodium channel, non-voltage-gated 1 alpha subunit |
| chr6_+_30851840 | 5.39 |
ENST00000511510.1
ENST00000376569.3 ENST00000376575.3 ENST00000376570.4 ENST00000446312.1 ENST00000504927.1 |
DDR1
|
discoidin domain receptor tyrosine kinase 1 |
| chr11_-_117747434 | 5.35 |
ENST00000529335.2
ENST00000530956.1 ENST00000260282.4 |
FXYD6
|
FXYD domain containing ion transport regulator 6 |
| chrX_-_133119476 | 5.34 |
ENST00000543339.1
|
GPC3
|
glypican 3 |
| chr15_-_45670924 | 5.31 |
ENST00000396659.3
|
GATM
|
glycine amidinotransferase (L-arginine:glycine amidinotransferase) |
| chr19_+_35739897 | 5.30 |
ENST00000605618.1
ENST00000427250.1 ENST00000601623.1 |
LSR
|
lipolysis stimulated lipoprotein receptor |
| chr1_+_60280458 | 5.27 |
ENST00000455990.1
ENST00000371208.3 |
HOOK1
|
hook microtubule-tethering protein 1 |
| chr11_-_111783595 | 5.25 |
ENST00000528628.1
|
CRYAB
|
crystallin, alpha B |
| chr4_-_40631859 | 5.22 |
ENST00000295971.7
ENST00000319592.4 |
RBM47
|
RNA binding motif protein 47 |
| chr18_+_77439775 | 5.12 |
ENST00000299543.7
ENST00000075430.7 |
CTDP1
|
CTD (carboxy-terminal domain, RNA polymerase II, polypeptide A) phosphatase, subunit 1 |
| chrX_-_133119670 | 5.11 |
ENST00000394299.2
|
GPC3
|
glypican 3 |
| chr17_-_79269067 | 5.07 |
ENST00000288439.5
ENST00000374759.3 |
SLC38A10
|
solute carrier family 38, member 10 |
| chr3_-_50383096 | 5.05 |
ENST00000442887.1
ENST00000360165.3 |
ZMYND10
|
zinc finger, MYND-type containing 10 |
| chr4_-_186456766 | 4.97 |
ENST00000284771.6
|
PDLIM3
|
PDZ and LIM domain 3 |
| chr4_-_186456652 | 4.90 |
ENST00000284767.5
ENST00000284770.5 |
PDLIM3
|
PDZ and LIM domain 3 |
| chr19_-_18391708 | 4.80 |
ENST00000600972.1
|
JUND
|
jun D proto-oncogene |
| chr6_+_41021027 | 4.79 |
ENST00000244669.2
|
APOBEC2
|
apolipoprotein B mRNA editing enzyme, catalytic polypeptide-like 2 |
| chr11_-_2170786 | 4.71 |
ENST00000300632.5
|
IGF2
|
insulin-like growth factor 2 (somatomedin A) |
| chr11_+_1940786 | 4.70 |
ENST00000278317.6
ENST00000381561.4 ENST00000381548.3 ENST00000360603.3 ENST00000381549.3 |
TNNT3
|
troponin T type 3 (skeletal, fast) |
| chr1_-_154164534 | 4.70 |
ENST00000271850.7
ENST00000368530.2 |
TPM3
|
tropomyosin 3 |
| chr15_+_74833518 | 4.65 |
ENST00000346246.5
|
ARID3B
|
AT rich interactive domain 3B (BRIGHT-like) |
| chr19_+_41103063 | 4.60 |
ENST00000308370.7
|
LTBP4
|
latent transforming growth factor beta binding protein 4 |
| chr17_-_42277203 | 4.55 |
ENST00000587097.1
|
ATXN7L3
|
ataxin 7-like 3 |
| chr22_+_22988816 | 4.41 |
ENST00000480559.1
ENST00000448514.1 |
GGTLC2
|
gamma-glutamyltransferase light chain 2 |
| chr11_-_117748138 | 4.40 |
ENST00000527717.1
|
FXYD6
|
FXYD domain containing ion transport regulator 6 |
| chr10_+_102672712 | 4.19 |
ENST00000370271.3
ENST00000370269.3 ENST00000609386.1 |
FAM178A
|
family with sequence similarity 178, member A |
| chr9_+_6757634 | 4.13 |
ENST00000543771.1
ENST00000401787.3 ENST00000381306.3 ENST00000381309.3 |
KDM4C
|
lysine (K)-specific demethylase 4C |
| chr16_+_83932684 | 4.13 |
ENST00000262430.4
|
MLYCD
|
malonyl-CoA decarboxylase |
| chr1_-_150979333 | 4.07 |
ENST00000312210.5
|
FAM63A
|
family with sequence similarity 63, member A |
| chr3_-_46904918 | 4.05 |
ENST00000395869.1
|
MYL3
|
myosin, light chain 3, alkali; ventricular, skeletal, slow |
| chr17_+_36508111 | 4.04 |
ENST00000331159.5
ENST00000577233.1 |
SOCS7
|
suppressor of cytokine signaling 7 |
| chr12_-_13248705 | 4.00 |
ENST00000396310.2
|
GSG1
|
germ cell associated 1 |
| chr3_+_47021168 | 3.98 |
ENST00000450053.3
ENST00000292309.5 ENST00000383740.2 |
NBEAL2
|
neurobeachin-like 2 |
| chr1_-_201391149 | 3.95 |
ENST00000555948.1
ENST00000556362.1 |
TNNI1
|
troponin I type 1 (skeletal, slow) |
| chr1_-_201081579 | 3.94 |
ENST00000367338.3
ENST00000362061.3 |
CACNA1S
|
calcium channel, voltage-dependent, L type, alpha 1S subunit |
| chr12_-_52967600 | 3.89 |
ENST00000549343.1
ENST00000305620.2 |
KRT74
|
keratin 74 |
| chr10_-_73848531 | 3.89 |
ENST00000373109.2
|
SPOCK2
|
sparc/osteonectin, cwcv and kazal-like domains proteoglycan (testican) 2 |
| chr19_+_35521572 | 3.88 |
ENST00000262631.5
|
SCN1B
|
sodium channel, voltage-gated, type I, beta subunit |
| chr3_-_46904946 | 3.82 |
ENST00000292327.4
|
MYL3
|
myosin, light chain 3, alkali; ventricular, skeletal, slow |
| chr22_-_20367797 | 3.80 |
ENST00000424787.2
|
GGTLC3
|
gamma-glutamyltransferase light chain 3 |
| chr19_+_3933579 | 3.79 |
ENST00000593949.1
|
NMRK2
|
nicotinamide riboside kinase 2 |
| chr12_-_13248562 | 3.77 |
ENST00000457134.2
ENST00000537302.1 |
GSG1
|
germ cell associated 1 |
| chr9_-_131872928 | 3.77 |
ENST00000455830.2
ENST00000393384.3 ENST00000318080.2 |
CRAT
|
carnitine O-acetyltransferase |
| chr6_+_30848557 | 3.76 |
ENST00000460944.2
ENST00000324771.8 |
DDR1
|
discoidin domain receptor tyrosine kinase 1 |
| chr19_+_18794470 | 3.73 |
ENST00000321949.8
ENST00000338797.6 |
CRTC1
|
CREB regulated transcription coactivator 1 |
| chr22_-_50968419 | 3.71 |
ENST00000425169.1
ENST00000395680.1 ENST00000395681.1 ENST00000395678.3 ENST00000252029.3 |
TYMP
|
thymidine phosphorylase |
| chr8_-_67341208 | 3.49 |
ENST00000499642.1
|
RP11-346I3.4
|
RP11-346I3.4 |
| chr10_-_73848764 | 3.47 |
ENST00000317376.4
ENST00000412663.1 |
SPOCK2
|
sparc/osteonectin, cwcv and kazal-like domains proteoglycan (testican) 2 |
| chr19_-_50316489 | 3.44 |
ENST00000533418.1
|
FUZ
|
fuzzy planar cell polarity protein |
| chr12_-_13248732 | 3.43 |
ENST00000396302.3
|
GSG1
|
germ cell associated 1 |
| chr19_-_50316517 | 3.42 |
ENST00000313777.4
ENST00000445575.2 |
FUZ
|
fuzzy planar cell polarity protein |
| chr11_-_119252359 | 3.36 |
ENST00000455332.2
|
USP2
|
ubiquitin specific peptidase 2 |
| chr11_-_119252425 | 3.35 |
ENST00000260187.2
|
USP2
|
ubiquitin specific peptidase 2 |
| chr3_-_57113314 | 3.34 |
ENST00000338458.4
ENST00000468727.1 |
ARHGEF3
|
Rho guanine nucleotide exchange factor (GEF) 3 |
| chr18_+_47088401 | 3.33 |
ENST00000261292.4
ENST00000427224.2 ENST00000580036.1 |
LIPG
|
lipase, endothelial |
| chr11_-_33891362 | 3.32 |
ENST00000395833.3
|
LMO2
|
LIM domain only 2 (rhombotin-like 1) |
| chr11_-_76155618 | 3.30 |
ENST00000530759.1
|
RP11-111M22.3
|
RP11-111M22.3 |
| chr1_-_154928562 | 3.29 |
ENST00000368463.3
ENST00000539880.1 ENST00000542459.1 ENST00000368460.3 ENST00000368465.1 |
PBXIP1
|
pre-B-cell leukemia homeobox interacting protein 1 |
| chr1_+_27561104 | 3.25 |
ENST00000361771.3
|
WDTC1
|
WD and tetratricopeptide repeats 1 |
| chr10_+_123923205 | 3.24 |
ENST00000369004.3
ENST00000260733.3 |
TACC2
|
transforming, acidic coiled-coil containing protein 2 |
| chr20_+_49575342 | 3.24 |
ENST00000244051.1
|
MOCS3
|
molybdenum cofactor synthesis 3 |
| chr7_-_73184588 | 3.23 |
ENST00000395145.2
|
CLDN3
|
claudin 3 |
| chr10_-_124768300 | 3.19 |
ENST00000368886.5
|
IKZF5
|
IKAROS family zinc finger 5 (Pegasus) |
| chr5_-_1295104 | 3.09 |
ENST00000334602.6
ENST00000508104.2 ENST00000310581.5 ENST00000296820.5 |
TERT
|
telomerase reverse transcriptase |
| chr19_-_50316423 | 3.07 |
ENST00000528094.1
ENST00000526575.1 |
FUZ
|
fuzzy planar cell polarity protein |
| chr11_-_66084508 | 3.04 |
ENST00000311330.3
|
CD248
|
CD248 molecule, endosialin |
| chr12_+_66582919 | 3.03 |
ENST00000545837.1
ENST00000457197.2 |
IRAK3
|
interleukin-1 receptor-associated kinase 3 |
| chr16_-_46865047 | 2.99 |
ENST00000394806.2
|
C16orf87
|
chromosome 16 open reading frame 87 |
| chr1_+_100315613 | 2.96 |
ENST00000361915.3
|
AGL
|
amylo-alpha-1, 6-glucosidase, 4-alpha-glucanotransferase |
| chr19_+_35521616 | 2.95 |
ENST00000595652.1
|
SCN1B
|
sodium channel, voltage-gated, type I, beta subunit |
| chr2_+_121103706 | 2.92 |
ENST00000295228.3
|
INHBB
|
inhibin, beta B |
| chr15_-_35088340 | 2.92 |
ENST00000290378.4
|
ACTC1
|
actin, alpha, cardiac muscle 1 |
| chr16_-_67427389 | 2.92 |
ENST00000562206.1
ENST00000290942.5 ENST00000393957.2 |
TPPP3
|
tubulin polymerization-promoting protein family member 3 |
| chr10_+_123923105 | 2.91 |
ENST00000368999.1
|
TACC2
|
transforming, acidic coiled-coil containing protein 2 |
| chr2_-_24583583 | 2.91 |
ENST00000355123.4
|
ITSN2
|
intersectin 2 |
| chr3_+_9975497 | 2.89 |
ENST00000397170.3
ENST00000383811.3 ENST00000452070.1 ENST00000326434.5 |
CRELD1
|
cysteine-rich with EGF-like domains 1 |
| chr12_-_121342170 | 2.81 |
ENST00000353487.2
|
SPPL3
|
signal peptide peptidase like 3 |
| chr12_+_50355647 | 2.79 |
ENST00000293599.6
|
AQP5
|
aquaporin 5 |
| chr17_-_47755338 | 2.78 |
ENST00000508805.1
ENST00000515508.2 ENST00000451526.2 ENST00000507970.1 |
SPOP
|
speckle-type POZ protein |
| chr6_-_41703296 | 2.76 |
ENST00000373033.1
|
TFEB
|
transcription factor EB |
| chr10_+_96162242 | 2.74 |
ENST00000225235.4
|
TBC1D12
|
TBC1 domain family, member 12 |
| chr15_-_48937884 | 2.70 |
ENST00000560355.1
|
FBN1
|
fibrillin 1 |
| chr6_-_137113604 | 2.69 |
ENST00000359015.4
|
MAP3K5
|
mitogen-activated protein kinase kinase kinase 5 |
| chr19_-_49658387 | 2.69 |
ENST00000595625.1
|
HRC
|
histidine rich calcium binding protein |
| chr3_+_32147997 | 2.69 |
ENST00000282541.5
|
GPD1L
|
glycerol-3-phosphate dehydrogenase 1-like |
| chr10_+_123922941 | 2.68 |
ENST00000360561.3
|
TACC2
|
transforming, acidic coiled-coil containing protein 2 |
| chr7_-_97881429 | 2.67 |
ENST00000420697.1
ENST00000379795.3 ENST00000415086.1 ENST00000542604.1 ENST00000447648.2 |
TECPR1
|
tectonin beta-propeller repeat containing 1 |
| chr19_+_6135646 | 2.66 |
ENST00000588304.1
ENST00000588485.1 ENST00000588722.1 ENST00000591403.1 ENST00000586696.1 ENST00000589401.1 ENST00000252669.5 |
ACSBG2
|
acyl-CoA synthetase bubblegum family member 2 |
| chr1_-_85155939 | 2.65 |
ENST00000603677.1
|
SSX2IP
|
synovial sarcoma, X breakpoint 2 interacting protein |
| chr17_+_76165213 | 2.61 |
ENST00000590201.1
|
SYNGR2
|
synaptogyrin 2 |
| chr5_-_150603679 | 2.60 |
ENST00000355417.2
|
CCDC69
|
coiled-coil domain containing 69 |
| chr19_-_40791211 | 2.60 |
ENST00000579047.1
|
AKT2
|
v-akt murine thymoma viral oncogene homolog 2 |
| chr15_-_75660919 | 2.60 |
ENST00000569482.1
ENST00000565683.1 ENST00000561615.1 ENST00000563622.1 ENST00000568374.1 ENST00000566256.1 ENST00000267978.5 |
MAN2C1
|
mannosidase, alpha, class 2C, member 1 |
| chr5_-_159739532 | 2.57 |
ENST00000520748.1
ENST00000393977.3 ENST00000257536.7 |
CCNJL
|
cyclin J-like |
| chr2_+_48541776 | 2.56 |
ENST00000413569.1
ENST00000340553.3 |
FOXN2
|
forkhead box N2 |
| chr14_+_105781102 | 2.56 |
ENST00000547217.1
|
PACS2
|
phosphofurin acidic cluster sorting protein 2 |
| chr16_-_31214051 | 2.48 |
ENST00000350605.4
|
PYCARD
|
PYD and CARD domain containing |
| chr7_+_73442422 | 2.46 |
ENST00000358929.4
ENST00000431562.1 ENST00000320492.7 ENST00000438906.1 |
ELN
|
elastin |
| chr11_-_64512273 | 2.43 |
ENST00000377497.3
ENST00000377487.1 ENST00000430645.1 |
RASGRP2
|
RAS guanyl releasing protein 2 (calcium and DAG-regulated) |
| chr2_-_220118631 | 2.41 |
ENST00000248437.4
|
TUBA4A
|
tubulin, alpha 4a |
| chr16_+_58059470 | 2.41 |
ENST00000219271.3
|
MMP15
|
matrix metallopeptidase 15 (membrane-inserted) |
| chr1_-_150669604 | 2.39 |
ENST00000427665.1
ENST00000540514.1 |
GOLPH3L
|
golgi phosphoprotein 3-like |
| chr19_+_19030478 | 2.37 |
ENST00000247003.4
|
DDX49
|
DEAD (Asp-Glu-Ala-Asp) box polypeptide 49 |
| chr7_-_76829125 | 2.36 |
ENST00000248598.5
|
FGL2
|
fibrinogen-like 2 |
| chr2_-_183387430 | 2.35 |
ENST00000410103.1
|
PDE1A
|
phosphodiesterase 1A, calmodulin-dependent |
| chr8_-_145018080 | 2.34 |
ENST00000354589.3
|
PLEC
|
plectin |
| chr6_-_136871957 | 2.34 |
ENST00000354570.3
|
MAP7
|
microtubule-associated protein 7 |
| chr20_-_50808236 | 2.33 |
ENST00000361387.2
|
ZFP64
|
ZFP64 zinc finger protein |
| chr8_-_134115118 | 2.32 |
ENST00000395352.3
ENST00000338087.5 |
SLA
|
Src-like-adaptor |
| chr10_-_62149433 | 2.29 |
ENST00000280772.2
|
ANK3
|
ankyrin 3, node of Ranvier (ankyrin G) |
| chr17_-_80009650 | 2.26 |
ENST00000310496.4
|
RFNG
|
RFNG O-fucosylpeptide 3-beta-N-acetylglucosaminyltransferase |
| chr5_+_56111361 | 2.26 |
ENST00000399503.3
|
MAP3K1
|
mitogen-activated protein kinase kinase kinase 1, E3 ubiquitin protein ligase |
| chr19_+_19030497 | 2.19 |
ENST00000438170.2
|
DDX49
|
DEAD (Asp-Glu-Ala-Asp) box polypeptide 49 |
| chr17_-_53800217 | 2.18 |
ENST00000424486.2
|
TMEM100
|
transmembrane protein 100 |
| chr10_+_104535994 | 2.17 |
ENST00000369889.4
|
WBP1L
|
WW domain binding protein 1-like |
| chr15_+_74466744 | 2.17 |
ENST00000560862.1
ENST00000395118.1 |
ISLR
|
immunoglobulin superfamily containing leucine-rich repeat |
| chr15_-_75165651 | 2.17 |
ENST00000562363.1
ENST00000564529.1 ENST00000268099.9 |
SCAMP2
|
secretory carrier membrane protein 2 |
| chr3_+_5020801 | 2.16 |
ENST00000256495.3
|
BHLHE40
|
basic helix-loop-helix family, member e40 |
| chr15_-_48937982 | 2.15 |
ENST00000316623.5
|
FBN1
|
fibrillin 1 |
| chr1_-_150978953 | 2.14 |
ENST00000493834.2
|
FAM63A
|
family with sequence similarity 63, member A |
| chr12_-_48119301 | 2.14 |
ENST00000545824.2
ENST00000422538.3 |
ENDOU
|
endonuclease, polyU-specific |
| chr11_+_31531291 | 2.13 |
ENST00000350638.5
ENST00000379163.5 ENST00000395934.2 |
ELP4
|
elongator acetyltransferase complex subunit 4 |
| chr20_-_23967432 | 2.13 |
ENST00000286890.4
ENST00000278765.4 |
GGTLC1
|
gamma-glutamyltransferase light chain 1 |
| chr16_-_90038866 | 2.10 |
ENST00000314994.3
|
CENPBD1
|
CENPB DNA-binding domains containing 1 |
| chr11_-_86666427 | 2.09 |
ENST00000531380.1
|
FZD4
|
frizzled family receptor 4 |
| chr1_-_161168834 | 2.08 |
ENST00000367995.3
ENST00000367996.5 |
ADAMTS4
|
ADAM metallopeptidase with thrombospondin type 1 motif, 4 |
| chr8_-_29120580 | 2.07 |
ENST00000524189.1
|
KIF13B
|
kinesin family member 13B |
| chr3_-_66024213 | 2.07 |
ENST00000483466.1
|
MAGI1
|
membrane associated guanylate kinase, WW and PDZ domain containing 1 |
| chr19_+_3933085 | 2.06 |
ENST00000168977.2
ENST00000599576.1 |
NMRK2
|
nicotinamide riboside kinase 2 |
| chr7_-_100171270 | 2.05 |
ENST00000538735.1
|
SAP25
|
Sin3A-associated protein, 25kDa |
| chr2_+_233562015 | 2.05 |
ENST00000427233.1
ENST00000373566.3 ENST00000373563.4 ENST00000428883.1 ENST00000456491.1 ENST00000409480.1 ENST00000421433.1 ENST00000425040.1 ENST00000430720.1 ENST00000409547.1 ENST00000423659.1 ENST00000409196.3 ENST00000409451.3 ENST00000429187.1 ENST00000440945.1 |
GIGYF2
|
GRB10 interacting GYF protein 2 |
| chr12_-_48119340 | 2.05 |
ENST00000229003.3
|
ENDOU
|
endonuclease, polyU-specific |
| chr1_-_201346761 | 2.05 |
ENST00000455702.1
ENST00000422165.1 ENST00000367318.5 ENST00000367320.2 ENST00000438742.1 ENST00000412633.1 ENST00000458432.2 ENST00000421663.2 ENST00000367322.1 ENST00000509001.1 |
TNNT2
|
troponin T type 2 (cardiac) |
| chr1_+_28206150 | 2.04 |
ENST00000456990.1
|
THEMIS2
|
thymocyte selection associated family member 2 |
| chr2_+_24714729 | 2.02 |
ENST00000406961.1
ENST00000405141.1 |
NCOA1
|
nuclear receptor coactivator 1 |
| chr19_+_7701985 | 2.00 |
ENST00000595950.1
ENST00000441779.2 ENST00000221283.5 ENST00000414284.2 |
STXBP2
|
syntaxin binding protein 2 |
| chr12_-_42632016 | 1.99 |
ENST00000442791.3
ENST00000327791.4 ENST00000534854.2 ENST00000380788.3 ENST00000380790.4 |
YAF2
|
YY1 associated factor 2 |
| chr7_+_100210133 | 1.99 |
ENST00000393950.2
ENST00000424091.2 |
MOSPD3
|
motile sperm domain containing 3 |
| chr1_+_27561007 | 1.98 |
ENST00000319394.3
|
WDTC1
|
WD and tetratricopeptide repeats 1 |
| chr5_+_150040403 | 1.97 |
ENST00000517768.1
ENST00000297130.4 |
MYOZ3
|
myozenin 3 |
| chr19_-_14228541 | 1.95 |
ENST00000590853.1
ENST00000308677.4 |
PRKACA
|
protein kinase, cAMP-dependent, catalytic, alpha |
| chr7_+_73442102 | 1.95 |
ENST00000445912.1
ENST00000252034.7 |
ELN
|
elastin |
| chr11_-_72145426 | 1.95 |
ENST00000535990.1
ENST00000437826.2 ENST00000340729.5 |
CLPB
|
ClpB caseinolytic peptidase B homolog (E. coli) |
| chr6_-_45983581 | 1.94 |
ENST00000339561.6
|
CLIC5
|
chloride intracellular channel 5 |
| chr1_-_115238207 | 1.94 |
ENST00000520113.2
ENST00000369538.3 ENST00000353928.6 |
AMPD1
|
adenosine monophosphate deaminase 1 |
| chr19_+_41107249 | 1.92 |
ENST00000396819.3
|
LTBP4
|
latent transforming growth factor beta binding protein 4 |
| chr3_+_50192499 | 1.91 |
ENST00000413852.1
|
SEMA3F
|
sema domain, immunoglobulin domain (Ig), short basic domain, secreted, (semaphorin) 3F |
| chr4_+_128703295 | 1.91 |
ENST00000296464.4
ENST00000508549.1 |
HSPA4L
|
heat shock 70kDa protein 4-like |
| chr4_-_82393009 | 1.91 |
ENST00000436139.2
|
RASGEF1B
|
RasGEF domain family, member 1B |
| chr19_-_49658641 | 1.91 |
ENST00000252825.4
|
HRC
|
histidine rich calcium binding protein |
| chr9_+_37650945 | 1.90 |
ENST00000377765.3
|
FRMPD1
|
FERM and PDZ domain containing 1 |
| chr7_+_73442457 | 1.88 |
ENST00000438880.1
ENST00000414324.1 ENST00000380562.4 |
ELN
|
elastin |
| chr17_-_44657017 | 1.87 |
ENST00000573185.1
ENST00000570550.1 ENST00000445552.2 ENST00000336125.5 ENST00000329240.4 ENST00000337845.7 |
ARL17A
|
ADP-ribosylation factor-like 17A |
| chr17_-_19648683 | 1.86 |
ENST00000573368.1
ENST00000457500.2 |
ALDH3A1
|
aldehyde dehydrogenase 3 family, member A1 |
| chr17_+_34431212 | 1.86 |
ENST00000394495.1
|
CCL4
|
chemokine (C-C motif) ligand 4 |
| chr11_-_72145641 | 1.82 |
ENST00000538039.1
ENST00000445069.2 |
CLPB
|
ClpB caseinolytic peptidase B homolog (E. coli) |
| chr12_+_56325812 | 1.82 |
ENST00000394147.1
ENST00000551156.1 ENST00000553783.1 ENST00000557080.1 ENST00000432422.3 ENST00000556001.1 |
DGKA
|
diacylglycerol kinase, alpha 80kDa |
| chr20_+_57875658 | 1.81 |
ENST00000371025.3
|
EDN3
|
endothelin 3 |
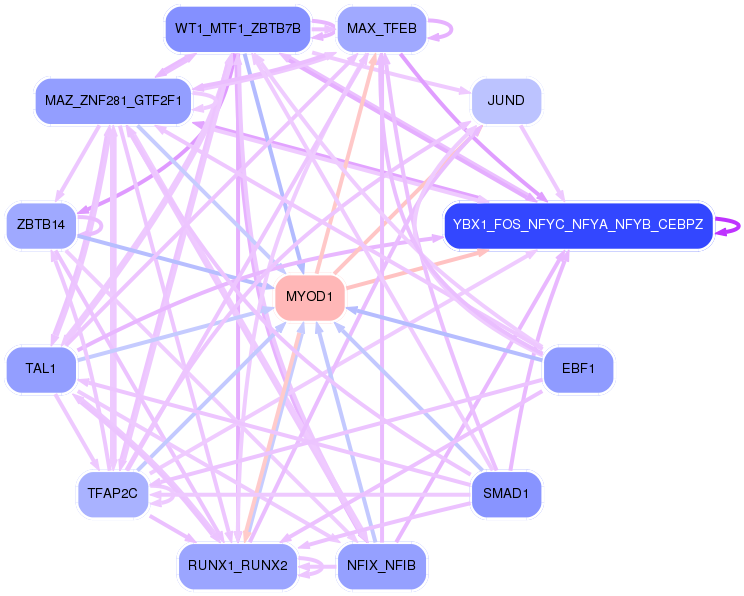
Network of associatons between targets according to the STRING database.

First level regulatory network of MYOD1
Gene Ontology Analysis
Gene overrepresentation in biological_process category:
| Log-likelihood per target | Total log-likelihood | Term | Description |
|---|---|---|---|
| 8.2 | 41.2 | GO:1904274 | tricellular tight junction assembly(GO:1904274) |
| 7.7 | 30.8 | GO:0007525 | somatic muscle development(GO:0007525) |
| 3.0 | 9.0 | GO:0030241 | skeletal muscle myosin thick filament assembly(GO:0030241) |
| 3.0 | 23.7 | GO:0070235 | regulation of activation-induced cell death of T cells(GO:0070235) negative regulation of activation-induced cell death of T cells(GO:0070236) |
| 2.9 | 11.5 | GO:0032972 | regulation of muscle filament sliding speed(GO:0032972) |
| 2.6 | 10.5 | GO:0072180 | mesonephric duct morphogenesis(GO:0072180) |
| 2.6 | 7.8 | GO:0019074 | viral genome packaging(GO:0019072) viral RNA genome packaging(GO:0019074) |
| 2.5 | 9.9 | GO:0090299 | fibroblast growth factor receptor signaling pathway involved in neural plate anterior/posterior pattern formation(GO:0060825) regulation of neural crest formation(GO:0090299) negative regulation of neural crest formation(GO:0090301) regulation of fibroblast growth factor receptor signaling pathway involved in neural plate anterior/posterior pattern formation(GO:2000313) negative regulation of fibroblast growth factor receptor signaling pathway involved in neural plate anterior/posterior pattern formation(GO:2000314) |
| 2.3 | 6.8 | GO:0021966 | corticospinal neuron axon guidance(GO:0021966) |
| 2.1 | 8.3 | GO:0043456 | regulation of pentose-phosphate shunt(GO:0043456) |
| 2.0 | 16.2 | GO:0043353 | enucleate erythrocyte differentiation(GO:0043353) |
| 1.9 | 20.5 | GO:0006600 | creatine metabolic process(GO:0006600) |
| 1.8 | 16.4 | GO:0061302 | smooth muscle cell-matrix adhesion(GO:0061302) |
| 1.7 | 5.1 | GO:0070940 | dephosphorylation of RNA polymerase II C-terminal domain(GO:0070940) |
| 1.7 | 10.0 | GO:0016554 | cytidine to uridine editing(GO:0016554) |
| 1.7 | 13.2 | GO:0001661 | conditioned taste aversion(GO:0001661) |
| 1.6 | 4.9 | GO:1900073 | regulation of neuromuscular synaptic transmission(GO:1900073) positive regulation of neuromuscular synaptic transmission(GO:1900075) |
| 1.6 | 114.8 | GO:0033275 | muscle filament sliding(GO:0030049) actin-myosin filament sliding(GO:0033275) |
| 1.5 | 4.6 | GO:1901899 | positive regulation of relaxation of cardiac muscle(GO:1901899) regulation of calcium ion import into sarcoplasmic reticulum(GO:1902080) negative regulation of calcium ion import into sarcoplasmic reticulum(GO:1902081) |
| 1.4 | 8.3 | GO:2001181 | positive regulation of interleukin-10 secretion(GO:2001181) |
| 1.3 | 5.2 | GO:0006072 | glycerol-3-phosphate metabolic process(GO:0006072) |
| 1.3 | 3.8 | GO:0019254 | carnitine metabolic process, CoA-linked(GO:0019254) |
| 1.2 | 3.7 | GO:1902630 | regulation of membrane hyperpolarization(GO:1902630) |
| 1.1 | 3.2 | GO:0018307 | enzyme active site formation(GO:0018307) tRNA thio-modification(GO:0034227) |
| 1.0 | 3.1 | GO:1900368 | transcription, RNA-templated(GO:0001172) regulation of RNA interference(GO:1900368) negative regulation of RNA interference(GO:1900369) positive regulation of protein localization to nucleolus(GO:1904751) |
| 1.0 | 2.9 | GO:0060278 | regulation of ovulation(GO:0060278) positive regulation of ovulation(GO:0060279) |
| 0.9 | 4.7 | GO:0035582 | sequestering of BMP in extracellular matrix(GO:0035582) |
| 0.9 | 5.6 | GO:0006287 | base-excision repair, gap-filling(GO:0006287) |
| 0.9 | 3.5 | GO:0010961 | cellular magnesium ion homeostasis(GO:0010961) |
| 0.8 | 3.3 | GO:0010982 | regulation of high-density lipoprotein particle clearance(GO:0010982) positive regulation of lipoprotein particle clearance(GO:0010986) |
| 0.8 | 4.1 | GO:0036115 | fatty-acyl-CoA catabolic process(GO:0036115) malonyl-CoA metabolic process(GO:2001293) |
| 0.8 | 3.2 | GO:0018032 | peptide amidation(GO:0001519) protein amidation(GO:0018032) peptide modification(GO:0031179) |
| 0.7 | 10.5 | GO:1901750 | leukotriene D4 metabolic process(GO:1901748) leukotriene D4 biosynthetic process(GO:1901750) |
| 0.7 | 2.9 | GO:0003205 | cardiac chamber development(GO:0003205) |
| 0.7 | 2.8 | GO:0045872 | positive regulation of rhodopsin gene expression(GO:0045872) |
| 0.7 | 2.0 | GO:0045925 | positive regulation of female receptivity(GO:0045925) |
| 0.6 | 3.0 | GO:0010936 | negative regulation of macrophage cytokine production(GO:0010936) |
| 0.6 | 4.7 | GO:0038028 | insulin receptor signaling pathway via phosphatidylinositol 3-kinase(GO:0038028) |
| 0.6 | 2.3 | GO:0038083 | peptidyl-tyrosine autophosphorylation(GO:0038083) |
| 0.6 | 1.7 | GO:0070460 | thyroid-stimulating hormone secretion(GO:0070460) regulation of thyroid-stimulating hormone secretion(GO:2000612) |
| 0.6 | 2.3 | GO:0072660 | positive regulation of cell communication by electrical coupling(GO:0010650) maintenance of protein location in membrane(GO:0072658) maintenance of protein location in plasma membrane(GO:0072660) positive regulation of membrane depolarization during cardiac muscle cell action potential(GO:1900827) |
| 0.6 | 2.8 | GO:0015670 | carbon dioxide transport(GO:0015670) |
| 0.5 | 2.1 | GO:0035426 | extracellular matrix-cell signaling(GO:0035426) |
| 0.5 | 4.1 | GO:0070544 | histone H3-K36 demethylation(GO:0070544) negative regulation of histone H3-K9 trimethylation(GO:1900113) |
| 0.5 | 1.5 | GO:0000294 | nuclear-transcribed mRNA catabolic process, endonucleolytic cleavage-dependent decay(GO:0000294) negative regulation by host of viral genome replication(GO:0044828) |
| 0.5 | 6.6 | GO:0001867 | complement activation, lectin pathway(GO:0001867) |
| 0.5 | 1.0 | GO:1903207 | neuron death in response to hydrogen peroxide(GO:0036476) regulation of hydrogen peroxide-induced neuron death(GO:1903207) negative regulation of hydrogen peroxide-induced neuron death(GO:1903208) |
| 0.5 | 5.1 | GO:0036159 | inner dynein arm assembly(GO:0036159) |
| 0.4 | 1.3 | GO:0035283 | rhombomere 3 development(GO:0021569) rhombomere 5 development(GO:0021571) central nervous system segmentation(GO:0035283) brain segmentation(GO:0035284) |
| 0.4 | 3.6 | GO:0036484 | trunk segmentation(GO:0035290) trunk neural crest cell migration(GO:0036484) ventral trunk neural crest cell migration(GO:0036486) |
| 0.4 | 1.3 | GO:0006420 | arginyl-tRNA aminoacylation(GO:0006420) |
| 0.4 | 1.8 | GO:0036269 | swimming behavior(GO:0036269) |
| 0.4 | 3.5 | GO:0048630 | skeletal muscle tissue growth(GO:0048630) |
| 0.4 | 2.6 | GO:0010746 | regulation of plasma membrane long-chain fatty acid transport(GO:0010746) negative regulation of plasma membrane long-chain fatty acid transport(GO:0010748) |
| 0.4 | 1.3 | GO:1900220 | semaphorin-plexin signaling pathway involved in bone trabecula morphogenesis(GO:1900220) |
| 0.4 | 6.7 | GO:0045475 | locomotor rhythm(GO:0045475) |
| 0.4 | 1.7 | GO:0021938 | ventral midline development(GO:0007418) smoothened signaling pathway involved in regulation of cerebellar granule cell precursor cell proliferation(GO:0021938) |
| 0.4 | 6.6 | GO:2000291 | regulation of myoblast proliferation(GO:2000291) |
| 0.4 | 1.2 | GO:1903413 | cellular response to bile acid(GO:1903413) |
| 0.4 | 1.2 | GO:1904404 | cellular response to vitamin B1(GO:0071301) response to formaldehyde(GO:1904404) |
| 0.4 | 2.8 | GO:0051533 | positive regulation of NFAT protein import into nucleus(GO:0051533) |
| 0.4 | 1.6 | GO:0038018 | Wnt receptor catabolic process(GO:0038018) |
| 0.4 | 2.4 | GO:0015842 | aminergic neurotransmitter loading into synaptic vesicle(GO:0015842) |
| 0.4 | 1.6 | GO:0090076 | relaxation of skeletal muscle(GO:0090076) |
| 0.4 | 3.9 | GO:0071313 | cellular response to caffeine(GO:0071313) |
| 0.4 | 1.1 | GO:0045014 | carbon catabolite repression of transcription(GO:0045013) negative regulation of transcription by glucose(GO:0045014) |
| 0.4 | 1.1 | GO:1901341 | activation of store-operated calcium channel activity(GO:0032237) positive regulation of store-operated calcium channel activity(GO:1901341) |
| 0.4 | 1.1 | GO:0035948 | positive regulation of gluconeogenesis by positive regulation of transcription from RNA polymerase II promoter(GO:0035948) |
| 0.4 | 10.2 | GO:0016338 | calcium-independent cell-cell adhesion via plasma membrane cell-adhesion molecules(GO:0016338) |
| 0.4 | 7.4 | GO:0019800 | peptide cross-linking via chondroitin 4-sulfate glycosaminoglycan(GO:0019800) |
| 0.3 | 1.7 | GO:0060800 | regulation of cell differentiation involved in embryonic placenta development(GO:0060800) |
| 0.3 | 2.4 | GO:0071688 | striated muscle myosin thick filament assembly(GO:0071688) |
| 0.3 | 1.0 | GO:0014859 | negative regulation of skeletal muscle cell proliferation(GO:0014859) negative regulation of skeletal muscle satellite cell proliferation(GO:1902723) |
| 0.3 | 1.3 | GO:0045607 | regulation of auditory receptor cell differentiation(GO:0045607) regulation of mechanoreceptor differentiation(GO:0045631) regulation of inner ear receptor cell differentiation(GO:2000980) |
| 0.3 | 1.6 | GO:2000035 | regulation of stem cell division(GO:2000035) |
| 0.3 | 2.6 | GO:0006013 | mannose metabolic process(GO:0006013) |
| 0.3 | 5.8 | GO:0007021 | tubulin complex assembly(GO:0007021) |
| 0.3 | 1.6 | GO:0033078 | extrathymic T cell differentiation(GO:0033078) |
| 0.3 | 2.2 | GO:0060837 | blood vessel endothelial cell differentiation(GO:0060837) arterial endothelial cell differentiation(GO:0060842) |
| 0.3 | 4.0 | GO:0021942 | radial glia guided migration of Purkinje cell(GO:0021942) |
| 0.3 | 1.9 | GO:2000503 | positive regulation of natural killer cell chemotaxis(GO:2000503) |
| 0.3 | 0.9 | GO:0090038 | negative regulation of protein kinase C signaling(GO:0090038) |
| 0.3 | 0.9 | GO:0086100 | endothelin receptor signaling pathway(GO:0086100) |
| 0.3 | 2.3 | GO:0006701 | progesterone biosynthetic process(GO:0006701) |
| 0.3 | 1.7 | GO:2000676 | positive regulation of type B pancreatic cell apoptotic process(GO:2000676) |
| 0.3 | 3.7 | GO:0050808 | synapse organization(GO:0050808) |
| 0.3 | 6.1 | GO:0045662 | negative regulation of myoblast differentiation(GO:0045662) |
| 0.3 | 1.4 | GO:0048165 | ovarian cumulus expansion(GO:0001550) fused antrum stage(GO:0048165) |
| 0.3 | 2.7 | GO:0060158 | phospholipase C-activating dopamine receptor signaling pathway(GO:0060158) |
| 0.3 | 2.4 | GO:0046886 | positive regulation of hormone biosynthetic process(GO:0046886) |
| 0.3 | 1.6 | GO:0018095 | protein polyglutamylation(GO:0018095) |
| 0.3 | 1.5 | GO:0017196 | N-terminal peptidyl-methionine acetylation(GO:0017196) |
| 0.3 | 2.3 | GO:0086024 | adrenergic receptor signaling pathway involved in positive regulation of heart rate(GO:0086024) |
| 0.3 | 6.5 | GO:0030252 | growth hormone secretion(GO:0030252) |
| 0.2 | 2.5 | GO:0009414 | response to water deprivation(GO:0009414) |
| 0.2 | 1.2 | GO:0061143 | alveolar primary septum development(GO:0061143) |
| 0.2 | 1.2 | GO:0010512 | negative regulation of phosphatidylinositol biosynthetic process(GO:0010512) |
| 0.2 | 2.7 | GO:0010666 | positive regulation of striated muscle cell apoptotic process(GO:0010663) positive regulation of cardiac muscle cell apoptotic process(GO:0010666) |
| 0.2 | 2.0 | GO:0071374 | cellular response to parathyroid hormone stimulus(GO:0071374) |
| 0.2 | 4.0 | GO:0097067 | cellular response to thyroid hormone stimulus(GO:0097067) |
| 0.2 | 1.6 | GO:0038030 | non-canonical Wnt signaling pathway via MAPK cascade(GO:0038030) non-canonical Wnt signaling pathway via JNK cascade(GO:0038031) |
| 0.2 | 3.0 | GO:0048535 | lymph node development(GO:0048535) |
| 0.2 | 1.6 | GO:0019532 | oxalate transport(GO:0019532) |
| 0.2 | 3.7 | GO:0008655 | pyrimidine-containing compound salvage(GO:0008655) pyrimidine nucleoside salvage(GO:0043097) |
| 0.2 | 0.5 | GO:0043415 | positive regulation of skeletal muscle tissue regeneration(GO:0043415) regulation of skeletal muscle tissue regeneration(GO:0043416) |
| 0.2 | 2.1 | GO:0072383 | plus-end-directed vesicle transport along microtubule(GO:0072383) |
| 0.2 | 3.1 | GO:0035878 | nail development(GO:0035878) |
| 0.2 | 14.0 | GO:2000649 | regulation of sodium ion transmembrane transporter activity(GO:2000649) |
| 0.2 | 1.9 | GO:0060088 | auditory receptor cell stereocilium organization(GO:0060088) |
| 0.2 | 33.7 | GO:0007519 | skeletal muscle tissue development(GO:0007519) |
| 0.2 | 0.6 | GO:0036378 | calcitriol biosynthetic process from calciol(GO:0036378) |
| 0.2 | 0.8 | GO:0048496 | maintenance of organ identity(GO:0048496) |
| 0.2 | 0.6 | GO:0031630 | regulation of synaptic vesicle fusion to presynaptic membrane(GO:0031630) |
| 0.2 | 0.6 | GO:0061743 | motor learning(GO:0061743) |
| 0.2 | 2.0 | GO:0007507 | heart development(GO:0007507) |
| 0.2 | 0.8 | GO:0060666 | dichotomous subdivision of terminal units involved in salivary gland branching(GO:0060666) |
| 0.2 | 1.6 | GO:0032020 | ISG15-protein conjugation(GO:0032020) |
| 0.2 | 3.3 | GO:0046069 | cGMP catabolic process(GO:0046069) |
| 0.2 | 1.1 | GO:0043696 | dedifferentiation(GO:0043696) cell dedifferentiation(GO:0043697) |
| 0.2 | 0.6 | GO:0060454 | detection of temperature stimulus involved in thermoception(GO:0050960) positive regulation of gastric acid secretion(GO:0060454) response to capsazepine(GO:1901594) |
| 0.2 | 0.7 | GO:2001271 | negative regulation of cysteine-type endopeptidase activity involved in execution phase of apoptosis(GO:2001271) |
| 0.2 | 7.1 | GO:0055078 | sodium ion homeostasis(GO:0055078) |
| 0.2 | 0.7 | GO:0015917 | aminophospholipid transport(GO:0015917) |
| 0.2 | 1.6 | GO:0070997 | neuron death(GO:0070997) |
| 0.2 | 5.2 | GO:0002076 | osteoblast development(GO:0002076) |
| 0.2 | 2.6 | GO:0034497 | protein localization to pre-autophagosomal structure(GO:0034497) |
| 0.2 | 2.2 | GO:0035020 | regulation of Rac protein signal transduction(GO:0035020) |
| 0.2 | 4.5 | GO:0016578 | histone deubiquitination(GO:0016578) |
| 0.2 | 0.9 | GO:0003084 | positive regulation of systemic arterial blood pressure(GO:0003084) |
| 0.2 | 3.1 | GO:0030220 | platelet formation(GO:0030220) |
| 0.2 | 2.6 | GO:0051255 | spindle midzone assembly(GO:0051255) |
| 0.2 | 8.0 | GO:0080171 | lysosome organization(GO:0007040) lytic vacuole organization(GO:0080171) |
| 0.1 | 0.4 | GO:0048936 | sensory system development(GO:0048880) peripheral nervous system neuron axonogenesis(GO:0048936) |
| 0.1 | 1.2 | GO:0060012 | synaptic transmission, glycinergic(GO:0060012) |
| 0.1 | 0.7 | GO:0003069 | age-dependent response to oxidative stress(GO:0001306) age-dependent response to reactive oxygen species(GO:0001315) regulation of systemic arterial blood pressure by acetylcholine(GO:0003068) vasodilation by acetylcholine involved in regulation of systemic arterial blood pressure(GO:0003069) regulation of systemic arterial blood pressure by neurotransmitter(GO:0003070) age-dependent general metabolic decline(GO:0007571) |
| 0.1 | 0.9 | GO:0015693 | magnesium ion transport(GO:0015693) |
| 0.1 | 1.3 | GO:0071421 | manganese ion transmembrane transport(GO:0071421) |
| 0.1 | 0.9 | GO:0061179 | negative regulation of insulin secretion involved in cellular response to glucose stimulus(GO:0061179) |
| 0.1 | 1.0 | GO:0033234 | negative regulation of protein sumoylation(GO:0033234) |
| 0.1 | 1.0 | GO:0003344 | pericardium morphogenesis(GO:0003344) |
| 0.1 | 4.1 | GO:0005980 | glycogen catabolic process(GO:0005980) |
| 0.1 | 4.0 | GO:0045104 | intermediate filament cytoskeleton organization(GO:0045104) |
| 0.1 | 2.5 | GO:1903392 | negative regulation of focal adhesion assembly(GO:0051895) negative regulation of adherens junction organization(GO:1903392) |
| 0.1 | 2.2 | GO:0043153 | entrainment of circadian clock by photoperiod(GO:0043153) |
| 0.1 | 2.0 | GO:0050881 | multicellular organismal movement(GO:0050879) musculoskeletal movement(GO:0050881) |
| 0.1 | 1.0 | GO:0006477 | protein sulfation(GO:0006477) |
| 0.1 | 6.9 | GO:0007585 | respiratory gaseous exchange(GO:0007585) |
| 0.1 | 2.7 | GO:0035338 | long-chain fatty-acyl-CoA biosynthetic process(GO:0035338) |
| 0.1 | 1.2 | GO:0010763 | positive regulation of fibroblast migration(GO:0010763) |
| 0.1 | 2.2 | GO:0031581 | hemidesmosome assembly(GO:0031581) |
| 0.1 | 1.9 | GO:0045717 | negative regulation of fatty acid biosynthetic process(GO:0045717) |
| 0.1 | 2.1 | GO:0002089 | lens morphogenesis in camera-type eye(GO:0002089) |
| 0.1 | 1.0 | GO:2000346 | negative regulation of hepatocyte proliferation(GO:2000346) |
| 0.1 | 1.0 | GO:0035435 | phosphate ion transmembrane transport(GO:0035435) |
| 0.1 | 4.6 | GO:0010501 | RNA secondary structure unwinding(GO:0010501) |
| 0.1 | 2.0 | GO:0003334 | keratinocyte development(GO:0003334) |
| 0.1 | 0.9 | GO:0032264 | IMP salvage(GO:0032264) |
| 0.1 | 0.7 | GO:0007229 | integrin-mediated signaling pathway(GO:0007229) |
| 0.1 | 1.7 | GO:0043508 | negative regulation of JUN kinase activity(GO:0043508) |
| 0.1 | 0.4 | GO:0015688 | iron chelate transport(GO:0015688) siderophore transport(GO:0015891) |
| 0.1 | 1.1 | GO:2000271 | positive regulation of fibroblast apoptotic process(GO:2000271) |
| 0.1 | 0.9 | GO:0000050 | urea cycle(GO:0000050) |
| 0.1 | 0.8 | GO:2000304 | positive regulation of sphingolipid biosynthetic process(GO:0090154) positive regulation of ceramide biosynthetic process(GO:2000304) |
| 0.1 | 2.1 | GO:0097352 | autophagosome maturation(GO:0097352) |
| 0.1 | 1.4 | GO:0002244 | hematopoietic progenitor cell differentiation(GO:0002244) |
| 0.1 | 0.6 | GO:0000712 | resolution of meiotic recombination intermediates(GO:0000712) |
| 0.1 | 4.2 | GO:0018279 | protein N-linked glycosylation via asparagine(GO:0018279) |
| 0.1 | 1.2 | GO:0006853 | carnitine shuttle(GO:0006853) |
| 0.1 | 1.4 | GO:0070977 | bone maturation(GO:0070977) |
| 0.1 | 1.6 | GO:0046676 | negative regulation of insulin secretion(GO:0046676) |
| 0.1 | 0.9 | GO:0007498 | mesoderm development(GO:0007498) |
| 0.1 | 1.7 | GO:0071526 | semaphorin-plexin signaling pathway(GO:0071526) |
| 0.1 | 8.8 | GO:0021987 | cerebral cortex development(GO:0021987) |
| 0.1 | 1.1 | GO:0035090 | maintenance of apical/basal cell polarity(GO:0035090) maintenance of epithelial cell apical/basal polarity(GO:0045199) |
| 0.1 | 0.9 | GO:0032354 | response to follicle-stimulating hormone(GO:0032354) |
| 0.1 | 3.5 | GO:0001578 | microtubule bundle formation(GO:0001578) |
| 0.1 | 1.2 | GO:1900153 | regulation of nuclear-transcribed mRNA catabolic process, deadenylation-dependent decay(GO:1900151) positive regulation of nuclear-transcribed mRNA catabolic process, deadenylation-dependent decay(GO:1900153) |
| 0.1 | 0.4 | GO:0006591 | ornithine metabolic process(GO:0006591) |
| 0.1 | 0.4 | GO:0033147 | negative regulation of intracellular estrogen receptor signaling pathway(GO:0033147) |
| 0.1 | 0.7 | GO:0033599 | regulation of mammary gland epithelial cell proliferation(GO:0033599) |
| 0.1 | 0.7 | GO:0040018 | positive regulation of multicellular organism growth(GO:0040018) |
| 0.1 | 1.6 | GO:0016339 | calcium-dependent cell-cell adhesion via plasma membrane cell adhesion molecules(GO:0016339) |
| 0.1 | 1.0 | GO:0071447 | cellular response to hydroperoxide(GO:0071447) |
| 0.1 | 0.8 | GO:0048935 | peripheral nervous system neuron differentiation(GO:0048934) peripheral nervous system neuron development(GO:0048935) |
| 0.1 | 2.7 | GO:0050911 | detection of chemical stimulus involved in sensory perception of smell(GO:0050911) |
| 0.1 | 0.5 | GO:0016576 | histone dephosphorylation(GO:0016576) |
| 0.1 | 0.8 | GO:0042753 | positive regulation of circadian rhythm(GO:0042753) |
| 0.1 | 2.0 | GO:0043304 | regulation of mast cell activation involved in immune response(GO:0033006) regulation of mast cell degranulation(GO:0043304) |
| 0.1 | 0.6 | GO:0015074 | DNA integration(GO:0015074) |
| 0.1 | 1.8 | GO:0007205 | protein kinase C-activating G-protein coupled receptor signaling pathway(GO:0007205) |
| 0.1 | 1.1 | GO:0010719 | negative regulation of epithelial to mesenchymal transition(GO:0010719) |
| 0.1 | 0.6 | GO:0010759 | positive regulation of macrophage chemotaxis(GO:0010759) |
| 0.1 | 2.3 | GO:0051262 | protein tetramerization(GO:0051262) |
| 0.1 | 5.6 | GO:0022617 | extracellular matrix disassembly(GO:0022617) |
| 0.0 | 1.4 | GO:1901687 | glutathione derivative metabolic process(GO:1901685) glutathione derivative biosynthetic process(GO:1901687) |
| 0.0 | 1.0 | GO:0070536 | protein K63-linked deubiquitination(GO:0070536) |
| 0.0 | 0.2 | GO:0060708 | spongiotrophoblast differentiation(GO:0060708) |
| 0.0 | 0.9 | GO:0060009 | Sertoli cell development(GO:0060009) |
| 0.0 | 0.4 | GO:0006776 | vitamin A metabolic process(GO:0006776) |
| 0.0 | 1.6 | GO:0045197 | establishment or maintenance of epithelial cell apical/basal polarity(GO:0045197) |
| 0.0 | 1.4 | GO:0045672 | positive regulation of osteoclast differentiation(GO:0045672) |
| 0.0 | 0.4 | GO:0036109 | alpha-linolenic acid metabolic process(GO:0036109) |
| 0.0 | 0.2 | GO:0010587 | miRNA catabolic process(GO:0010587) |
| 0.0 | 0.3 | GO:1902659 | regulation of glucose mediated signaling pathway(GO:1902659) |
| 0.0 | 0.3 | GO:1900122 | positive regulation of receptor binding(GO:1900122) |
| 0.0 | 1.0 | GO:0010863 | positive regulation of phospholipase C activity(GO:0010863) |
| 0.0 | 2.3 | GO:0071260 | cellular response to mechanical stimulus(GO:0071260) |
| 0.0 | 7.8 | GO:0006986 | response to unfolded protein(GO:0006986) |
| 0.0 | 0.7 | GO:0045898 | regulation of RNA polymerase II transcriptional preinitiation complex assembly(GO:0045898) |
| 0.0 | 2.5 | GO:0030449 | regulation of complement activation(GO:0030449) |
| 0.0 | 2.1 | GO:0043966 | histone H3 acetylation(GO:0043966) |
| 0.0 | 2.8 | GO:0090630 | activation of GTPase activity(GO:0090630) |
| 0.0 | 0.9 | GO:0051092 | positive regulation of NF-kappaB transcription factor activity(GO:0051092) |
| 0.0 | 1.9 | GO:0090502 | RNA phosphodiester bond hydrolysis, endonucleolytic(GO:0090502) |
| 0.0 | 0.3 | GO:0019375 | galactosylceramide biosynthetic process(GO:0006682) galactolipid biosynthetic process(GO:0019375) |
| 0.0 | 4.4 | GO:0035023 | regulation of Rho protein signal transduction(GO:0035023) |
| 0.0 | 0.8 | GO:0090140 | regulation of mitochondrial fission(GO:0090140) |
| 0.0 | 0.5 | GO:0051457 | maintenance of protein location in nucleus(GO:0051457) |
| 0.0 | 1.1 | GO:0010862 | positive regulation of pathway-restricted SMAD protein phosphorylation(GO:0010862) |
| 0.0 | 1.9 | GO:0006081 | cellular aldehyde metabolic process(GO:0006081) |
| 0.0 | 0.2 | GO:0023021 | termination of signal transduction(GO:0023021) |
| 0.0 | 0.4 | GO:0046855 | phosphorylated carbohydrate dephosphorylation(GO:0046838) inositol phosphate dephosphorylation(GO:0046855) |
| 0.0 | 1.1 | GO:0032233 | positive regulation of actin filament bundle assembly(GO:0032233) |
| 0.0 | 0.7 | GO:0045747 | positive regulation of Notch signaling pathway(GO:0045747) |
| 0.0 | 0.5 | GO:0010543 | regulation of platelet activation(GO:0010543) |
| 0.0 | 3.9 | GO:0006814 | sodium ion transport(GO:0006814) |
| 0.0 | 0.9 | GO:0001525 | angiogenesis(GO:0001525) |
| 0.0 | 0.2 | GO:0030202 | heparin metabolic process(GO:0030202) heparin biosynthetic process(GO:0030210) |
| 0.0 | 0.2 | GO:0007517 | muscle organ development(GO:0007517) |
| 0.0 | 0.7 | GO:0051058 | negative regulation of Ras protein signal transduction(GO:0046580) negative regulation of small GTPase mediated signal transduction(GO:0051058) |
| 0.0 | 0.0 | GO:0060586 | multicellular organismal iron ion homeostasis(GO:0060586) |
| 0.0 | 0.4 | GO:0016242 | negative regulation of macroautophagy(GO:0016242) |
| 0.0 | 0.4 | GO:0034204 | lipid translocation(GO:0034204) phospholipid translocation(GO:0045332) |
| 0.0 | 1.6 | GO:0042058 | regulation of epidermal growth factor receptor signaling pathway(GO:0042058) |
| 0.0 | 0.7 | GO:0050829 | defense response to Gram-negative bacterium(GO:0050829) |
| 0.0 | 1.3 | GO:0006970 | response to osmotic stress(GO:0006970) |
| 0.0 | 0.3 | GO:0035967 | cellular response to topologically incorrect protein(GO:0035967) |
| 0.0 | 7.4 | GO:0050900 | leukocyte migration(GO:0050900) |
| 0.0 | 0.5 | GO:0000460 | maturation of 5.8S rRNA(GO:0000460) |
| 0.0 | 0.1 | GO:0031936 | negative regulation of chromatin silencing(GO:0031936) |
| 0.0 | 0.5 | GO:0006308 | DNA catabolic process(GO:0006308) |
| 0.0 | 0.9 | GO:0010923 | negative regulation of phosphatase activity(GO:0010923) |
| 0.0 | 0.1 | GO:0035855 | megakaryocyte development(GO:0035855) |
| 0.0 | 1.5 | GO:0070268 | cornification(GO:0070268) |
| 0.0 | 0.3 | GO:0007159 | leukocyte cell-cell adhesion(GO:0007159) |
| 0.0 | 0.6 | GO:0007214 | gamma-aminobutyric acid signaling pathway(GO:0007214) |
| 0.0 | 0.9 | GO:0009798 | axis specification(GO:0009798) |
| 0.0 | 1.4 | GO:0051260 | protein homooligomerization(GO:0051260) |
| 0.0 | 0.1 | GO:0001502 | cartilage condensation(GO:0001502) |
| 0.0 | 0.4 | GO:0051693 | actin filament capping(GO:0051693) |
| 0.0 | 0.6 | GO:0006891 | intra-Golgi vesicle-mediated transport(GO:0006891) |
| 0.0 | 0.6 | GO:0006953 | acute-phase response(GO:0006953) |
| 0.0 | 2.4 | GO:0018105 | peptidyl-serine phosphorylation(GO:0018105) |
| 0.0 | 0.2 | GO:0007196 | adenylate cyclase-inhibiting G-protein coupled glutamate receptor signaling pathway(GO:0007196) |
Gene overrepresentation in cellular_component category:
| Log-likelihood per target | Total log-likelihood | Term | Description |
|---|---|---|---|
| 6.9 | 41.2 | GO:0061689 | tricellular tight junction(GO:0061689) |
| 3.1 | 73.7 | GO:0005861 | troponin complex(GO:0005861) |
| 2.3 | 18.0 | GO:0035976 | AP1 complex(GO:0035976) |
| 1.7 | 62.9 | GO:0005859 | muscle myosin complex(GO:0005859) |
| 1.6 | 17.6 | GO:0097512 | cardiac myofibril(GO:0097512) |
| 1.3 | 5.3 | GO:0070695 | FHF complex(GO:0070695) |
| 1.2 | 21.9 | GO:0005862 | muscle thin filament tropomyosin(GO:0005862) |
| 0.8 | 7.9 | GO:0071953 | elastic fiber(GO:0071953) |
| 0.8 | 3.1 | GO:0000333 | telomerase catalytic core complex(GO:0000333) |
| 0.7 | 5.8 | GO:0045179 | apical cortex(GO:0045179) |
| 0.7 | 2.7 | GO:1990604 | IRE1-TRAF2-ASK1 complex(GO:1990604) |
| 0.6 | 3.7 | GO:0009331 | glycerol-3-phosphate dehydrogenase complex(GO:0009331) |
| 0.6 | 2.4 | GO:0070081 | clathrin-sculpted monoamine transport vesicle(GO:0070081) clathrin-sculpted monoamine transport vesicle membrane(GO:0070083) |
| 0.5 | 12.8 | GO:0034706 | sodium channel complex(GO:0034706) |
| 0.4 | 4.6 | GO:0033018 | sarcoplasmic reticulum lumen(GO:0033018) |
| 0.4 | 2.5 | GO:0072558 | NLRP1 inflammasome complex(GO:0072558) |
| 0.4 | 2.0 | GO:0042643 | actomyosin, actin portion(GO:0042643) |
| 0.4 | 1.2 | GO:0016935 | glycine-gated chloride channel complex(GO:0016935) |
| 0.4 | 4.9 | GO:0099634 | postsynaptic specialization membrane(GO:0099634) |
| 0.4 | 2.8 | GO:0098554 | cytoplasmic side of endoplasmic reticulum membrane(GO:0098554) |
| 0.4 | 4.0 | GO:0097427 | microtubule bundle(GO:0097427) |
| 0.4 | 1.5 | GO:0031417 | NatC complex(GO:0031417) |
| 0.4 | 6.6 | GO:0031143 | pseudopodium(GO:0031143) |
| 0.3 | 10.5 | GO:0046658 | anchored component of plasma membrane(GO:0046658) |
| 0.3 | 4.6 | GO:0000124 | SAGA complex(GO:0000124) |
| 0.3 | 3.9 | GO:1990454 | L-type voltage-gated calcium channel complex(GO:1990454) |
| 0.3 | 2.0 | GO:1990635 | proximal dendrite(GO:1990635) |
| 0.3 | 9.6 | GO:0016327 | apicolateral plasma membrane(GO:0016327) |
| 0.3 | 5.5 | GO:0030056 | hemidesmosome(GO:0030056) |
| 0.3 | 7.2 | GO:0034451 | centriolar satellite(GO:0034451) |
| 0.3 | 41.0 | GO:0030018 | Z disc(GO:0030018) |
| 0.3 | 1.5 | GO:0042406 | extrinsic component of endoplasmic reticulum membrane(GO:0042406) |
| 0.2 | 7.7 | GO:0051233 | spindle midzone(GO:0051233) |
| 0.2 | 2.1 | GO:0033588 | Elongator holoenzyme complex(GO:0033588) |
| 0.2 | 2.0 | GO:0044194 | cytolytic granule(GO:0044194) |
| 0.2 | 4.2 | GO:0001527 | microfibril(GO:0001527) fibril(GO:0043205) |
| 0.2 | 1.0 | GO:0000836 | Hrd1p ubiquitin ligase complex(GO:0000836) |
| 0.2 | 2.2 | GO:0033391 | chromatoid body(GO:0033391) |
| 0.2 | 2.4 | GO:0005577 | fibrinogen complex(GO:0005577) |
| 0.2 | 1.3 | GO:0030121 | AP-1 adaptor complex(GO:0030121) |
| 0.2 | 1.1 | GO:0032541 | cortical endoplasmic reticulum(GO:0032541) |
| 0.2 | 0.7 | GO:0044326 | dendritic spine neck(GO:0044326) |
| 0.2 | 1.4 | GO:0070938 | contractile ring(GO:0070938) |
| 0.2 | 3.7 | GO:0030173 | integral component of Golgi membrane(GO:0030173) |
| 0.1 | 2.1 | GO:0033270 | paranode region of axon(GO:0033270) |
| 0.1 | 8.3 | GO:0005782 | peroxisomal matrix(GO:0005782) microbody lumen(GO:0031907) |
| 0.1 | 2.3 | GO:0044232 | organelle membrane contact site(GO:0044232) |
| 0.1 | 3.0 | GO:0005892 | acetylcholine-gated channel complex(GO:0005892) |
| 0.1 | 6.1 | GO:0016235 | aggresome(GO:0016235) |
| 0.1 | 2.3 | GO:0005849 | mRNA cleavage factor complex(GO:0005849) |
| 0.1 | 1.3 | GO:0002116 | semaphorin receptor complex(GO:0002116) |
| 0.1 | 11.3 | GO:0031093 | platelet alpha granule lumen(GO:0031093) |
| 0.1 | 1.4 | GO:1990712 | HFE-transferrin receptor complex(GO:1990712) |
| 0.1 | 3.5 | GO:0005891 | voltage-gated calcium channel complex(GO:0005891) |
| 0.1 | 2.8 | GO:0009925 | basal plasma membrane(GO:0009925) |
| 0.1 | 2.0 | GO:0034704 | calcium channel complex(GO:0034704) |
| 0.1 | 3.2 | GO:0031092 | platelet alpha granule membrane(GO:0031092) |
| 0.1 | 0.6 | GO:1990769 | proximal neuron projection(GO:1990769) |
| 0.1 | 1.2 | GO:0031588 | nucleotide-activated protein kinase complex(GO:0031588) |
| 0.1 | 3.2 | GO:0016529 | sarcoplasmic reticulum(GO:0016529) |
| 0.1 | 0.6 | GO:0005865 | striated muscle thin filament(GO:0005865) myofilament(GO:0036379) |
| 0.1 | 0.6 | GO:0043240 | Fanconi anaemia nuclear complex(GO:0043240) |
| 0.1 | 0.5 | GO:0070545 | PeBoW complex(GO:0070545) |
| 0.1 | 0.9 | GO:0008385 | IkappaB kinase complex(GO:0008385) |
| 0.1 | 0.5 | GO:0014731 | spectrin-associated cytoskeleton(GO:0014731) |
| 0.1 | 5.8 | GO:0030672 | synaptic vesicle membrane(GO:0030672) exocytic vesicle membrane(GO:0099501) |
| 0.1 | 2.1 | GO:0030057 | desmosome(GO:0030057) |
| 0.1 | 9.9 | GO:0043204 | perikaryon(GO:0043204) |
| 0.1 | 1.8 | GO:0030315 | T-tubule(GO:0030315) |
| 0.1 | 5.3 | GO:0005758 | mitochondrial intermembrane space(GO:0005758) |
| 0.1 | 0.6 | GO:0030126 | COPI vesicle coat(GO:0030126) |
| 0.1 | 5.8 | GO:0005884 | actin filament(GO:0005884) |
| 0.1 | 3.5 | GO:0031463 | Cul3-RING ubiquitin ligase complex(GO:0031463) |
| 0.1 | 0.5 | GO:0070022 | transforming growth factor beta receptor homodimeric complex(GO:0070022) |
| 0.1 | 1.1 | GO:0001726 | ruffle(GO:0001726) |
| 0.0 | 0.9 | GO:0031968 | mitochondrial outer membrane(GO:0005741) outer membrane(GO:0019867) organelle outer membrane(GO:0031968) |
| 0.0 | 0.8 | GO:0044295 | axonal growth cone(GO:0044295) |
| 0.0 | 3.5 | GO:0101003 | ficolin-1-rich granule membrane(GO:0101003) |
| 0.0 | 2.8 | GO:0055038 | recycling endosome membrane(GO:0055038) |
| 0.0 | 2.0 | GO:0005834 | heterotrimeric G-protein complex(GO:0005834) |
| 0.0 | 0.5 | GO:0044224 | juxtaparanode region of axon(GO:0044224) |
| 0.0 | 0.6 | GO:0032591 | dendritic spine membrane(GO:0032591) |
| 0.0 | 1.7 | GO:0097542 | ciliary tip(GO:0097542) |
| 0.0 | 2.6 | GO:0008076 | voltage-gated potassium channel complex(GO:0008076) potassium channel complex(GO:0034705) |
| 0.0 | 1.2 | GO:0048471 | perinuclear region of cytoplasm(GO:0048471) |
| 0.0 | 3.2 | GO:0055037 | recycling endosome(GO:0055037) |
| 0.0 | 0.8 | GO:0016459 | myosin complex(GO:0016459) |
| 0.0 | 1.6 | GO:0031526 | brush border membrane(GO:0031526) |
| 0.0 | 0.6 | GO:0031089 | platelet dense granule lumen(GO:0031089) |
| 0.0 | 1.9 | GO:0030669 | clathrin-coated endocytic vesicle membrane(GO:0030669) |
| 0.0 | 1.4 | GO:0030427 | growth cone(GO:0030426) site of polarized growth(GO:0030427) |
| 0.0 | 3.5 | GO:0032587 | ruffle membrane(GO:0032587) |
| 0.0 | 0.4 | GO:0031672 | A band(GO:0031672) |
| 0.0 | 0.2 | GO:1990452 | Parkin-FBXW7-Cul1 ubiquitin ligase complex(GO:1990452) |
| 0.0 | 1.0 | GO:0042629 | mast cell granule(GO:0042629) |
| 0.0 | 9.2 | GO:0005578 | proteinaceous extracellular matrix(GO:0005578) |
| 0.0 | 1.0 | GO:0005768 | endosome(GO:0005768) |
| 0.0 | 1.2 | GO:0030666 | endocytic vesicle membrane(GO:0030666) |
| 0.0 | 0.1 | GO:0005883 | neurofilament(GO:0005883) neurofibrillary tangle(GO:0097418) |
| 0.0 | 0.1 | GO:0033565 | ESCRT-0 complex(GO:0033565) |
| 0.0 | 0.4 | GO:0043198 | dendritic shaft(GO:0043198) |
| 0.0 | 0.5 | GO:0032391 | photoreceptor connecting cilium(GO:0032391) |
| 0.0 | 0.8 | GO:0019005 | SCF ubiquitin ligase complex(GO:0019005) |
| 0.0 | 0.6 | GO:1902711 | GABA-A receptor complex(GO:1902711) |
| 0.0 | 0.9 | GO:0001669 | acrosomal vesicle(GO:0001669) |
| 0.0 | 0.9 | GO:0030864 | cortical actin cytoskeleton(GO:0030864) |
| 0.0 | 2.7 | GO:0098852 | lysosomal membrane(GO:0005765) lytic vacuole membrane(GO:0098852) |
| 0.0 | 2.7 | GO:0000151 | ubiquitin ligase complex(GO:0000151) |
| 0.0 | 0.4 | GO:0000159 | protein phosphatase type 2A complex(GO:0000159) |
| 0.0 | 0.5 | GO:0070821 | tertiary granule membrane(GO:0070821) |
| 0.0 | 0.3 | GO:0035327 | transcriptionally active chromatin(GO:0035327) |
| 0.0 | 2.2 | GO:0005769 | early endosome(GO:0005769) |
| 0.0 | 0.5 | GO:0035580 | specific granule lumen(GO:0035580) |
Gene overrepresentation in molecular_function category:
| Log-likelihood per target | Total log-likelihood | Term | Description |
|---|---|---|---|
| 3.5 | 49.2 | GO:0031014 | troponin T binding(GO:0031014) |
| 3.3 | 16.4 | GO:0038062 | protein tyrosine kinase collagen receptor activity(GO:0038062) |
| 2.9 | 25.9 | GO:0043426 | MRF binding(GO:0043426) |
| 2.6 | 10.5 | GO:0060422 | peptidyl-dipeptidase inhibitor activity(GO:0060422) |
| 2.6 | 10.4 | GO:0030899 | calcium-dependent ATPase activity(GO:0030899) |
| 2.3 | 6.8 | GO:0086062 | voltage-gated sodium channel activity involved in Purkinje myocyte action potential(GO:0086062) |
| 2.1 | 8.3 | GO:0046538 | bisphosphoglycerate mutase activity(GO:0004082) phosphoglycerate mutase activity(GO:0004619) 2,3-bisphosphoglycerate-dependent phosphoglycerate mutase activity(GO:0046538) |
| 2.1 | 8.3 | GO:0032038 | myosin II heavy chain binding(GO:0032038) |
| 1.9 | 15.2 | GO:0004111 | creatine kinase activity(GO:0004111) |
| 1.5 | 5.8 | GO:0050262 | ribosylnicotinamide kinase activity(GO:0050262) ribosylnicotinate kinase activity(GO:0061769) |
| 1.2 | 16.2 | GO:0005344 | oxygen transporter activity(GO:0005344) |
| 1.2 | 119.2 | GO:0008307 | structural constituent of muscle(GO:0008307) |
| 1.0 | 3.1 | GO:0003968 | RNA-directed RNA polymerase activity(GO:0003968) |
| 1.0 | 5.1 | GO:0008420 | CTD phosphatase activity(GO:0008420) |
| 1.0 | 2.0 | GO:0030172 | troponin C binding(GO:0030172) |
| 1.0 | 2.0 | GO:0030348 | syntaxin-3 binding(GO:0030348) |
| 0.9 | 3.7 | GO:0033829 | O-fucosylpeptide 3-beta-N-acetylglucosaminyltransferase activity(GO:0033829) |
| 0.8 | 2.5 | GO:0032090 | Pyrin domain binding(GO:0032090) |
| 0.8 | 3.2 | GO:0004598 | peptidylglycine monooxygenase activity(GO:0004504) peptidylamidoglycolate lyase activity(GO:0004598) |
| 0.8 | 2.4 | GO:0015222 | serotonin transmembrane transporter activity(GO:0015222) |
| 0.8 | 7.8 | GO:0004075 | biotin carboxylase activity(GO:0004075) biotin binding(GO:0009374) |
| 0.7 | 10.5 | GO:0036374 | glutathione hydrolase activity(GO:0036374) |
| 0.7 | 3.5 | GO:0031708 | endothelin B receptor binding(GO:0031708) |
| 0.7 | 2.8 | GO:0042500 | aspartic endopeptidase activity, intramembrane cleaving(GO:0042500) |
| 0.7 | 4.8 | GO:0004126 | cytidine deaminase activity(GO:0004126) |
| 0.7 | 2.0 | GO:0051373 | FATZ binding(GO:0051373) |
| 0.6 | 3.9 | GO:1990254 | keratin filament binding(GO:1990254) |
| 0.6 | 4.9 | GO:0030023 | extracellular matrix constituent conferring elasticity(GO:0030023) |
| 0.6 | 2.4 | GO:0004874 | aryl hydrocarbon receptor activity(GO:0004874) |
| 0.6 | 5.6 | GO:0051575 | 5'-deoxyribose-5-phosphate lyase activity(GO:0051575) |
| 0.5 | 3.2 | GO:0004792 | thiosulfate sulfurtransferase activity(GO:0004792) |
| 0.5 | 4.2 | GO:0004873 | asialoglycoprotein receptor activity(GO:0004873) |
| 0.5 | 8.3 | GO:0030247 | pattern binding(GO:0001871) polysaccharide binding(GO:0030247) |
| 0.5 | 4.1 | GO:0051864 | histone demethylase activity (H3-K36 specific)(GO:0051864) |
| 0.5 | 7.1 | GO:0015280 | ligand-gated sodium channel activity(GO:0015280) |
| 0.5 | 3.8 | GO:0016406 | carnitine O-acyltransferase activity(GO:0016406) |
| 0.4 | 0.4 | GO:0016416 | O-palmitoyltransferase activity(GO:0016416) |
| 0.4 | 1.3 | GO:0004814 | arginine-tRNA ligase activity(GO:0004814) |
| 0.4 | 3.3 | GO:0004465 | lipoprotein lipase activity(GO:0004465) |
| 0.4 | 1.6 | GO:0070290 | N-acylphosphatidylethanolamine-specific phospholipase D activity(GO:0070290) |
| 0.4 | 1.2 | GO:0061663 | NEDD8 ligase activity(GO:0061663) |
| 0.4 | 1.1 | GO:0098770 | FBXO family protein binding(GO:0098770) |
| 0.4 | 1.9 | GO:0018479 | benzaldehyde dehydrogenase (NAD+) activity(GO:0018479) |
| 0.4 | 8.4 | GO:0005024 | transforming growth factor beta-activated receptor activity(GO:0005024) |
| 0.4 | 19.7 | GO:0001102 | RNA polymerase II activating transcription factor binding(GO:0001102) |
| 0.3 | 3.7 | GO:0004645 | phosphorylase activity(GO:0004645) |
| 0.3 | 2.3 | GO:0048101 | calcium- and calmodulin-regulated 3',5'-cyclic-GMP phosphodiesterase activity(GO:0048101) |
| 0.3 | 3.3 | GO:0008607 | phosphorylase kinase regulator activity(GO:0008607) |
| 0.3 | 1.6 | GO:0015111 | iodide transmembrane transporter activity(GO:0015111) |
| 0.3 | 1.6 | GO:0070740 | tubulin-glutamic acid ligase activity(GO:0070740) |
| 0.3 | 0.9 | GO:0003845 | 11-beta-hydroxysteroid dehydrogenase [NAD(P)] activity(GO:0003845) |
| 0.3 | 16.1 | GO:0017080 | sodium channel regulator activity(GO:0017080) |
| 0.3 | 6.1 | GO:0031005 | filamin binding(GO:0031005) |
| 0.3 | 0.9 | GO:0004962 | endothelin receptor activity(GO:0004962) |
| 0.3 | 4.6 | GO:0045499 | chemorepellent activity(GO:0045499) |
| 0.3 | 7.0 | GO:0008191 | metalloendopeptidase inhibitor activity(GO:0008191) |
| 0.3 | 5.8 | GO:0043560 | insulin receptor substrate binding(GO:0043560) |
| 0.3 | 1.6 | GO:0008440 | inositol-1,4,5-trisphosphate 3-kinase activity(GO:0008440) |
| 0.3 | 3.7 | GO:0008140 | cAMP response element binding protein binding(GO:0008140) |
| 0.3 | 1.9 | GO:0031726 | CCR1 chemokine receptor binding(GO:0031726) |
| 0.3 | 1.6 | GO:0004839 | ubiquitin activating enzyme activity(GO:0004839) |
| 0.3 | 4.6 | GO:0019992 | diacylglycerol binding(GO:0019992) |
| 0.2 | 1.7 | GO:0004996 | thyroid-stimulating hormone receptor activity(GO:0004996) |
| 0.2 | 1.2 | GO:0016934 | extracellular-glycine-gated ion channel activity(GO:0016933) extracellular-glycine-gated chloride channel activity(GO:0016934) |
| 0.2 | 4.9 | GO:0043495 | protein anchor(GO:0043495) |
| 0.2 | 6.7 | GO:0016922 | ligand-dependent nuclear receptor binding(GO:0016922) |
| 0.2 | 3.8 | GO:0017154 | semaphorin receptor activity(GO:0017154) |
| 0.2 | 0.7 | GO:0042015 | interleukin-20 binding(GO:0042015) |
| 0.2 | 5.3 | GO:0016769 | transferase activity, transferring nitrogenous groups(GO:0016769) |
| 0.2 | 5.3 | GO:0051959 | dynein light intermediate chain binding(GO:0051959) |
| 0.2 | 0.6 | GO:0030343 | vitamin D3 25-hydroxylase activity(GO:0030343) vitamin D 25-hydroxylase activity(GO:0070643) |
| 0.2 | 1.8 | GO:0032036 | myosin heavy chain binding(GO:0032036) |
| 0.2 | 3.9 | GO:0008331 | high voltage-gated calcium channel activity(GO:0008331) |
| 0.2 | 1.0 | GO:0004368 | glycerol-3-phosphate dehydrogenase activity(GO:0004368) oxidoreductase activity, acting on the CH-OH group of donors, quinone or similar compound as acceptor(GO:0016901) |
| 0.2 | 0.8 | GO:0016230 | sphingomyelin phosphodiesterase activator activity(GO:0016230) |
| 0.2 | 2.7 | GO:0031957 | very long-chain fatty acid-CoA ligase activity(GO:0031957) |
| 0.2 | 5.3 | GO:0005212 | structural constituent of eye lens(GO:0005212) |
| 0.2 | 2.8 | GO:0015250 | water channel activity(GO:0015250) |
| 0.2 | 3.1 | GO:0031994 | insulin-like growth factor I binding(GO:0031994) |
| 0.2 | 2.8 | GO:0043522 | leucine zipper domain binding(GO:0043522) |
| 0.2 | 1.0 | GO:0031826 | type 2A serotonin receptor binding(GO:0031826) |
| 0.2 | 0.7 | GO:0001588 | dopamine neurotransmitter receptor activity, coupled via Gs(GO:0001588) |
| 0.2 | 3.7 | GO:0042813 | Wnt-activated receptor activity(GO:0042813) |
| 0.2 | 6.4 | GO:0043539 | protein serine/threonine kinase activator activity(GO:0043539) |
| 0.2 | 1.0 | GO:0004118 | cGMP-stimulated cyclic-nucleotide phosphodiesterase activity(GO:0004118) |
| 0.2 | 2.6 | GO:0004559 | alpha-mannosidase activity(GO:0004559) |
| 0.1 | 0.6 | GO:0097603 | temperature-gated ion channel activity(GO:0097603) |
| 0.1 | 8.1 | GO:0070063 | RNA polymerase binding(GO:0070063) |
| 0.1 | 1.4 | GO:0005007 | fibroblast growth factor-activated receptor activity(GO:0005007) |
| 0.1 | 2.3 | GO:0031698 | beta-2 adrenergic receptor binding(GO:0031698) |
| 0.1 | 1.3 | GO:0005384 | manganese ion transmembrane transporter activity(GO:0005384) |
| 0.1 | 0.4 | GO:0016286 | small conductance calcium-activated potassium channel activity(GO:0016286) |
| 0.1 | 0.9 | GO:0017077 | oxidative phosphorylation uncoupler activity(GO:0017077) |
| 0.1 | 3.0 | GO:0022848 | acetylcholine-gated cation channel activity(GO:0022848) |
| 0.1 | 2.0 | GO:0004691 | cAMP-dependent protein kinase activity(GO:0004691) |
| 0.1 | 1.5 | GO:0004596 | peptide alpha-N-acetyltransferase activity(GO:0004596) |
| 0.1 | 1.8 | GO:0004143 | diacylglycerol kinase activity(GO:0004143) |
| 0.1 | 2.5 | GO:0030374 | ligand-dependent nuclear receptor transcription coactivator activity(GO:0030374) |
| 0.1 | 1.0 | GO:0000978 | RNA polymerase II core promoter proximal region sequence-specific DNA binding(GO:0000978) core promoter proximal region sequence-specific DNA binding(GO:0000987) core promoter proximal region DNA binding(GO:0001159) |
| 0.1 | 9.2 | GO:0004843 | thiol-dependent ubiquitin-specific protease activity(GO:0004843) |
| 0.1 | 2.3 | GO:0017127 | cholesterol transporter activity(GO:0017127) |
| 0.1 | 0.3 | GO:0010698 | acetyltransferase activator activity(GO:0010698) |
| 0.1 | 1.4 | GO:0030955 | potassium ion binding(GO:0030955) |
| 0.1 | 2.0 | GO:0070064 | proline-rich region binding(GO:0070064) |
| 0.1 | 1.9 | GO:0015269 | calcium-activated potassium channel activity(GO:0015269) |
| 0.1 | 2.7 | GO:0032266 | phosphatidylinositol-3-phosphate binding(GO:0032266) |
| 0.1 | 1.2 | GO:0048407 | platelet-derived growth factor binding(GO:0048407) |
| 0.1 | 1.0 | GO:0051371 | muscle alpha-actinin binding(GO:0051371) |
| 0.1 | 0.3 | GO:0047275 | glucosaminylgalactosylglucosylceramide beta-galactosyltransferase activity(GO:0047275) |
| 0.1 | 8.0 | GO:0005201 | extracellular matrix structural constituent(GO:0005201) |
| 0.1 | 4.1 | GO:0001205 | transcriptional activator activity, RNA polymerase II distal enhancer sequence-specific binding(GO:0001205) |
| 0.1 | 1.6 | GO:0015467 | G-protein activated inward rectifier potassium channel activity(GO:0015467) |
| 0.1 | 1.4 | GO:0017166 | vinculin binding(GO:0017166) |
| 0.1 | 1.3 | GO:0051393 | alpha-actinin binding(GO:0051393) |
| 0.1 | 0.6 | GO:0015277 | kainate selective glutamate receptor activity(GO:0015277) |
| 0.1 | 1.0 | GO:1904264 | ubiquitin protein ligase activity involved in ERAD pathway(GO:1904264) |
| 0.1 | 0.7 | GO:0031748 | D1 dopamine receptor binding(GO:0031748) |
| 0.1 | 1.4 | GO:0035259 | glucocorticoid receptor binding(GO:0035259) |
| 0.1 | 4.0 | GO:0005160 | transforming growth factor beta receptor binding(GO:0005160) |
| 0.1 | 0.4 | GO:0004991 | parathyroid hormone receptor activity(GO:0004991) |
| 0.1 | 0.7 | GO:0016721 | superoxide dismutase activity(GO:0004784) oxidoreductase activity, acting on superoxide radicals as acceptor(GO:0016721) |
| 0.1 | 1.7 | GO:0031683 | G-protein beta/gamma-subunit complex binding(GO:0031683) |
| 0.1 | 1.0 | GO:0017075 | syntaxin-1 binding(GO:0017075) |
| 0.1 | 0.8 | GO:0032027 | myosin light chain binding(GO:0032027) |
| 0.1 | 1.5 | GO:0042609 | CD4 receptor binding(GO:0042609) |
| 0.1 | 0.5 | GO:0008454 | alpha-1,3-mannosylglycoprotein 4-beta-N-acetylglucosaminyltransferase activity(GO:0008454) |
| 0.1 | 1.3 | GO:0005245 | voltage-gated calcium channel activity(GO:0005245) |
| 0.1 | 1.6 | GO:0071889 | 14-3-3 protein binding(GO:0071889) |
| 0.1 | 0.9 | GO:0015095 | magnesium ion transmembrane transporter activity(GO:0015095) |
| 0.1 | 6.7 | GO:0004867 | serine-type endopeptidase inhibitor activity(GO:0004867) |
| 0.1 | 0.4 | GO:0070016 | armadillo repeat domain binding(GO:0070016) |
| 0.1 | 4.6 | GO:0004004 | ATP-dependent RNA helicase activity(GO:0004004) |
| 0.1 | 2.0 | GO:0031624 | ubiquitin conjugating enzyme binding(GO:0031624) |
| 0.1 | 6.3 | GO:0005070 | SH3/SH2 adaptor activity(GO:0005070) |
| 0.1 | 0.6 | GO:0008503 | benzodiazepine receptor activity(GO:0008503) |
| 0.1 | 1.1 | GO:0008093 | cytoskeletal adaptor activity(GO:0008093) |
| 0.1 | 0.2 | GO:0097493 | structural molecule activity conferring elasticity(GO:0097493) |
| 0.1 | 1.1 | GO:0050321 | tau-protein kinase activity(GO:0050321) |
| 0.1 | 2.7 | GO:0004984 | olfactory receptor activity(GO:0004984) |
| 0.0 | 3.7 | GO:0048306 | calcium-dependent protein binding(GO:0048306) |
| 0.0 | 0.3 | GO:0001165 | RNA polymerase I upstream control element sequence-specific DNA binding(GO:0001165) |
| 0.0 | 1.1 | GO:0004012 | phospholipid-translocating ATPase activity(GO:0004012) |
| 0.0 | 1.3 | GO:0005109 | frizzled binding(GO:0005109) |
| 0.0 | 6.0 | GO:0005200 | structural constituent of cytoskeleton(GO:0005200) |
| 0.0 | 1.1 | GO:0017091 | AU-rich element binding(GO:0017091) |
| 0.0 | 0.6 | GO:0005523 | tropomyosin binding(GO:0005523) |
| 0.0 | 0.7 | GO:0070577 | lysine-acetylated histone binding(GO:0070577) |
| 0.0 | 1.2 | GO:0004708 | MAP kinase kinase activity(GO:0004708) |
| 0.0 | 5.0 | GO:0004222 | metalloendopeptidase activity(GO:0004222) |
| 0.0 | 1.2 | GO:0030371 | translation repressor activity(GO:0030371) |
| 0.0 | 0.2 | GO:0015016 | [heparan sulfate]-glucosamine N-sulfotransferase activity(GO:0015016) |
| 0.0 | 1.2 | GO:0051183 | vitamin transporter activity(GO:0051183) |
| 0.0 | 0.2 | GO:0050816 | phosphothreonine binding(GO:0050816) |
| 0.0 | 5.4 | GO:0017137 | Rab GTPase binding(GO:0017137) |
| 0.0 | 0.4 | GO:0016290 | palmitoyl-CoA hydrolase activity(GO:0016290) |
| 0.0 | 6.6 | GO:0000287 | magnesium ion binding(GO:0000287) |
| 0.0 | 2.2 | GO:0003705 | transcription factor activity, RNA polymerase II distal enhancer sequence-specific binding(GO:0003705) |
| 0.0 | 0.1 | GO:0043208 | glycosphingolipid binding(GO:0043208) |
| 0.0 | 4.1 | GO:0035257 | nuclear hormone receptor binding(GO:0035257) |
| 0.0 | 1.1 | GO:0005246 | calcium channel regulator activity(GO:0005246) |
| 0.0 | 0.9 | GO:0015171 | amino acid transmembrane transporter activity(GO:0015171) |
| 0.0 | 1.3 | GO:0004714 | transmembrane receptor protein tyrosine kinase activity(GO:0004714) |
| 0.0 | 2.0 | GO:0005089 | Rho guanyl-nucleotide exchange factor activity(GO:0005089) |
| 0.0 | 0.3 | GO:0070679 | inositol 1,4,5 trisphosphate binding(GO:0070679) |
| 0.0 | 0.8 | GO:0050840 | extracellular matrix binding(GO:0050840) |
| 0.0 | 0.2 | GO:1990825 | sequence-specific mRNA binding(GO:1990825) |
| 0.0 | 0.5 | GO:0035255 | ionotropic glutamate receptor binding(GO:0035255) |
| 0.0 | 0.5 | GO:0005001 | transmembrane receptor protein tyrosine phosphatase activity(GO:0005001) transmembrane receptor protein phosphatase activity(GO:0019198) |
| 0.0 | 1.2 | GO:0001540 | beta-amyloid binding(GO:0001540) |
| 0.0 | 1.0 | GO:0008146 | sulfotransferase activity(GO:0008146) |
| 0.0 | 0.6 | GO:0051087 | chaperone binding(GO:0051087) |
| 0.0 | 0.2 | GO:0004767 | sphingomyelin phosphodiesterase activity(GO:0004767) |
| 0.0 | 5.8 | GO:0004842 | ubiquitin-protein transferase activity(GO:0004842) |
| 0.0 | 1.0 | GO:0051117 | ATPase binding(GO:0051117) |
| 0.0 | 0.9 | GO:0003684 | damaged DNA binding(GO:0003684) |
| 0.0 | 0.9 | GO:0019902 | phosphatase binding(GO:0019902) |
Gene overrepresentation in C2:CP category:
| Log-likelihood per target | Total log-likelihood | Term | Description |
|---|---|---|---|
| 0.4 | 17.3 | SA B CELL RECEPTOR COMPLEXES | Antigen binding to B cell receptors activates protein tyrosine kinases, such as the Src family, which ultimate activate MAP kinases. |
| 0.3 | 1.6 | PID A6B1 A6B4 INTEGRIN PATHWAY | a6b1 and a6b4 Integrin signaling |
| 0.2 | 17.2 | PID AMB2 NEUTROPHILS PATHWAY | amb2 Integrin signaling |
| 0.2 | 4.6 | PID PI3KCI AKT PATHWAY | Class I PI3K signaling events mediated by Akt |
| 0.2 | 2.6 | SA TRKA RECEPTOR | The TrkA receptor binds nerve growth factor to activate MAP kinase pathways and promote cell growth. |
| 0.2 | 5.6 | PID DNA PK PATHWAY | DNA-PK pathway in nonhomologous end joining |
| 0.2 | 4.9 | PID INTEGRIN5 PATHWAY | Beta5 beta6 beta7 and beta8 integrin cell surface interactions |
| 0.2 | 2.7 | PID THROMBIN PAR4 PATHWAY | PAR4-mediated thrombin signaling events |
| 0.1 | 7.9 | PID FRA PATHWAY | Validated transcriptional targets of AP1 family members Fra1 and Fra2 |
| 0.1 | 4.2 | SA FAS SIGNALING | The TNF-type receptor Fas induces apoptosis on ligand binding. |
| 0.1 | 7.5 | NABA PROTEOGLYCANS | Genes encoding proteoglycans |
| 0.1 | 9.2 | PID RHOA REG PATHWAY | Regulation of RhoA activity |
| 0.1 | 3.3 | PID IL2 PI3K PATHWAY | IL2 signaling events mediated by PI3K |
| 0.1 | 20.5 | PID ERBB1 DOWNSTREAM PATHWAY | ErbB1 downstream signaling |
| 0.1 | 1.1 | PID CD8 TCR PATHWAY | TCR signaling in naïve CD8+ T cells |
| 0.1 | 2.2 | PID FAK PATHWAY | Signaling events mediated by focal adhesion kinase |
| 0.1 | 3.5 | PID WNT SIGNALING PATHWAY | Wnt signaling network |
| 0.1 | 1.6 | ST GAQ PATHWAY | G alpha q Pathway |
| 0.1 | 4.6 | PID HIF2PATHWAY | HIF-2-alpha transcription factor network |
| 0.1 | 15.1 | NABA ECM AFFILIATED | Genes encoding proteins affiliated structurally or functionally to extracellular matrix proteins |
| 0.1 | 2.0 | PID ERB GENOMIC PATHWAY | Validated nuclear estrogen receptor beta network |
| 0.1 | 1.2 | PID RANBP2 PATHWAY | Sumoylation by RanBP2 regulates transcriptional repression |
| 0.1 | 6.0 | ST T CELL SIGNAL TRANSDUCTION | T Cell Signal Transduction |
| 0.1 | 1.8 | PID NFAT TFPATHWAY | Calcineurin-regulated NFAT-dependent transcription in lymphocytes |
| 0.1 | 15.9 | NABA ECM GLYCOPROTEINS | Genes encoding structural ECM glycoproteins |
| 0.1 | 1.0 | ST PHOSPHOINOSITIDE 3 KINASE PATHWAY | PI3K Pathway |
| 0.1 | 2.2 | PID AURORA A PATHWAY | Aurora A signaling |
| 0.1 | 1.1 | PID IL2 STAT5 PATHWAY | IL2 signaling events mediated by STAT5 |
| 0.1 | 3.9 | PID AURORA B PATHWAY | Aurora B signaling |
| 0.1 | 3.7 | PID AP1 PATHWAY | AP-1 transcription factor network |
| 0.0 | 1.2 | ST DIFFERENTIATION PATHWAY IN PC12 CELLS | Differentiation Pathway in PC12 Cells; this is a specific case of PAC1 Receptor Pathway. |
| 0.0 | 0.8 | ST JNK MAPK PATHWAY | JNK MAPK Pathway |
| 0.0 | 1.8 | PID ARF6 PATHWAY | Arf6 signaling events |
| 0.0 | 2.2 | PID HNF3A PATHWAY | FOXA1 transcription factor network |
| 0.0 | 1.2 | PID KIT PATHWAY | Signaling events mediated by Stem cell factor receptor (c-Kit) |
| 0.0 | 0.6 | PID PI3K PLC TRK PATHWAY | Trk receptor signaling mediated by PI3K and PLC-gamma |
| 0.0 | 0.7 | PID S1P S1P1 PATHWAY | S1P1 pathway |
| 0.0 | 1.6 | PID ARF6 TRAFFICKING PATHWAY | Arf6 trafficking events |
| 0.0 | 1.0 | PID IFNG PATHWAY | IFN-gamma pathway |
| 0.0 | 1.4 | PID FGF PATHWAY | FGF signaling pathway |
| 0.0 | 2.7 | PID AR PATHWAY | Coregulation of Androgen receptor activity |
| 0.0 | 0.7 | PID TNF PATHWAY | TNF receptor signaling pathway |
| 0.0 | 1.6 | PID P73PATHWAY | p73 transcription factor network |
| 0.0 | 1.3 | PID CERAMIDE PATHWAY | Ceramide signaling pathway |
| 0.0 | 1.9 | PID IL12 2PATHWAY | IL12-mediated signaling events |
| 0.0 | 1.1 | PID LKB1 PATHWAY | LKB1 signaling events |
| 0.0 | 5.1 | NABA ECM REGULATORS | Genes encoding enzymes and their regulators involved in the remodeling of the extracellular matrix |
| 0.0 | 1.2 | PID BMP PATHWAY | BMP receptor signaling |
| 0.0 | 0.5 | PID GLYPICAN 1PATHWAY | Glypican 1 network |
| 0.0 | 0.7 | PID FOXO PATHWAY | FoxO family signaling |
| 0.0 | 0.8 | PID PLK1 PATHWAY | PLK1 signaling events |
| 0.0 | 0.4 | PID RHODOPSIN PATHWAY | Visual signal transduction: Rods |
| 0.0 | 0.8 | PID DELTA NP63 PATHWAY | Validated transcriptional targets of deltaNp63 isoforms |
| 0.0 | 0.5 | PID HNF3B PATHWAY | FOXA2 and FOXA3 transcription factor networks |
Gene overrepresentation in C2:CP:REACTOME category:
| Log-likelihood per target | Total log-likelihood | Term | Description |
|---|---|---|---|
| 2.1 | 143.7 | REACTOME STRIATED MUSCLE CONTRACTION | Genes involved in Striated Muscle Contraction |
| 0.7 | 14.1 | REACTOME ACTIVATION OF THE AP1 FAMILY OF TRANSCRIPTION FACTORS | Genes involved in Activation of the AP-1 family of transcription factors |
| 0.4 | 10.5 | REACTOME HS GAG DEGRADATION | Genes involved in HS-GAG degradation |
| 0.4 | 1.1 | REACTOME ELEVATION OF CYTOSOLIC CA2 LEVELS | Genes involved in Elevation of cytosolic Ca2+ levels |
| 0.3 | 6.8 | REACTOME INTRINSIC PATHWAY | Genes involved in Intrinsic Pathway |
| 0.3 | 6.2 | REACTOME TGF BETA RECEPTOR SIGNALING IN EMT EPITHELIAL TO MESENCHYMAL TRANSITION | Genes involved in TGF-beta receptor signaling in EMT (epithelial to mesenchymal transition) |
| 0.3 | 2.6 | REACTOME NEGATIVE REGULATION OF THE PI3K AKT NETWORK | Genes involved in Negative regulation of the PI3K/AKT network |
| 0.3 | 9.4 | REACTOME INTERACTION BETWEEN L1 AND ANKYRINS | Genes involved in Interaction between L1 and Ankyrins |
| 0.3 | 18.1 | REACTOME GLUCONEOGENESIS | Genes involved in Gluconeogenesis |
| 0.3 | 10.2 | REACTOME TIGHT JUNCTION INTERACTIONS | Genes involved in Tight junction interactions |
| 0.3 | 3.7 | REACTOME PYRIMIDINE CATABOLISM | Genes involved in Pyrimidine catabolism |
| 0.2 | 2.7 | REACTOME REGULATION OF INSULIN SECRETION BY ACETYLCHOLINE | Genes involved in Regulation of Insulin Secretion by Acetylcholine |
| 0.2 | 5.6 | REACTOME REGULATION OF INSULIN LIKE GROWTH FACTOR IGF ACTIVITY BY INSULIN LIKE GROWTH FACTOR BINDING PROTEINS IGFBPS | Genes involved in Regulation of Insulin-like Growth Factor (IGF) Activity by Insulin-like Growth Factor Binding Proteins (IGFBPs) |
| 0.2 | 2.9 | REACTOME GLYCOPROTEIN HORMONES | Genes involved in Glycoprotein hormones |
| 0.2 | 2.8 | REACTOME PASSIVE TRANSPORT BY AQUAPORINS | Genes involved in Passive Transport by Aquaporins |
| 0.2 | 3.0 | REACTOME PRESYNAPTIC NICOTINIC ACETYLCHOLINE RECEPTORS | Genes involved in Presynaptic nicotinic acetylcholine receptors |
| 0.2 | 3.7 | REACTOME PRE NOTCH PROCESSING IN GOLGI | Genes involved in Pre-NOTCH Processing in Golgi |
| 0.2 | 5.1 | REACTOME ABORTIVE ELONGATION OF HIV1 TRANSCRIPT IN THE ABSENCE OF TAT | Genes involved in Abortive elongation of HIV-1 transcript in the absence of Tat |
| 0.1 | 6.4 | REACTOME EFFECTS OF PIP2 HYDROLYSIS | Genes involved in Effects of PIP2 hydrolysis |
| 0.1 | 2.5 | REACTOME THE NLRP3 INFLAMMASOME | Genes involved in The NLRP3 inflammasome |
| 0.1 | 4.1 | REACTOME PEROXISOMAL LIPID METABOLISM | Genes involved in Peroxisomal lipid metabolism |
| 0.1 | 1.3 | REACTOME TRANSCRIPTIONAL REGULATION OF WHITE ADIPOCYTE DIFFERENTIATION | Genes involved in Transcriptional Regulation of White Adipocyte Differentiation |
| 0.1 | 3.7 | REACTOME SYNTHESIS OF PA | Genes involved in Synthesis of PA |
| 0.1 | 3.3 | REACTOME GLYCOGEN BREAKDOWN GLYCOGENOLYSIS | Genes involved in Glycogen breakdown (glycogenolysis) |
| 0.1 | 4.5 | REACTOME CGMP EFFECTS | Genes involved in cGMP effects |
| 0.1 | 3.5 | REACTOME DEGRADATION OF THE EXTRACELLULAR MATRIX | Genes involved in Degradation of the extracellular matrix |
| 0.1 | 2.5 | REACTOME OTHER SEMAPHORIN INTERACTIONS | Genes involved in Other semaphorin interactions |
| 0.1 | 1.2 | REACTOME AKT PHOSPHORYLATES TARGETS IN THE CYTOSOL | Genes involved in AKT phosphorylates targets in the cytosol |
| 0.1 | 2.0 | REACTOME NA CL DEPENDENT NEUROTRANSMITTER TRANSPORTERS | Genes involved in Na+/Cl- dependent neurotransmitter transporters |
| 0.1 | 1.0 | REACTOME ROLE OF DCC IN REGULATING APOPTOSIS | Genes involved in Role of DCC in regulating apoptosis |
| 0.1 | 2.3 | REACTOME CASPASE MEDIATED CLEAVAGE OF CYTOSKELETAL PROTEINS | Genes involved in Caspase-mediated cleavage of cytoskeletal proteins |
| 0.1 | 4.1 | REACTOME BMAL1 CLOCK NPAS2 ACTIVATES CIRCADIAN EXPRESSION | Genes involved in BMAL1:CLOCK/NPAS2 Activates Circadian Expression |
| 0.1 | 9.3 | REACTOME INTEGRIN CELL SURFACE INTERACTIONS | Genes involved in Integrin cell surface interactions |
| 0.1 | 2.3 | REACTOME TRAF6 MEDIATED NFKB ACTIVATION | Genes involved in TRAF6 mediated NF-kB activation |
| 0.1 | 1.2 | REACTOME REGULATION OF RHEB GTPASE ACTIVITY BY AMPK | Genes involved in Regulation of Rheb GTPase activity by AMPK |
| 0.1 | 1.1 | REACTOME SYNTHESIS SECRETION AND DEACYLATION OF GHRELIN | Genes involved in Synthesis, Secretion, and Deacylation of Ghrelin |
| 0.1 | 1.1 | REACTOME CLASS C 3 METABOTROPIC GLUTAMATE PHEROMONE RECEPTORS | Genes involved in Class C/3 (Metabotropic glutamate/pheromone receptors) |
| 0.1 | 0.6 | REACTOME COPI MEDIATED TRANSPORT | Genes involved in COPI Mediated Transport |
| 0.1 | 1.6 | REACTOME NEGATIVE REGULATORS OF RIG I MDA5 SIGNALING | Genes involved in Negative regulators of RIG-I/MDA5 signaling |
| 0.1 | 1.6 | REACTOME TRIGLYCERIDE BIOSYNTHESIS | Genes involved in Triglyceride Biosynthesis |
| 0.0 | 0.3 | REACTOME RNA POL I PROMOTER OPENING | Genes involved in RNA Polymerase I Promoter Opening |
| 0.0 | 1.1 | REACTOME SIGNALING BY NODAL | Genes involved in Signaling by NODAL |
| 0.0 | 1.8 | REACTOME LIGAND GATED ION CHANNEL TRANSPORT | Genes involved in Ligand-gated ion channel transport |
| 0.0 | 1.2 | REACTOME SIGNALING BY BMP | Genes involved in Signaling by BMP |
| 0.0 | 1.2 | REACTOME SIGNALING BY HIPPO | Genes involved in Signaling by Hippo |
| 0.0 | 0.4 | REACTOME SYNTHESIS SECRETION AND INACTIVATION OF GIP | Genes involved in Synthesis, Secretion, and Inactivation of Glucose-dependent Insulinotropic Polypeptide (GIP) |
| 0.0 | 1.4 | REACTOME GLUTATHIONE CONJUGATION | Genes involved in Glutathione conjugation |
| 0.0 | 2.0 | REACTOME NRAGE SIGNALS DEATH THROUGH JNK | Genes involved in NRAGE signals death through JNK |
| 0.0 | 0.9 | REACTOME PURINE SALVAGE | Genes involved in Purine salvage |
| 0.0 | 0.8 | REACTOME REGULATION OF GENE EXPRESSION IN BETA CELLS | Genes involved in Regulation of gene expression in beta cells |
| 0.0 | 2.3 | REACTOME G ALPHA S SIGNALLING EVENTS | Genes involved in G alpha (s) signalling events |
| 0.0 | 0.4 | REACTOME SYNTHESIS OF PIPS AT THE LATE ENDOSOME MEMBRANE | Genes involved in Synthesis of PIPs at the late endosome membrane |
| 0.0 | 1.9 | REACTOME NCAM1 INTERACTIONS | Genes involved in NCAM1 interactions |
| 0.0 | 1.4 | REACTOME REGULATION OF HYPOXIA INDUCIBLE FACTOR HIF BY OXYGEN | Genes involved in Regulation of Hypoxia-inducible Factor (HIF) by Oxygen |
| 0.0 | 0.6 | REACTOME IONOTROPIC ACTIVITY OF KAINATE RECEPTORS | Genes involved in Ionotropic activity of Kainate Receptors |
| 0.0 | 1.2 | REACTOME METABOLISM OF STEROID HORMONES AND VITAMINS A AND D | Genes involved in Metabolism of steroid hormones and vitamins A and D |
| 0.0 | 1.4 | REACTOME OLFACTORY SIGNALING PATHWAY | Genes involved in Olfactory Signaling Pathway |
| 0.0 | 5.8 | REACTOME PEPTIDE LIGAND BINDING RECEPTORS | Genes involved in Peptide ligand-binding receptors |
| 0.0 | 0.9 | REACTOME INHIBITION OF VOLTAGE GATED CA2 CHANNELS VIA GBETA GAMMA SUBUNITS | Genes involved in Inhibition of voltage gated Ca2+ channels via Gbeta/gamma subunits |
| 0.0 | 2.7 | REACTOME CLASS B 2 SECRETIN FAMILY RECEPTORS | Genes involved in Class B/2 (Secretin family receptors) |
| 0.0 | 2.4 | REACTOME LOSS OF NLP FROM MITOTIC CENTROSOMES | Genes involved in Loss of Nlp from mitotic centrosomes |
| 0.0 | 1.0 | REACTOME CHONDROITIN SULFATE DERMATAN SULFATE METABOLISM | Genes involved in Chondroitin sulfate/dermatan sulfate metabolism |
| 0.0 | 1.6 | REACTOME GLYCEROPHOSPHOLIPID BIOSYNTHESIS | Genes involved in Glycerophospholipid biosynthesis |
| 0.0 | 0.5 | REACTOME N GLYCAN ANTENNAE ELONGATION | Genes involved in N-Glycan antennae elongation |
| 0.0 | 1.0 | REACTOME ION CHANNEL TRANSPORT | Genes involved in Ion channel transport |
| 0.0 | 0.3 | REACTOME DOWNSTREAM SIGNAL TRANSDUCTION | Genes involved in Downstream signal transduction |
| 0.0 | 0.6 | REACTOME G ALPHA1213 SIGNALLING EVENTS | Genes involved in G alpha (12/13) signalling events |
| 0.0 | 1.4 | REACTOME SIGNALING BY RHO GTPASES | Genes involved in Signaling by Rho GTPases |
| 0.0 | 0.2 | REACTOME HEPARAN SULFATE HEPARIN HS GAG METABOLISM | Genes involved in Heparan sulfate/heparin (HS-GAG) metabolism |