Project
GNF SymAtlas + NCI-60 cancer cell lines, comparison of cancers vs non-cancers, human (Su, 2004; Ross, 2000)
Navigation
Downloads
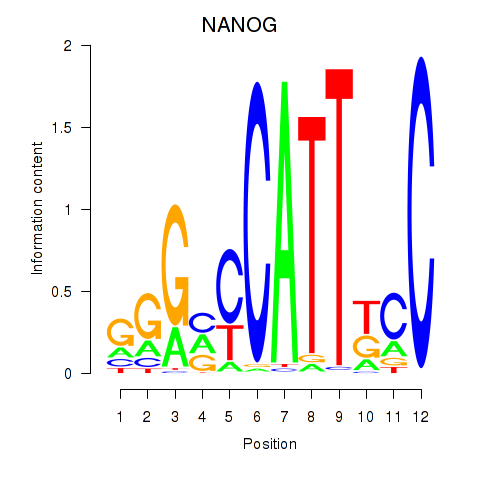
Results for NANOG
Z-value: 0.07
Motif logo
Transcription factors associated with NANOG
| Gene Symbol | Gene ID | Gene Info |
|---|---|---|
|
NANOG
|
ENSG00000111704.6 | Nanog homeobox |
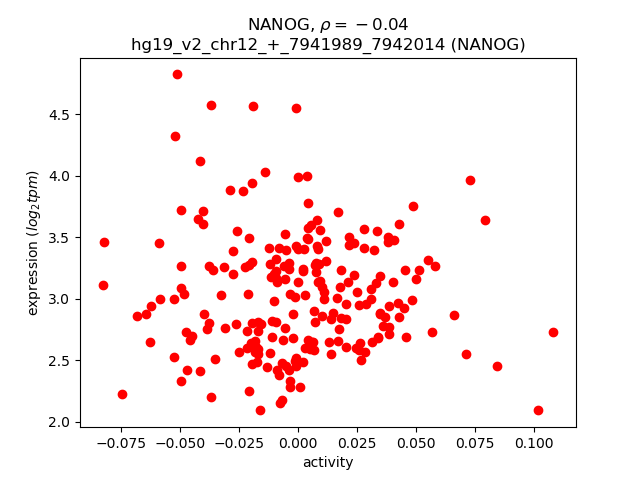
Activity-expression correlation:
| Gene | Promoter | Pearson corr. coef. | P-value | Plot |
|---|---|---|---|---|
| NANOG | hg19_v2_chr12_+_7941989_7942014 | -0.04 | 5.9e-01 | Click! |
Activity profile of NANOG motif
Sorted Z-values of NANOG motif
| Promoter | Log-likelihood | Transcript | Gene | Gene Info |
|---|---|---|---|---|
| chr5_+_156693091 | 5.47 |
ENST00000318218.6
ENST00000442283.2 ENST00000522463.1 ENST00000521420.1 |
CYFIP2
|
cytoplasmic FMR1 interacting protein 2 |
| chr9_+_71820057 | 5.22 |
ENST00000539225.1
|
TJP2
|
tight junction protein 2 |
| chr6_+_32407619 | 5.16 |
ENST00000395388.2
ENST00000374982.5 |
HLA-DRA
|
major histocompatibility complex, class II, DR alpha |
| chr9_+_71819927 | 5.15 |
ENST00000535702.1
|
TJP2
|
tight junction protein 2 |
| chr5_+_156693159 | 5.13 |
ENST00000347377.6
|
CYFIP2
|
cytoplasmic FMR1 interacting protein 2 |
| chr3_+_23847394 | 4.86 |
ENST00000306627.3
|
UBE2E1
|
ubiquitin-conjugating enzyme E2E 1 |
| chr4_+_166248775 | 4.66 |
ENST00000261507.6
ENST00000507013.1 ENST00000393766.2 ENST00000504317.1 |
MSMO1
|
methylsterol monooxygenase 1 |
| chr3_+_23847432 | 4.63 |
ENST00000346855.3
|
UBE2E1
|
ubiquitin-conjugating enzyme E2E 1 |
| chr15_-_78526855 | 4.30 |
ENST00000541759.1
ENST00000558130.1 |
ACSBG1
|
acyl-CoA synthetase bubblegum family member 1 |
| chr8_-_27468842 | 4.22 |
ENST00000523500.1
|
CLU
|
clusterin |
| chr10_+_129845823 | 3.47 |
ENST00000306042.5
|
PTPRE
|
protein tyrosine phosphatase, receptor type, E |
| chr19_-_39342962 | 3.40 |
ENST00000600873.1
|
HNRNPL
|
heterogeneous nuclear ribonucleoprotein L |
| chr19_+_42381173 | 3.38 |
ENST00000221972.3
|
CD79A
|
CD79a molecule, immunoglobulin-associated alpha |
| chr11_-_67205538 | 3.09 |
ENST00000326294.3
|
PTPRCAP
|
protein tyrosine phosphatase, receptor type, C-associated protein |
| chr8_-_27468945 | 3.08 |
ENST00000405140.3
|
CLU
|
clusterin |
| chr3_-_98241358 | 3.03 |
ENST00000503004.1
ENST00000506575.1 ENST00000513452.1 ENST00000515620.1 |
CLDND1
|
claudin domain containing 1 |
| chr6_+_292459 | 2.97 |
ENST00000419235.2
ENST00000605035.1 ENST00000605863.1 |
DUSP22
|
dual specificity phosphatase 22 |
| chrX_-_118827333 | 2.88 |
ENST00000360156.7
ENST00000354228.4 ENST00000489216.1 ENST00000354416.3 ENST00000394610.1 ENST00000343984.5 |
SEPT6
|
septin 6 |
| chr8_-_27469196 | 2.77 |
ENST00000546343.1
ENST00000560566.1 |
CLU
|
clusterin |
| chr6_+_292051 | 2.76 |
ENST00000344450.5
|
DUSP22
|
dual specificity phosphatase 22 |
| chr17_-_56606664 | 2.66 |
ENST00000580844.1
|
SEPT4
|
septin 4 |
| chr19_-_42806919 | 2.64 |
ENST00000595530.1
ENST00000538771.1 ENST00000601865.1 |
PAFAH1B3
|
platelet-activating factor acetylhydrolase 1b, catalytic subunit 3 (29kDa) |
| chr15_+_78832747 | 2.55 |
ENST00000560217.1
ENST00000044462.7 ENST00000559082.1 ENST00000559948.1 ENST00000413382.2 ENST00000559146.1 ENST00000558281.1 |
PSMA4
|
proteasome (prosome, macropain) subunit, alpha type, 4 |
| chrX_+_47092314 | 2.50 |
ENST00000218348.3
|
USP11
|
ubiquitin specific peptidase 11 |
| chr19_-_42806444 | 2.48 |
ENST00000594989.1
|
PAFAH1B3
|
platelet-activating factor acetylhydrolase 1b, catalytic subunit 3 (29kDa) |
| chr15_+_78833105 | 2.46 |
ENST00000558341.1
ENST00000559437.1 |
PSMA4
|
proteasome (prosome, macropain) subunit, alpha type, 4 |
| chr19_-_42806723 | 2.44 |
ENST00000262890.3
|
PAFAH1B3
|
platelet-activating factor acetylhydrolase 1b, catalytic subunit 3 (29kDa) |
| chr10_+_64133934 | 2.43 |
ENST00000395254.3
ENST00000395255.3 ENST00000410046.3 |
ZNF365
|
zinc finger protein 365 |
| chr14_+_23791159 | 2.35 |
ENST00000557702.1
|
PABPN1
|
poly(A) binding protein, nuclear 1 |
| chr4_-_16900184 | 2.28 |
ENST00000515064.1
|
LDB2
|
LIM domain binding 2 |
| chr2_-_175113088 | 2.26 |
ENST00000409546.1
ENST00000428402.2 |
OLA1
|
Obg-like ATPase 1 |
| chr5_+_32585605 | 2.21 |
ENST00000265073.4
ENST00000515355.1 ENST00000502897.1 ENST00000510442.1 |
SUB1
|
SUB1 homolog (S. cerevisiae) |
| chr1_+_44870866 | 2.16 |
ENST00000355387.2
ENST00000361799.2 |
RNF220
|
ring finger protein 220 |
| chr15_+_78833071 | 2.12 |
ENST00000559365.1
|
PSMA4
|
proteasome (prosome, macropain) subunit, alpha type, 4 |
| chr2_-_175113301 | 2.11 |
ENST00000344357.5
ENST00000284719.3 |
OLA1
|
Obg-like ATPase 1 |
| chr4_-_16900217 | 2.11 |
ENST00000441778.2
|
LDB2
|
LIM domain binding 2 |
| chr4_-_16900242 | 2.09 |
ENST00000502640.1
ENST00000506732.1 |
LDB2
|
LIM domain binding 2 |
| chr17_-_34417479 | 2.05 |
ENST00000225245.5
|
CCL3
|
chemokine (C-C motif) ligand 3 |
| chr11_-_57004658 | 2.01 |
ENST00000606794.1
|
APLNR
|
apelin receptor |
| chr4_+_79567362 | 1.92 |
ENST00000512322.1
|
RP11-792D21.2
|
long intergenic non-protein coding RNA 1094 |
| chr4_+_79567314 | 1.87 |
ENST00000503539.1
ENST00000504675.1 |
RP11-792D21.2
|
long intergenic non-protein coding RNA 1094 |
| chr4_-_16900410 | 1.85 |
ENST00000304523.5
|
LDB2
|
LIM domain binding 2 |
| chr8_+_42752053 | 1.64 |
ENST00000307602.4
|
HOOK3
|
hook microtubule-tethering protein 3 |
| chr8_-_91095099 | 1.56 |
ENST00000265431.3
|
CALB1
|
calbindin 1, 28kDa |
| chr12_-_123187890 | 1.55 |
ENST00000328880.5
|
HCAR2
|
hydroxycarboxylic acid receptor 2 |
| chr2_+_219081817 | 1.43 |
ENST00000315717.5
ENST00000420104.1 ENST00000295685.10 |
ARPC2
|
actin related protein 2/3 complex, subunit 2, 34kDa |
| chr16_+_6069072 | 1.43 |
ENST00000547605.1
ENST00000550418.1 ENST00000553186.1 |
RBFOX1
|
RNA binding protein, fox-1 homolog (C. elegans) 1 |
| chr12_-_123201337 | 1.41 |
ENST00000528880.2
|
HCAR3
|
hydroxycarboxylic acid receptor 3 |
| chr10_-_1034237 | 1.38 |
ENST00000381466.1
|
AL359878.1
|
Uncharacterized protein |
| chr7_+_102715315 | 1.37 |
ENST00000428183.2
ENST00000323716.3 ENST00000441711.2 ENST00000454559.1 ENST00000425331.1 ENST00000541300.1 |
ARMC10
|
armadillo repeat containing 10 |
| chr7_+_6414128 | 1.36 |
ENST00000348035.4
ENST00000356142.4 |
RAC1
|
ras-related C3 botulinum toxin substrate 1 (rho family, small GTP binding protein Rac1) |
| chr19_-_42806842 | 1.34 |
ENST00000596265.1
|
PAFAH1B3
|
platelet-activating factor acetylhydrolase 1b, catalytic subunit 3 (29kDa) |
| chr4_-_5891918 | 1.27 |
ENST00000512574.1
|
CRMP1
|
collapsin response mediator protein 1 |
| chr12_-_51477333 | 1.25 |
ENST00000228515.1
ENST00000548206.1 ENST00000546935.1 ENST00000548981.1 |
CSRNP2
|
cysteine-serine-rich nuclear protein 2 |
| chr10_-_27443155 | 1.25 |
ENST00000427324.1
ENST00000326799.3 |
YME1L1
|
YME1-like 1 ATPase |
| chr2_+_171673072 | 1.23 |
ENST00000358196.3
ENST00000375272.1 |
GAD1
|
glutamate decarboxylase 1 (brain, 67kDa) |
| chr6_+_31540056 | 1.18 |
ENST00000418386.2
|
LTA
|
lymphotoxin alpha |
| chr1_-_202129105 | 1.17 |
ENST00000367279.4
|
PTPN7
|
protein tyrosine phosphatase, non-receptor type 7 |
| chr4_-_16077741 | 1.15 |
ENST00000447510.2
ENST00000540805.1 ENST00000539194.1 |
PROM1
|
prominin 1 |
| chr20_-_21494654 | 1.10 |
ENST00000377142.4
|
NKX2-2
|
NK2 homeobox 2 |
| chr1_-_202129704 | 1.09 |
ENST00000476061.1
ENST00000544762.1 ENST00000467283.1 ENST00000464870.1 ENST00000435759.2 ENST00000486116.1 ENST00000543735.1 ENST00000308986.5 ENST00000477625.1 |
PTPN7
|
protein tyrosine phosphatase, non-receptor type 7 |
| chr5_-_115872142 | 1.05 |
ENST00000510263.1
|
SEMA6A
|
sema domain, transmembrane domain (TM), and cytoplasmic domain, (semaphorin) 6A |
| chr1_+_161632937 | 1.05 |
ENST00000236937.9
ENST00000367961.4 ENST00000358671.5 |
FCGR2B
|
Fc fragment of IgG, low affinity IIb, receptor (CD32) |
| chr3_-_15469006 | 1.02 |
ENST00000443029.1
ENST00000383790.3 ENST00000383789.5 |
METTL6
|
methyltransferase like 6 |
| chr4_+_154074217 | 1.01 |
ENST00000437508.2
|
TRIM2
|
tripartite motif containing 2 |
| chr22_-_32026810 | 0.98 |
ENST00000266095.5
ENST00000397500.1 |
PISD
|
phosphatidylserine decarboxylase |
| chr6_+_34204642 | 0.94 |
ENST00000347617.6
ENST00000401473.3 ENST00000311487.5 ENST00000447654.1 ENST00000395004.3 |
HMGA1
|
high mobility group AT-hook 1 |
| chr1_-_28520384 | 0.94 |
ENST00000305392.3
|
PTAFR
|
platelet-activating factor receptor |
| chrX_-_107019181 | 0.87 |
ENST00000315660.4
ENST00000372384.2 ENST00000502650.1 ENST00000506724.1 |
TSC22D3
|
TSC22 domain family, member 3 |
| chr19_+_926000 | 0.85 |
ENST00000263620.3
|
ARID3A
|
AT rich interactive domain 3A (BRIGHT-like) |
| chr1_+_159272111 | 0.84 |
ENST00000368114.1
|
FCER1A
|
Fc fragment of IgE, high affinity I, receptor for; alpha polypeptide |
| chr6_+_31633011 | 0.80 |
ENST00000375885.4
|
CSNK2B
|
casein kinase 2, beta polypeptide |
| chr1_-_155959853 | 0.80 |
ENST00000462460.2
ENST00000368316.1 |
ARHGEF2
|
Rho/Rac guanine nucleotide exchange factor (GEF) 2 |
| chr3_+_32147997 | 0.79 |
ENST00000282541.5
|
GPD1L
|
glycerol-3-phosphate dehydrogenase 1-like |
| chr6_+_30525051 | 0.78 |
ENST00000376557.3
|
PRR3
|
proline rich 3 |
| chr14_-_98444386 | 0.76 |
ENST00000556462.1
ENST00000556138.1 |
C14orf64
|
chromosome 14 open reading frame 64 |
| chr22_-_42084863 | 0.76 |
ENST00000401959.1
ENST00000355257.3 |
NHP2L1
|
NHP2 non-histone chromosome protein 2-like 1 (S. cerevisiae) |
| chr15_+_73976715 | 0.75 |
ENST00000558689.1
ENST00000560786.2 ENST00000561213.1 ENST00000563584.1 ENST00000561416.1 |
CD276
|
CD276 molecule |
| chr2_+_170590321 | 0.72 |
ENST00000392647.2
|
KLHL23
|
kelch-like family member 23 |
| chr15_-_78526942 | 0.71 |
ENST00000258873.4
|
ACSBG1
|
acyl-CoA synthetase bubblegum family member 1 |
| chr19_+_50084561 | 0.68 |
ENST00000246794.5
|
PRRG2
|
proline rich Gla (G-carboxyglutamic acid) 2 |
| chr6_+_30524663 | 0.63 |
ENST00000376560.3
|
PRR3
|
proline rich 3 |
| chr3_+_132379154 | 0.62 |
ENST00000468022.1
ENST00000473651.1 ENST00000494238.2 |
UBA5
|
ubiquitin-like modifier activating enzyme 5 |
| chr6_+_151561085 | 0.61 |
ENST00000402676.2
|
AKAP12
|
A kinase (PRKA) anchor protein 12 |
| chr17_+_75372165 | 0.61 |
ENST00000427674.2
|
SEPT9
|
septin 9 |
| chr3_-_52567792 | 0.61 |
ENST00000307092.4
ENST00000422318.2 ENST00000459839.1 |
NT5DC2
|
5'-nucleotidase domain containing 2 |
| chr10_+_69644404 | 0.61 |
ENST00000212015.6
|
SIRT1
|
sirtuin 1 |
| chr6_+_148663729 | 0.58 |
ENST00000367467.3
|
SASH1
|
SAM and SH3 domain containing 1 |
| chr6_+_107077435 | 0.58 |
ENST00000369046.4
|
QRSL1
|
glutaminyl-tRNA synthase (glutamine-hydrolyzing)-like 1 |
| chr1_+_201924619 | 0.55 |
ENST00000367287.4
|
TIMM17A
|
translocase of inner mitochondrial membrane 17 homolog A (yeast) |
| chr12_-_123215306 | 0.54 |
ENST00000356987.2
ENST00000436083.2 |
HCAR1
|
hydroxycarboxylic acid receptor 1 |
| chr11_-_46142948 | 0.52 |
ENST00000257821.4
|
PHF21A
|
PHD finger protein 21A |
| chr12_-_101604185 | 0.51 |
ENST00000536262.2
|
SLC5A8
|
solute carrier family 5 (sodium/monocarboxylate cotransporter), member 8 |
| chr10_+_123922941 | 0.46 |
ENST00000360561.3
|
TACC2
|
transforming, acidic coiled-coil containing protein 2 |
| chr17_+_43224684 | 0.46 |
ENST00000332499.2
|
HEXIM1
|
hexamethylene bis-acetamide inducible 1 |
| chr3_+_44916098 | 0.45 |
ENST00000296125.4
|
TGM4
|
transglutaminase 4 |
| chr14_-_92198403 | 0.44 |
ENST00000553329.1
ENST00000256343.3 |
CATSPERB
|
catsper channel auxiliary subunit beta |
| chr10_+_1034646 | 0.42 |
ENST00000360059.5
ENST00000545048.1 |
GTPBP4
|
GTP binding protein 4 |
| chr16_+_3508063 | 0.40 |
ENST00000576787.1
ENST00000572942.1 ENST00000576916.1 ENST00000575076.1 ENST00000572131.1 |
NAA60
|
N(alpha)-acetyltransferase 60, NatF catalytic subunit |
| chr5_-_169816638 | 0.39 |
ENST00000521859.1
ENST00000274629.4 |
KCNMB1
|
potassium large conductance calcium-activated channel, subfamily M, beta member 1 |
| chr18_+_13218769 | 0.39 |
ENST00000399848.3
ENST00000361205.4 |
LDLRAD4
|
low density lipoprotein receptor class A domain containing 4 |
| chr19_-_50370799 | 0.39 |
ENST00000600910.1
ENST00000322344.3 ENST00000600573.1 |
PNKP
|
polynucleotide kinase 3'-phosphatase |
| chr22_+_26565440 | 0.38 |
ENST00000404234.3
ENST00000529632.2 ENST00000360929.3 ENST00000248933.6 ENST00000343706.4 |
SEZ6L
|
seizure related 6 homolog (mouse)-like |
| chr16_+_30759563 | 0.38 |
ENST00000563588.1
ENST00000565924.1 ENST00000424889.3 |
PHKG2
|
phosphorylase kinase, gamma 2 (testis) |
| chr17_-_61777459 | 0.37 |
ENST00000578993.1
ENST00000583211.1 ENST00000259006.3 |
LIMD2
|
LIM domain containing 2 |
| chr10_+_5566916 | 0.37 |
ENST00000315238.1
|
CALML3
|
calmodulin-like 3 |
| chr16_+_30759700 | 0.37 |
ENST00000328273.7
|
PHKG2
|
phosphorylase kinase, gamma 2 (testis) |
| chr16_-_70719925 | 0.36 |
ENST00000338779.6
|
MTSS1L
|
metastasis suppressor 1-like |
| chr2_-_240322643 | 0.35 |
ENST00000345617.3
|
HDAC4
|
histone deacetylase 4 |
| chrX_+_47082408 | 0.32 |
ENST00000518022.1
ENST00000276052.6 |
CDK16
|
cyclin-dependent kinase 16 |
| chr10_-_70092635 | 0.31 |
ENST00000309049.4
|
PBLD
|
phenazine biosynthesis-like protein domain containing |
| chr8_-_102181718 | 0.31 |
ENST00000565617.1
|
KB-1460A1.5
|
KB-1460A1.5 |
| chr10_+_123923205 | 0.31 |
ENST00000369004.3
ENST00000260733.3 |
TACC2
|
transforming, acidic coiled-coil containing protein 2 |
| chr10_+_123923105 | 0.31 |
ENST00000368999.1
|
TACC2
|
transforming, acidic coiled-coil containing protein 2 |
| chr1_+_203096831 | 0.30 |
ENST00000337894.4
|
ADORA1
|
adenosine A1 receptor |
| chr11_-_72504637 | 0.29 |
ENST00000536377.1
ENST00000359373.5 |
STARD10
ARAP1
|
StAR-related lipid transfer (START) domain containing 10 ArfGAP with RhoGAP domain, ankyrin repeat and PH domain 1 |
| chr11_+_63870660 | 0.23 |
ENST00000246841.3
|
FLRT1
|
fibronectin leucine rich transmembrane protein 1 |
| chr19_-_54327542 | 0.23 |
ENST00000391775.3
ENST00000324134.6 ENST00000535162.1 ENST00000351894.4 ENST00000354278.3 ENST00000391773.1 ENST00000345770.5 ENST00000391772.1 |
NLRP12
|
NLR family, pyrin domain containing 12 |
| chr10_-_49813090 | 0.23 |
ENST00000249601.4
|
ARHGAP22
|
Rho GTPase activating protein 22 |
| chr1_+_203097407 | 0.23 |
ENST00000367235.1
|
ADORA1
|
adenosine A1 receptor |
| chr8_+_9413410 | 0.22 |
ENST00000520408.1
ENST00000310430.6 ENST00000522110.1 |
TNKS
|
tankyrase, TRF1-interacting ankyrin-related ADP-ribose polymerase |
| chr7_-_2883928 | 0.19 |
ENST00000275364.3
|
GNA12
|
guanine nucleotide binding protein (G protein) alpha 12 |
| chr19_+_4969116 | 0.18 |
ENST00000588337.1
ENST00000159111.4 ENST00000381759.4 |
KDM4B
|
lysine (K)-specific demethylase 4B |
| chr16_+_3507985 | 0.17 |
ENST00000421765.3
ENST00000360862.5 ENST00000414063.2 ENST00000610180.1 ENST00000608993.1 |
NAA60
NAA60
|
N(alpha)-acetyltransferase 60, NatF catalytic subunit N-alpha-acetyltransferase 60 |
| chr3_+_15468862 | 0.15 |
ENST00000396842.2
|
EAF1
|
ELL associated factor 1 |
| chr19_-_36870087 | 0.14 |
ENST00000270001.7
|
ZFP14
|
ZFP14 zinc finger protein |
| chr6_+_88032299 | 0.14 |
ENST00000608353.1
ENST00000392863.1 ENST00000229570.5 ENST00000608525.1 ENST00000608868.1 |
SMIM8
|
small integral membrane protein 8 |
| chr20_-_61557821 | 0.13 |
ENST00000354665.4
ENST00000370368.1 ENST00000395343.1 ENST00000395340.1 |
DIDO1
|
death inducer-obliterator 1 |
| chr12_-_57410304 | 0.11 |
ENST00000441881.1
ENST00000458521.2 |
TAC3
|
tachykinin 3 |
| chr19_-_13213662 | 0.11 |
ENST00000264824.4
|
LYL1
|
lymphoblastic leukemia derived sequence 1 |
| chr1_+_145576007 | 0.09 |
ENST00000369298.1
|
PIAS3
|
protein inhibitor of activated STAT, 3 |
| chr19_+_8455077 | 0.09 |
ENST00000328024.6
|
RAB11B
|
RAB11B, member RAS oncogene family |
| chr20_+_43343886 | 0.07 |
ENST00000190983.4
|
WISP2
|
WNT1 inducible signaling pathway protein 2 |
| chr1_+_161551101 | 0.07 |
ENST00000367962.4
ENST00000367960.5 ENST00000403078.3 ENST00000428605.2 |
FCGR2B
|
Fc fragment of IgG, low affinity IIb, receptor (CD32) |
| chr3_+_121774202 | 0.06 |
ENST00000469710.1
ENST00000493101.1 ENST00000330540.2 ENST00000264468.5 |
CD86
|
CD86 molecule |
| chr16_+_640055 | 0.06 |
ENST00000568586.1
ENST00000538492.1 ENST00000248139.3 |
RAB40C
|
RAB40C, member RAS oncogene family |
| chr20_+_43343517 | 0.06 |
ENST00000372865.4
|
WISP2
|
WNT1 inducible signaling pathway protein 2 |
| chr6_-_131277510 | 0.05 |
ENST00000525193.1
ENST00000527659.1 |
EPB41L2
|
erythrocyte membrane protein band 4.1-like 2 |
| chr2_-_69664586 | 0.04 |
ENST00000303698.3
ENST00000394305.1 ENST00000410022.2 |
NFU1
|
NFU1 iron-sulfur cluster scaffold homolog (S. cerevisiae) |
| chr17_+_7387677 | 0.03 |
ENST00000322644.6
|
POLR2A
|
polymerase (RNA) II (DNA directed) polypeptide A, 220kDa |
| chr1_+_145575980 | 0.03 |
ENST00000393045.2
|
PIAS3
|
protein inhibitor of activated STAT, 3 |
| chr21_-_34960930 | 0.01 |
ENST00000437395.1
|
DONSON
|
downstream neighbor of SON |
| chr20_+_43343476 | 0.00 |
ENST00000372868.2
|
WISP2
|
WNT1 inducible signaling pathway protein 2 |
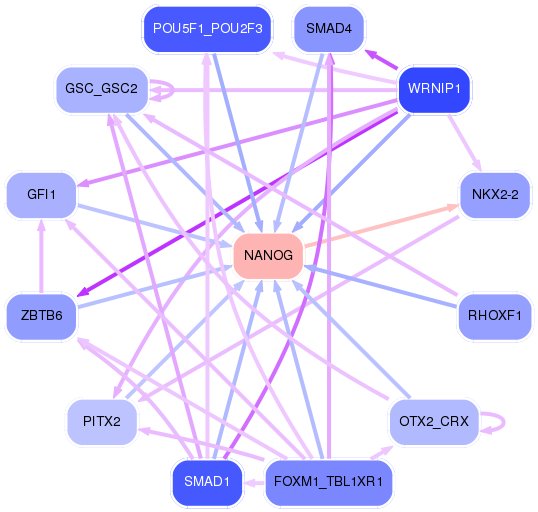
Network of associatons between targets according to the STRING database.

First level regulatory network of NANOG
Gene Ontology Analysis
Gene overrepresentation in biological_process category:
| Log-likelihood per target | Total log-likelihood | Term | Description |
|---|---|---|---|
| 1.7 | 10.1 | GO:0061517 | macrophage proliferation(GO:0061517) microglial cell proliferation(GO:0061518) regulation of neuronal signal transduction(GO:1902847) positive regulation of neurofibrillary tangle assembly(GO:1902998) |
| 1.3 | 10.6 | GO:0051388 | positive regulation of neurotrophin TRK receptor signaling pathway(GO:0051388) |
| 1.3 | 5.2 | GO:0002503 | peptide antigen assembly with MHC class II protein complex(GO:0002503) |
| 1.1 | 9.2 | GO:0032020 | ISG15-protein conjugation(GO:0032020) |
| 1.0 | 10.4 | GO:0071847 | TNFSF11-mediated signaling pathway(GO:0071847) |
| 0.8 | 2.4 | GO:1904247 | positive regulation of polynucleotide adenylyltransferase activity(GO:1904247) |
| 0.5 | 2.7 | GO:0030382 | sperm mitochondrion organization(GO:0030382) |
| 0.5 | 1.4 | GO:0032707 | negative regulation of interleukin-23 production(GO:0032707) |
| 0.4 | 1.3 | GO:1904617 | negative regulation of actin filament binding(GO:1904530) negative regulation of actin binding(GO:1904617) |
| 0.4 | 1.6 | GO:0022027 | interkinetic nuclear migration(GO:0022027) |
| 0.4 | 1.2 | GO:0002874 | regulation of chronic inflammatory response to antigenic stimulus(GO:0002874) |
| 0.4 | 2.0 | GO:0001810 | regulation of type I hypersensitivity(GO:0001810) type I hypersensitivity(GO:0016068) |
| 0.4 | 1.1 | GO:0021529 | spinal cord oligodendrocyte cell differentiation(GO:0021529) spinal cord oligodendrocyte cell fate specification(GO:0021530) oligodendrocyte cell fate specification(GO:0021778) oligodendrocyte cell fate commitment(GO:0021779) glial cell fate specification(GO:0021780) |
| 0.3 | 0.9 | GO:1904316 | positive regulation of neutrophil degranulation(GO:0043315) cellular response to gravity(GO:0071258) positive regulation of neutrophil activation(GO:1902565) regulation of transcytosis(GO:1904298) positive regulation of transcytosis(GO:1904300) regulation of maternal process involved in parturition(GO:1904301) positive regulation of maternal process involved in parturition(GO:1904303) response to 2-O-acetyl-1-O-hexadecyl-sn-glycero-3-phosphocholine(GO:1904316) cellular response to 2-O-acetyl-1-O-hexadecyl-sn-glycero-3-phosphocholine(GO:1904317) |
| 0.3 | 1.6 | GO:0033031 | positive regulation of neutrophil apoptotic process(GO:0033031) |
| 0.3 | 1.2 | GO:0018352 | protein-pyridoxal-5-phosphate linkage(GO:0018352) |
| 0.3 | 2.1 | GO:2000503 | positive regulation of natural killer cell chemotaxis(GO:2000503) |
| 0.3 | 1.2 | GO:2000768 | glomerular parietal epithelial cell differentiation(GO:0072139) positive regulation of nephron tubule epithelial cell differentiation(GO:2000768) |
| 0.3 | 5.3 | GO:0002710 | negative regulation of T cell mediated immunity(GO:0002710) |
| 0.3 | 7.3 | GO:0010669 | epithelial structure maintenance(GO:0010669) |
| 0.2 | 0.9 | GO:0090402 | oncogene-induced cell senescence(GO:0090402) |
| 0.2 | 1.6 | GO:0035502 | metanephric part of ureteric bud development(GO:0035502) |
| 0.2 | 5.0 | GO:0035338 | long-chain fatty-acyl-CoA biosynthetic process(GO:0035338) |
| 0.2 | 1.2 | GO:0035694 | mitochondrial protein catabolic process(GO:0035694) |
| 0.2 | 0.6 | GO:0051097 | negative regulation of helicase activity(GO:0051097) |
| 0.2 | 0.8 | GO:0071802 | negative regulation of podosome assembly(GO:0071802) |
| 0.2 | 0.8 | GO:0006072 | glycerol-3-phosphate metabolic process(GO:0006072) negative regulation of protein kinase C signaling(GO:0090038) |
| 0.2 | 0.5 | GO:0032900 | regulation of nucleoside transport(GO:0032242) negative regulation of neurotrophin production(GO:0032900) |
| 0.2 | 2.0 | GO:0043951 | negative regulation of cAMP-mediated signaling(GO:0043951) |
| 0.1 | 0.6 | GO:1902498 | regulation of protein autoubiquitination(GO:1902498) |
| 0.1 | 0.4 | GO:1903413 | cellular response to bile acid(GO:1903413) |
| 0.1 | 0.7 | GO:0045819 | positive regulation of glycogen catabolic process(GO:0045819) |
| 0.1 | 0.8 | GO:0033211 | adiponectin-activated signaling pathway(GO:0033211) |
| 0.1 | 0.9 | GO:0070236 | regulation of activation-induced cell death of T cells(GO:0070235) negative regulation of activation-induced cell death of T cells(GO:0070236) |
| 0.1 | 0.3 | GO:0033341 | regulation of collagen binding(GO:0033341) |
| 0.1 | 0.6 | GO:0017196 | N-terminal peptidyl-methionine acetylation(GO:0017196) |
| 0.1 | 0.8 | GO:0045078 | positive regulation of interferon-gamma biosynthetic process(GO:0045078) |
| 0.1 | 0.6 | GO:1990564 | protein polyufmylation(GO:1990564) protein K69-linked ufmylation(GO:1990592) |
| 0.1 | 1.1 | GO:2001224 | positive regulation of neuron migration(GO:2001224) |
| 0.1 | 2.2 | GO:0060261 | positive regulation of transcription initiation from RNA polymerase II promoter(GO:0060261) |
| 0.1 | 1.8 | GO:0010592 | positive regulation of lamellipodium assembly(GO:0010592) |
| 0.1 | 4.8 | GO:0000381 | regulation of alternative mRNA splicing, via spliceosome(GO:0000381) |
| 0.1 | 0.2 | GO:0032661 | regulation of interleukin-18 production(GO:0032661) |
| 0.1 | 0.2 | GO:0070213 | protein auto-ADP-ribosylation(GO:0070213) |
| 0.1 | 0.3 | GO:0030037 | actin filament reorganization involved in cell cycle(GO:0030037) |
| 0.1 | 3.5 | GO:0046627 | negative regulation of insulin receptor signaling pathway(GO:0046627) |
| 0.1 | 7.1 | GO:0006521 | regulation of cellular amino acid metabolic process(GO:0006521) |
| 0.1 | 0.3 | GO:0098502 | DNA dephosphorylation(GO:0098502) |
| 0.0 | 4.7 | GO:0006695 | cholesterol biosynthetic process(GO:0006695) |
| 0.0 | 0.6 | GO:0010739 | positive regulation of protein kinase A signaling(GO:0010739) |
| 0.0 | 0.5 | GO:0034356 | NAD biosynthesis via nicotinamide riboside salvage pathway(GO:0034356) |
| 0.0 | 0.5 | GO:0030150 | protein import into mitochondrial matrix(GO:0030150) |
| 0.0 | 2.2 | GO:0051865 | protein autoubiquitination(GO:0051865) |
| 0.0 | 0.4 | GO:0010991 | negative regulation of SMAD protein complex assembly(GO:0010991) |
| 0.0 | 3.4 | GO:0042100 | B cell proliferation(GO:0042100) |
| 0.0 | 0.4 | GO:0090036 | regulation of protein kinase C signaling(GO:0090036) |
| 0.0 | 0.6 | GO:1902857 | positive regulation of nonmotile primary cilium assembly(GO:1902857) |
| 0.0 | 0.4 | GO:0048240 | sperm capacitation(GO:0048240) |
| 0.0 | 0.2 | GO:0070544 | histone H3-K36 demethylation(GO:0070544) |
| 0.0 | 0.5 | GO:1901798 | positive regulation of signal transduction by p53 class mediator(GO:1901798) |
| 0.0 | 0.1 | GO:0032641 | negative regulation of tolerance induction(GO:0002644) lymphotoxin A production(GO:0032641) interleukin-4 biosynthetic process(GO:0042097) lymphotoxin A biosynthetic process(GO:0042109) regulation of interleukin-4 biosynthetic process(GO:0045402) positive regulation of interleukin-4 biosynthetic process(GO:0045404) |
| 0.0 | 10.6 | GO:0048232 | spermatogenesis(GO:0007283) male gamete generation(GO:0048232) |
| 0.0 | 3.0 | GO:0002576 | platelet degranulation(GO:0002576) |
| 0.0 | 1.1 | GO:0010923 | negative regulation of phosphatase activity(GO:0010923) |
| 0.0 | 0.8 | GO:0006977 | DNA damage response, signal transduction by p53 class mediator resulting in cell cycle arrest(GO:0006977) |
| 0.0 | 0.1 | GO:0007217 | tachykinin receptor signaling pathway(GO:0007217) |
| 0.0 | 0.0 | GO:0001172 | transcription, RNA-templated(GO:0001172) |
| 0.0 | 0.1 | GO:0001955 | blood vessel maturation(GO:0001955) |
Gene overrepresentation in cellular_component category:
| Log-likelihood per target | Total log-likelihood | Term | Description |
|---|---|---|---|
| 0.6 | 10.1 | GO:0097418 | neurofibrillary tangle(GO:0097418) |
| 0.6 | 7.1 | GO:0019773 | proteasome core complex, alpha-subunit complex(GO:0019773) |
| 0.5 | 3.4 | GO:0019815 | B cell receptor complex(GO:0019815) |
| 0.5 | 1.4 | GO:0036194 | muscle cell projection(GO:0036194) muscle cell projection membrane(GO:0036195) |
| 0.4 | 1.6 | GO:0070695 | FHF complex(GO:0070695) |
| 0.4 | 5.5 | GO:0097227 | sperm annulus(GO:0097227) |
| 0.2 | 5.2 | GO:0042613 | MHC class II protein complex(GO:0042613) |
| 0.2 | 2.4 | GO:0042405 | nuclear inclusion body(GO:0042405) |
| 0.1 | 0.8 | GO:0009331 | glycerol-3-phosphate dehydrogenase complex(GO:0009331) |
| 0.1 | 0.6 | GO:0033553 | rDNA heterochromatin(GO:0033553) |
| 0.1 | 0.8 | GO:0005956 | protein kinase CK2 complex(GO:0005956) |
| 0.1 | 1.2 | GO:0060077 | inhibitory synapse(GO:0060077) |
| 0.1 | 0.4 | GO:0036128 | CatSper complex(GO:0036128) |
| 0.1 | 0.9 | GO:0035985 | senescence-associated heterochromatin focus(GO:0035985) |
| 0.1 | 0.7 | GO:0005964 | phosphorylase kinase complex(GO:0005964) |
| 0.1 | 1.2 | GO:0042622 | photoreceptor outer segment membrane(GO:0042622) |
| 0.1 | 11.2 | GO:0005923 | bicellular tight junction(GO:0005923) |
| 0.1 | 0.6 | GO:0031105 | septin complex(GO:0031105) |
| 0.1 | 0.3 | GO:0046581 | intercellular canaliculus(GO:0046581) |
| 0.0 | 0.5 | GO:0005744 | mitochondrial inner membrane presequence translocase complex(GO:0005744) |
| 0.0 | 0.8 | GO:0098857 | membrane raft(GO:0045121) membrane microdomain(GO:0098857) |
| 0.0 | 8.3 | GO:0000151 | ubiquitin ligase complex(GO:0000151) |
| 0.0 | 3.0 | GO:0031093 | platelet alpha granule lumen(GO:0031093) |
| 0.0 | 4.6 | GO:0043197 | dendritic spine(GO:0043197) |
| 0.0 | 9.3 | GO:0005667 | transcription factor complex(GO:0005667) |
| 0.0 | 0.2 | GO:0097431 | mitotic spindle pole(GO:0097431) |
| 0.0 | 0.5 | GO:1990391 | DNA repair complex(GO:1990391) |
| 0.0 | 0.2 | GO:0032809 | neuronal cell body membrane(GO:0032809) cell body membrane(GO:0044298) |
| 0.0 | 2.8 | GO:0009898 | cytoplasmic side of plasma membrane(GO:0009898) |
| 0.0 | 8.1 | GO:0048471 | perinuclear region of cytoplasm(GO:0048471) |
| 0.0 | 2.4 | GO:0035770 | ribonucleoprotein granule(GO:0035770) |
Gene overrepresentation in molecular_function category:
| Log-likelihood per target | Total log-likelihood | Term | Description |
|---|---|---|---|
| 1.8 | 8.9 | GO:0047179 | platelet-activating factor acetyltransferase activity(GO:0047179) |
| 1.6 | 9.5 | GO:0042296 | ISG15 transferase activity(GO:0042296) |
| 0.8 | 8.3 | GO:0030274 | LIM domain binding(GO:0030274) |
| 0.5 | 10.1 | GO:0051787 | misfolded protein binding(GO:0051787) |
| 0.4 | 2.1 | GO:0004698 | calcium-dependent protein kinase C activity(GO:0004698) |
| 0.4 | 5.2 | GO:0032395 | MHC class II receptor activity(GO:0032395) |
| 0.4 | 5.0 | GO:0031957 | very long-chain fatty acid-CoA ligase activity(GO:0031957) |
| 0.3 | 1.0 | GO:0004609 | phosphatidylserine decarboxylase activity(GO:0004609) |
| 0.3 | 2.6 | GO:0097157 | pre-mRNA intronic binding(GO:0097157) |
| 0.3 | 1.1 | GO:0019770 | IgG receptor activity(GO:0019770) |
| 0.3 | 10.4 | GO:0004385 | guanylate kinase activity(GO:0004385) |
| 0.3 | 1.6 | GO:0005499 | vitamin D binding(GO:0005499) |
| 0.2 | 7.1 | GO:0004298 | threonine-type endopeptidase activity(GO:0004298) threonine-type peptidase activity(GO:0070003) |
| 0.2 | 1.4 | GO:0051021 | GDP-dissociation inhibitor binding(GO:0051021) Rho GDP-dissociation inhibitor binding(GO:0051022) |
| 0.2 | 0.8 | GO:0019763 | immunoglobulin receptor activity(GO:0019763) |
| 0.2 | 0.6 | GO:0071566 | UFM1 activating enzyme activity(GO:0071566) |
| 0.2 | 0.6 | GO:0004040 | amidase activity(GO:0004040) |
| 0.2 | 0.9 | GO:0004992 | platelet activating factor receptor activity(GO:0004992) |
| 0.2 | 1.2 | GO:0004351 | glutamate decarboxylase activity(GO:0004351) |
| 0.2 | 0.3 | GO:0098518 | polynucleotide phosphatase activity(GO:0098518) |
| 0.2 | 1.2 | GO:0004176 | ATP-dependent peptidase activity(GO:0004176) |
| 0.2 | 0.6 | GO:0043398 | HLH domain binding(GO:0043398) |
| 0.1 | 3.5 | GO:0005001 | transmembrane receptor protein tyrosine phosphatase activity(GO:0005001) transmembrane receptor protein phosphatase activity(GO:0019198) |
| 0.1 | 0.5 | GO:0032795 | heterotrimeric G-protein binding(GO:0032795) |
| 0.1 | 4.5 | GO:0008138 | protein tyrosine/serine/threonine phosphatase activity(GO:0008138) |
| 0.1 | 0.9 | GO:0043426 | MRF binding(GO:0043426) |
| 0.1 | 4.7 | GO:0016709 | oxidoreductase activity, acting on paired donors, with incorporation or reduction of molecular oxygen, NAD(P)H as one donor, and incorporation of one atom of oxygen(GO:0016709) |
| 0.1 | 0.3 | GO:0001025 | RNA polymerase III transcription factor binding(GO:0001025) |
| 0.1 | 0.7 | GO:0004689 | phosphorylase kinase activity(GO:0004689) |
| 0.1 | 0.9 | GO:0042975 | peroxisome proliferator activated receptor binding(GO:0042975) |
| 0.1 | 1.6 | GO:0051959 | dynein light intermediate chain binding(GO:0051959) |
| 0.1 | 1.3 | GO:0031005 | filamin binding(GO:0031005) |
| 0.1 | 0.5 | GO:0097322 | 7SK snRNA binding(GO:0097322) |
| 0.1 | 0.4 | GO:0003810 | protein-glutamine gamma-glutamyltransferase activity(GO:0003810) |
| 0.1 | 0.6 | GO:0008253 | 5'-nucleotidase activity(GO:0008253) |
| 0.1 | 0.5 | GO:0015450 | P-P-bond-hydrolysis-driven protein transmembrane transporter activity(GO:0015450) |
| 0.0 | 2.2 | GO:0001205 | transcriptional activator activity, RNA polymerase II distal enhancer sequence-specific binding(GO:0001205) |
| 0.0 | 0.6 | GO:0004596 | peptide alpha-N-acetyltransferase activity(GO:0004596) |
| 0.0 | 0.6 | GO:0008179 | adenylate cyclase binding(GO:0008179) |
| 0.0 | 0.8 | GO:0030676 | Rac guanyl-nucleotide exchange factor activity(GO:0030676) |
| 0.0 | 0.6 | GO:0031435 | mitogen-activated protein kinase kinase kinase binding(GO:0031435) |
| 0.0 | 2.5 | GO:0004843 | thiol-dependent ubiquitin-specific protease activity(GO:0004843) |
| 0.0 | 1.8 | GO:0070063 | RNA polymerase binding(GO:0070063) |
| 0.0 | 1.6 | GO:0004725 | protein tyrosine phosphatase activity(GO:0004725) |
| 0.0 | 1.2 | GO:0005164 | tumor necrosis factor receptor binding(GO:0005164) |
| 0.0 | 0.2 | GO:0051864 | histone demethylase activity (H3-K36 specific)(GO:0051864) |
| 0.0 | 1.2 | GO:0042805 | actinin binding(GO:0042805) |
| 0.0 | 0.4 | GO:0015269 | calcium-activated potassium channel activity(GO:0015269) |
| 0.0 | 0.3 | GO:0031702 | type 1 angiotensin receptor binding(GO:0031702) |
| 0.0 | 0.8 | GO:0017080 | sodium channel regulator activity(GO:0017080) |
| 0.0 | 6.8 | GO:0005525 | GTP binding(GO:0005525) |
| 0.0 | 0.2 | GO:0008656 | cysteine-type endopeptidase activator activity involved in apoptotic process(GO:0008656) |
| 0.0 | 0.0 | GO:0003968 | RNA-directed RNA polymerase activity(GO:0003968) |
| 0.0 | 0.5 | GO:0004407 | histone deacetylase activity(GO:0004407) |
| 0.0 | 1.5 | GO:0005200 | structural constituent of cytoskeleton(GO:0005200) |
Gene overrepresentation in C2:CP category:
| Log-likelihood per target | Total log-likelihood | Term | Description |
|---|---|---|---|
| 0.2 | 10.3 | PID LIS1 PATHWAY | Lissencephaly gene (LIS1) in neuronal migration and development |
| 0.2 | 10.7 | PID ECADHERIN NASCENT AJ PATHWAY | E-cadherin signaling in the nascent adherens junction |
| 0.1 | 19.2 | PID MYC REPRESS PATHWAY | Validated targets of C-MYC transcriptional repression |
| 0.1 | 5.2 | PID IL12 STAT4 PATHWAY | IL12 signaling mediated by STAT4 |
| 0.1 | 2.3 | PID TCR RAS PATHWAY | Ras signaling in the CD4+ TCR pathway |
| 0.1 | 4.5 | PID BCR 5PATHWAY | BCR signaling pathway |
| 0.0 | 2.1 | PID IL12 2PATHWAY | IL12-mediated signaling events |
| 0.0 | 1.2 | PID IL2 STAT5 PATHWAY | IL2 signaling events mediated by STAT5 |
| 0.0 | 0.8 | PID REELIN PATHWAY | Reelin signaling pathway |
| 0.0 | 1.0 | PID HDAC CLASSIII PATHWAY | Signaling events mediated by HDAC Class III |
| 0.0 | 1.2 | PID IL6 7 PATHWAY | IL6-mediated signaling events |
| 0.0 | 1.4 | PID RAC1 PATHWAY | RAC1 signaling pathway |
| 0.0 | 0.3 | PID DNA PK PATHWAY | DNA-PK pathway in nonhomologous end joining |
| 0.0 | 0.9 | PID IL4 2PATHWAY | IL4-mediated signaling events |
| 0.0 | 0.8 | PID FCER1 PATHWAY | Fc-epsilon receptor I signaling in mast cells |
| 0.0 | 0.2 | PID S1P S1P4 PATHWAY | S1P4 pathway |
| 0.0 | 1.0 | PID HNF3A PATHWAY | FOXA1 transcription factor network |
Gene overrepresentation in C2:CP:REACTOME category:
| Log-likelihood per target | Total log-likelihood | Term | Description |
|---|---|---|---|
| 0.5 | 10.4 | REACTOME APOPTOTIC CLEAVAGE OF CELL ADHESION PROTEINS | Genes involved in Apoptotic cleavage of cell adhesion proteins |
| 0.3 | 9.5 | REACTOME CONVERSION FROM APC C CDC20 TO APC C CDH1 IN LATE ANAPHASE | Genes involved in Conversion from APC/C:Cdc20 to APC/C:Cdh1 in late anaphase |
| 0.2 | 4.7 | REACTOME CHOLESTEROL BIOSYNTHESIS | Genes involved in Cholesterol biosynthesis |
| 0.1 | 2.4 | REACTOME PROCESSING OF INTRONLESS PRE MRNAS | Genes involved in Processing of Intronless Pre-mRNAs |
| 0.1 | 0.9 | REACTOME APOBEC3G MEDIATED RESISTANCE TO HIV1 INFECTION | Genes involved in APOBEC3G mediated resistance to HIV-1 infection |
| 0.1 | 7.1 | REACTOME AUTODEGRADATION OF CDH1 BY CDH1 APC C | Genes involved in Autodegradation of Cdh1 by Cdh1:APC/C |
| 0.1 | 2.5 | REACTOME ASSOCIATION OF TRIC CCT WITH TARGET PROTEINS DURING BIOSYNTHESIS | Genes involved in Association of TriC/CCT with target proteins during biosynthesis |
| 0.1 | 1.4 | REACTOME DSCAM INTERACTIONS | Genes involved in DSCAM interactions |
| 0.1 | 3.4 | REACTOME ANTIGEN ACTIVATES B CELL RECEPTOR LEADING TO GENERATION OF SECOND MESSENGERS | Genes involved in Antigen Activates B Cell Receptor Leading to Generation of Second Messengers |
| 0.1 | 8.7 | REACTOME RESPONSE TO ELEVATED PLATELET CYTOSOLIC CA2 | Genes involved in Response to elevated platelet cytosolic Ca2+ |
| 0.1 | 1.3 | REACTOME CRMPS IN SEMA3A SIGNALING | Genes involved in CRMPs in Sema3A signaling |
| 0.0 | 1.1 | REACTOME OTHER SEMAPHORIN INTERACTIONS | Genes involved in Other semaphorin interactions |
| 0.0 | 0.7 | REACTOME GLYCOGEN BREAKDOWN GLYCOGENOLYSIS | Genes involved in Glycogen breakdown (glycogenolysis) |
| 0.0 | 1.2 | REACTOME GABA SYNTHESIS RELEASE REUPTAKE AND DEGRADATION | Genes involved in GABA synthesis, release, reuptake and degradation |
| 0.0 | 1.1 | REACTOME REGULATION OF GENE EXPRESSION IN BETA CELLS | Genes involved in Regulation of gene expression in beta cells |
| 0.0 | 2.1 | REACTOME CHEMOKINE RECEPTORS BIND CHEMOKINES | Genes involved in Chemokine receptors bind chemokines |
| 0.0 | 4.2 | REACTOME MRNA SPLICING | Genes involved in mRNA Splicing |
| 0.0 | 5.1 | REACTOME G ALPHA I SIGNALLING EVENTS | Genes involved in G alpha (i) signalling events |
| 0.0 | 0.8 | REACTOME TRIGLYCERIDE BIOSYNTHESIS | Genes involved in Triglyceride Biosynthesis |
| 0.0 | 0.8 | REACTOME SIGNAL TRANSDUCTION BY L1 | Genes involved in Signal transduction by L1 |
| 0.0 | 0.8 | REACTOME NRAGE SIGNALS DEATH THROUGH JNK | Genes involved in NRAGE signals death through JNK |
| 0.0 | 1.1 | REACTOME IMMUNOREGULATORY INTERACTIONS BETWEEN A LYMPHOID AND A NON LYMPHOID CELL | Genes involved in Immunoregulatory interactions between a Lymphoid and a non-Lymphoid cell |
| 0.0 | 0.9 | REACTOME INTERFERON GAMMA SIGNALING | Genes involved in Interferon gamma signaling |