Project
GNF SymAtlas + NCI-60 cancer cell lines, comparison of cancers vs non-cancers, human (Su, 2004; Ross, 2000)
Navigation
Downloads
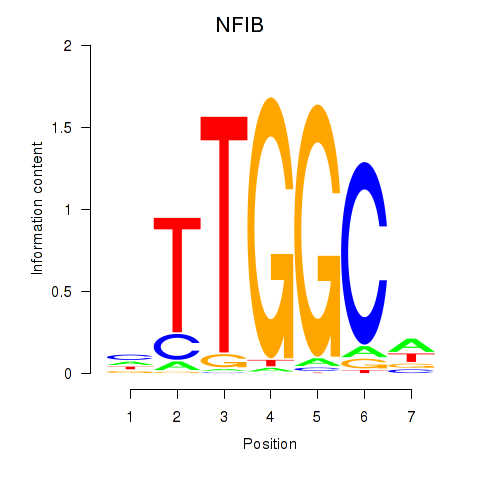
Results for NFIX_NFIB
Z-value: 1.33
Motif logo

Transcription factors associated with NFIX_NFIB
| Gene Symbol | Gene ID | Gene Info |
|---|---|---|
|
NFIX
|
ENSG00000008441.12 | nuclear factor I X |
|
NFIB
|
ENSG00000147862.10 | nuclear factor I B |
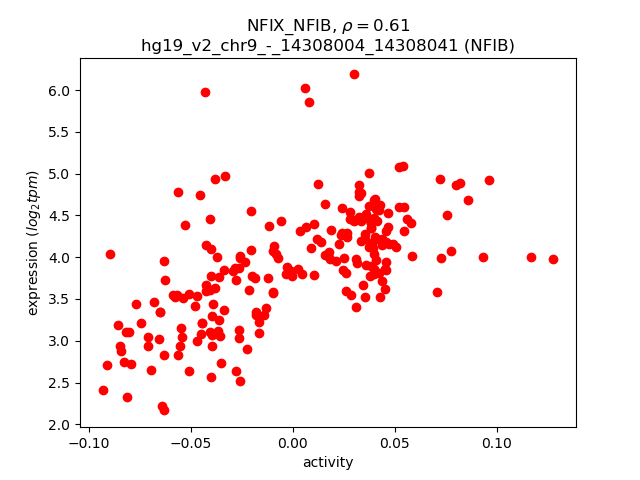
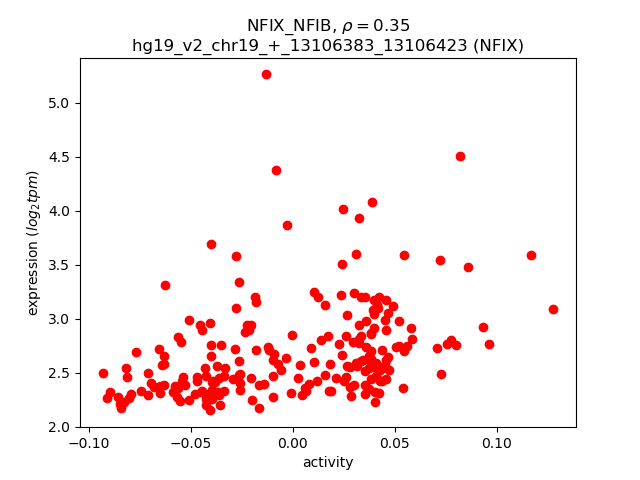
Activity-expression correlation:
| Gene | Promoter | Pearson corr. coef. | P-value | Plot |
|---|---|---|---|---|
| NFIB | hg19_v2_chr9_-_14308004_14308041 | 0.61 | 3.1e-23 | Click! |
| NFIX | hg19_v2_chr19_+_13106383_13106423, hg19_v2_chr19_+_13134772_13134846, hg19_v2_chr19_+_13135731_13135787 | 0.35 | 9.9e-08 | Click! |
Activity profile of NFIX_NFIB motif
Sorted Z-values of NFIX_NFIB motif
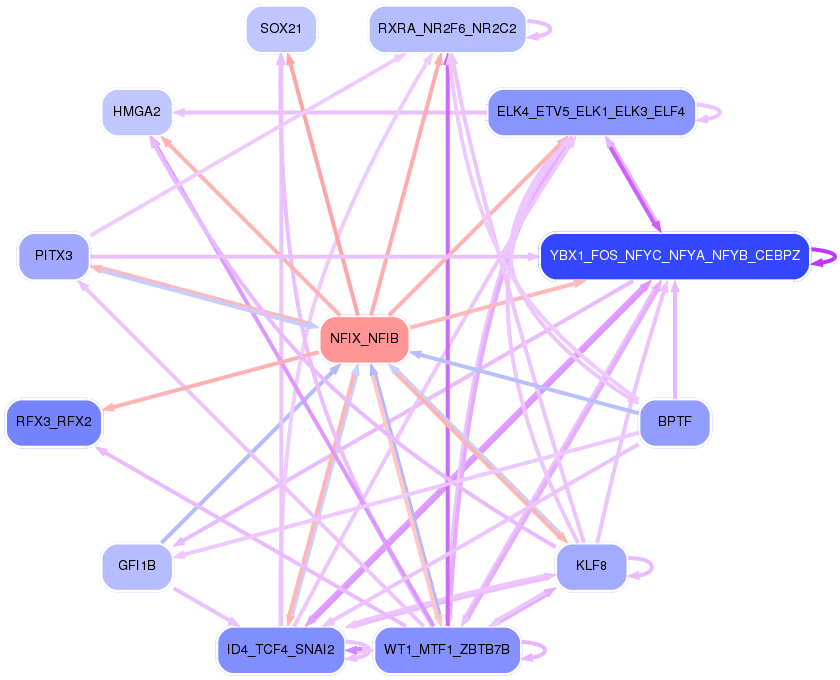
Network of associatons between targets according to the STRING database.

First level regulatory network of NFIX_NFIB
Gene Ontology Analysis
Gene overrepresentation in biological_process category:
| Log-likelihood per target | Total log-likelihood | Term | Description |
|---|---|---|---|
| 19.5 | 58.5 | GO:0098746 | fast, calcium ion-dependent exocytosis of neurotransmitter(GO:0098746) |
| 15.8 | 47.5 | GO:1900226 | negative regulation of NLRP3 inflammasome complex assembly(GO:1900226) |
| 12.2 | 48.9 | GO:0003330 | regulation of extracellular matrix constituent secretion(GO:0003330) positive regulation of extracellular matrix constituent secretion(GO:0003331) |
| 12.1 | 48.3 | GO:0070426 | positive regulation of nucleotide-binding oligomerization domain containing signaling pathway(GO:0070426) positive regulation of nucleotide-binding oligomerization domain containing 2 signaling pathway(GO:0070434) |
| 12.1 | 48.3 | GO:0030185 | nitric oxide transport(GO:0030185) |
| 12.0 | 47.8 | GO:0060392 | negative regulation of SMAD protein import into nucleus(GO:0060392) |
| 11.1 | 66.5 | GO:1902847 | macrophage proliferation(GO:0061517) microglial cell proliferation(GO:0061518) regulation of neuronal signal transduction(GO:1902847) positive regulation of neurofibrillary tangle assembly(GO:1902998) |
| 10.5 | 42.1 | GO:0010900 | negative regulation of phosphatidylcholine catabolic process(GO:0010900) |
| 10.5 | 41.8 | GO:0006114 | glycerol biosynthetic process(GO:0006114) |
| 10.3 | 31.0 | GO:1990168 | protein K33-linked deubiquitination(GO:1990168) |
| 10.3 | 144.6 | GO:0015671 | oxygen transport(GO:0015671) |
| 9.8 | 29.3 | GO:2000296 | negative regulation of hydrogen peroxide catabolic process(GO:2000296) |
| 9.5 | 9.5 | GO:1901655 | cellular response to ketone(GO:1901655) |
| 9.4 | 18.8 | GO:1900425 | negative regulation of defense response to bacterium(GO:1900425) |
| 9.2 | 45.9 | GO:0060718 | chorionic trophoblast cell differentiation(GO:0060718) |
| 9.1 | 27.2 | GO:0043012 | regulation of fusion of sperm to egg plasma membrane(GO:0043012) |
| 9.0 | 27.1 | GO:0033693 | neurofilament bundle assembly(GO:0033693) |
| 8.9 | 35.7 | GO:0006542 | glutamine biosynthetic process(GO:0006542) |
| 8.7 | 43.3 | GO:0048807 | female genitalia morphogenesis(GO:0048807) |
| 8.4 | 33.4 | GO:0009822 | alkaloid catabolic process(GO:0009822) |
| 8.3 | 8.3 | GO:0043650 | glutamate biosynthetic process(GO:0006537) dicarboxylic acid biosynthetic process(GO:0043650) |
| 8.2 | 16.4 | GO:0006982 | response to lipid hydroperoxide(GO:0006982) |
| 7.8 | 15.7 | GO:0044333 | Wnt signaling pathway involved in digestive tract morphogenesis(GO:0044333) |
| 7.8 | 23.4 | GO:1902630 | regulation of membrane hyperpolarization(GO:1902630) |
| 7.8 | 7.8 | GO:0019482 | beta-alanine metabolic process(GO:0019482) |
| 7.7 | 15.5 | GO:1904031 | positive regulation of cyclin-dependent protein kinase activity(GO:1904031) |
| 7.5 | 29.9 | GO:0006208 | pyrimidine nucleobase catabolic process(GO:0006208) thymine catabolic process(GO:0006210) thymine metabolic process(GO:0019859) |
| 7.4 | 36.9 | GO:0015891 | iron chelate transport(GO:0015688) siderophore transport(GO:0015891) |
| 7.3 | 36.4 | GO:0072313 | metanephric glomerular epithelium development(GO:0072244) metanephric glomerular visceral epithelial cell differentiation(GO:0072248) metanephric glomerular visceral epithelial cell development(GO:0072249) metanephric glomerular epithelial cell differentiation(GO:0072312) metanephric glomerular epithelial cell development(GO:0072313) |
| 7.2 | 21.6 | GO:0001798 | positive regulation of type IIa hypersensitivity(GO:0001798) positive regulation of type II hypersensitivity(GO:0002894) |
| 7.0 | 20.9 | GO:0048691 | modulation by virus of host transcription(GO:0019056) positive regulation of sprouting of injured axon(GO:0048687) positive regulation of axon extension involved in regeneration(GO:0048691) modulation by symbiont of host transcription(GO:0052026) |
| 6.9 | 34.4 | GO:0034442 | regulation of lipoprotein oxidation(GO:0034442) negative regulation of lipoprotein oxidation(GO:0034443) |
| 6.8 | 27.2 | GO:1902612 | regulation of anti-Mullerian hormone signaling pathway(GO:1902612) negative regulation of anti-Mullerian hormone signaling pathway(GO:1902613) anti-Mullerian hormone signaling pathway(GO:1990262) |
| 6.7 | 67.4 | GO:0051611 | negative regulation of neurotransmitter uptake(GO:0051581) serotonin uptake(GO:0051610) regulation of serotonin uptake(GO:0051611) negative regulation of serotonin uptake(GO:0051612) |
| 6.7 | 20.2 | GO:1903625 | negative regulation of DNA catabolic process(GO:1903625) |
| 6.5 | 6.5 | GO:0051919 | positive regulation of fibrinolysis(GO:0051919) |
| 6.3 | 31.7 | GO:0009449 | gamma-aminobutyric acid biosynthetic process(GO:0009449) |
| 6.3 | 18.9 | GO:1904397 | negative regulation of neuromuscular junction development(GO:1904397) |
| 6.0 | 23.8 | GO:0035054 | embryonic heart tube anterior/posterior pattern specification(GO:0035054) |
| 5.7 | 17.2 | GO:0001300 | chronological cell aging(GO:0001300) |
| 5.7 | 28.6 | GO:2001106 | regulation of Rho guanyl-nucleotide exchange factor activity(GO:2001106) |
| 5.7 | 17.1 | GO:0009258 | 10-formyltetrahydrofolate catabolic process(GO:0009258) |
| 5.7 | 17.1 | GO:0021718 | superior olivary nucleus development(GO:0021718) superior olivary nucleus maturation(GO:0021722) |
| 5.7 | 28.3 | GO:0044856 | plasma membrane raft distribution(GO:0044855) plasma membrane raft localization(GO:0044856) plasma membrane raft polarization(GO:0044858) regulation of plasma membrane raft polarization(GO:1903906) |
| 5.6 | 22.4 | GO:0071231 | cellular response to folic acid(GO:0071231) |
| 5.6 | 16.7 | GO:0006434 | seryl-tRNA aminoacylation(GO:0006434) selenocysteinyl-tRNA(Sec) biosynthetic process(GO:0097056) |
| 5.6 | 27.8 | GO:0071279 | cellular response to cobalt ion(GO:0071279) |
| 5.4 | 16.2 | GO:0030046 | parallel actin filament bundle assembly(GO:0030046) |
| 5.3 | 26.7 | GO:0030070 | insulin processing(GO:0030070) |
| 5.3 | 5.3 | GO:0035865 | cellular response to potassium ion(GO:0035865) |
| 5.3 | 10.6 | GO:0045646 | regulation of erythrocyte differentiation(GO:0045646) |
| 5.3 | 68.5 | GO:2001135 | regulation of endocytic recycling(GO:2001135) |
| 5.2 | 15.7 | GO:0033861 | negative regulation of NAD(P)H oxidase activity(GO:0033861) |
| 5.2 | 15.5 | GO:1900104 | hyaluranon cable assembly(GO:0036118) regulation of hyaluranon cable assembly(GO:1900104) positive regulation of hyaluranon cable assembly(GO:1900106) |
| 5.1 | 5.1 | GO:0030241 | skeletal muscle myosin thick filament assembly(GO:0030241) |
| 5.1 | 15.4 | GO:0035603 | fibroblast growth factor receptor signaling pathway involved in negative regulation of apoptotic process in bone marrow(GO:0035602) fibroblast growth factor receptor signaling pathway involved in hemopoiesis(GO:0035603) fibroblast growth factor receptor signaling pathway involved in positive regulation of cell proliferation in bone marrow(GO:0035604) squamous basal epithelial stem cell differentiation involved in prostate gland acinus development(GO:0060529) fibroblast growth factor receptor signaling pathway involved in mammary gland specification(GO:0060595) mammary gland bud formation(GO:0060615) branch elongation involved in salivary gland morphogenesis(GO:0060667) mesenchymal cell differentiation involved in lung development(GO:0060915) |
| 5.0 | 15.1 | GO:0038060 | nitric oxide-cGMP-mediated signaling pathway(GO:0038060) |
| 5.0 | 5.0 | GO:0071377 | cellular response to glucagon stimulus(GO:0071377) |
| 4.9 | 14.8 | GO:1990764 | regulation of myofibroblast contraction(GO:1904328) myofibroblast contraction(GO:1990764) |
| 4.9 | 24.5 | GO:0030382 | sperm mitochondrion organization(GO:0030382) |
| 4.9 | 9.8 | GO:0020027 | hemoglobin metabolic process(GO:0020027) |
| 4.9 | 19.5 | GO:0061364 | apoptotic process involved in luteolysis(GO:0061364) |
| 4.8 | 9.7 | GO:1902174 | positive regulation of keratinocyte apoptotic process(GO:1902174) |
| 4.8 | 19.2 | GO:0018352 | protein-pyridoxal-5-phosphate linkage(GO:0018352) |
| 4.8 | 14.3 | GO:0031630 | regulation of synaptic vesicle fusion to presynaptic membrane(GO:0031630) |
| 4.7 | 18.8 | GO:0042412 | taurine biosynthetic process(GO:0042412) |
| 4.7 | 14.1 | GO:0048611 | ectodermal digestive tract development(GO:0007439) embryonic ectodermal digestive tract development(GO:0048611) |
| 4.7 | 23.3 | GO:0090131 | mesenchyme migration(GO:0090131) |
| 4.6 | 18.5 | GO:0072376 | protein activation cascade(GO:0072376) |
| 4.6 | 23.1 | GO:0061107 | seminal vesicle development(GO:0061107) |
| 4.6 | 13.7 | GO:1904933 | regulation of cell proliferation in midbrain(GO:1904933) |
| 4.5 | 22.7 | GO:0035106 | operant conditioning(GO:0035106) |
| 4.5 | 58.7 | GO:0070327 | thyroid hormone transport(GO:0070327) |
| 4.5 | 17.9 | GO:0051866 | general adaptation syndrome(GO:0051866) |
| 4.5 | 13.4 | GO:0033212 | iron assimilation(GO:0033212) iron assimilation by chelation and transport(GO:0033214) positive regulation of bone mineralization involved in bone maturation(GO:1900159) negative regulation of tumor necrosis factor (ligand) superfamily member 11 production(GO:2000308) |
| 4.5 | 13.4 | GO:0019072 | viral genome packaging(GO:0019072) viral RNA genome packaging(GO:0019074) |
| 4.5 | 13.4 | GO:0045110 | intermediate filament bundle assembly(GO:0045110) |
| 4.5 | 13.4 | GO:1904430 | negative regulation of t-circle formation(GO:1904430) |
| 4.4 | 26.5 | GO:0010756 | positive regulation of plasminogen activation(GO:0010756) |
| 4.4 | 22.0 | GO:1903237 | negative regulation of leukocyte tethering or rolling(GO:1903237) |
| 4.4 | 17.6 | GO:1904565 | response to 1-oleoyl-sn-glycerol 3-phosphate(GO:1904565) cellular response to 1-oleoyl-sn-glycerol 3-phosphate(GO:1904566) |
| 4.4 | 4.4 | GO:0060734 | regulation of endoplasmic reticulum stress-induced eIF2 alpha phosphorylation(GO:0060734) |
| 4.3 | 17.1 | GO:0042361 | menaquinone catabolic process(GO:0042361) vitamin K catabolic process(GO:0042377) |
| 4.3 | 12.8 | GO:0035928 | rRNA import into mitochondrion(GO:0035928) |
| 4.3 | 34.1 | GO:0015705 | iodide transport(GO:0015705) |
| 4.2 | 12.7 | GO:1904204 | regulation of skeletal muscle hypertrophy(GO:1904204) |
| 4.2 | 16.9 | GO:0031117 | positive regulation of microtubule depolymerization(GO:0031117) |
| 4.2 | 96.1 | GO:0007597 | blood coagulation, intrinsic pathway(GO:0007597) |
| 4.2 | 33.3 | GO:2000664 | positive regulation of interleukin-5 secretion(GO:2000664) |
| 4.2 | 4.2 | GO:0006145 | purine nucleobase catabolic process(GO:0006145) |
| 4.1 | 49.8 | GO:1900747 | negative regulation of vascular endothelial growth factor signaling pathway(GO:1900747) |
| 4.1 | 49.5 | GO:1900028 | negative regulation of ruffle assembly(GO:1900028) |
| 4.1 | 16.2 | GO:0006072 | glycerol-3-phosphate metabolic process(GO:0006072) |
| 4.0 | 24.2 | GO:2000324 | positive regulation of glucocorticoid receptor signaling pathway(GO:2000324) |
| 4.0 | 12.0 | GO:0034227 | tRNA thio-modification(GO:0034227) |
| 4.0 | 4.0 | GO:2000302 | positive regulation of synaptic vesicle exocytosis(GO:2000302) |
| 4.0 | 32.0 | GO:2001023 | regulation of response to drug(GO:2001023) |
| 4.0 | 12.0 | GO:0036371 | protein localization to M-band(GO:0036309) protein localization to T-tubule(GO:0036371) |
| 4.0 | 23.8 | GO:2000322 | regulation of glucocorticoid receptor signaling pathway(GO:2000322) negative regulation of glucocorticoid receptor signaling pathway(GO:2000323) |
| 3.9 | 15.7 | GO:0005986 | sucrose biosynthetic process(GO:0005986) |
| 3.9 | 3.9 | GO:0015920 | lipopolysaccharide transport(GO:0015920) |
| 3.9 | 27.3 | GO:0001661 | conditioned taste aversion(GO:0001661) |
| 3.9 | 11.7 | GO:0032887 | regulation of spindle elongation(GO:0032887) regulation of mitotic spindle elongation(GO:0032888) anastral spindle assembly(GO:0055048) protein localization to spindle pole body(GO:0071988) regulation of protein localization to spindle pole body(GO:1902363) positive regulation of protein localization to spindle pole body(GO:1902365) positive regulation of mitotic spindle elongation(GO:1902846) |
| 3.9 | 11.6 | GO:0015888 | thiamine transport(GO:0015888) thiamine transmembrane transport(GO:0071934) |
| 3.8 | 42.1 | GO:0030322 | stabilization of membrane potential(GO:0030322) |
| 3.8 | 19.1 | GO:0051946 | regulation of amino acid uptake involved in synaptic transmission(GO:0051941) regulation of glutamate uptake involved in transmission of nerve impulse(GO:0051946) regulation of L-glutamate import(GO:1900920) |
| 3.8 | 3.8 | GO:0090076 | relaxation of skeletal muscle(GO:0090076) |
| 3.8 | 30.5 | GO:0072592 | oxygen metabolic process(GO:0072592) |
| 3.8 | 15.2 | GO:1902261 | positive regulation of delayed rectifier potassium channel activity(GO:1902261) |
| 3.8 | 11.3 | GO:1905154 | negative regulation of membrane invagination(GO:1905154) |
| 3.8 | 11.3 | GO:0038188 | cholecystokinin signaling pathway(GO:0038188) |
| 3.7 | 14.8 | GO:0032811 | negative regulation of epinephrine secretion(GO:0032811) |
| 3.7 | 11.0 | GO:0051684 | maintenance of Golgi location(GO:0051684) |
| 3.7 | 40.5 | GO:0006600 | creatine metabolic process(GO:0006600) |
| 3.7 | 14.6 | GO:0042335 | cuticle development(GO:0042335) |
| 3.6 | 10.9 | GO:0060332 | positive regulation of response to interferon-gamma(GO:0060332) positive regulation of interferon-gamma-mediated signaling pathway(GO:0060335) |
| 3.6 | 10.9 | GO:1990637 | response to prolactin(GO:1990637) |
| 3.6 | 3.6 | GO:0032344 | regulation of aldosterone metabolic process(GO:0032344) regulation of aldosterone biosynthetic process(GO:0032347) |
| 3.6 | 10.8 | GO:1904640 | response to methionine(GO:1904640) |
| 3.6 | 10.7 | GO:1902310 | positive regulation of peptidyl-serine dephosphorylation(GO:1902310) |
| 3.5 | 10.6 | GO:0035915 | pore formation in membrane of other organism(GO:0035915) |
| 3.5 | 63.6 | GO:0006590 | thyroid hormone generation(GO:0006590) |
| 3.5 | 7.1 | GO:0001501 | skeletal system development(GO:0001501) |
| 3.5 | 3.5 | GO:0015722 | canalicular bile acid transport(GO:0015722) |
| 3.5 | 13.9 | GO:0097113 | AMPA glutamate receptor clustering(GO:0097113) glutamate receptor clustering(GO:0097688) |
| 3.5 | 20.8 | GO:0007288 | sperm axoneme assembly(GO:0007288) |
| 3.5 | 10.4 | GO:0050902 | leukocyte adhesive activation(GO:0050902) |
| 3.4 | 3.4 | GO:2000584 | regulation of platelet-derived growth factor receptor-alpha signaling pathway(GO:2000583) negative regulation of platelet-derived growth factor receptor-alpha signaling pathway(GO:2000584) |
| 3.4 | 6.9 | GO:0060164 | regulation of timing of neuron differentiation(GO:0060164) |
| 3.4 | 3.4 | GO:0003285 | septum secundum development(GO:0003285) |
| 3.4 | 3.4 | GO:0008625 | extrinsic apoptotic signaling pathway via death domain receptors(GO:0008625) |
| 3.4 | 10.1 | GO:2001303 | lipoxin biosynthetic process(GO:2001301) lipoxin A4 metabolic process(GO:2001302) lipoxin A4 biosynthetic process(GO:2001303) |
| 3.4 | 10.1 | GO:0016185 | synaptic vesicle budding from presynaptic endocytic zone membrane(GO:0016185) |
| 3.3 | 13.4 | GO:0072180 | mesonephric duct morphogenesis(GO:0072180) |
| 3.3 | 13.3 | GO:0035995 | detection of muscle stretch(GO:0035995) |
| 3.3 | 32.9 | GO:0001833 | inner cell mass cell proliferation(GO:0001833) |
| 3.3 | 22.9 | GO:2000503 | positive regulation of natural killer cell chemotaxis(GO:2000503) |
| 3.3 | 13.1 | GO:0021633 | optic nerve structural organization(GO:0021633) |
| 3.3 | 9.8 | GO:2000661 | positive regulation of interleukin-1-mediated signaling pathway(GO:2000661) |
| 3.2 | 22.7 | GO:0010890 | positive regulation of sequestering of triglyceride(GO:0010890) |
| 3.2 | 9.7 | GO:0035469 | determination of pancreatic left/right asymmetry(GO:0035469) |
| 3.2 | 9.7 | GO:0051037 | histone displacement(GO:0001207) regulation of transcription involved in meiotic cell cycle(GO:0051037) positive regulation of transcription involved in meiotic cell cycle(GO:0051039) |
| 3.2 | 25.7 | GO:0006531 | aspartate metabolic process(GO:0006531) |
| 3.2 | 12.8 | GO:0031443 | fast-twitch skeletal muscle fiber contraction(GO:0031443) |
| 3.2 | 9.5 | GO:0002125 | maternal aggressive behavior(GO:0002125) |
| 3.2 | 18.9 | GO:0010873 | positive regulation of cholesterol esterification(GO:0010873) |
| 3.1 | 9.4 | GO:0019470 | 4-hydroxyproline catabolic process(GO:0019470) |
| 3.1 | 3.1 | GO:0035634 | response to stilbenoid(GO:0035634) |
| 3.1 | 3.1 | GO:0099545 | trans-synaptic signaling by trans-synaptic complex(GO:0099545) |
| 3.1 | 6.2 | GO:0032765 | positive regulation of mast cell cytokine production(GO:0032765) |
| 3.1 | 18.7 | GO:0060903 | positive regulation of meiosis I(GO:0060903) |
| 3.1 | 37.3 | GO:2001224 | positive regulation of neuron migration(GO:2001224) |
| 3.1 | 9.3 | GO:0048241 | epinephrine transport(GO:0048241) |
| 3.1 | 27.7 | GO:0036017 | response to erythropoietin(GO:0036017) |
| 3.1 | 21.5 | GO:0071205 | protein localization to juxtaparanode region of axon(GO:0071205) |
| 3.1 | 3.1 | GO:0033687 | osteoblast proliferation(GO:0033687) |
| 3.1 | 6.1 | GO:0002118 | aggressive behavior(GO:0002118) |
| 3.1 | 6.1 | GO:0014016 | neuroblast differentiation(GO:0014016) |
| 3.0 | 18.1 | GO:0035774 | positive regulation of insulin secretion involved in cellular response to glucose stimulus(GO:0035774) |
| 3.0 | 6.0 | GO:0043403 | skeletal muscle tissue regeneration(GO:0043403) |
| 3.0 | 24.1 | GO:0007258 | JUN phosphorylation(GO:0007258) |
| 3.0 | 3.0 | GO:0033561 | regulation of water loss via skin(GO:0033561) |
| 3.0 | 17.8 | GO:0019732 | antifungal humoral response(GO:0019732) |
| 3.0 | 3.0 | GO:0051771 | negative regulation of nitric-oxide synthase biosynthetic process(GO:0051771) |
| 3.0 | 8.9 | GO:0030311 | poly-N-acetyllactosamine metabolic process(GO:0030309) poly-N-acetyllactosamine biosynthetic process(GO:0030311) |
| 2.9 | 38.1 | GO:0030321 | transepithelial chloride transport(GO:0030321) |
| 2.9 | 2.9 | GO:1900227 | positive regulation of NLRP3 inflammasome complex assembly(GO:1900227) |
| 2.9 | 14.6 | GO:0035582 | sequestering of BMP in extracellular matrix(GO:0035582) |
| 2.9 | 8.7 | GO:0044278 | cell wall disruption in other organism(GO:0044278) |
| 2.9 | 8.7 | GO:1902722 | activation of phospholipase A2 activity by calcium-mediated signaling(GO:0043006) positive regulation of prolactin secretion(GO:1902722) |
| 2.9 | 2.9 | GO:0046487 | glyoxylate metabolic process(GO:0046487) |
| 2.9 | 11.5 | GO:0044334 | regulation of heparan sulfate proteoglycan biosynthetic process(GO:0010908) positive regulation of heparan sulfate proteoglycan biosynthetic process(GO:0010909) canonical Wnt signaling pathway involved in positive regulation of epithelial to mesenchymal transition(GO:0044334) positive regulation of proteoglycan biosynthetic process(GO:1902730) |
| 2.9 | 11.5 | GO:0090258 | negative regulation of mitochondrial fission(GO:0090258) |
| 2.8 | 2.8 | GO:0070474 | positive regulation of uterine smooth muscle contraction(GO:0070474) |
| 2.8 | 2.8 | GO:0060157 | urinary bladder development(GO:0060157) |
| 2.8 | 8.5 | GO:0042360 | vitamin E metabolic process(GO:0042360) |
| 2.8 | 8.5 | GO:0008628 | hormone-mediated apoptotic signaling pathway(GO:0008628) |
| 2.8 | 19.7 | GO:0061302 | smooth muscle cell-matrix adhesion(GO:0061302) |
| 2.8 | 14.0 | GO:0048133 | germ-line stem cell division(GO:0042078) male germ-line stem cell asymmetric division(GO:0048133) germline stem cell asymmetric division(GO:0098728) |
| 2.8 | 27.9 | GO:0043152 | induction of bacterial agglutination(GO:0043152) |
| 2.8 | 30.6 | GO:0034638 | phosphatidylcholine catabolic process(GO:0034638) |
| 2.8 | 44.5 | GO:0032291 | central nervous system myelination(GO:0022010) axon ensheathment in central nervous system(GO:0032291) |
| 2.8 | 38.8 | GO:1904714 | regulation of chaperone-mediated autophagy(GO:1904714) |
| 2.8 | 22.1 | GO:0043401 | steroid hormone mediated signaling pathway(GO:0043401) |
| 2.8 | 8.3 | GO:0033326 | cerebrospinal fluid secretion(GO:0033326) |
| 2.7 | 8.2 | GO:0001992 | regulation of systemic arterial blood pressure by vasopressin(GO:0001992) |
| 2.7 | 8.2 | GO:0040034 | regulation of development, heterochronic(GO:0040034) regulation of timing of cell differentiation(GO:0048505) |
| 2.7 | 32.6 | GO:0036158 | outer dynein arm assembly(GO:0036158) |
| 2.7 | 8.1 | GO:0019287 | isopentenyl diphosphate biosynthetic process, mevalonate pathway(GO:0019287) |
| 2.7 | 13.5 | GO:1902731 | negative regulation of chondrocyte proliferation(GO:1902731) |
| 2.7 | 24.0 | GO:0051552 | flavone metabolic process(GO:0051552) |
| 2.7 | 8.0 | GO:0046271 | phenylpropanoid catabolic process(GO:0046271) |
| 2.7 | 10.6 | GO:0009182 | purine deoxyribonucleoside diphosphate metabolic process(GO:0009182) |
| 2.6 | 10.6 | GO:0032972 | regulation of muscle filament sliding speed(GO:0032972) |
| 2.6 | 7.9 | GO:1990502 | dense core granule maturation(GO:1990502) |
| 2.6 | 2.6 | GO:0061110 | dense core granule biogenesis(GO:0061110) regulation of dense core granule biogenesis(GO:2000705) |
| 2.6 | 7.9 | GO:1903984 | positive regulation of TRAIL-activated apoptotic signaling pathway(GO:1903984) |
| 2.6 | 7.9 | GO:1901624 | negative regulation of lymphocyte chemotaxis(GO:1901624) |
| 2.6 | 10.5 | GO:0016098 | monoterpenoid metabolic process(GO:0016098) |
| 2.6 | 10.5 | GO:0006562 | proline catabolic process(GO:0006562) |
| 2.6 | 10.5 | GO:0050910 | detection of mechanical stimulus involved in sensory perception of sound(GO:0050910) |
| 2.6 | 7.9 | GO:1902081 | regulation of calcium ion import into sarcoplasmic reticulum(GO:1902080) negative regulation of calcium ion import into sarcoplasmic reticulum(GO:1902081) |
| 2.6 | 23.5 | GO:2000370 | positive regulation of clathrin-mediated endocytosis(GO:2000370) |
| 2.6 | 10.5 | GO:0010637 | negative regulation of mitochondrial fusion(GO:0010637) |
| 2.6 | 7.8 | GO:0061055 | myotome development(GO:0061055) |
| 2.6 | 38.8 | GO:0006751 | glutathione catabolic process(GO:0006751) |
| 2.6 | 46.4 | GO:0019371 | cyclooxygenase pathway(GO:0019371) |
| 2.6 | 7.7 | GO:1901842 | negative regulation of high voltage-gated calcium channel activity(GO:1901842) |
| 2.6 | 5.1 | GO:0051659 | maintenance of mitochondrion location(GO:0051659) |
| 2.6 | 2.6 | GO:1901079 | positive regulation of relaxation of muscle(GO:1901079) |
| 2.6 | 18.0 | GO:0071494 | cellular response to UV-C(GO:0071494) |
| 2.6 | 10.2 | GO:0007525 | somatic muscle development(GO:0007525) |
| 2.6 | 2.6 | GO:0010046 | response to mycotoxin(GO:0010046) |
| 2.5 | 5.1 | GO:0070318 | positive regulation of G0 to G1 transition(GO:0070318) |
| 2.5 | 7.6 | GO:0060398 | regulation of growth hormone receptor signaling pathway(GO:0060398) |
| 2.5 | 2.5 | GO:0042761 | fatty acid elongation, saturated fatty acid(GO:0019367) fatty acid elongation, unsaturated fatty acid(GO:0019368) fatty acid elongation(GO:0030497) fatty acid elongation, monounsaturated fatty acid(GO:0034625) fatty acid elongation, polyunsaturated fatty acid(GO:0034626) very long-chain fatty acid biosynthetic process(GO:0042761) |
| 2.5 | 10.1 | GO:0007185 | transmembrane receptor protein tyrosine phosphatase signaling pathway(GO:0007185) |
| 2.5 | 15.1 | GO:0060294 | cilium movement involved in cell motility(GO:0060294) |
| 2.5 | 30.2 | GO:1901621 | negative regulation of smoothened signaling pathway involved in dorsal/ventral neural tube patterning(GO:1901621) |
| 2.5 | 10.0 | GO:0022614 | membrane to membrane docking(GO:0022614) |
| 2.5 | 14.9 | GO:0006102 | isocitrate metabolic process(GO:0006102) |
| 2.5 | 49.1 | GO:0008535 | respiratory chain complex IV assembly(GO:0008535) |
| 2.4 | 2.4 | GO:0014734 | skeletal muscle hypertrophy(GO:0014734) |
| 2.4 | 12.2 | GO:0071918 | urea transmembrane transport(GO:0071918) |
| 2.4 | 19.5 | GO:0072378 | blood coagulation, fibrin clot formation(GO:0072378) |
| 2.4 | 4.8 | GO:0021542 | dentate gyrus development(GO:0021542) |
| 2.4 | 7.2 | GO:0050882 | voluntary musculoskeletal movement(GO:0050882) |
| 2.4 | 38.5 | GO:0032060 | bleb assembly(GO:0032060) |
| 2.4 | 7.1 | GO:1900073 | regulation of neuromuscular synaptic transmission(GO:1900073) positive regulation of neuromuscular synaptic transmission(GO:1900075) |
| 2.4 | 7.1 | GO:0051918 | negative regulation of fibrinolysis(GO:0051918) |
| 2.4 | 16.5 | GO:0019720 | Mo-molybdopterin cofactor biosynthetic process(GO:0006777) Mo-molybdopterin cofactor metabolic process(GO:0019720) |
| 2.3 | 14.1 | GO:0031999 | negative regulation of fatty acid beta-oxidation(GO:0031999) |
| 2.3 | 7.0 | GO:0051725 | protein de-ADP-ribosylation(GO:0051725) |
| 2.3 | 6.9 | GO:0001694 | histamine biosynthetic process(GO:0001694) |
| 2.3 | 11.6 | GO:2000676 | positive regulation of type B pancreatic cell apoptotic process(GO:2000676) |
| 2.3 | 9.2 | GO:0035633 | maintenance of blood-brain barrier(GO:0035633) |
| 2.3 | 9.2 | GO:0001519 | peptide amidation(GO:0001519) protein amidation(GO:0018032) peptide modification(GO:0031179) |
| 2.3 | 13.8 | GO:0052565 | response to defense-related nitric oxide production by other organism involved in symbiotic interaction(GO:0052551) response to defense-related host nitric oxide production(GO:0052565) |
| 2.3 | 4.6 | GO:0061428 | negative regulation of transcription from RNA polymerase II promoter in response to hypoxia(GO:0061428) |
| 2.3 | 11.4 | GO:0010665 | regulation of cardiac muscle cell apoptotic process(GO:0010665) |
| 2.2 | 2.2 | GO:0000255 | allantoin metabolic process(GO:0000255) |
| 2.2 | 51.4 | GO:0006957 | complement activation, alternative pathway(GO:0006957) |
| 2.2 | 4.4 | GO:0070781 | response to biotin(GO:0070781) |
| 2.2 | 4.4 | GO:0042713 | sperm ejaculation(GO:0042713) |
| 2.2 | 17.7 | GO:0006686 | sphingomyelin biosynthetic process(GO:0006686) |
| 2.2 | 24.1 | GO:0071394 | cellular response to testosterone stimulus(GO:0071394) |
| 2.2 | 26.2 | GO:0072520 | seminiferous tubule development(GO:0072520) |
| 2.2 | 4.4 | GO:0061299 | retina vasculature morphogenesis in camera-type eye(GO:0061299) |
| 2.2 | 43.3 | GO:0006646 | phosphatidylethanolamine biosynthetic process(GO:0006646) |
| 2.2 | 6.5 | GO:0051901 | positive regulation of mitochondrial depolarization(GO:0051901) |
| 2.2 | 19.4 | GO:0051410 | detoxification of nitrogen compound(GO:0051410) |
| 2.2 | 6.5 | GO:1905146 | lysosomal protein catabolic process(GO:1905146) |
| 2.1 | 27.8 | GO:0010603 | regulation of cytoplasmic mRNA processing body assembly(GO:0010603) |
| 2.1 | 8.6 | GO:0038170 | somatostatin receptor signaling pathway(GO:0038169) somatostatin signaling pathway(GO:0038170) |
| 2.1 | 61.9 | GO:0015695 | organic cation transport(GO:0015695) |
| 2.1 | 4.3 | GO:1903347 | negative regulation of bicellular tight junction assembly(GO:1903347) |
| 2.1 | 4.2 | GO:0060605 | tube lumen cavitation(GO:0060605) salivary gland cavitation(GO:0060662) |
| 2.1 | 8.5 | GO:0006509 | membrane protein ectodomain proteolysis(GO:0006509) |
| 2.1 | 4.2 | GO:0001575 | globoside metabolic process(GO:0001575) |
| 2.1 | 6.3 | GO:0090210 | regulation of establishment of blood-brain barrier(GO:0090210) negative regulation of establishment of blood-brain barrier(GO:0090212) |
| 2.1 | 2.1 | GO:0016078 | tRNA catabolic process(GO:0016078) |
| 2.1 | 8.4 | GO:1904749 | regulation of protein localization to nucleolus(GO:1904749) |
| 2.1 | 6.3 | GO:0061536 | glycine secretion(GO:0061536) glycine secretion, neurotransmission(GO:0061537) |
| 2.1 | 20.8 | GO:0042908 | xenobiotic transport(GO:0042908) |
| 2.1 | 2.1 | GO:0097084 | vascular smooth muscle cell development(GO:0097084) |
| 2.1 | 18.5 | GO:0007507 | heart development(GO:0007507) |
| 2.1 | 6.2 | GO:0061534 | gamma-aminobutyric acid secretion, neurotransmission(GO:0061534) |
| 2.1 | 2.1 | GO:0070370 | heat acclimation(GO:0010286) cellular heat acclimation(GO:0070370) |
| 2.0 | 8.2 | GO:0019046 | release from viral latency(GO:0019046) |
| 2.0 | 8.2 | GO:0015872 | dopamine transport(GO:0015872) |
| 2.0 | 24.5 | GO:0001886 | endothelial cell morphogenesis(GO:0001886) |
| 2.0 | 12.2 | GO:0097460 | ferrous iron import into cell(GO:0097460) ferrous iron import across plasma membrane(GO:0098707) |
| 2.0 | 4.1 | GO:1901877 | regulation of calcium ion binding(GO:1901876) negative regulation of calcium ion binding(GO:1901877) |
| 2.0 | 34.6 | GO:0010457 | centriole-centriole cohesion(GO:0010457) |
| 2.0 | 2.0 | GO:2000211 | regulation of glutamate metabolic process(GO:2000211) |
| 2.0 | 54.7 | GO:0045494 | photoreceptor cell maintenance(GO:0045494) |
| 2.0 | 6.1 | GO:1904823 | pyrimidine nucleobase transport(GO:0015855) purine nucleobase transmembrane transport(GO:1904823) |
| 2.0 | 6.1 | GO:0045198 | establishment of epithelial cell apical/basal polarity(GO:0045198) |
| 2.0 | 6.0 | GO:0044240 | multicellular organism lipid catabolic process(GO:0044240) |
| 2.0 | 10.1 | GO:0036102 | leukotriene catabolic process(GO:0036100) leukotriene B4 catabolic process(GO:0036101) leukotriene B4 metabolic process(GO:0036102) icosanoid catabolic process(GO:1901523) fatty acid derivative catabolic process(GO:1901569) |
| 2.0 | 4.0 | GO:0090024 | negative regulation of granulocyte chemotaxis(GO:0071623) negative regulation of neutrophil chemotaxis(GO:0090024) negative regulation of neutrophil migration(GO:1902623) |
| 2.0 | 6.0 | GO:0042450 | arginine biosynthetic process via ornithine(GO:0042450) |
| 2.0 | 8.0 | GO:2000170 | negative regulation of gap junction assembly(GO:1903597) positive regulation of peptidyl-cysteine S-nitrosylation(GO:2000170) |
| 2.0 | 13.9 | GO:1902746 | regulation of lens fiber cell differentiation(GO:1902746) |
| 2.0 | 2.0 | GO:0015840 | urea transport(GO:0015840) |
| 2.0 | 7.9 | GO:0046013 | regulation of T cell homeostatic proliferation(GO:0046013) |
| 2.0 | 3.9 | GO:0010165 | response to X-ray(GO:0010165) |
| 2.0 | 3.9 | GO:0001806 | type IV hypersensitivity(GO:0001806) regulation of type IV hypersensitivity(GO:0001807) |
| 2.0 | 5.9 | GO:0043606 | histidine catabolic process to glutamate and formamide(GO:0019556) histidine catabolic process to glutamate and formate(GO:0019557) formamide metabolic process(GO:0043606) |
| 2.0 | 9.8 | GO:1904139 | positive regulation of odontogenesis of dentin-containing tooth(GO:0042488) mammary gland fat development(GO:0060611) positive regulation of macrophage colony-stimulating factor signaling pathway(GO:1902228) positive regulation of response to macrophage colony-stimulating factor(GO:1903971) positive regulation of cellular response to macrophage colony-stimulating factor stimulus(GO:1903974) microglial cell migration(GO:1904124) regulation of microglial cell migration(GO:1904139) positive regulation of microglial cell migration(GO:1904141) |
| 2.0 | 7.8 | GO:0042986 | positive regulation of amyloid precursor protein biosynthetic process(GO:0042986) |
| 2.0 | 3.9 | GO:0006975 | DNA damage induced protein phosphorylation(GO:0006975) |
| 1.9 | 5.8 | GO:0019605 | benzoate metabolic process(GO:0018874) butyrate metabolic process(GO:0019605) |
| 1.9 | 3.9 | GO:0014002 | astrocyte development(GO:0014002) |
| 1.9 | 3.9 | GO:0051457 | maintenance of protein location in nucleus(GO:0051457) |
| 1.9 | 5.8 | GO:0032804 | negative regulation of low-density lipoprotein particle receptor catabolic process(GO:0032804) |
| 1.9 | 19.3 | GO:0034058 | endosomal vesicle fusion(GO:0034058) |
| 1.9 | 23.1 | GO:1901387 | positive regulation of voltage-gated calcium channel activity(GO:1901387) |
| 1.9 | 3.8 | GO:0051106 | positive regulation of DNA ligation(GO:0051106) |
| 1.9 | 3.8 | GO:0060681 | branch elongation involved in ureteric bud branching(GO:0060681) |
| 1.9 | 11.4 | GO:0006857 | oligopeptide transport(GO:0006857) |
| 1.9 | 5.7 | GO:0045906 | negative regulation of vasoconstriction(GO:0045906) |
| 1.9 | 1.9 | GO:2000389 | regulation of neutrophil extravasation(GO:2000389) |
| 1.9 | 9.5 | GO:2001034 | positive regulation of double-strand break repair via nonhomologous end joining(GO:2001034) |
| 1.9 | 1.9 | GO:0019442 | tryptophan catabolic process to acetyl-CoA(GO:0019442) |
| 1.9 | 13.2 | GO:0015760 | hexose phosphate transport(GO:0015712) glucose-6-phosphate transport(GO:0015760) |
| 1.9 | 41.5 | GO:0071294 | cellular response to zinc ion(GO:0071294) |
| 1.9 | 9.4 | GO:0002415 | immunoglobulin transcytosis in epithelial cells mediated by polymeric immunoglobulin receptor(GO:0002415) |
| 1.9 | 7.5 | GO:0072602 | interleukin-4 secretion(GO:0072602) |
| 1.9 | 5.6 | GO:0007538 | primary sex determination(GO:0007538) |
| 1.9 | 48.8 | GO:0001580 | detection of chemical stimulus involved in sensory perception of bitter taste(GO:0001580) |
| 1.9 | 31.9 | GO:0036149 | phosphatidylinositol acyl-chain remodeling(GO:0036149) |
| 1.9 | 11.2 | GO:2000348 | regulation of CD40 signaling pathway(GO:2000348) |
| 1.9 | 11.2 | GO:0051694 | pointed-end actin filament capping(GO:0051694) |
| 1.9 | 7.5 | GO:0060075 | regulation of resting membrane potential(GO:0060075) |
| 1.9 | 7.5 | GO:0018101 | protein citrullination(GO:0018101) histone citrullination(GO:0036414) |
| 1.9 | 11.2 | GO:0038161 | prolactin signaling pathway(GO:0038161) |
| 1.9 | 11.2 | GO:0051026 | chiasma assembly(GO:0051026) |
| 1.9 | 1.9 | GO:0009804 | coumarin metabolic process(GO:0009804) |
| 1.9 | 18.6 | GO:0014848 | urinary bladder smooth muscle contraction(GO:0014832) urinary tract smooth muscle contraction(GO:0014848) |
| 1.9 | 7.4 | GO:1900245 | positive regulation of MDA-5 signaling pathway(GO:1900245) |
| 1.8 | 9.2 | GO:0019464 | glycine catabolic process(GO:0006546) glycine decarboxylation via glycine cleavage system(GO:0019464) |
| 1.8 | 38.6 | GO:0098743 | cell aggregation(GO:0098743) |
| 1.8 | 1.8 | GO:0045976 | negative regulation of mitotic cell cycle, embryonic(GO:0045976) |
| 1.8 | 33.0 | GO:0006704 | glucocorticoid biosynthetic process(GO:0006704) |
| 1.8 | 5.5 | GO:1905224 | clathrin-coated pit assembly(GO:1905224) |
| 1.8 | 12.7 | GO:0051791 | medium-chain fatty acid metabolic process(GO:0051791) |
| 1.8 | 23.5 | GO:0048266 | behavioral response to pain(GO:0048266) |
| 1.8 | 7.2 | GO:0072674 | multinuclear osteoclast differentiation(GO:0072674) osteoclast fusion(GO:0072675) |
| 1.8 | 7.2 | GO:0002933 | lipid hydroxylation(GO:0002933) |
| 1.8 | 5.4 | GO:1902308 | regulation of peptidyl-serine dephosphorylation(GO:1902308) negative regulation of peptidyl-serine dephosphorylation(GO:1902309) |
| 1.8 | 12.5 | GO:2000124 | regulation of endocannabinoid signaling pathway(GO:2000124) |
| 1.8 | 8.8 | GO:1902902 | negative regulation of autophagosome assembly(GO:1902902) |
| 1.8 | 10.6 | GO:0036166 | phenotypic switching(GO:0036166) regulation of phenotypic switching(GO:1900239) |
| 1.8 | 15.8 | GO:0043589 | skin morphogenesis(GO:0043589) |
| 1.8 | 7.0 | GO:1903976 | negative regulation of glial cell migration(GO:1903976) |
| 1.7 | 5.2 | GO:0036090 | cleavage furrow ingression(GO:0036090) |
| 1.7 | 5.2 | GO:0043163 | cell envelope organization(GO:0043163) external encapsulating structure organization(GO:0045229) |
| 1.7 | 3.5 | GO:0010635 | regulation of mitochondrial fusion(GO:0010635) |
| 1.7 | 5.2 | GO:0046104 | thymidine metabolic process(GO:0046104) pyrimidine deoxyribonucleoside metabolic process(GO:0046125) |
| 1.7 | 45.0 | GO:0032463 | negative regulation of protein homooligomerization(GO:0032463) |
| 1.7 | 1.7 | GO:2000317 | negative regulation of T-helper 17 type immune response(GO:2000317) negative regulation of T-helper 17 cell differentiation(GO:2000320) |
| 1.7 | 12.0 | GO:0008343 | adult feeding behavior(GO:0008343) |
| 1.7 | 39.5 | GO:0006577 | amino-acid betaine metabolic process(GO:0006577) |
| 1.7 | 6.9 | GO:0061304 | retinal blood vessel morphogenesis(GO:0061304) |
| 1.7 | 6.8 | GO:2000343 | positive regulation of chemokine (C-X-C motif) ligand 2 production(GO:2000343) |
| 1.7 | 3.4 | GO:0060285 | cilium-dependent cell motility(GO:0060285) |
| 1.7 | 10.1 | GO:0003197 | endocardial cushion development(GO:0003197) |
| 1.7 | 16.8 | GO:1990416 | cellular response to brain-derived neurotrophic factor stimulus(GO:1990416) |
| 1.7 | 21.8 | GO:0051823 | regulation of synapse structural plasticity(GO:0051823) |
| 1.7 | 1.7 | GO:0035456 | response to interferon-beta(GO:0035456) |
| 1.7 | 5.0 | GO:1900220 | semaphorin-plexin signaling pathway involved in bone trabecula morphogenesis(GO:1900220) |
| 1.7 | 6.7 | GO:0089700 | protein kinase D signaling(GO:0089700) |
| 1.7 | 5.0 | GO:0061002 | negative regulation of dendritic spine morphogenesis(GO:0061002) |
| 1.7 | 10.0 | GO:0048681 | negative regulation of axon regeneration(GO:0048681) |
| 1.6 | 6.6 | GO:0045872 | positive regulation of rhodopsin gene expression(GO:0045872) |
| 1.6 | 6.5 | GO:1903935 | response to sodium arsenite(GO:1903935) cellular response to sodium arsenite(GO:1903936) |
| 1.6 | 3.3 | GO:0060290 | transdifferentiation(GO:0060290) |
| 1.6 | 6.5 | GO:0017198 | N-terminal peptidyl-serine acetylation(GO:0017198) N-terminal peptidyl-glutamic acid acetylation(GO:0018002) peptidyl-serine acetylation(GO:0030920) |
| 1.6 | 6.5 | GO:1990418 | response to insulin-like growth factor stimulus(GO:1990418) |
| 1.6 | 6.5 | GO:2000722 | regulation of cardiac vascular smooth muscle cell differentiation(GO:2000722) |
| 1.6 | 4.9 | GO:1990535 | neuron projection maintenance(GO:1990535) |
| 1.6 | 6.5 | GO:0071477 | hypotonic salinity response(GO:0042539) cellular hypotonic salinity response(GO:0071477) |
| 1.6 | 8.1 | GO:0010793 | regulation of mRNA export from nucleus(GO:0010793) |
| 1.6 | 3.2 | GO:0048859 | formation of anatomical boundary(GO:0048859) |
| 1.6 | 6.4 | GO:1900194 | negative regulation of oocyte maturation(GO:1900194) |
| 1.6 | 4.8 | GO:0003257 | positive regulation of transcription from RNA polymerase II promoter involved in myocardial precursor cell differentiation(GO:0003257) positive regulation of transcription from RNA polymerase II promoter involved in heart development(GO:1901228) |
| 1.6 | 6.4 | GO:0097089 | methyl-branched fatty acid metabolic process(GO:0097089) |
| 1.6 | 1.6 | GO:0051253 | negative regulation of RNA metabolic process(GO:0051253) |
| 1.6 | 12.8 | GO:0003351 | epithelial cilium movement(GO:0003351) |
| 1.6 | 8.0 | GO:1900736 | regulation of phospholipase C-activating G-protein coupled receptor signaling pathway(GO:1900736) |
| 1.6 | 4.8 | GO:0051970 | negative regulation of transmission of nerve impulse(GO:0051970) |
| 1.6 | 4.8 | GO:1903350 | response to dopamine(GO:1903350) cellular response to dopamine(GO:1903351) |
| 1.6 | 3.2 | GO:1903978 | regulation of microglial cell activation(GO:1903978) |
| 1.6 | 6.3 | GO:1990504 | dense core granule exocytosis(GO:1990504) |
| 1.6 | 3.2 | GO:1900155 | regulation of bone trabecula formation(GO:1900154) negative regulation of bone trabecula formation(GO:1900155) |
| 1.6 | 3.1 | GO:0044805 | late nucleophagy(GO:0044805) |
| 1.6 | 3.1 | GO:1902723 | negative regulation of skeletal muscle cell proliferation(GO:0014859) negative regulation of skeletal muscle satellite cell proliferation(GO:1902723) |
| 1.6 | 3.1 | GO:0006335 | DNA replication-dependent nucleosome assembly(GO:0006335) DNA replication-dependent nucleosome organization(GO:0034723) |
| 1.6 | 12.5 | GO:0006384 | transcription initiation from RNA polymerase III promoter(GO:0006384) |
| 1.6 | 3.1 | GO:0018879 | biphenyl metabolic process(GO:0018879) |
| 1.6 | 12.5 | GO:1902412 | regulation of mitotic cytokinesis(GO:1902412) |
| 1.6 | 4.7 | GO:0018262 | isopeptide cross-linking via N6-(L-isoglutamyl)-L-lysine(GO:0018153) isopeptide cross-linking(GO:0018262) |
| 1.6 | 12.5 | GO:0032703 | negative regulation of interleukin-2 production(GO:0032703) |
| 1.6 | 7.8 | GO:0014827 | intestine smooth muscle contraction(GO:0014827) |
| 1.6 | 3.1 | GO:0005985 | sucrose metabolic process(GO:0005985) |
| 1.5 | 3.1 | GO:0032430 | positive regulation of phospholipase A2 activity(GO:0032430) activation of phospholipase A2 activity(GO:0032431) |
| 1.5 | 13.9 | GO:2000622 | regulation of nuclear-transcribed mRNA catabolic process, nonsense-mediated decay(GO:2000622) negative regulation of nuclear-transcribed mRNA catabolic process, nonsense-mediated decay(GO:2000623) |
| 1.5 | 24.7 | GO:2000291 | regulation of myoblast proliferation(GO:2000291) |
| 1.5 | 6.2 | GO:0018343 | protein farnesylation(GO:0018343) |
| 1.5 | 7.7 | GO:0060137 | maternal process involved in parturition(GO:0060137) |
| 1.5 | 6.1 | GO:1903564 | regulation of protein localization to cilium(GO:1903564) |
| 1.5 | 9.1 | GO:0048630 | skeletal muscle tissue growth(GO:0048630) |
| 1.5 | 4.5 | GO:0007497 | posterior midgut development(GO:0007497) positive regulation of penile erection(GO:0060406) endothelin receptor signaling pathway(GO:0086100) |
| 1.5 | 12.1 | GO:0060158 | phospholipase C-activating dopamine receptor signaling pathway(GO:0060158) |
| 1.5 | 4.5 | GO:0009107 | lipoate biosynthetic process(GO:0009107) |
| 1.5 | 3.0 | GO:1990086 | lens fiber cell apoptotic process(GO:1990086) |
| 1.5 | 7.5 | GO:0007341 | penetration of zona pellucida(GO:0007341) |
| 1.5 | 4.5 | GO:0071529 | cementum mineralization(GO:0071529) |
| 1.5 | 6.0 | GO:0061146 | Peyer's patch morphogenesis(GO:0061146) |
| 1.5 | 10.5 | GO:0015886 | heme transport(GO:0015886) iron coordination entity transport(GO:1901678) |
| 1.5 | 1.5 | GO:0002175 | protein localization to paranode region of axon(GO:0002175) |
| 1.5 | 7.4 | GO:0060979 | vasculogenesis involved in coronary vascular morphogenesis(GO:0060979) |
| 1.5 | 11.8 | GO:2000467 | positive regulation of glycogen (starch) synthase activity(GO:2000467) |
| 1.5 | 23.7 | GO:1904706 | negative regulation of vascular smooth muscle cell proliferation(GO:1904706) |
| 1.5 | 10.3 | GO:0030916 | otic vesicle formation(GO:0030916) |
| 1.5 | 4.4 | GO:0060084 | synaptic transmission involved in micturition(GO:0060084) |
| 1.5 | 5.8 | GO:0010650 | positive regulation of cell communication by electrical coupling(GO:0010650) maintenance of protein location in membrane(GO:0072658) maintenance of protein location in plasma membrane(GO:0072660) positive regulation of membrane depolarization during cardiac muscle cell action potential(GO:1900827) |
| 1.5 | 4.4 | GO:0033364 | mast cell secretory granule organization(GO:0033364) |
| 1.5 | 16.0 | GO:0031284 | positive regulation of guanylate cyclase activity(GO:0031284) |
| 1.5 | 17.5 | GO:0005513 | detection of calcium ion(GO:0005513) |
| 1.5 | 2.9 | GO:0051189 | molybdopterin cofactor biosynthetic process(GO:0032324) molybdopterin cofactor metabolic process(GO:0043545) prosthetic group metabolic process(GO:0051189) |
| 1.5 | 18.9 | GO:0097151 | positive regulation of inhibitory postsynaptic potential(GO:0097151) modulation of inhibitory postsynaptic potential(GO:0098828) |
| 1.5 | 4.4 | GO:1901339 | regulation of store-operated calcium channel activity(GO:1901339) |
| 1.4 | 10.1 | GO:0010002 | cardioblast differentiation(GO:0010002) |
| 1.4 | 14.4 | GO:0042905 | 9-cis-retinoic acid biosynthetic process(GO:0042904) 9-cis-retinoic acid metabolic process(GO:0042905) |
| 1.4 | 2.9 | GO:0072329 | monocarboxylic acid catabolic process(GO:0072329) |
| 1.4 | 33.0 | GO:0045821 | positive regulation of glycolytic process(GO:0045821) positive regulation of cofactor metabolic process(GO:0051194) positive regulation of coenzyme metabolic process(GO:0051197) |
| 1.4 | 51.6 | GO:0018146 | keratan sulfate biosynthetic process(GO:0018146) |
| 1.4 | 2.9 | GO:0051481 | negative regulation of cytosolic calcium ion concentration(GO:0051481) |
| 1.4 | 5.7 | GO:0007198 | adenylate cyclase-inhibiting serotonin receptor signaling pathway(GO:0007198) |
| 1.4 | 7.1 | GO:0050962 | detection of light stimulus involved in visual perception(GO:0050908) detection of light stimulus involved in sensory perception(GO:0050962) |
| 1.4 | 17.1 | GO:0006693 | prostanoid metabolic process(GO:0006692) prostaglandin metabolic process(GO:0006693) |
| 1.4 | 10.0 | GO:0034115 | negative regulation of heterotypic cell-cell adhesion(GO:0034115) regulation of cell-cell adhesion involved in gastrulation(GO:0070587) |
| 1.4 | 5.7 | GO:0030007 | cellular potassium ion homeostasis(GO:0030007) |
| 1.4 | 18.3 | GO:2000194 | regulation of female gonad development(GO:2000194) |
| 1.4 | 2.8 | GO:0002725 | negative regulation of T cell cytokine production(GO:0002725) |
| 1.4 | 7.0 | GO:0072023 | thick ascending limb development(GO:0072023) metanephric thick ascending limb development(GO:0072233) |
| 1.4 | 4.2 | GO:0061370 | testosterone biosynthetic process(GO:0061370) |
| 1.4 | 7.0 | GO:0051012 | microtubule sliding(GO:0051012) |
| 1.4 | 2.8 | GO:0001865 | NK T cell differentiation(GO:0001865) |
| 1.4 | 5.6 | GO:0010499 | proteasomal ubiquitin-independent protein catabolic process(GO:0010499) |
| 1.4 | 23.6 | GO:0090036 | regulation of protein kinase C signaling(GO:0090036) |
| 1.4 | 2.8 | GO:0050748 | negative regulation of lipoprotein metabolic process(GO:0050748) |
| 1.4 | 2.8 | GO:0032900 | negative regulation of neurotrophin production(GO:0032900) |
| 1.4 | 2.8 | GO:1902617 | response to fluoride(GO:1902617) |
| 1.4 | 8.3 | GO:0002760 | positive regulation of antimicrobial peptide production(GO:0002225) positive regulation of antimicrobial humoral response(GO:0002760) regulation of antimicrobial peptide production(GO:0002784) regulation of antibacterial peptide production(GO:0002786) positive regulation of antibacterial peptide production(GO:0002803) |
| 1.4 | 2.8 | GO:1903521 | apoptotic process involved in mammary gland involution(GO:0060057) positive regulation of apoptotic process involved in mammary gland involution(GO:0060058) positive regulation of apoptotic process involved in morphogenesis(GO:1902339) regulation of mammary gland involution(GO:1903519) positive regulation of mammary gland involution(GO:1903521) positive regulation of apoptotic process involved in development(GO:1904747) |
| 1.4 | 6.9 | GO:0007521 | muscle cell fate determination(GO:0007521) |
| 1.4 | 16.5 | GO:0042730 | fibrinolysis(GO:0042730) |
| 1.4 | 5.5 | GO:0009386 | translational attenuation(GO:0009386) |
| 1.4 | 10.9 | GO:0071104 | response to interleukin-9(GO:0071104) |
| 1.4 | 1.4 | GO:0036378 | calcitriol biosynthetic process from calciol(GO:0036378) |
| 1.4 | 1.4 | GO:0051549 | regulation of keratinocyte migration(GO:0051547) positive regulation of keratinocyte migration(GO:0051549) |
| 1.4 | 4.1 | GO:1901993 | meiotic cell cycle phase transition(GO:0044771) regulation of meiotic cell cycle phase transition(GO:1901993) negative regulation of meiotic cell cycle phase transition(GO:1901994) |
| 1.4 | 6.8 | GO:0023041 | neuronal signal transduction(GO:0023041) |
| 1.4 | 8.1 | GO:0030917 | midbrain-hindbrain boundary development(GO:0030917) |
| 1.4 | 4.1 | GO:1990414 | replication-born double-strand break repair via sister chromatid exchange(GO:1990414) |
| 1.4 | 2.7 | GO:0016561 | protein import into peroxisome matrix, translocation(GO:0016561) |
| 1.3 | 14.8 | GO:0045725 | positive regulation of glycogen biosynthetic process(GO:0045725) |
| 1.3 | 25.5 | GO:0070886 | positive regulation of calcineurin-NFAT signaling cascade(GO:0070886) |
| 1.3 | 10.7 | GO:0060736 | prostate gland growth(GO:0060736) |
| 1.3 | 8.0 | GO:0098722 | asymmetric neuroblast division(GO:0055059) asymmetric stem cell division(GO:0098722) |
| 1.3 | 16.1 | GO:0051852 | disruption by host of symbiont cells(GO:0051852) killing by host of symbiont cells(GO:0051873) |
| 1.3 | 4.0 | GO:1904647 | response to rotenone(GO:1904647) |
| 1.3 | 5.3 | GO:0006127 | glycerophosphate shuttle(GO:0006127) |
| 1.3 | 5.3 | GO:0002215 | defense response to nematode(GO:0002215) |
| 1.3 | 1.3 | GO:1900109 | regulation of histone H3-K9 dimethylation(GO:1900109) |
| 1.3 | 1.3 | GO:0032971 | regulation of muscle filament sliding(GO:0032971) |
| 1.3 | 10.5 | GO:0001675 | acrosome assembly(GO:0001675) |
| 1.3 | 6.6 | GO:0070445 | oligodendrocyte progenitor proliferation(GO:0070444) regulation of oligodendrocyte progenitor proliferation(GO:0070445) |
| 1.3 | 3.9 | GO:2001054 | negative regulation of mesenchymal cell apoptotic process(GO:2001054) |
| 1.3 | 6.5 | GO:1990253 | cellular response to leucine starvation(GO:1990253) |
| 1.3 | 2.6 | GO:0042160 | lipoprotein modification(GO:0042160) lipoprotein oxidation(GO:0042161) |
| 1.3 | 9.1 | GO:1902035 | positive regulation of hematopoietic stem cell proliferation(GO:1902035) |
| 1.3 | 2.6 | GO:0097029 | mature conventional dendritic cell differentiation(GO:0097029) |
| 1.3 | 19.4 | GO:0071786 | endoplasmic reticulum tubular network organization(GO:0071786) |
| 1.3 | 7.8 | GO:0048050 | post-embryonic eye morphogenesis(GO:0048050) |
| 1.3 | 2.6 | GO:0060023 | soft palate development(GO:0060023) |
| 1.3 | 21.9 | GO:0019336 | phenol-containing compound catabolic process(GO:0019336) |
| 1.3 | 3.9 | GO:0007418 | ventral midline development(GO:0007418) smoothened signaling pathway involved in regulation of cerebellar granule cell precursor cell proliferation(GO:0021938) |
| 1.3 | 5.1 | GO:2001016 | positive regulation of skeletal muscle cell differentiation(GO:2001016) |
| 1.3 | 7.7 | GO:0098535 | de novo centriole assembly(GO:0098535) |
| 1.3 | 2.6 | GO:0060040 | retinal bipolar neuron differentiation(GO:0060040) |
| 1.3 | 14.0 | GO:0045161 | neuronal ion channel clustering(GO:0045161) |
| 1.3 | 12.7 | GO:0048251 | elastic fiber assembly(GO:0048251) |
| 1.3 | 3.8 | GO:0038123 | toll-like receptor TLR1:TLR2 signaling pathway(GO:0038123) response to triacyl bacterial lipopeptide(GO:0071725) cellular response to triacyl bacterial lipopeptide(GO:0071727) |
| 1.3 | 1.3 | GO:1900168 | glial cell-derived neurotrophic factor secretion(GO:0044467) metanephric mesangial cell differentiation(GO:0072209) metanephric glomerular mesangial cell differentiation(GO:0072254) regulation of glial cell-derived neurotrophic factor secretion(GO:1900166) positive regulation of glial cell-derived neurotrophic factor secretion(GO:1900168) |
| 1.3 | 2.5 | GO:0033564 | anterior/posterior axon guidance(GO:0033564) |
| 1.3 | 1.3 | GO:0001554 | luteolysis(GO:0001554) |
| 1.3 | 2.5 | GO:0044782 | cilium organization(GO:0044782) |
| 1.3 | 5.0 | GO:0034380 | high-density lipoprotein particle assembly(GO:0034380) |
| 1.3 | 2.5 | GO:0043116 | negative regulation of vascular permeability(GO:0043116) |
| 1.3 | 32.6 | GO:0048791 | calcium ion-regulated exocytosis of neurotransmitter(GO:0048791) |
| 1.2 | 10.0 | GO:0097107 | postsynaptic density organization(GO:0097106) postsynaptic density assembly(GO:0097107) gephyrin clustering involved in postsynaptic density assembly(GO:0097116) |
| 1.2 | 8.7 | GO:0015693 | magnesium ion transport(GO:0015693) |
| 1.2 | 9.9 | GO:0000101 | sulfur amino acid transport(GO:0000101) |
| 1.2 | 7.5 | GO:0048298 | positive regulation of isotype switching to IgA isotypes(GO:0048298) |
| 1.2 | 1.2 | GO:0061073 | ciliary body morphogenesis(GO:0061073) |
| 1.2 | 19.8 | GO:0019372 | lipoxygenase pathway(GO:0019372) |
| 1.2 | 3.7 | GO:0061081 | positive regulation of macrophage cytokine production(GO:0060907) positive regulation of myeloid leukocyte cytokine production involved in immune response(GO:0061081) |
| 1.2 | 6.2 | GO:1901910 | diadenosine polyphosphate catabolic process(GO:0015961) diphosphoinositol polyphosphate metabolic process(GO:0071543) diadenosine pentaphosphate metabolic process(GO:1901906) diadenosine pentaphosphate catabolic process(GO:1901907) diadenosine hexaphosphate metabolic process(GO:1901908) diadenosine hexaphosphate catabolic process(GO:1901909) adenosine 5'-(hexahydrogen pentaphosphate) metabolic process(GO:1901910) adenosine 5'-(hexahydrogen pentaphosphate) catabolic process(GO:1901911) |
| 1.2 | 2.5 | GO:0097118 | neuroligin clustering involved in postsynaptic membrane assembly(GO:0097118) |
| 1.2 | 4.9 | GO:1990573 | potassium ion import across plasma membrane(GO:1990573) |
| 1.2 | 8.6 | GO:0048712 | negative regulation of astrocyte differentiation(GO:0048712) |
| 1.2 | 2.5 | GO:0003241 | growth involved in heart morphogenesis(GO:0003241) |
| 1.2 | 2.4 | GO:0007520 | syncytium formation(GO:0006949) myoblast fusion(GO:0007520) |
| 1.2 | 4.9 | GO:0006498 | N-terminal protein lipidation(GO:0006498) |
| 1.2 | 9.8 | GO:0060746 | maternal behavior(GO:0042711) parental behavior(GO:0060746) |
| 1.2 | 7.3 | GO:0006287 | base-excision repair, gap-filling(GO:0006287) |
| 1.2 | 3.6 | GO:0006624 | vacuolar protein processing(GO:0006624) |
| 1.2 | 73.7 | GO:0030049 | muscle filament sliding(GO:0030049) actin-myosin filament sliding(GO:0033275) |
| 1.2 | 27.8 | GO:0016338 | calcium-independent cell-cell adhesion via plasma membrane cell-adhesion molecules(GO:0016338) |
| 1.2 | 3.6 | GO:0070105 | positive regulation of interleukin-6-mediated signaling pathway(GO:0070105) |
| 1.2 | 9.6 | GO:0099566 | regulation of postsynaptic cytosolic calcium ion concentration(GO:0099566) |
| 1.2 | 3.6 | GO:0048250 | mitochondrial iron ion transport(GO:0048250) |
| 1.2 | 7.2 | GO:0071376 | response to corticotropin-releasing hormone(GO:0043435) cellular response to corticotropin-releasing hormone stimulus(GO:0071376) |
| 1.2 | 8.4 | GO:0001955 | blood vessel maturation(GO:0001955) |
| 1.2 | 7.2 | GO:0007506 | gonadal mesoderm development(GO:0007506) |
| 1.2 | 17.9 | GO:1901897 | regulation of relaxation of cardiac muscle(GO:1901897) |
| 1.2 | 11.9 | GO:0014894 | response to muscle inactivity involved in regulation of muscle adaptation(GO:0014877) response to denervation involved in regulation of muscle adaptation(GO:0014894) |
| 1.2 | 14.2 | GO:0007130 | synaptonemal complex assembly(GO:0007130) |
| 1.2 | 4.7 | GO:0035356 | cellular triglyceride homeostasis(GO:0035356) |
| 1.2 | 9.4 | GO:0086010 | membrane depolarization during action potential(GO:0086010) |
| 1.2 | 3.5 | GO:0051386 | regulation of neurotrophin TRK receptor signaling pathway(GO:0051386) |
| 1.2 | 4.6 | GO:0071503 | response to heparin(GO:0071503) cellular response to heparin(GO:0071504) |
| 1.2 | 5.8 | GO:0031529 | ruffle organization(GO:0031529) |
| 1.1 | 17.2 | GO:0016024 | CDP-diacylglycerol biosynthetic process(GO:0016024) |
| 1.1 | 6.9 | GO:0035093 | spermatogenesis, exchange of chromosomal proteins(GO:0035093) |
| 1.1 | 12.6 | GO:0006030 | chitin metabolic process(GO:0006030) chitin catabolic process(GO:0006032) |
| 1.1 | 2.3 | GO:0051029 | rRNA transport(GO:0051029) |
| 1.1 | 3.4 | GO:0098935 | dendritic transport(GO:0098935) anterograde dendritic transport(GO:0098937) |
| 1.1 | 9.1 | GO:0071830 | chylomicron remnant clearance(GO:0034382) triglyceride-rich lipoprotein particle clearance(GO:0071830) |
| 1.1 | 2.3 | GO:1902108 | regulation of mitochondrial membrane permeability involved in apoptotic process(GO:1902108) |
| 1.1 | 3.4 | GO:0038193 | thromboxane A2 signaling pathway(GO:0038193) |
| 1.1 | 6.7 | GO:0048680 | positive regulation of axon regeneration(GO:0048680) |
| 1.1 | 9.0 | GO:0090043 | regulation of tubulin deacetylation(GO:0090043) |
| 1.1 | 4.5 | GO:0001561 | fatty acid alpha-oxidation(GO:0001561) |
| 1.1 | 3.3 | GO:0075044 | autophagy of host cells involved in interaction with symbiont(GO:0075044) autophagy involved in symbiotic interaction(GO:0075071) |
| 1.1 | 3.3 | GO:0006669 | sphinganine-1-phosphate biosynthetic process(GO:0006669) |
| 1.1 | 3.3 | GO:0070213 | negative regulation of sister chromatid cohesion(GO:0045875) protein auto-ADP-ribosylation(GO:0070213) |
| 1.1 | 11.0 | GO:0042487 | regulation of odontogenesis of dentin-containing tooth(GO:0042487) |
| 1.1 | 11.0 | GO:0015812 | gamma-aminobutyric acid transport(GO:0015812) |
| 1.1 | 5.5 | GO:1901731 | positive regulation of platelet aggregation(GO:1901731) |
| 1.1 | 4.4 | GO:0021936 | regulation of cerebellar granule cell precursor proliferation(GO:0021936) |
| 1.1 | 5.5 | GO:0070389 | chaperone cofactor-dependent protein refolding(GO:0070389) |
| 1.1 | 7.6 | GO:0001889 | liver development(GO:0001889) hepaticobiliary system development(GO:0061008) |
| 1.1 | 3.2 | GO:0034372 | triglyceride-rich lipoprotein particle remodeling(GO:0034370) very-low-density lipoprotein particle remodeling(GO:0034372) |
| 1.1 | 5.4 | GO:0033274 | response to vitamin B2(GO:0033274) heterochromatin maintenance(GO:0070829) |
| 1.1 | 7.5 | GO:0048172 | regulation of short-term neuronal synaptic plasticity(GO:0048172) |
| 1.1 | 2.2 | GO:0060484 | lung-associated mesenchyme development(GO:0060484) |
| 1.1 | 3.2 | GO:1900063 | regulation of peroxisome organization(GO:1900063) |
| 1.1 | 5.4 | GO:0039663 | fusion of virus membrane with host plasma membrane(GO:0019064) membrane fusion involved in viral entry into host cell(GO:0039663) multi-organism membrane fusion(GO:0044800) |
| 1.1 | 5.4 | GO:0019805 | quinolinate biosynthetic process(GO:0019805) |
| 1.1 | 1.1 | GO:0008053 | mitochondrial fusion(GO:0008053) |
| 1.1 | 5.3 | GO:0044245 | polysaccharide digestion(GO:0044245) |
| 1.1 | 30.8 | GO:0043252 | sodium-independent organic anion transport(GO:0043252) |
| 1.1 | 25.4 | GO:0043567 | regulation of insulin-like growth factor receptor signaling pathway(GO:0043567) |
| 1.1 | 7.4 | GO:0010248 | establishment or maintenance of transmembrane electrochemical gradient(GO:0010248) |
| 1.1 | 1.1 | GO:1900114 | positive regulation of histone H3-K9 trimethylation(GO:1900114) |
| 1.0 | 15.7 | GO:1902259 | regulation of delayed rectifier potassium channel activity(GO:1902259) |
| 1.0 | 1.0 | GO:0032058 | positive regulation of translational initiation in response to stress(GO:0032058) |
| 1.0 | 31.4 | GO:0050919 | negative chemotaxis(GO:0050919) |
| 1.0 | 6.2 | GO:0036438 | maintenance of lens transparency(GO:0036438) |
| 1.0 | 4.2 | GO:0008063 | Toll signaling pathway(GO:0008063) |
| 1.0 | 3.1 | GO:1904425 | negative regulation of GTP binding(GO:1904425) |
| 1.0 | 9.3 | GO:0035082 | axoneme assembly(GO:0035082) |
| 1.0 | 4.1 | GO:0006565 | L-serine catabolic process(GO:0006565) |
| 1.0 | 51.6 | GO:0050911 | detection of chemical stimulus involved in sensory perception of smell(GO:0050911) |
| 1.0 | 5.1 | GO:0042461 | photoreceptor cell development(GO:0042461) |
| 1.0 | 1.0 | GO:0032571 | response to vitamin K(GO:0032571) |
| 1.0 | 1.0 | GO:0045986 | negative regulation of smooth muscle contraction(GO:0045986) |
| 1.0 | 3.1 | GO:0034154 | toll-like receptor 7 signaling pathway(GO:0034154) |
| 1.0 | 4.1 | GO:0035726 | common myeloid progenitor cell proliferation(GO:0035726) |
| 1.0 | 6.1 | GO:0071670 | smooth muscle cell chemotaxis(GO:0071670) |
| 1.0 | 3.0 | GO:1902490 | regulation of sperm capacitation(GO:1902490) |
| 1.0 | 7.1 | GO:2000049 | positive regulation of cell-cell adhesion mediated by cadherin(GO:2000049) |
| 1.0 | 2.0 | GO:0010966 | regulation of phosphate transport(GO:0010966) |
| 1.0 | 4.0 | GO:0051387 | negative regulation of neurotrophin TRK receptor signaling pathway(GO:0051387) |
| 1.0 | 3.0 | GO:0006116 | fructose catabolic process(GO:0006001) NADH oxidation(GO:0006116) fructose catabolic process to hydroxyacetone phosphate and glyceraldehyde-3-phosphate(GO:0061624) |
| 1.0 | 2.0 | GO:0015793 | glycerol transport(GO:0015793) |
| 1.0 | 12.0 | GO:0045880 | positive regulation of smoothened signaling pathway(GO:0045880) |
| 1.0 | 9.0 | GO:0042118 | endothelial cell activation(GO:0042118) |
| 1.0 | 1.0 | GO:0050849 | negative regulation of calcium-mediated signaling(GO:0050849) |
| 1.0 | 3.0 | GO:0023021 | termination of signal transduction(GO:0023021) |
| 1.0 | 5.0 | GO:0006572 | tyrosine catabolic process(GO:0006572) |
| 1.0 | 3.0 | GO:0032290 | peripheral nervous system myelin formation(GO:0032290) |
| 1.0 | 11.8 | GO:0033539 | fatty acid beta-oxidation using acyl-CoA dehydrogenase(GO:0033539) |
| 1.0 | 3.0 | GO:0006490 | oligosaccharide-lipid intermediate biosynthetic process(GO:0006490) |
| 1.0 | 14.7 | GO:0099536 | synaptic signaling(GO:0099536) |
| 1.0 | 14.7 | GO:0090360 | platelet-derived growth factor production(GO:0090360) regulation of platelet-derived growth factor production(GO:0090361) |
| 1.0 | 2.9 | GO:0008611 | ether lipid biosynthetic process(GO:0008611) glycerol ether biosynthetic process(GO:0046504) ether biosynthetic process(GO:1901503) |
| 1.0 | 9.8 | GO:0098719 | sodium ion import across plasma membrane(GO:0098719) sodium ion import into cell(GO:1990118) |
| 1.0 | 8.8 | GO:0019373 | epoxygenase P450 pathway(GO:0019373) |
| 1.0 | 1.9 | GO:0060024 | rhythmic synaptic transmission(GO:0060024) |
| 1.0 | 3.9 | GO:0007260 | tyrosine phosphorylation of STAT protein(GO:0007260) regulation of tyrosine phosphorylation of STAT protein(GO:0042509) |
| 1.0 | 15.5 | GO:0043562 | cellular response to nitrogen starvation(GO:0006995) cellular response to nitrogen levels(GO:0043562) |
| 1.0 | 4.8 | GO:0048147 | negative regulation of fibroblast proliferation(GO:0048147) |
| 1.0 | 6.8 | GO:2000546 | positive regulation of cell chemotaxis to fibroblast growth factor(GO:1904849) positive regulation of endothelial cell chemotaxis to fibroblast growth factor(GO:2000546) |
| 1.0 | 7.7 | GO:0008286 | insulin receptor signaling pathway(GO:0008286) |
| 1.0 | 2.9 | GO:0018916 | nitrobenzene metabolic process(GO:0018916) |
| 1.0 | 15.4 | GO:0035970 | peptidyl-threonine dephosphorylation(GO:0035970) |
| 1.0 | 6.7 | GO:0098703 | calcium ion import across plasma membrane(GO:0098703) calcium ion import into cell(GO:1990035) |
| 1.0 | 9.6 | GO:0010990 | regulation of SMAD protein complex assembly(GO:0010990) negative regulation of SMAD protein complex assembly(GO:0010991) |
| 1.0 | 17.2 | GO:0030502 | negative regulation of bone mineralization(GO:0030502) |
| 0.9 | 12.3 | GO:0071285 | cellular response to lithium ion(GO:0071285) |
| 0.9 | 2.8 | GO:0046061 | dATP catabolic process(GO:0046061) |
| 0.9 | 2.8 | GO:0002522 | leukocyte migration involved in immune response(GO:0002522) |
| 0.9 | 6.6 | GO:0008218 | bioluminescence(GO:0008218) |
| 0.9 | 5.7 | GO:0017196 | N-terminal peptidyl-methionine acetylation(GO:0017196) |
| 0.9 | 6.6 | GO:0090306 | spindle assembly involved in meiosis(GO:0090306) |
| 0.9 | 3.8 | GO:0045065 | cytotoxic T cell differentiation(GO:0045065) |
| 0.9 | 16.9 | GO:0048714 | positive regulation of oligodendrocyte differentiation(GO:0048714) |
| 0.9 | 18.7 | GO:0003334 | keratinocyte development(GO:0003334) |
| 0.9 | 0.9 | GO:0019249 | lactate biosynthetic process(GO:0019249) |
| 0.9 | 8.4 | GO:0048245 | eosinophil chemotaxis(GO:0048245) |
| 0.9 | 1.9 | GO:0032053 | ciliary basal body organization(GO:0032053) |
| 0.9 | 1.9 | GO:0035414 | negative regulation of catenin import into nucleus(GO:0035414) |
| 0.9 | 2.8 | GO:1903795 | regulation of anion channel activity(GO:0010359) positive regulation of anion channel activity(GO:1901529) positive regulation of cyclic nucleotide-gated ion channel activity(GO:1902161) regulation of voltage-gated chloride channel activity(GO:1902941) positive regulation of voltage-gated chloride channel activity(GO:1902943) regulation of inorganic anion transmembrane transport(GO:1903795) positive regulation of inorganic anion transmembrane transport(GO:1903797) positive regulation of anion transmembrane transport(GO:1903961) |
| 0.9 | 10.1 | GO:0046548 | retinal rod cell development(GO:0046548) |
| 0.9 | 2.8 | GO:0060370 | susceptibility to T cell mediated cytotoxicity(GO:0060370) |
| 0.9 | 6.4 | GO:0042340 | keratan sulfate catabolic process(GO:0042340) |
| 0.9 | 16.5 | GO:0071420 | cellular response to histamine(GO:0071420) |
| 0.9 | 20.1 | GO:1901687 | glutathione derivative metabolic process(GO:1901685) glutathione derivative biosynthetic process(GO:1901687) |
| 0.9 | 2.7 | GO:0021979 | hypothalamus cell differentiation(GO:0021979) |
| 0.9 | 1.8 | GO:0043031 | negative regulation of macrophage activation(GO:0043031) |
| 0.9 | 3.6 | GO:0071447 | cellular response to hydroperoxide(GO:0071447) |
| 0.9 | 3.6 | GO:0006776 | vitamin A metabolic process(GO:0006776) |
| 0.9 | 0.9 | GO:0048170 | positive regulation of long-term neuronal synaptic plasticity(GO:0048170) |
| 0.9 | 3.6 | GO:2001241 | positive regulation of extrinsic apoptotic signaling pathway in absence of ligand(GO:2001241) |
| 0.9 | 6.3 | GO:0006935 | chemotaxis(GO:0006935) taxis(GO:0042330) |
| 0.9 | 2.7 | GO:1902669 | positive regulation of axon guidance(GO:1902669) |
| 0.9 | 13.4 | GO:0097150 | neuronal stem cell population maintenance(GO:0097150) |
| 0.9 | 8.8 | GO:2000052 | positive regulation of non-canonical Wnt signaling pathway(GO:2000052) |
| 0.9 | 3.5 | GO:0036269 | swimming behavior(GO:0036269) |
| 0.9 | 7.0 | GO:0033299 | secretion of lysosomal enzymes(GO:0033299) |
| 0.9 | 7.0 | GO:0034308 | primary alcohol metabolic process(GO:0034308) |
| 0.9 | 10.4 | GO:0070208 | protein heterotrimerization(GO:0070208) |
| 0.9 | 6.1 | GO:0048280 | vesicle fusion with Golgi apparatus(GO:0048280) |
| 0.9 | 16.5 | GO:0008045 | motor neuron axon guidance(GO:0008045) |
| 0.9 | 7.8 | GO:0018026 | peptidyl-lysine monomethylation(GO:0018026) |
| 0.9 | 2.6 | GO:0003229 | ventricular cardiac muscle tissue development(GO:0003229) |
| 0.9 | 3.5 | GO:0097210 | response to gonadotropin-releasing hormone(GO:0097210) cellular response to gonadotropin-releasing hormone(GO:0097211) |
| 0.9 | 5.2 | GO:0097491 | sympathetic neuron projection extension(GO:0097490) sympathetic neuron projection guidance(GO:0097491) semaphorin-plexin signaling pathway involved in neuron projection guidance(GO:1902285) |
| 0.9 | 2.6 | GO:0097359 | UDP-glucosylation(GO:0097359) |
| 0.9 | 5.2 | GO:0032411 | positive regulation of transporter activity(GO:0032411) |
| 0.9 | 1.7 | GO:0042476 | odontogenesis(GO:0042476) |
| 0.9 | 6.0 | GO:0070235 | regulation of activation-induced cell death of T cells(GO:0070235) negative regulation of activation-induced cell death of T cells(GO:0070236) |
| 0.9 | 2.6 | GO:0006651 | diacylglycerol biosynthetic process(GO:0006651) |
| 0.9 | 8.5 | GO:0002693 | positive regulation of cellular extravasation(GO:0002693) |
| 0.8 | 3.4 | GO:1902307 | positive regulation of sodium ion transmembrane transport(GO:1902307) positive regulation of sodium ion transmembrane transporter activity(GO:2000651) |
| 0.8 | 11.0 | GO:0051865 | protein autoubiquitination(GO:0051865) |
| 0.8 | 1.7 | GO:0030644 | cellular chloride ion homeostasis(GO:0030644) |
| 0.8 | 7.6 | GO:0050942 | regulation of pigment cell differentiation(GO:0050932) positive regulation of pigment cell differentiation(GO:0050942) |
| 0.8 | 13.5 | GO:0021952 | central nervous system projection neuron axonogenesis(GO:0021952) |
| 0.8 | 1.7 | GO:2000381 | negative regulation of mesoderm development(GO:2000381) |
| 0.8 | 2.5 | GO:1904294 | positive regulation of ERAD pathway(GO:1904294) |
| 0.8 | 14.2 | GO:0060850 | regulation of transcription involved in cell fate commitment(GO:0060850) |
| 0.8 | 5.8 | GO:0060612 | adipose tissue development(GO:0060612) |
| 0.8 | 2.5 | GO:0042636 | negative regulation of hair cycle(GO:0042636) |
| 0.8 | 2.5 | GO:0019417 | sulfur oxidation(GO:0019417) |
| 0.8 | 3.3 | GO:0034959 | substance P catabolic process(GO:0010814) calcitonin catabolic process(GO:0010816) endothelin maturation(GO:0034959) |
| 0.8 | 2.5 | GO:0099531 | neurotransmitter secretion(GO:0007269) presynaptic process involved in chemical synaptic transmission(GO:0099531) signal release from synapse(GO:0099643) |
| 0.8 | 2.5 | GO:0051715 | cytolysis in other organism(GO:0051715) |
| 0.8 | 2.5 | GO:0014820 | tonic smooth muscle contraction(GO:0014820) |
| 0.8 | 4.1 | GO:0035063 | nuclear speck organization(GO:0035063) |
| 0.8 | 2.4 | GO:0044254 | angiotensin catabolic process in blood(GO:0002005) multicellular organismal protein catabolic process(GO:0044254) protein digestion(GO:0044256) multicellular organismal macromolecule catabolic process(GO:0044266) |
| 0.8 | 4.9 | GO:0061737 | leukotriene signaling pathway(GO:0061737) |
| 0.8 | 8.1 | GO:0071493 | cellular response to UV-B(GO:0071493) |
| 0.8 | 3.2 | GO:0007270 | neuron-neuron synaptic transmission(GO:0007270) |
| 0.8 | 8.9 | GO:0010663 | positive regulation of striated muscle cell apoptotic process(GO:0010663) positive regulation of cardiac muscle cell apoptotic process(GO:0010666) |
| 0.8 | 4.8 | GO:0016554 | cytidine to uridine editing(GO:0016554) |
| 0.8 | 5.6 | GO:0030238 | male sex determination(GO:0030238) |
| 0.8 | 6.4 | GO:0060856 | establishment of blood-brain barrier(GO:0060856) |
| 0.8 | 3.9 | GO:0003322 | pancreatic A cell development(GO:0003322) |
| 0.8 | 0.8 | GO:0006349 | regulation of gene expression by genetic imprinting(GO:0006349) |
| 0.8 | 3.1 | GO:0046340 | diacylglycerol catabolic process(GO:0046340) |
| 0.8 | 5.5 | GO:0036150 | phosphatidylserine acyl-chain remodeling(GO:0036150) |
| 0.8 | 6.3 | GO:0006107 | oxaloacetate metabolic process(GO:0006107) |
| 0.8 | 1.5 | GO:0044828 | negative regulation by host of viral genome replication(GO:0044828) |
| 0.8 | 3.8 | GO:0097398 | response to interleukin-17(GO:0097396) cellular response to interleukin-17(GO:0097398) |
| 0.8 | 1.5 | GO:0032464 | positive regulation of protein homooligomerization(GO:0032464) |
| 0.8 | 32.9 | GO:0018149 | peptide cross-linking(GO:0018149) |
| 0.8 | 9.9 | GO:0097067 | cellular response to thyroid hormone stimulus(GO:0097067) |
| 0.8 | 2.3 | GO:0035621 | ER to Golgi ceramide transport(GO:0035621) |
| 0.8 | 9.9 | GO:0006833 | water transport(GO:0006833) |
| 0.8 | 4.6 | GO:0014010 | Schwann cell proliferation(GO:0014010) |
| 0.8 | 6.8 | GO:0006069 | ethanol oxidation(GO:0006069) |
| 0.8 | 1.5 | GO:0048627 | myoblast development(GO:0048627) |
| 0.8 | 4.5 | GO:0060244 | negative regulation of cell proliferation involved in contact inhibition(GO:0060244) |
| 0.8 | 4.5 | GO:0016601 | Rac protein signal transduction(GO:0016601) |
| 0.8 | 5.3 | GO:0051045 | negative regulation of membrane protein ectodomain proteolysis(GO:0051045) |
| 0.8 | 1.5 | GO:1902548 | negative regulation of cellular response to vascular endothelial growth factor stimulus(GO:1902548) |
| 0.7 | 2.2 | GO:1901052 | sarcosine metabolic process(GO:1901052) sarcosine catabolic process(GO:1901053) |
| 0.7 | 0.7 | GO:0050905 | neuromuscular process(GO:0050905) |
| 0.7 | 9.6 | GO:2000251 | positive regulation of actin cytoskeleton reorganization(GO:2000251) |
| 0.7 | 4.4 | GO:0043011 | myeloid dendritic cell differentiation(GO:0043011) |
| 0.7 | 4.4 | GO:0008272 | sulfate transport(GO:0008272) |
| 0.7 | 3.7 | GO:0042780 | tRNA 3'-end processing(GO:0042780) |
| 0.7 | 4.4 | GO:0035542 | regulation of SNARE complex assembly(GO:0035542) |
| 0.7 | 16.9 | GO:0007608 | sensory perception of smell(GO:0007608) |
| 0.7 | 2.2 | GO:1901165 | positive regulation of trophoblast cell migration(GO:1901165) |
| 0.7 | 1.5 | GO:0097466 | protein deglycosylation involved in glycoprotein catabolic process(GO:0035977) glycoprotein ERAD pathway(GO:0097466) mannose trimming involved in glycoprotein ERAD pathway(GO:1904382) response to glycoprotein(GO:1904587) |
| 0.7 | 27.7 | GO:0015701 | bicarbonate transport(GO:0015701) |
| 0.7 | 2.9 | GO:0051005 | negative regulation of lipoprotein lipase activity(GO:0051005) |
| 0.7 | 2.9 | GO:0038194 | thyroid-stimulating hormone signaling pathway(GO:0038194) cellular response to glycoprotein(GO:1904588) cellular response to thyrotropin-releasing hormone(GO:1905229) |
| 0.7 | 2.9 | GO:0072402 | response to cell cycle checkpoint signaling(GO:0072396) response to DNA integrity checkpoint signaling(GO:0072402) response to DNA damage checkpoint signaling(GO:0072423) |
| 0.7 | 2.2 | GO:0001880 | Mullerian duct regression(GO:0001880) |
| 0.7 | 7.2 | GO:0032720 | negative regulation of tumor necrosis factor production(GO:0032720) negative regulation of tumor necrosis factor superfamily cytokine production(GO:1903556) |
| 0.7 | 3.6 | GO:0035457 | cellular response to interferon-alpha(GO:0035457) |
| 0.7 | 4.3 | GO:0046689 | response to mercury ion(GO:0046689) |
| 0.7 | 0.7 | GO:0051940 | regulation of dopamine uptake involved in synaptic transmission(GO:0051584) regulation of catecholamine uptake involved in synaptic transmission(GO:0051940) |
| 0.7 | 7.8 | GO:0017156 | calcium ion regulated exocytosis(GO:0017156) |
| 0.7 | 2.8 | GO:0045347 | negative regulation of MHC class II biosynthetic process(GO:0045347) |
| 0.7 | 4.2 | GO:2000427 | positive regulation of apoptotic cell clearance(GO:2000427) |
| 0.7 | 2.1 | GO:0030187 | melatonin metabolic process(GO:0030186) melatonin biosynthetic process(GO:0030187) |
| 0.7 | 2.1 | GO:0050428 | purine ribonucleoside bisphosphate biosynthetic process(GO:0034036) 3'-phosphoadenosine 5'-phosphosulfate biosynthetic process(GO:0050428) |
| 0.7 | 5.6 | GO:0021895 | cerebral cortex neuron differentiation(GO:0021895) |
| 0.7 | 0.7 | GO:0071372 | cellular response to follicle-stimulating hormone stimulus(GO:0071372) |
| 0.7 | 9.8 | GO:0046320 | regulation of fatty acid oxidation(GO:0046320) |
| 0.7 | 1.4 | GO:0072007 | mesangial cell differentiation(GO:0072007) glomerular mesangial cell differentiation(GO:0072008) kidney interstitial fibroblast differentiation(GO:0072071) |
| 0.7 | 0.7 | GO:0050720 | interleukin-1 beta biosynthetic process(GO:0050720) |
| 0.7 | 9.0 | GO:0052695 | cellular glucuronidation(GO:0052695) |
| 0.7 | 3.5 | GO:0021794 | thalamus development(GO:0021794) |
| 0.7 | 4.8 | GO:0032471 | negative regulation of endoplasmic reticulum calcium ion concentration(GO:0032471) |
| 0.7 | 2.1 | GO:0070633 | transepithelial transport(GO:0070633) |
| 0.7 | 9.0 | GO:1904152 | regulation of retrograde protein transport, ER to cytosol(GO:1904152) |
| 0.7 | 1.4 | GO:0014063 | negative regulation of serotonin secretion(GO:0014063) |
| 0.7 | 3.4 | GO:2001204 | regulation of osteoclast development(GO:2001204) |
| 0.7 | 7.5 | GO:0001759 | organ induction(GO:0001759) |
| 0.7 | 98.7 | GO:0007156 | homophilic cell adhesion via plasma membrane adhesion molecules(GO:0007156) |
| 0.7 | 6.1 | GO:0036124 | histone H3-K9 trimethylation(GO:0036124) |
| 0.7 | 2.7 | GO:0048304 | positive regulation of isotype switching to IgG isotypes(GO:0048304) |
| 0.7 | 1.3 | GO:0033129 | positive regulation of histone phosphorylation(GO:0033129) |
| 0.7 | 10.1 | GO:0006699 | bile acid biosynthetic process(GO:0006699) bile acid metabolic process(GO:0008206) |
| 0.7 | 2.0 | GO:0090073 | positive regulation of protein homodimerization activity(GO:0090073) |
| 0.7 | 0.7 | GO:0030104 | water homeostasis(GO:0030104) |
| 0.7 | 2.0 | GO:1905097 | regulation of guanyl-nucleotide exchange factor activity(GO:1905097) |
| 0.7 | 2.7 | GO:0070572 | positive regulation of neuron projection regeneration(GO:0070572) |
| 0.7 | 3.3 | GO:0019323 | pentose catabolic process(GO:0019323) |
| 0.7 | 7.3 | GO:0006930 | substrate-dependent cell migration, cell extension(GO:0006930) |
| 0.7 | 1.3 | GO:0006726 | eye pigment biosynthetic process(GO:0006726) eye pigment metabolic process(GO:0042441) pigment metabolic process involved in developmental pigmentation(GO:0043324) pigment metabolic process involved in pigmentation(GO:0043474) |
| 0.7 | 0.7 | GO:0060298 | positive regulation of sarcomere organization(GO:0060298) |
| 0.7 | 13.1 | GO:0008038 | neuron recognition(GO:0008038) |
| 0.7 | 2.6 | GO:0032494 | response to peptidoglycan(GO:0032494) |
| 0.7 | 2.0 | GO:0002027 | regulation of heart rate(GO:0002027) |
| 0.6 | 3.9 | GO:0070875 | positive regulation of glycogen metabolic process(GO:0070875) |
| 0.6 | 24.0 | GO:0051965 | positive regulation of synapse assembly(GO:0051965) |
| 0.6 | 10.4 | GO:0060512 | prostate gland morphogenesis(GO:0060512) |
| 0.6 | 2.6 | GO:0030643 | cellular phosphate ion homeostasis(GO:0030643) cellular trivalent inorganic anion homeostasis(GO:0072502) |
| 0.6 | 1.3 | GO:0010040 | response to iron(II) ion(GO:0010040) |
| 0.6 | 13.5 | GO:0022400 | regulation of rhodopsin mediated signaling pathway(GO:0022400) |
| 0.6 | 3.9 | GO:0006878 | cellular copper ion homeostasis(GO:0006878) |
| 0.6 | 1.3 | GO:0070459 | prolactin secretion(GO:0070459) |
| 0.6 | 1.3 | GO:0006883 | cellular sodium ion homeostasis(GO:0006883) |
| 0.6 | 6.4 | GO:0070884 | regulation of calcineurin-NFAT signaling cascade(GO:0070884) |
| 0.6 | 1.9 | GO:0016075 | rRNA catabolic process(GO:0016075) |
| 0.6 | 0.6 | GO:1902908 | regulation of melanosome transport(GO:1902908) regulation of melanosome organization(GO:1903056) |
| 0.6 | 17.0 | GO:0007214 | gamma-aminobutyric acid signaling pathway(GO:0007214) |
| 0.6 | 3.8 | GO:2001214 | positive regulation of vasculogenesis(GO:2001214) |
| 0.6 | 0.6 | GO:0032754 | positive regulation of interleukin-5 production(GO:0032754) |
| 0.6 | 8.1 | GO:0070306 | lens fiber cell differentiation(GO:0070306) |
| 0.6 | 0.6 | GO:0014074 | response to purine-containing compound(GO:0014074) |
| 0.6 | 1.2 | GO:0046885 | regulation of hormone biosynthetic process(GO:0046885) |
| 0.6 | 4.3 | GO:0008306 | associative learning(GO:0008306) |
| 0.6 | 7.3 | GO:0040019 | positive regulation of embryonic development(GO:0040019) |
| 0.6 | 8.5 | GO:0032292 | myelination in peripheral nervous system(GO:0022011) peripheral nervous system axon ensheathment(GO:0032292) |
| 0.6 | 1.2 | GO:0001957 | intramembranous ossification(GO:0001957) direct ossification(GO:0036072) |
| 0.6 | 4.8 | GO:0001542 | ovulation from ovarian follicle(GO:0001542) |
| 0.6 | 2.4 | GO:0000189 | MAPK import into nucleus(GO:0000189) |
| 0.6 | 1.8 | GO:0051044 | positive regulation of membrane protein ectodomain proteolysis(GO:0051044) |
| 0.6 | 3.0 | GO:0045078 | positive regulation of interferon-gamma biosynthetic process(GO:0045078) |
| 0.6 | 5.4 | GO:0071711 | basement membrane organization(GO:0071711) |
| 0.6 | 7.2 | GO:0000463 | maturation of LSU-rRNA from tricistronic rRNA transcript (SSU-rRNA, 5.8S rRNA, LSU-rRNA)(GO:0000463) |
| 0.6 | 3.0 | GO:0060754 | positive regulation of mast cell chemotaxis(GO:0060754) |
| 0.6 | 1.2 | GO:0022417 | protein maturation by protein folding(GO:0022417) |
| 0.6 | 3.0 | GO:0061088 | regulation of sequestering of zinc ion(GO:0061088) |
| 0.6 | 3.6 | GO:1904381 | Golgi apparatus mannose trimming(GO:1904381) |
| 0.6 | 5.9 | GO:0021954 | central nervous system neuron development(GO:0021954) |
| 0.6 | 1.2 | GO:0061113 | pancreas morphogenesis(GO:0061113) |
| 0.6 | 5.3 | GO:0046146 | tetrahydrobiopterin biosynthetic process(GO:0006729) tetrahydrobiopterin metabolic process(GO:0046146) |
| 0.6 | 1.8 | GO:0061053 | somite development(GO:0061053) |
| 0.6 | 1.8 | GO:1903033 | regulation of microtubule plus-end binding(GO:1903031) positive regulation of microtubule plus-end binding(GO:1903033) positive regulation of microtubule binding(GO:1904528) |
| 0.6 | 4.1 | GO:2000111 | positive regulation of macrophage apoptotic process(GO:2000111) |
| 0.6 | 5.3 | GO:0001867 | complement activation, lectin pathway(GO:0001867) |
| 0.6 | 4.1 | GO:0071625 | vocalization behavior(GO:0071625) |
| 0.6 | 7.0 | GO:0034472 | snRNA 3'-end processing(GO:0034472) |
| 0.6 | 1.7 | GO:0070092 | glucagon secretion(GO:0070091) regulation of glucagon secretion(GO:0070092) |
| 0.6 | 2.9 | GO:1902109 | negative regulation of mitochondrial membrane permeability involved in apoptotic process(GO:1902109) |
| 0.6 | 0.6 | GO:1900037 | regulation of cellular response to hypoxia(GO:1900037) |
| 0.6 | 2.3 | GO:0016998 | cell wall macromolecule catabolic process(GO:0016998) |
| 0.6 | 1.1 | GO:0042940 | D-amino acid transport(GO:0042940) |
| 0.6 | 3.4 | GO:0097354 | protein prenylation(GO:0018342) prenylation(GO:0097354) |
| 0.6 | 1.7 | GO:0032966 | negative regulation of collagen biosynthetic process(GO:0032966) positive regulation of MHC class II biosynthetic process(GO:0045348) |
| 0.6 | 8.8 | GO:0070830 | bicellular tight junction assembly(GO:0070830) |
| 0.5 | 1.6 | GO:0044537 | regulation of circulating fibrinogen levels(GO:0044537) |
| 0.5 | 1.6 | GO:0060282 | positive regulation of oocyte development(GO:0060282) |
| 0.5 | 3.8 | GO:0070986 | left/right axis specification(GO:0070986) |
| 0.5 | 8.2 | GO:0010863 | positive regulation of phospholipase C activity(GO:0010863) |
| 0.5 | 2.7 | GO:0010533 | regulation of activation of Janus kinase activity(GO:0010533) |
| 0.5 | 2.1 | GO:0014043 | negative regulation of neuron maturation(GO:0014043) |
| 0.5 | 4.3 | GO:0035878 | nail development(GO:0035878) |
| 0.5 | 1.6 | GO:0060509 | Type I pneumocyte differentiation(GO:0060509) |
| 0.5 | 2.1 | GO:1901162 | primary amino compound biosynthetic process(GO:1901162) |
| 0.5 | 6.4 | GO:0017121 | phospholipid scrambling(GO:0017121) |
| 0.5 | 0.5 | GO:0016056 | rhodopsin mediated signaling pathway(GO:0016056) |
| 0.5 | 6.9 | GO:0033234 | negative regulation of protein sumoylation(GO:0033234) |
| 0.5 | 1.6 | GO:0070166 | enamel mineralization(GO:0070166) |
| 0.5 | 2.1 | GO:2000617 | positive regulation of histone H3-K9 acetylation(GO:2000617) |
| 0.5 | 4.1 | GO:0001574 | ganglioside biosynthetic process(GO:0001574) |
| 0.5 | 1.5 | GO:0061056 | sclerotome development(GO:0061056) |
| 0.5 | 7.6 | GO:0090286 | cytoskeletal anchoring at nuclear membrane(GO:0090286) |
| 0.5 | 1.5 | GO:0052405 | negative regulation by host of symbiont molecular function(GO:0052405) |
| 0.5 | 1.5 | GO:0046021 | regulation of transcription from RNA polymerase II promoter, mitotic(GO:0046021) |
| 0.5 | 6.1 | GO:0032688 | negative regulation of interferon-beta production(GO:0032688) |
| 0.5 | 2.5 | GO:2000189 | positive regulation of cholesterol homeostasis(GO:2000189) |
| 0.5 | 2.0 | GO:0034505 | tooth mineralization(GO:0034505) |
| 0.5 | 7.5 | GO:0006020 | inositol metabolic process(GO:0006020) |
| 0.5 | 2.5 | GO:0033078 | extrathymic T cell differentiation(GO:0033078) |
| 0.5 | 11.9 | GO:0010039 | response to iron ion(GO:0010039) |
| 0.5 | 6.4 | GO:1903859 | regulation of dendrite extension(GO:1903859) positive regulation of dendrite extension(GO:1903861) |
| 0.5 | 3.9 | GO:0003009 | skeletal muscle contraction(GO:0003009) |
| 0.5 | 5.4 | GO:0007340 | acrosome reaction(GO:0007340) |
| 0.5 | 2.5 | GO:0051574 | positive regulation of histone H3-K9 methylation(GO:0051574) |
| 0.5 | 1.9 | GO:1904491 | protein localization to ciliary transition zone(GO:1904491) |
| 0.5 | 7.3 | GO:0009312 | oligosaccharide biosynthetic process(GO:0009312) |
| 0.5 | 1.5 | GO:0021563 | glossopharyngeal nerve development(GO:0021563) glossopharyngeal nerve morphogenesis(GO:0021615) |
| 0.5 | 3.4 | GO:0002115 | store-operated calcium entry(GO:0002115) |
| 0.5 | 9.7 | GO:0032012 | regulation of ARF protein signal transduction(GO:0032012) |
| 0.5 | 2.9 | GO:0046688 | response to copper ion(GO:0046688) |
| 0.5 | 3.9 | GO:2000766 | negative regulation of cytoplasmic translation(GO:2000766) |
| 0.5 | 14.8 | GO:0050885 | neuromuscular process controlling balance(GO:0050885) |
| 0.5 | 1.4 | GO:0009304 | tRNA transcription(GO:0009304) |
| 0.5 | 3.8 | GO:0036066 | protein O-linked fucosylation(GO:0036066) |
| 0.5 | 7.1 | GO:0042104 | positive regulation of activated T cell proliferation(GO:0042104) |
| 0.5 | 1.4 | GO:0042182 | ketone catabolic process(GO:0042182) |
| 0.5 | 0.9 | GO:2000977 | regulation of primitive erythrocyte differentiation(GO:0010725) eosinophil fate commitment(GO:0035854) primitive erythrocyte differentiation(GO:0060319) regulation of forebrain neuron differentiation(GO:2000977) |
| 0.5 | 0.9 | GO:0043950 | positive regulation of cAMP-mediated signaling(GO:0043950) |
| 0.5 | 2.8 | GO:0032288 | myelin assembly(GO:0032288) |
| 0.5 | 1.4 | GO:0032233 | positive regulation of actin filament bundle assembly(GO:0032233) |
| 0.5 | 1.4 | GO:0003406 | retinal pigment epithelium development(GO:0003406) |
| 0.5 | 3.2 | GO:0043649 | dicarboxylic acid catabolic process(GO:0043649) |
| 0.5 | 3.2 | GO:1904467 | regulation of tumor necrosis factor secretion(GO:1904467) positive regulation of tumor necrosis factor secretion(GO:1904469) tumor necrosis factor secretion(GO:1990774) |
| 0.5 | 1.8 | GO:0034334 | adherens junction maintenance(GO:0034334) |
| 0.5 | 6.9 | GO:0043046 | DNA methylation involved in gamete generation(GO:0043046) |
| 0.5 | 1.4 | GO:0010543 | regulation of platelet activation(GO:0010543) |
| 0.5 | 0.9 | GO:0007217 | tachykinin receptor signaling pathway(GO:0007217) |
| 0.5 | 4.1 | GO:0014029 | neural crest formation(GO:0014029) |
| 0.5 | 3.6 | GO:0060732 | positive regulation of inositol phosphate biosynthetic process(GO:0060732) |
| 0.5 | 4.5 | GO:2000169 | negative regulation of peptidyl-cysteine S-nitrosylation(GO:1902083) regulation of peptidyl-cysteine S-nitrosylation(GO:2000169) |
| 0.5 | 3.6 | GO:0032482 | Rab protein signal transduction(GO:0032482) |
| 0.4 | 7.6 | GO:0007157 | heterophilic cell-cell adhesion via plasma membrane cell adhesion molecules(GO:0007157) |
| 0.4 | 12.5 | GO:0019226 | transmission of nerve impulse(GO:0019226) |
| 0.4 | 5.8 | GO:0006700 | C21-steroid hormone biosynthetic process(GO:0006700) |
| 0.4 | 0.4 | GO:1903626 | positive regulation of apoptotic DNA fragmentation(GO:1902512) positive regulation of DNA catabolic process(GO:1903626) |
| 0.4 | 7.1 | GO:0006743 | ubiquinone metabolic process(GO:0006743) ubiquinone biosynthetic process(GO:0006744) quinone biosynthetic process(GO:1901663) |
| 0.4 | 8.3 | GO:0070498 | interleukin-1-mediated signaling pathway(GO:0070498) |
| 0.4 | 1.3 | GO:0043587 | tongue morphogenesis(GO:0043587) |
| 0.4 | 8.7 | GO:0000732 | strand displacement(GO:0000732) |
| 0.4 | 3.5 | GO:0007141 | male meiosis I(GO:0007141) |
| 0.4 | 0.9 | GO:0002775 | antimicrobial peptide production(GO:0002775) antibacterial peptide production(GO:0002778) |
| 0.4 | 2.6 | GO:0038095 | Fc-epsilon receptor signaling pathway(GO:0038095) |
| 0.4 | 3.4 | GO:0007196 | adenylate cyclase-inhibiting G-protein coupled glutamate receptor signaling pathway(GO:0007196) |
| 0.4 | 1.7 | GO:0016322 | neuron remodeling(GO:0016322) |
| 0.4 | 2.5 | GO:0007256 | activation of JNKK activity(GO:0007256) |
| 0.4 | 2.1 | GO:0046512 | diol biosynthetic process(GO:0034312) sphingosine biosynthetic process(GO:0046512) sphingoid biosynthetic process(GO:0046520) |
| 0.4 | 1.7 | GO:0042135 | neurotransmitter catabolic process(GO:0042135) |
| 0.4 | 2.9 | GO:0010717 | regulation of epithelial to mesenchymal transition(GO:0010717) |
| 0.4 | 10.4 | GO:0060216 | definitive hemopoiesis(GO:0060216) |
| 0.4 | 4.1 | GO:0000038 | very long-chain fatty acid metabolic process(GO:0000038) |
| 0.4 | 5.4 | GO:0007250 | activation of NF-kappaB-inducing kinase activity(GO:0007250) |
| 0.4 | 2.8 | GO:0045023 | G0 to G1 transition(GO:0045023) |
| 0.4 | 3.7 | GO:0006853 | carnitine shuttle(GO:0006853) carnitine transmembrane transport(GO:1902603) |
| 0.4 | 4.5 | GO:1903963 | arachidonic acid secretion(GO:0050482) arachidonate transport(GO:1903963) |
| 0.4 | 10.1 | GO:0010107 | potassium ion import(GO:0010107) |
| 0.4 | 1.6 | GO:0008090 | retrograde axonal transport(GO:0008090) |
| 0.4 | 12.1 | GO:0042073 | intraciliary transport(GO:0042073) |
| 0.4 | 8.8 | GO:0070207 | protein homotrimerization(GO:0070207) |
| 0.4 | 3.2 | GO:0097484 | dendrite extension(GO:0097484) |
| 0.4 | 2.0 | GO:0048484 | enteric nervous system development(GO:0048484) |
| 0.4 | 10.0 | GO:0045773 | positive regulation of axon extension(GO:0045773) |
| 0.4 | 2.8 | GO:0051647 | nucleus localization(GO:0051647) |
| 0.4 | 10.2 | GO:0051131 | chaperone-mediated protein complex assembly(GO:0051131) |
| 0.4 | 8.6 | GO:0071108 | protein K48-linked deubiquitination(GO:0071108) |
| 0.4 | 3.9 | GO:0035728 | response to hepatocyte growth factor(GO:0035728) |
| 0.4 | 0.4 | GO:0015791 | polyol transport(GO:0015791) |
| 0.4 | 6.2 | GO:2001238 | positive regulation of extrinsic apoptotic signaling pathway(GO:2001238) |
| 0.4 | 6.6 | GO:0007194 | negative regulation of adenylate cyclase activity(GO:0007194) |
| 0.4 | 3.1 | GO:1900047 | negative regulation of blood coagulation(GO:0030195) negative regulation of hemostasis(GO:1900047) |
| 0.4 | 13.9 | GO:0046949 | fatty-acyl-CoA biosynthetic process(GO:0046949) |
| 0.4 | 0.8 | GO:0007600 | sensory perception(GO:0007600) |
| 0.4 | 2.3 | GO:0006196 | AMP catabolic process(GO:0006196) |
| 0.4 | 1.1 | GO:0072017 | distal tubule development(GO:0072017) |
| 0.4 | 0.8 | GO:0035655 | interleukin-18-mediated signaling pathway(GO:0035655) cellular response to interleukin-18(GO:0071351) |
| 0.4 | 2.6 | GO:0061734 | parkin-mediated mitophagy in response to mitochondrial depolarization(GO:0061734) |
| 0.4 | 3.3 | GO:0006636 | unsaturated fatty acid biosynthetic process(GO:0006636) |
| 0.4 | 2.2 | GO:2000781 | positive regulation of double-strand break repair(GO:2000781) |
| 0.4 | 1.1 | GO:0019626 | short-chain fatty acid catabolic process(GO:0019626) |
| 0.4 | 1.1 | GO:0038172 | interleukin-33-mediated signaling pathway(GO:0038172) |
| 0.4 | 5.9 | GO:0006884 | cell volume homeostasis(GO:0006884) |
| 0.4 | 1.8 | GO:0009948 | anterior/posterior axis specification(GO:0009948) |
| 0.4 | 1.8 | GO:0017085 | response to insecticide(GO:0017085) |
| 0.4 | 2.6 | GO:0016264 | gap junction assembly(GO:0016264) |
| 0.4 | 15.7 | GO:0001523 | retinoid metabolic process(GO:0001523) |
| 0.4 | 4.0 | GO:0030277 | maintenance of gastrointestinal epithelium(GO:0030277) |
| 0.4 | 0.7 | GO:0072709 | cellular response to sorbitol(GO:0072709) |
| 0.4 | 1.1 | GO:0050732 | negative regulation of peptidyl-tyrosine phosphorylation(GO:0050732) |
| 0.4 | 2.5 | GO:0051895 | negative regulation of focal adhesion assembly(GO:0051895) |
| 0.4 | 30.9 | GO:0007586 | digestion(GO:0007586) |
| 0.4 | 1.4 | GO:0038030 | non-canonical Wnt signaling pathway via MAPK cascade(GO:0038030) non-canonical Wnt signaling pathway via JNK cascade(GO:0038031) |
| 0.4 | 4.3 | GO:0006825 | copper ion transport(GO:0006825) |
| 0.4 | 1.8 | GO:0009957 | epidermal cell fate specification(GO:0009957) |
| 0.4 | 2.8 | GO:0048265 | response to pain(GO:0048265) |
| 0.4 | 1.4 | GO:0006837 | serotonin transport(GO:0006837) |
| 0.4 | 4.2 | GO:0031573 | intra-S DNA damage checkpoint(GO:0031573) |
| 0.4 | 5.3 | GO:0046069 | cGMP catabolic process(GO:0046069) |
| 0.3 | 3.1 | GO:0031665 | negative regulation of lipopolysaccharide-mediated signaling pathway(GO:0031665) |
| 0.3 | 1.0 | GO:0036155 | acylglycerol acyl-chain remodeling(GO:0036155) |
| 0.3 | 0.3 | GO:0032536 | regulation of cell projection size(GO:0032536) |
| 0.3 | 2.4 | GO:0070995 | NADPH oxidation(GO:0070995) |
| 0.3 | 3.1 | GO:0032534 | regulation of microvillus assembly(GO:0032534) |
| 0.3 | 5.8 | GO:0044458 | motile cilium assembly(GO:0044458) |
| 0.3 | 0.7 | GO:0071798 | response to prostaglandin D(GO:0071798) cellular response to prostaglandin D stimulus(GO:0071799) |
| 0.3 | 2.4 | GO:2001013 | epithelial cell proliferation involved in renal tubule morphogenesis(GO:2001013) |
| 0.3 | 14.0 | GO:0007218 | neuropeptide signaling pathway(GO:0007218) |
| 0.3 | 2.0 | GO:2000009 | negative regulation of protein localization to cell surface(GO:2000009) |
| 0.3 | 5.8 | GO:2000479 | regulation of cAMP-dependent protein kinase activity(GO:2000479) |
| 0.3 | 0.7 | GO:0010455 | positive regulation of cell fate commitment(GO:0010455) |
| 0.3 | 1.3 | GO:0032527 | protein exit from endoplasmic reticulum(GO:0032527) |
| 0.3 | 4.7 | GO:0050982 | detection of mechanical stimulus(GO:0050982) |
| 0.3 | 8.0 | GO:0015012 | heparan sulfate proteoglycan biosynthetic process(GO:0015012) |
| 0.3 | 4.3 | GO:0010719 | negative regulation of epithelial to mesenchymal transition(GO:0010719) |
| 0.3 | 7.9 | GO:0090503 | RNA phosphodiester bond hydrolysis, exonucleolytic(GO:0090503) |
| 0.3 | 5.9 | GO:0034113 | heterotypic cell-cell adhesion(GO:0034113) |
| 0.3 | 3.6 | GO:0060291 | long-term synaptic potentiation(GO:0060291) |
| 0.3 | 2.6 | GO:0070935 | 3'-UTR-mediated mRNA stabilization(GO:0070935) |
| 0.3 | 1.6 | GO:0060215 | primitive hemopoiesis(GO:0060215) |
| 0.3 | 5.5 | GO:0019731 | antibacterial humoral response(GO:0019731) |
| 0.3 | 1.6 | GO:0046855 | inositol phosphate dephosphorylation(GO:0046855) inositol phosphate catabolic process(GO:0071545) |
| 0.3 | 2.6 | GO:0045662 | negative regulation of myoblast differentiation(GO:0045662) |
| 0.3 | 19.1 | GO:0070098 | chemokine-mediated signaling pathway(GO:0070098) |
| 0.3 | 20.0 | GO:0031338 | regulation of vesicle fusion(GO:0031338) |
| 0.3 | 11.4 | GO:0006633 | fatty acid biosynthetic process(GO:0006633) |
| 0.3 | 1.3 | GO:0035690 | cellular response to drug(GO:0035690) |
| 0.3 | 5.0 | GO:0034389 | lipid particle organization(GO:0034389) |
| 0.3 | 2.2 | GO:0001573 | ganglioside metabolic process(GO:0001573) |
| 0.3 | 0.9 | GO:0048840 | otolith development(GO:0048840) |
| 0.3 | 4.3 | GO:0016486 | peptide hormone processing(GO:0016486) |
| 0.3 | 2.5 | GO:0006312 | mitotic recombination(GO:0006312) |
| 0.3 | 8.3 | GO:0042733 | embryonic digit morphogenesis(GO:0042733) |
| 0.3 | 1.8 | GO:0007512 | adult heart development(GO:0007512) |
| 0.3 | 6.1 | GO:0006895 | Golgi to endosome transport(GO:0006895) |
| 0.3 | 1.8 | GO:0098532 | histone H3-K27 trimethylation(GO:0098532) |
| 0.3 | 0.3 | GO:0003418 | chondrocyte differentiation involved in endochondral bone morphogenesis(GO:0003413) growth plate cartilage chondrocyte differentiation(GO:0003418) chondrocyte development involved in endochondral bone morphogenesis(GO:0003433) |
| 0.3 | 1.2 | GO:0051004 | regulation of lipoprotein lipase activity(GO:0051004) |
| 0.3 | 2.1 | GO:0044381 | glucose import in response to insulin stimulus(GO:0044381) |
| 0.3 | 1.5 | GO:0051973 | positive regulation of telomerase activity(GO:0051973) |
| 0.3 | 3.5 | GO:0035272 | exocrine system development(GO:0035272) |
| 0.3 | 0.6 | GO:0090080 | positive regulation of MAPKKK cascade by fibroblast growth factor receptor signaling pathway(GO:0090080) |
| 0.3 | 1.7 | GO:1900748 | positive regulation of vascular endothelial growth factor signaling pathway(GO:1900748) |
| 0.3 | 7.6 | GO:0019233 | sensory perception of pain(GO:0019233) |
| 0.3 | 1.1 | GO:0043696 | dedifferentiation(GO:0043696) cell dedifferentiation(GO:0043697) |
| 0.3 | 9.4 | GO:0007339 | binding of sperm to zona pellucida(GO:0007339) |
| 0.3 | 1.4 | GO:0031119 | tRNA pseudouridine synthesis(GO:0031119) |
| 0.3 | 3.1 | GO:0099517 | anterograde synaptic vesicle transport(GO:0048490) synaptic vesicle cytoskeletal transport(GO:0099514) synaptic vesicle transport along microtubule(GO:0099517) |
| 0.3 | 1.1 | GO:0042554 | superoxide anion generation(GO:0042554) |
| 0.3 | 5.6 | GO:0016254 | preassembly of GPI anchor in ER membrane(GO:0016254) |
| 0.3 | 0.3 | GO:0070673 | response to interleukin-18(GO:0070673) |
| 0.3 | 1.4 | GO:0015824 | proline transport(GO:0015824) |
| 0.3 | 2.7 | GO:0035115 | embryonic forelimb morphogenesis(GO:0035115) |
| 0.3 | 2.7 | GO:0030199 | collagen fibril organization(GO:0030199) |
| 0.3 | 0.5 | GO:0060547 | negative regulation of necroptotic process(GO:0060546) negative regulation of necrotic cell death(GO:0060547) |
| 0.3 | 0.3 | GO:0051024 | positive regulation of immunoglobulin secretion(GO:0051024) |
| 0.3 | 17.0 | GO:1903825 | organic acid transmembrane transport(GO:1903825) |
| 0.3 | 3.7 | GO:0003298 | physiological muscle hypertrophy(GO:0003298) physiological cardiac muscle hypertrophy(GO:0003301) cell growth involved in cardiac muscle cell development(GO:0061049) |
| 0.3 | 1.3 | GO:0002024 | diet induced thermogenesis(GO:0002024) |
| 0.3 | 1.1 | GO:0060644 | mammary gland epithelial cell differentiation(GO:0060644) |
| 0.3 | 0.8 | GO:0007606 | sensory perception of chemical stimulus(GO:0007606) |
| 0.3 | 5.4 | GO:0007416 | synapse assembly(GO:0007416) |
| 0.3 | 2.6 | GO:0048003 | antigen processing and presentation of lipid antigen via MHC class Ib(GO:0048003) antigen processing and presentation, exogenous lipid antigen via MHC class Ib(GO:0048007) |
| 0.3 | 2.8 | GO:2000300 | regulation of synaptic vesicle exocytosis(GO:2000300) |
| 0.3 | 3.1 | GO:0030208 | dermatan sulfate biosynthetic process(GO:0030208) |
| 0.3 | 0.8 | GO:0048312 | intracellular distribution of mitochondria(GO:0048312) |
| 0.2 | 2.2 | GO:0090313 | regulation of protein targeting to membrane(GO:0090313) positive regulation of protein targeting to membrane(GO:0090314) |
| 0.2 | 18.7 | GO:0046854 | phosphatidylinositol phosphorylation(GO:0046854) |
| 0.2 | 3.7 | GO:0035235 | ionotropic glutamate receptor signaling pathway(GO:0035235) |
| 0.2 | 6.1 | GO:0060765 | regulation of androgen receptor signaling pathway(GO:0060765) |
| 0.2 | 0.7 | GO:0042414 | epinephrine metabolic process(GO:0042414) |
| 0.2 | 1.2 | GO:1901223 | negative regulation of NIK/NF-kappaB signaling(GO:1901223) |
| 0.2 | 1.0 | GO:0042551 | neuron maturation(GO:0042551) |
| 0.2 | 1.9 | GO:0050852 | T cell receptor signaling pathway(GO:0050852) |
| 0.2 | 8.5 | GO:0016266 | O-glycan processing(GO:0016266) |
| 0.2 | 12.0 | GO:0044243 | multicellular organism catabolic process(GO:0044243) |
| 0.2 | 2.3 | GO:0009887 | organ morphogenesis(GO:0009887) |
| 0.2 | 2.1 | GO:0046950 | cellular ketone body metabolic process(GO:0046950) |
| 0.2 | 0.7 | GO:0021904 | dorsal/ventral neural tube patterning(GO:0021904) |
| 0.2 | 3.3 | GO:0030166 | proteoglycan biosynthetic process(GO:0030166) |
| 0.2 | 0.2 | GO:0072348 | sulfur compound transport(GO:0072348) |
| 0.2 | 0.5 | GO:0060586 | multicellular organismal iron ion homeostasis(GO:0060586) |
| 0.2 | 0.9 | GO:1904262 | negative regulation of TORC1 signaling(GO:1904262) |
| 0.2 | 6.9 | GO:0000272 | polysaccharide catabolic process(GO:0000272) |
| 0.2 | 6.2 | GO:0009081 | branched-chain amino acid metabolic process(GO:0009081) |
| 0.2 | 0.9 | GO:0050770 | regulation of axonogenesis(GO:0050770) |
| 0.2 | 1.4 | GO:0071526 | semaphorin-plexin signaling pathway(GO:0071526) |
| 0.2 | 2.2 | GO:0042417 | dopamine metabolic process(GO:0042417) |
| 0.2 | 0.7 | GO:0001555 | oocyte growth(GO:0001555) |
| 0.2 | 1.7 | GO:0072540 | T-helper 17 cell lineage commitment(GO:0072540) |
| 0.2 | 0.9 | GO:0032689 | negative regulation of interferon-gamma production(GO:0032689) |
| 0.2 | 1.5 | GO:0006685 | sphingomyelin catabolic process(GO:0006685) |
| 0.2 | 1.0 | GO:0030213 | hyaluronan biosynthetic process(GO:0030213) |
| 0.2 | 3.8 | GO:0046579 | positive regulation of Ras protein signal transduction(GO:0046579) |
| 0.2 | 1.0 | GO:0010470 | regulation of gastrulation(GO:0010470) |
| 0.2 | 3.2 | GO:0007602 | phototransduction(GO:0007602) |
| 0.2 | 1.2 | GO:0060707 | trophoblast giant cell differentiation(GO:0060707) |
| 0.2 | 1.6 | GO:1903025 | regulation of RNA polymerase II regulatory region sequence-specific DNA binding(GO:1903025) |
| 0.2 | 0.6 | GO:0032769 | negative regulation of monooxygenase activity(GO:0032769) |
| 0.2 | 0.4 | GO:0043605 | cellular amide catabolic process(GO:0043605) |
| 0.2 | 0.2 | GO:0045918 | negative regulation of cytolysis(GO:0045918) |
| 0.2 | 0.2 | GO:0019377 | glycolipid catabolic process(GO:0019377) |
| 0.2 | 1.9 | GO:0022401 | desensitization of G-protein coupled receptor protein signaling pathway(GO:0002029) negative adaptation of signaling pathway(GO:0022401) |
| 0.2 | 1.0 | GO:1902775 | mitochondrial ribosome assembly(GO:0061668) mitochondrial large ribosomal subunit assembly(GO:1902775) |
| 0.2 | 2.5 | GO:0007220 | Notch receptor processing(GO:0007220) |
| 0.2 | 4.5 | GO:0006953 | acute-phase response(GO:0006953) |
| 0.2 | 0.9 | GO:2000042 | negative regulation of double-strand break repair via homologous recombination(GO:2000042) |
| 0.2 | 1.1 | GO:1904350 | regulation of protein catabolic process in the vacuole(GO:1904350) positive regulation of protein catabolic process in the vacuole(GO:1904352) |
| 0.2 | 2.6 | GO:0007398 | ectoderm development(GO:0007398) |
| 0.2 | 2.0 | GO:0006023 | aminoglycan biosynthetic process(GO:0006023) glycosaminoglycan biosynthetic process(GO:0006024) |
| 0.2 | 1.1 | GO:0071396 | cellular response to lipid(GO:0071396) |
| 0.2 | 8.2 | GO:1902476 | chloride transmembrane transport(GO:1902476) |
| 0.2 | 0.5 | GO:0060708 | spongiotrophoblast differentiation(GO:0060708) |
| 0.2 | 0.7 | GO:0019896 | axonal transport of mitochondrion(GO:0019896) |
| 0.2 | 1.7 | GO:2001199 | negative regulation of dendritic cell differentiation(GO:2001199) |
| 0.2 | 0.9 | GO:0031112 | positive regulation of microtubule polymerization or depolymerization(GO:0031112) positive regulation of microtubule polymerization(GO:0031116) |
| 0.2 | 3.4 | GO:0060021 | palate development(GO:0060021) |
| 0.2 | 1.0 | GO:0000480 | endonucleolytic cleavage in 5'-ETS of tricistronic rRNA transcript (SSU-rRNA, 5.8S rRNA, LSU-rRNA)(GO:0000480) |
| 0.2 | 2.3 | GO:0070262 | peptidyl-serine dephosphorylation(GO:0070262) |
| 0.2 | 1.0 | GO:0030421 | defecation(GO:0030421) |
| 0.2 | 4.1 | GO:0080171 | lysosome organization(GO:0007040) lytic vacuole organization(GO:0080171) |
| 0.2 | 4.9 | GO:1904837 | beta-catenin-TCF complex assembly(GO:1904837) |
| 0.2 | 0.6 | GO:2000311 | regulation of alpha-amino-3-hydroxy-5-methyl-4-isoxazole propionate selective glutamate receptor activity(GO:2000311) |
| 0.2 | 3.7 | GO:0007224 | smoothened signaling pathway(GO:0007224) |
| 0.2 | 0.5 | GO:0006627 | protein processing involved in protein targeting to mitochondrion(GO:0006627) |
| 0.2 | 0.3 | GO:0032634 | interleukin-5 production(GO:0032634) regulation of interleukin-5 production(GO:0032674) |
| 0.2 | 0.5 | GO:2000535 | regulation of entry of bacterium into host cell(GO:2000535) |
| 0.2 | 0.6 | GO:0032516 | positive regulation of phosphoprotein phosphatase activity(GO:0032516) |
| 0.2 | 8.0 | GO:0010923 | negative regulation of phosphatase activity(GO:0010923) |
| 0.2 | 16.7 | GO:0043687 | post-translational protein modification(GO:0043687) |
| 0.1 | 1.9 | GO:0006473 | protein acetylation(GO:0006473) |
| 0.1 | 0.3 | GO:0002727 | natural killer cell cytokine production(GO:0002370) regulation of natural killer cell cytokine production(GO:0002727) |
| 0.1 | 0.4 | GO:0070206 | protein trimerization(GO:0070206) |
| 0.1 | 1.3 | GO:0006026 | aminoglycan catabolic process(GO:0006026) |
| 0.1 | 5.9 | GO:0006687 | glycosphingolipid metabolic process(GO:0006687) |
| 0.1 | 0.6 | GO:0010867 | positive regulation of triglyceride biosynthetic process(GO:0010867) |
| 0.1 | 1.2 | GO:0034394 | protein localization to cell surface(GO:0034394) |
| 0.1 | 1.6 | GO:0016246 | RNA interference(GO:0016246) |
| 0.1 | 4.7 | GO:0042445 | hormone metabolic process(GO:0042445) |
| 0.1 | 0.7 | GO:1903361 | protein localization to basolateral plasma membrane(GO:1903361) |
| 0.1 | 3.1 | GO:0032608 | interferon-beta production(GO:0032608) regulation of interferon-beta production(GO:0032648) |
| 0.1 | 0.4 | GO:1901350 | cell-cell signaling involved in cell-cell junction organization(GO:1901350) |
| 0.1 | 1.0 | GO:0032418 | lysosome localization(GO:0032418) |
| 0.1 | 1.0 | GO:0044342 | type B pancreatic cell proliferation(GO:0044342) |
| 0.1 | 0.8 | GO:2000178 | negative regulation of neural precursor cell proliferation(GO:2000178) |
| 0.1 | 3.1 | GO:0007368 | determination of left/right symmetry(GO:0007368) |
| 0.1 | 1.5 | GO:0030970 | retrograde protein transport, ER to cytosol(GO:0030970) |
| 0.1 | 0.8 | GO:0071028 | nuclear RNA surveillance(GO:0071027) nuclear mRNA surveillance(GO:0071028) |
| 0.1 | 0.8 | GO:0048635 | negative regulation of muscle organ development(GO:0048635) |
| 0.1 | 0.3 | GO:2000249 | regulation of actin cytoskeleton reorganization(GO:2000249) |
| 0.1 | 0.9 | GO:1903608 | protein localization to cytoplasmic stress granule(GO:1903608) |
| 0.1 | 1.4 | GO:0001541 | ovarian follicle development(GO:0001541) |
| 0.1 | 1.4 | GO:0002715 | regulation of natural killer cell mediated immunity(GO:0002715) |
| 0.1 | 0.2 | GO:1902231 | positive regulation of intrinsic apoptotic signaling pathway in response to DNA damage(GO:1902231) |
| 0.1 | 0.9 | GO:0061045 | negative regulation of wound healing(GO:0061045) |
| 0.1 | 1.8 | GO:0035914 | skeletal muscle cell differentiation(GO:0035914) |
| 0.1 | 0.4 | GO:0033173 | calcineurin-NFAT signaling cascade(GO:0033173) |
| 0.1 | 0.4 | GO:0003096 | renal sodium ion transport(GO:0003096) renal sodium ion absorption(GO:0070294) |
| 0.1 | 2.7 | GO:0044264 | cellular polysaccharide metabolic process(GO:0044264) |
| 0.1 | 1.8 | GO:0042475 | odontogenesis of dentin-containing tooth(GO:0042475) |
| 0.1 | 1.4 | GO:0007528 | neuromuscular junction development(GO:0007528) |
| 0.1 | 0.3 | GO:0006987 | activation of signaling protein activity involved in unfolded protein response(GO:0006987) |
| 0.1 | 0.6 | GO:1903800 | positive regulation of production of miRNAs involved in gene silencing by miRNA(GO:1903800) |
| 0.1 | 0.2 | GO:0090290 | positive regulation of osteoclast proliferation(GO:0090290) |
| 0.1 | 0.4 | GO:0035855 | megakaryocyte development(GO:0035855) |
| 0.1 | 1.3 | GO:0001945 | lymph vessel development(GO:0001945) |
| 0.1 | 0.4 | GO:0002501 | peptide antigen assembly with MHC protein complex(GO:0002501) |
| 0.1 | 1.7 | GO:0019933 | cAMP-mediated signaling(GO:0019933) |
| 0.1 | 0.8 | GO:0006004 | fucose metabolic process(GO:0006004) |
| 0.1 | 0.5 | GO:1904424 | regulation of GTP binding(GO:1904424) |
| 0.1 | 0.5 | GO:0046604 | positive regulation of mitotic centrosome separation(GO:0046604) |
| 0.1 | 1.1 | GO:0033141 | positive regulation of peptidyl-serine phosphorylation of STAT protein(GO:0033141) |
| 0.1 | 0.1 | GO:0045947 | negative regulation of translational initiation(GO:0045947) |
| 0.1 | 0.7 | GO:1901642 | nucleoside transmembrane transport(GO:1901642) |
| 0.1 | 1.9 | GO:0048384 | retinoic acid receptor signaling pathway(GO:0048384) |
| 0.1 | 1.4 | GO:0051058 | negative regulation of Ras protein signal transduction(GO:0046580) negative regulation of small GTPase mediated signal transduction(GO:0051058) |
| 0.1 | 0.3 | GO:0019852 | L-ascorbic acid metabolic process(GO:0019852) |
| 0.1 | 0.1 | GO:0070071 | proton-transporting two-sector ATPase complex assembly(GO:0070071) |
| 0.1 | 1.8 | GO:0006749 | glutathione metabolic process(GO:0006749) |
| 0.1 | 0.3 | GO:0050690 | regulation of defense response to virus by virus(GO:0050690) |
| 0.1 | 0.3 | GO:0006657 | CDP-choline pathway(GO:0006657) |
| 0.1 | 0.2 | GO:0035162 | embryonic hemopoiesis(GO:0035162) |
| 0.0 | 0.0 | GO:1903903 | regulation of establishment of T cell polarity(GO:1903903) |
| 0.0 | 0.5 | GO:0090051 | negative regulation of cell migration involved in sprouting angiogenesis(GO:0090051) negative regulation of sprouting angiogenesis(GO:1903671) |
| 0.0 | 0.5 | GO:0097178 | ruffle assembly(GO:0097178) |
| 0.0 | 0.1 | GO:0002101 | tRNA wobble cytosine modification(GO:0002101) |
| 0.0 | 0.2 | GO:0071398 | cellular response to fatty acid(GO:0071398) |
| 0.0 | 0.7 | GO:0007200 | phospholipase C-activating G-protein coupled receptor signaling pathway(GO:0007200) |
| 0.0 | 0.4 | GO:0032006 | regulation of TOR signaling(GO:0032006) |
| 0.0 | 2.0 | GO:0006501 | C-terminal protein lipidation(GO:0006501) |
| 0.0 | 0.2 | GO:0002089 | lens morphogenesis in camera-type eye(GO:0002089) |
| 0.0 | 0.1 | GO:0035176 | social behavior(GO:0035176) intraspecies interaction between organisms(GO:0051703) |
| 0.0 | 0.2 | GO:1904321 | response to forskolin(GO:1904321) cellular response to forskolin(GO:1904322) |
| 0.0 | 0.1 | GO:0032026 | response to magnesium ion(GO:0032026) |
| 0.0 | 0.6 | GO:0045747 | positive regulation of Notch signaling pathway(GO:0045747) |
| 0.0 | 0.7 | GO:0007212 | dopamine receptor signaling pathway(GO:0007212) |
| 0.0 | 0.1 | GO:0030513 | positive regulation of BMP signaling pathway(GO:0030513) |
| 0.0 | 0.1 | GO:0045654 | positive regulation of megakaryocyte differentiation(GO:0045654) |
| 0.0 | 0.4 | GO:0031167 | rRNA methylation(GO:0031167) |
| 0.0 | 0.2 | GO:0099515 | actin filament-based transport(GO:0099515) |
| 0.0 | 0.3 | GO:0045670 | regulation of osteoclast differentiation(GO:0045670) |
| 0.0 | 5.5 | GO:0048232 | spermatogenesis(GO:0007283) male gamete generation(GO:0048232) |
| 0.0 | 0.3 | GO:0046597 | negative regulation of viral entry into host cell(GO:0046597) |
| 0.0 | 0.1 | GO:0016242 | negative regulation of macroautophagy(GO:0016242) |
| 0.0 | 0.1 | GO:0010172 | embryonic body morphogenesis(GO:0010172) |
| 0.0 | 0.1 | GO:0003299 | muscle hypertrophy in response to stress(GO:0003299) cardiac muscle adaptation(GO:0014887) cardiac muscle hypertrophy in response to stress(GO:0014898) |
| 0.0 | 0.3 | GO:0030212 | hyaluronan metabolic process(GO:0030212) |
| 0.0 | 0.0 | GO:0007183 | SMAD protein complex assembly(GO:0007183) |
| 0.0 | 0.0 | GO:0032095 | regulation of response to food(GO:0032095) regulation of appetite(GO:0032098) |
Gene overrepresentation in cellular_component category:
| Log-likelihood per target | Total log-likelihood | Term | Description |
|---|---|---|---|
| 25.7 | 102.7 | GO:0031838 | haptoglobin-hemoglobin complex(GO:0031838) |
| 13.2 | 66.0 | GO:0060200 | clathrin-sculpted acetylcholine transport vesicle(GO:0060200) clathrin-sculpted acetylcholine transport vesicle membrane(GO:0060201) |
| 10.1 | 50.7 | GO:0001652 | granular component(GO:0001652) |
| 9.5 | 28.5 | GO:0020003 | symbiont-containing vacuole(GO:0020003) symbiont-containing vacuole membrane(GO:0020005) |
| 7.7 | 23.1 | GO:0097183 | protein C inhibitor-TMPRSS7 complex(GO:0036024) protein C inhibitor-TMPRSS11E complex(GO:0036025) protein C inhibitor-PLAT complex(GO:0036026) protein C inhibitor-PLAU complex(GO:0036027) protein C inhibitor-thrombin complex(GO:0036028) protein C inhibitor-KLK3 complex(GO:0036029) protein C inhibitor-plasma kallikrein complex(GO:0036030) serine protease inhibitor complex(GO:0097180) protein C inhibitor-coagulation factor V complex(GO:0097181) protein C inhibitor-coagulation factor Xa complex(GO:0097182) protein C inhibitor-coagulation factor XI complex(GO:0097183) |
| 7.1 | 21.4 | GO:0034365 | discoidal high-density lipoprotein particle(GO:0034365) |
| 6.7 | 20.2 | GO:0005608 | laminin-3 complex(GO:0005608) |
| 6.3 | 31.4 | GO:0005602 | complement component C1 complex(GO:0005602) |
| 6.1 | 97.8 | GO:0097418 | neurofibrillary tangle(GO:0097418) |
| 5.9 | 17.6 | GO:0072563 | endothelial microparticle(GO:0072563) |
| 5.5 | 16.5 | GO:0019008 | molybdopterin synthase complex(GO:0019008) |
| 5.3 | 63.6 | GO:0033010 | paranodal junction(GO:0033010) |
| 5.2 | 15.5 | GO:0044609 | DBIRD complex(GO:0044609) |
| 4.6 | 54.7 | GO:0005833 | hemoglobin complex(GO:0005833) |
| 4.5 | 72.6 | GO:0097512 | cardiac myofibril(GO:0097512) |
| 4.5 | 45.3 | GO:0043203 | axon hillock(GO:0043203) |
| 4.5 | 31.3 | GO:0043240 | Fanconi anaemia nuclear complex(GO:0043240) |
| 4.4 | 26.4 | GO:0031232 | extrinsic component of external side of plasma membrane(GO:0031232) |
| 4.3 | 21.6 | GO:0044352 | pinosome(GO:0044352) macropinosome(GO:0044354) |
| 4.3 | 12.8 | GO:0060053 | neurofilament cytoskeleton(GO:0060053) |
| 4.0 | 8.0 | GO:0034366 | spherical high-density lipoprotein particle(GO:0034366) |
| 3.9 | 11.8 | GO:0031515 | tRNA (m1A) methyltransferase complex(GO:0031515) |
| 3.9 | 11.7 | GO:0055028 | cortical microtubule(GO:0055028) mitotic spindle astral microtubule(GO:0061673) |
| 3.6 | 18.2 | GO:0048787 | presynaptic active zone membrane(GO:0048787) |
| 3.6 | 10.7 | GO:0060187 | cell pole(GO:0060187) |
| 3.5 | 17.7 | GO:0005947 | mitochondrial alpha-ketoglutarate dehydrogenase complex(GO:0005947) |
| 3.5 | 14.1 | GO:1990745 | EARP complex(GO:1990745) |
| 3.5 | 14.0 | GO:0016533 | cyclin-dependent protein kinase 5 holoenzyme complex(GO:0016533) |
| 3.5 | 10.5 | GO:0002139 | stereocilia coupling link(GO:0002139) |
| 3.4 | 17.1 | GO:0016012 | sarcoglycan complex(GO:0016012) |
| 3.3 | 50.1 | GO:0097386 | glial cell projection(GO:0097386) |
| 3.2 | 6.5 | GO:0043527 | tRNA methyltransferase complex(GO:0043527) |
| 3.2 | 12.8 | GO:0030485 | smooth muscle contractile fiber(GO:0030485) |
| 3.1 | 67.7 | GO:0042627 | chylomicron(GO:0042627) |
| 3.0 | 12.2 | GO:0030314 | junctional membrane complex(GO:0030314) |
| 3.0 | 12.0 | GO:0032777 | Piccolo NuA4 histone acetyltransferase complex(GO:0032777) |
| 3.0 | 41.7 | GO:0098647 | collagen type VI trimer(GO:0005589) collagen beaded filament(GO:0098647) |
| 2.9 | 8.7 | GO:0097489 | multivesicular body, internal vesicle lumen(GO:0097489) |
| 2.9 | 20.3 | GO:0097209 | epidermal lamellar body(GO:0097209) |
| 2.8 | 22.2 | GO:0005593 | FACIT collagen trimer(GO:0005593) |
| 2.8 | 27.5 | GO:0071953 | elastic fiber(GO:0071953) |
| 2.7 | 24.0 | GO:0098839 | postsynaptic density membrane(GO:0098839) |
| 2.6 | 34.1 | GO:0033270 | paranode region of axon(GO:0033270) |
| 2.6 | 20.5 | GO:0044279 | other organism cell membrane(GO:0044218) other organism membrane(GO:0044279) |
| 2.6 | 7.7 | GO:0098536 | deuterosome(GO:0098536) |
| 2.5 | 25.5 | GO:0097486 | multivesicular body lumen(GO:0097486) |
| 2.5 | 17.8 | GO:0036021 | endolysosome lumen(GO:0036021) |
| 2.5 | 25.4 | GO:0036454 | insulin-like growth factor binding protein complex(GO:0016942) growth factor complex(GO:0036454) |
| 2.5 | 22.8 | GO:0005964 | phosphorylase kinase complex(GO:0005964) |
| 2.4 | 31.3 | GO:0031089 | platelet dense granule lumen(GO:0031089) |
| 2.4 | 4.8 | GO:0034991 | nuclear meiotic cohesin complex(GO:0034991) |
| 2.4 | 19.0 | GO:0005672 | transcription factor TFIIA complex(GO:0005672) |
| 2.4 | 7.1 | GO:0099634 | postsynaptic specialization membrane(GO:0099634) |
| 2.2 | 8.8 | GO:0032144 | 4-aminobutyrate transaminase complex(GO:0032144) |
| 2.2 | 43.7 | GO:0005890 | sodium:potassium-exchanging ATPase complex(GO:0005890) |
| 2.2 | 17.3 | GO:0035976 | AP1 complex(GO:0035976) |
| 2.1 | 14.7 | GO:0098554 | cytoplasmic side of endoplasmic reticulum membrane(GO:0098554) |
| 2.1 | 6.3 | GO:0070695 | FHF complex(GO:0070695) |
| 2.1 | 6.2 | GO:0008282 | ATP-sensitive potassium channel complex(GO:0008282) |
| 2.0 | 8.0 | GO:0001917 | photoreceptor inner segment(GO:0001917) |
| 2.0 | 4.0 | GO:0044305 | calyx of Held(GO:0044305) |
| 2.0 | 4.0 | GO:0033655 | host cell cytoplasm(GO:0030430) host cell cytoplasm part(GO:0033655) |
| 2.0 | 11.8 | GO:0009331 | glycerol-3-phosphate dehydrogenase complex(GO:0009331) |
| 1.9 | 23.3 | GO:0033093 | Weibel-Palade body(GO:0033093) |
| 1.9 | 11.5 | GO:0032444 | activin responsive factor complex(GO:0032444) |
| 1.9 | 15.2 | GO:0005579 | membrane attack complex(GO:0005579) |
| 1.9 | 17.1 | GO:0034464 | BBSome(GO:0034464) |
| 1.9 | 18.8 | GO:0097197 | tetraspanin-enriched microdomain(GO:0097197) |
| 1.9 | 16.9 | GO:0042788 | polysomal ribosome(GO:0042788) |
| 1.9 | 7.5 | GO:0034673 | inhibin-betaglycan-ActRII complex(GO:0034673) |
| 1.8 | 14.7 | GO:0036157 | outer dynein arm(GO:0036157) |
| 1.8 | 45.8 | GO:0034451 | centriolar satellite(GO:0034451) |
| 1.8 | 28.4 | GO:0031362 | anchored component of external side of plasma membrane(GO:0031362) |
| 1.7 | 3.5 | GO:0005965 | protein farnesyltransferase complex(GO:0005965) |
| 1.7 | 19.1 | GO:0035686 | sperm fibrous sheath(GO:0035686) |
| 1.7 | 11.9 | GO:0072487 | MSL complex(GO:0072487) |
| 1.7 | 8.5 | GO:0098843 | postsynaptic endocytic zone(GO:0098843) |
| 1.7 | 8.5 | GO:0000801 | central element(GO:0000801) |
| 1.7 | 10.1 | GO:0070369 | beta-catenin-TCF7L2 complex(GO:0070369) |
| 1.7 | 9.9 | GO:0032807 | DNA ligase IV complex(GO:0032807) |
| 1.6 | 33.0 | GO:0005861 | troponin complex(GO:0005861) |
| 1.6 | 1.6 | GO:0090533 | cation-transporting ATPase complex(GO:0090533) |
| 1.6 | 9.7 | GO:0033018 | sarcoplasmic reticulum lumen(GO:0033018) |
| 1.6 | 11.3 | GO:0014802 | terminal cisterna(GO:0014802) |
| 1.6 | 6.4 | GO:0045179 | apical cortex(GO:0045179) |
| 1.6 | 9.6 | GO:0030991 | intraciliary transport particle A(GO:0030991) |
| 1.6 | 4.8 | GO:1990851 | Wnt-Frizzled-LRP5/6 complex(GO:1990851) |
| 1.6 | 9.5 | GO:1990682 | CSF1-CSF1R complex(GO:1990682) |
| 1.6 | 9.4 | GO:0002177 | manchette(GO:0002177) |
| 1.5 | 9.3 | GO:1990131 | EGO complex(GO:0034448) Gtr1-Gtr2 GTPase complex(GO:1990131) |
| 1.5 | 10.8 | GO:0070852 | cell body fiber(GO:0070852) |
| 1.5 | 7.6 | GO:0000235 | astral microtubule(GO:0000235) aster(GO:0005818) |
| 1.5 | 4.5 | GO:0065010 | extracellular membrane-bounded organelle(GO:0065010) |
| 1.5 | 12.0 | GO:0033017 | sarcoplasmic reticulum membrane(GO:0033017) |
| 1.5 | 5.9 | GO:0071062 | alphav-beta3 integrin-vitronectin complex(GO:0071062) |
| 1.5 | 4.4 | GO:0005652 | nuclear lamina(GO:0005652) |
| 1.4 | 7.2 | GO:1990761 | growth cone lamellipodium(GO:1990761) |
| 1.4 | 5.7 | GO:0038038 | G-protein coupled receptor homodimeric complex(GO:0038038) |
| 1.4 | 8.5 | GO:0097014 | axoneme(GO:0005930) ciliary plasm(GO:0097014) |
| 1.4 | 25.2 | GO:0005952 | cAMP-dependent protein kinase complex(GO:0005952) |
| 1.4 | 1.4 | GO:0002081 | outer acrosomal membrane(GO:0002081) |
| 1.4 | 22.3 | GO:0043218 | compact myelin(GO:0043218) |
| 1.4 | 6.9 | GO:0070847 | core mediator complex(GO:0070847) |
| 1.4 | 4.2 | GO:0000818 | nuclear MIS12/MIND complex(GO:0000818) |
| 1.4 | 4.1 | GO:0019012 | virion(GO:0019012) virion part(GO:0044423) |
| 1.4 | 10.9 | GO:0090576 | RNA polymerase III transcription factor complex(GO:0090576) |
| 1.3 | 5.3 | GO:0043293 | apoptosome(GO:0043293) |
| 1.3 | 20.0 | GO:0030478 | actin cap(GO:0030478) |
| 1.3 | 8.0 | GO:0072687 | meiotic spindle(GO:0072687) |
| 1.3 | 4.0 | GO:0002945 | cyclin K-CDK13 complex(GO:0002945) |
| 1.3 | 47.6 | GO:0005859 | muscle myosin complex(GO:0005859) |
| 1.3 | 6.6 | GO:0071797 | LUBAC complex(GO:0071797) |
| 1.3 | 13.8 | GO:0060077 | inhibitory synapse(GO:0060077) |
| 1.2 | 21.2 | GO:0046658 | anchored component of plasma membrane(GO:0046658) |
| 1.2 | 22.4 | GO:0031235 | intrinsic component of the cytoplasmic side of the plasma membrane(GO:0031235) |
| 1.2 | 7.4 | GO:0097442 | CA3 pyramidal cell dendrite(GO:0097442) |
| 1.2 | 98.3 | GO:0099501 | synaptic vesicle membrane(GO:0030672) exocytic vesicle membrane(GO:0099501) |
| 1.2 | 8.4 | GO:0034385 | very-low-density lipoprotein particle(GO:0034361) triglyceride-rich lipoprotein particle(GO:0034385) |
| 1.2 | 4.8 | GO:1990604 | IRE1-TRAF2-ASK1 complex(GO:1990604) |
| 1.2 | 14.1 | GO:0098643 | fibrillar collagen trimer(GO:0005583) banded collagen fibril(GO:0098643) |
| 1.2 | 1.2 | GO:0032839 | dendrite cytoplasm(GO:0032839) |
| 1.2 | 7.0 | GO:0032391 | photoreceptor connecting cilium(GO:0032391) |
| 1.2 | 12.8 | GO:0002116 | semaphorin receptor complex(GO:0002116) |
| 1.2 | 18.5 | GO:0042622 | photoreceptor outer segment membrane(GO:0042622) |
| 1.1 | 3.4 | GO:0034666 | integrin alpha2-beta1 complex(GO:0034666) |
| 1.1 | 8.0 | GO:0000813 | ESCRT I complex(GO:0000813) |
| 1.1 | 10.1 | GO:0016013 | syntrophin complex(GO:0016013) |
| 1.1 | 5.6 | GO:0071546 | perinucleolar chromocenter(GO:0010370) pi-body(GO:0071546) |
| 1.1 | 12.2 | GO:0034992 | microtubule organizing center attachment site(GO:0034992) LINC complex(GO:0034993) |
| 1.1 | 5.5 | GO:0032593 | insulin-responsive compartment(GO:0032593) |
| 1.1 | 6.6 | GO:1990316 | ATG1/ULK1 kinase complex(GO:1990316) |
| 1.1 | 15.4 | GO:0097227 | sperm annulus(GO:0097227) |
| 1.1 | 3.3 | GO:0071748 | IgA immunoglobulin complex(GO:0071745) IgA immunoglobulin complex, circulating(GO:0071746) monomeric IgA immunoglobulin complex(GO:0071748) polymeric IgA immunoglobulin complex(GO:0071749) secretory IgA immunoglobulin complex(GO:0071751) |
| 1.1 | 4.4 | GO:0005899 | insulin receptor complex(GO:0005899) |
| 1.1 | 6.5 | GO:0042406 | extrinsic component of endoplasmic reticulum membrane(GO:0042406) |
| 1.1 | 11.9 | GO:0030123 | AP-3 adaptor complex(GO:0030123) |
| 1.1 | 11.9 | GO:0031083 | BLOC-1 complex(GO:0031083) |
| 1.1 | 3.2 | GO:0005883 | neurofilament(GO:0005883) |
| 1.1 | 3.2 | GO:0038039 | G-protein coupled receptor heterodimeric complex(GO:0038039) |
| 1.1 | 32.1 | GO:0005921 | gap junction(GO:0005921) |
| 1.1 | 29.8 | GO:0005865 | striated muscle thin filament(GO:0005865) |
| 1.1 | 10.6 | GO:0032045 | guanyl-nucleotide exchange factor complex(GO:0032045) |
| 1.1 | 26.4 | GO:0008074 | guanylate cyclase complex, soluble(GO:0008074) |
| 1.1 | 14.7 | GO:0000788 | nuclear nucleosome(GO:0000788) |
| 1.0 | 4.2 | GO:0033263 | CORVET complex(GO:0033263) |
| 1.0 | 20.7 | GO:0001527 | microfibril(GO:0001527) fibril(GO:0043205) |
| 1.0 | 58.0 | GO:0005782 | peroxisomal matrix(GO:0005782) microbody lumen(GO:0031907) |
| 1.0 | 4.1 | GO:0070821 | tertiary granule membrane(GO:0070821) |
| 1.0 | 41.3 | GO:0032590 | dendrite membrane(GO:0032590) |
| 1.0 | 7.2 | GO:1990635 | proximal dendrite(GO:1990635) |
| 1.0 | 17.4 | GO:0032281 | AMPA glutamate receptor complex(GO:0032281) |
| 1.0 | 12.3 | GO:0036038 | MKS complex(GO:0036038) |
| 1.0 | 14.2 | GO:0097440 | apical dendrite(GO:0097440) |
| 1.0 | 71.2 | GO:0005796 | Golgi lumen(GO:0005796) |
| 1.0 | 6.0 | GO:0097208 | alveolar lamellar body(GO:0097208) |
| 1.0 | 3.0 | GO:0005953 | CAAX-protein geranylgeranyltransferase complex(GO:0005953) |
| 1.0 | 7.8 | GO:0043196 | varicosity(GO:0043196) |
| 1.0 | 9.6 | GO:0005614 | interstitial matrix(GO:0005614) |
| 1.0 | 4.8 | GO:0000836 | Hrd1p ubiquitin ligase complex(GO:0000836) |
| 1.0 | 49.8 | GO:0001533 | cornified envelope(GO:0001533) |
| 1.0 | 8.6 | GO:0000800 | lateral element(GO:0000800) |
| 1.0 | 32.4 | GO:0070382 | exocytic vesicle(GO:0070382) |
| 0.9 | 5.5 | GO:0043083 | synaptic cleft(GO:0043083) |
| 0.9 | 53.4 | GO:0005581 | collagen trimer(GO:0005581) |
| 0.9 | 1.8 | GO:0005889 | hydrogen:potassium-exchanging ATPase complex(GO:0005889) |
| 0.9 | 6.3 | GO:0044294 | dendritic growth cone(GO:0044294) |
| 0.9 | 8.9 | GO:0005577 | fibrinogen complex(GO:0005577) |
| 0.9 | 7.0 | GO:0098574 | cytoplasmic side of lysosomal membrane(GO:0098574) |
| 0.9 | 64.7 | GO:0001750 | photoreceptor outer segment(GO:0001750) |
| 0.8 | 2.5 | GO:0042599 | lamellar body(GO:0042599) |
| 0.8 | 3.4 | GO:0005968 | Rab-protein geranylgeranyltransferase complex(GO:0005968) |
| 0.8 | 256.3 | GO:0005578 | proteinaceous extracellular matrix(GO:0005578) |
| 0.8 | 2.5 | GO:0036398 | TCR signalosome(GO:0036398) |
| 0.8 | 44.2 | GO:0016235 | aggresome(GO:0016235) |
| 0.8 | 48.5 | GO:0031526 | brush border membrane(GO:0031526) |
| 0.8 | 5.5 | GO:0005827 | polar microtubule(GO:0005827) |
| 0.8 | 5.4 | GO:0016342 | catenin complex(GO:0016342) |
| 0.8 | 3.8 | GO:0031205 | endoplasmic reticulum Sec complex(GO:0031205) |
| 0.8 | 67.2 | GO:0043204 | perikaryon(GO:0043204) |
| 0.8 | 51.6 | GO:0043195 | terminal bouton(GO:0043195) |
| 0.8 | 200.2 | GO:0016323 | basolateral plasma membrane(GO:0016323) |
| 0.8 | 3.0 | GO:0044447 | axoneme part(GO:0044447) |
| 0.8 | 12.0 | GO:0071682 | endocytic vesicle lumen(GO:0071682) |
| 0.7 | 2.9 | GO:0016939 | kinesin II complex(GO:0016939) |
| 0.7 | 6.5 | GO:0044295 | axonal growth cone(GO:0044295) |
| 0.7 | 2.1 | GO:0005674 | transcription factor TFIIF complex(GO:0005674) |
| 0.7 | 11.9 | GO:0031095 | platelet dense tubular network membrane(GO:0031095) |
| 0.7 | 3.5 | GO:0089701 | U2AF(GO:0089701) |
| 0.7 | 11.1 | GO:0030014 | CCR4-NOT complex(GO:0030014) |
| 0.7 | 9.7 | GO:0031588 | nucleotide-activated protein kinase complex(GO:0031588) |
| 0.7 | 19.3 | GO:0042629 | mast cell granule(GO:0042629) |
| 0.7 | 6.9 | GO:0097225 | sperm midpiece(GO:0097225) |
| 0.7 | 19.5 | GO:1902710 | GABA receptor complex(GO:1902710) GABA-A receptor complex(GO:1902711) |
| 0.7 | 2.0 | GO:0070083 | clathrin-sculpted monoamine transport vesicle(GO:0070081) clathrin-sculpted monoamine transport vesicle membrane(GO:0070083) |
| 0.7 | 2.0 | GO:0034686 | integrin alphav-beta8 complex(GO:0034686) |
| 0.7 | 43.7 | GO:0001669 | acrosomal vesicle(GO:0001669) |
| 0.6 | 5.1 | GO:1990712 | HFE-transferrin receptor complex(GO:1990712) |
| 0.6 | 5.7 | GO:0030868 | smooth endoplasmic reticulum membrane(GO:0030868) smooth endoplasmic reticulum part(GO:0097425) |
| 0.6 | 28.2 | GO:0005891 | voltage-gated calcium channel complex(GO:0005891) |
| 0.6 | 4.9 | GO:0033391 | chromatoid body(GO:0033391) |
| 0.6 | 7.3 | GO:0043190 | ATP-binding cassette (ABC) transporter complex(GO:0043190) |
| 0.6 | 4.2 | GO:0000137 | Golgi cis cisterna(GO:0000137) |
| 0.6 | 9.0 | GO:0031527 | filopodium membrane(GO:0031527) |
| 0.6 | 4.2 | GO:0097427 | microtubule bundle(GO:0097427) |
| 0.6 | 13.0 | GO:0005771 | multivesicular body(GO:0005771) |
| 0.6 | 3.0 | GO:0008275 | gamma-tubulin small complex(GO:0008275) |
| 0.6 | 2.3 | GO:0031258 | lamellipodium membrane(GO:0031258) |
| 0.6 | 14.9 | GO:0031672 | A band(GO:0031672) |
| 0.6 | 2.8 | GO:0008622 | epsilon DNA polymerase complex(GO:0008622) |
| 0.6 | 3.4 | GO:0005858 | axonemal dynein complex(GO:0005858) |
| 0.6 | 1.7 | GO:0014701 | junctional sarcoplasmic reticulum membrane(GO:0014701) |
| 0.6 | 2.8 | GO:0097165 | nuclear stress granule(GO:0097165) |
| 0.5 | 12.3 | GO:0045178 | basal part of cell(GO:0045178) |
| 0.5 | 10.6 | GO:0097546 | ciliary base(GO:0097546) |
| 0.5 | 2.7 | GO:0046581 | intercellular canaliculus(GO:0046581) |
| 0.5 | 3.7 | GO:0035253 | ciliary rootlet(GO:0035253) |
| 0.5 | 3.2 | GO:0000322 | storage vacuole(GO:0000322) |
| 0.5 | 5.7 | GO:0097431 | mitotic spindle pole(GO:0097431) |
| 0.5 | 1.6 | GO:0030134 | ER to Golgi transport vesicle(GO:0030134) |
| 0.5 | 1.6 | GO:0070435 | Shc-EGFR complex(GO:0070435) |
| 0.5 | 27.4 | GO:0036064 | ciliary basal body(GO:0036064) |
| 0.5 | 13.4 | GO:0048786 | presynaptic active zone(GO:0048786) |
| 0.5 | 7.2 | GO:0035102 | PRC1 complex(GO:0035102) |
| 0.5 | 620.5 | GO:0005615 | extracellular space(GO:0005615) |
| 0.5 | 35.5 | GO:0044853 | plasma membrane raft(GO:0044853) |
| 0.5 | 59.8 | GO:0030427 | site of polarized growth(GO:0030427) |
| 0.5 | 3.4 | GO:0097452 | GAIT complex(GO:0097452) |
| 0.5 | 5.9 | GO:0030056 | hemidesmosome(GO:0030056) |
| 0.5 | 11.5 | GO:0005801 | cis-Golgi network(GO:0005801) |
| 0.4 | 8.0 | GO:0031904 | endosome lumen(GO:0031904) |
| 0.4 | 1.6 | GO:0031085 | BLOC-3 complex(GO:0031085) |
| 0.4 | 2.8 | GO:0032433 | filopodium tip(GO:0032433) |
| 0.4 | 30.3 | GO:0032587 | ruffle membrane(GO:0032587) |
| 0.4 | 3.6 | GO:0001891 | phagocytic cup(GO:0001891) |
| 0.4 | 1.6 | GO:0101003 | ficolin-1-rich granule membrane(GO:0101003) |
| 0.4 | 2.2 | GO:0016328 | lateral plasma membrane(GO:0016328) |
| 0.4 | 3.7 | GO:0045177 | apical part of cell(GO:0045177) |
| 0.4 | 6.6 | GO:0071141 | SMAD protein complex(GO:0071141) |
| 0.4 | 3.5 | GO:0033268 | node of Ranvier(GO:0033268) |
| 0.4 | 8.1 | GO:0008305 | integrin complex(GO:0008305) |
| 0.3 | 1.4 | GO:0032044 | DSIF complex(GO:0032044) |
| 0.3 | 22.2 | GO:0055037 | recycling endosome(GO:0055037) |
| 0.3 | 2.6 | GO:0032420 | stereocilium(GO:0032420) |
| 0.3 | 1.6 | GO:0030061 | mitochondrial crista(GO:0030061) |
| 0.3 | 73.7 | GO:0043025 | neuronal cell body(GO:0043025) |
| 0.3 | 9.2 | GO:0005834 | heterotrimeric G-protein complex(GO:0005834) |
| 0.3 | 1.5 | GO:1990037 | Lewy body core(GO:1990037) |
| 0.3 | 1.2 | GO:0016461 | unconventional myosin complex(GO:0016461) |
| 0.3 | 17.0 | GO:0008076 | voltage-gated potassium channel complex(GO:0008076) potassium channel complex(GO:0034705) |
| 0.3 | 0.6 | GO:0031528 | microvillus membrane(GO:0031528) |
| 0.3 | 7.7 | GO:0034707 | chloride channel complex(GO:0034707) |
| 0.3 | 1.3 | GO:0008024 | cyclin/CDK positive transcription elongation factor complex(GO:0008024) |
| 0.3 | 1.3 | GO:0036057 | filtration diaphragm(GO:0036056) slit diaphragm(GO:0036057) |
| 0.3 | 14.6 | GO:0001726 | ruffle(GO:0001726) |
| 0.3 | 8.1 | GO:0016592 | mediator complex(GO:0016592) |
| 0.3 | 1.8 | GO:0032039 | integrator complex(GO:0032039) |
| 0.3 | 970.7 | GO:0031224 | intrinsic component of membrane(GO:0031224) |
| 0.3 | 0.8 | GO:0031092 | platelet alpha granule membrane(GO:0031092) |
| 0.2 | 20.6 | GO:0005788 | endoplasmic reticulum lumen(GO:0005788) |
| 0.2 | 10.9 | GO:0016324 | apical plasma membrane(GO:0016324) |
| 0.2 | 0.7 | GO:0035189 | Rb-E2F complex(GO:0035189) |
| 0.2 | 5.4 | GO:0005913 | cell-cell adherens junction(GO:0005913) |
| 0.2 | 1.3 | GO:0009897 | external side of plasma membrane(GO:0009897) |
| 0.1 | 1.2 | GO:0035577 | azurophil granule membrane(GO:0035577) |
| 0.1 | 1.3 | GO:0033588 | Elongator holoenzyme complex(GO:0033588) |
| 0.1 | 14.4 | GO:0045111 | intermediate filament cytoskeleton(GO:0045111) |
| 0.1 | 3.9 | GO:0030286 | dynein complex(GO:0030286) |
| 0.1 | 0.7 | GO:0030992 | intraciliary transport particle B(GO:0030992) |
| 0.1 | 0.5 | GO:0097539 | ciliary transition fiber(GO:0097539) |
| 0.1 | 0.8 | GO:0000421 | autophagosome membrane(GO:0000421) |
| 0.1 | 0.2 | GO:0005828 | kinetochore microtubule(GO:0005828) |
| 0.0 | 0.4 | GO:0035068 | micro-ribonucleoprotein complex(GO:0035068) |
| 0.0 | 0.8 | GO:0016459 | myosin complex(GO:0016459) |
| 0.0 | 0.8 | GO:0030127 | COPII vesicle coat(GO:0030127) |
| 0.0 | 0.1 | GO:0030895 | apolipoprotein B mRNA editing enzyme complex(GO:0030895) |
| 0.0 | 0.7 | GO:0000407 | pre-autophagosomal structure(GO:0000407) |
| 0.0 | 0.1 | GO:0031209 | SCAR complex(GO:0031209) |
| 0.0 | 0.1 | GO:0000120 | RNA polymerase I transcription factor complex(GO:0000120) |
Gene overrepresentation in molecular_function category:
| Log-likelihood per target | Total log-likelihood | Term | Description |
|---|---|---|---|
| 13.5 | 40.4 | GO:0098519 | nucleotide phosphatase activity, acting on free nucleotides(GO:0098519) |
| 13.3 | 39.9 | GO:0019959 | interleukin-8 binding(GO:0019959) |
| 12.8 | 167.0 | GO:0005344 | oxygen transporter activity(GO:0005344) |
| 12.0 | 47.9 | GO:0004667 | prostaglandin-D synthase activity(GO:0004667) |
| 11.1 | 55.7 | GO:0030348 | syntaxin-3 binding(GO:0030348) |
| 11.1 | 22.2 | GO:0070888 | E-box binding(GO:0070888) |
| 10.4 | 41.4 | GO:0042903 | tubulin deacetylase activity(GO:0042903) |
| 9.5 | 37.9 | GO:0008431 | vitamin E binding(GO:0008431) |
| 9.0 | 27.0 | GO:0035379 | carbon dioxide transmembrane transporter activity(GO:0035379) |
| 8.9 | 35.7 | GO:0016880 | glutamate-ammonia ligase activity(GO:0004356) ammonia ligase activity(GO:0016211) acid-ammonia (or amide) ligase activity(GO:0016880) |
| 7.6 | 22.8 | GO:0003845 | 11-beta-hydroxysteroid dehydrogenase [NAD(P)] activity(GO:0003845) |
| 7.2 | 21.6 | GO:0008330 | protein tyrosine/threonine phosphatase activity(GO:0008330) |
| 7.2 | 28.7 | GO:0047391 | alkylglycerophosphoethanolamine phosphodiesterase activity(GO:0047391) |
| 7.2 | 28.7 | GO:0030492 | hemoglobin binding(GO:0030492) |
| 7.1 | 21.4 | GO:0030343 | vitamin D3 25-hydroxylase activity(GO:0030343) vitamin D 25-hydroxylase activity(GO:0070643) |
| 6.7 | 53.9 | GO:0060228 | phosphatidylcholine-sterol O-acyltransferase activator activity(GO:0060228) |
| 6.6 | 19.9 | GO:0015091 | ferric iron transmembrane transporter activity(GO:0015091) trivalent inorganic cation transmembrane transporter activity(GO:0072510) |
| 6.6 | 19.7 | GO:0016838 | carbon-oxygen lyase activity, acting on phosphates(GO:0016838) |
| 6.2 | 18.7 | GO:0008321 | Ral guanyl-nucleotide exchange factor activity(GO:0008321) |
| 6.1 | 18.4 | GO:0047150 | betaine-homocysteine S-methyltransferase activity(GO:0047150) |
| 6.1 | 18.3 | GO:0033188 | sphingomyelin synthase activity(GO:0033188) ceramide cholinephosphotransferase activity(GO:0047493) |
| 5.7 | 17.1 | GO:0016155 | formyltetrahydrofolate dehydrogenase activity(GO:0016155) |
| 5.7 | 17.1 | GO:0016534 | cyclin-dependent protein kinase 5 activator activity(GO:0016534) |
| 5.7 | 17.1 | GO:0030350 | iron-responsive element binding(GO:0030350) |
| 5.6 | 22.4 | GO:0061714 | folic acid receptor activity(GO:0061714) |
| 5.6 | 16.7 | GO:0004828 | serine-tRNA ligase activity(GO:0004828) |
| 5.5 | 33.1 | GO:0004800 | thyroxine 5'-deiodinase activity(GO:0004800) |
| 5.2 | 26.1 | GO:0047374 | methylumbelliferyl-acetate deacetylase activity(GO:0047374) |
| 5.2 | 5.2 | GO:0042806 | fucose binding(GO:0042806) |
| 5.2 | 15.5 | GO:0019912 | cyclin-dependent protein kinase activating kinase activity(GO:0019912) |
| 5.1 | 45.9 | GO:0004499 | N,N-dimethylaniline monooxygenase activity(GO:0004499) |
| 5.0 | 15.1 | GO:0061629 | RNA polymerase II sequence-specific DNA binding transcription factor binding(GO:0061629) |
| 5.0 | 15.1 | GO:0003863 | alpha-ketoacid dehydrogenase activity(GO:0003826) 3-methyl-2-oxobutanoate dehydrogenase (2-methylpropanoyl-transferring) activity(GO:0003863) |
| 5.0 | 50.1 | GO:0070324 | thyroid hormone binding(GO:0070324) |
| 4.8 | 4.8 | GO:0031802 | type 5 metabotropic glutamate receptor binding(GO:0031802) |
| 4.8 | 28.7 | GO:0004741 | [pyruvate dehydrogenase (lipoamide)] phosphatase activity(GO:0004741) |
| 4.7 | 18.8 | GO:0004782 | sulfinoalanine decarboxylase activity(GO:0004782) |
| 4.7 | 14.1 | GO:0004938 | alpha2-adrenergic receptor activity(GO:0004938) |
| 4.7 | 28.1 | GO:0004447 | iodide peroxidase activity(GO:0004447) |
| 4.6 | 13.9 | GO:0031812 | G-protein coupled nucleotide receptor binding(GO:0031811) P2Y1 nucleotide receptor binding(GO:0031812) |
| 4.6 | 13.9 | GO:0032093 | SAM domain binding(GO:0032093) |
| 4.6 | 18.5 | GO:0047066 | phospholipid-hydroperoxide glutathione peroxidase activity(GO:0047066) |
| 4.6 | 55.4 | GO:0019911 | structural constituent of myelin sheath(GO:0019911) |
| 4.6 | 27.7 | GO:0015252 | hydrogen ion channel activity(GO:0015252) |
| 4.6 | 18.4 | GO:0001588 | dopamine neurotransmitter receptor activity, coupled via Gs(GO:0001588) |
| 4.6 | 18.3 | GO:0019828 | aspartic-type endopeptidase inhibitor activity(GO:0019828) |
| 4.5 | 13.6 | GO:0050501 | hyaluronan synthase activity(GO:0050501) |
| 4.5 | 22.4 | GO:0004306 | ethanolamine-phosphate cytidylyltransferase activity(GO:0004306) |
| 4.5 | 13.5 | GO:0004613 | phosphoenolpyruvate carboxykinase activity(GO:0004611) phosphoenolpyruvate carboxykinase (GTP) activity(GO:0004613) |
| 4.2 | 12.7 | GO:0004676 | 3-phosphoinositide-dependent protein kinase activity(GO:0004676) |
| 4.2 | 42.1 | GO:0022841 | potassium ion leak channel activity(GO:0022841) |
| 4.2 | 29.3 | GO:0016206 | catechol O-methyltransferase activity(GO:0016206) |
| 4.2 | 20.8 | GO:0004995 | tachykinin receptor activity(GO:0004995) |
| 4.1 | 24.6 | GO:0003917 | DNA topoisomerase type I activity(GO:0003917) |
| 4.1 | 12.2 | GO:0004157 | dihydropyrimidinase activity(GO:0004157) |
| 4.0 | 12.1 | GO:0097258 | tocopherol omega-hydroxylase activity(GO:0052870) alpha-tocopherol omega-hydroxylase activity(GO:0052871) 20-hydroxy-leukotriene B4 omega oxidase activity(GO:0097258) 20-aldehyde-leukotriene B4 20-monooxygenase activity(GO:0097259) |
| 4.0 | 24.1 | GO:0016909 | JUN kinase activity(GO:0004705) SAP kinase activity(GO:0016909) |
| 4.0 | 11.9 | GO:0016309 | 1-phosphatidylinositol-5-phosphate 4-kinase activity(GO:0016309) |
| 3.9 | 15.7 | GO:0042132 | fructose 1,6-bisphosphate 1-phosphatase activity(GO:0042132) |
| 3.9 | 11.8 | GO:0016426 | tRNA (adenine) methyltransferase activity(GO:0016426) tRNA (adenine-N1-)-methyltransferase activity(GO:0016429) |
| 3.9 | 11.6 | GO:0015403 | thiamine transmembrane transporter activity(GO:0015234) thiamine uptake transmembrane transporter activity(GO:0015403) |
| 3.8 | 7.7 | GO:0051540 | iron-sulfur cluster binding(GO:0051536) metal cluster binding(GO:0051540) |
| 3.8 | 15.4 | GO:0070051 | fibrinogen binding(GO:0070051) |
| 3.8 | 15.2 | GO:0004346 | glucose-6-phosphatase activity(GO:0004346) sugar-terminal-phosphatase activity(GO:0050309) |
| 3.8 | 11.3 | GO:0004951 | cholecystokinin receptor activity(GO:0004951) |
| 3.8 | 26.3 | GO:0015501 | glutamate:sodium symporter activity(GO:0015501) |
| 3.7 | 11.1 | GO:0015439 | heme-transporting ATPase activity(GO:0015439) |
| 3.7 | 18.4 | GO:0005152 | interleukin-1 receptor antagonist activity(GO:0005152) |
| 3.6 | 14.4 | GO:0004165 | dodecenoyl-CoA delta-isomerase activity(GO:0004165) |
| 3.6 | 53.9 | GO:0016918 | retinal binding(GO:0016918) |
| 3.5 | 14.0 | GO:0008940 | nitrate reductase activity(GO:0008940) |
| 3.5 | 62.9 | GO:0051787 | misfolded protein binding(GO:0051787) |
| 3.5 | 17.4 | GO:0004687 | myosin light chain kinase activity(GO:0004687) |
| 3.5 | 20.7 | GO:0008430 | selenium binding(GO:0008430) |
| 3.4 | 6.9 | GO:0008184 | glycogen phosphorylase activity(GO:0008184) |
| 3.4 | 10.3 | GO:0035501 | MH1 domain binding(GO:0035501) |
| 3.4 | 13.7 | GO:0004449 | isocitrate dehydrogenase (NAD+) activity(GO:0004449) |
| 3.4 | 10.1 | GO:0047977 | hepoxilin-epoxide hydrolase activity(GO:0047977) |
| 3.4 | 3.4 | GO:0070052 | collagen V binding(GO:0070052) |
| 3.3 | 13.4 | GO:0060422 | peptidyl-dipeptidase inhibitor activity(GO:0060422) |
| 3.3 | 36.8 | GO:0003996 | acyl-CoA ligase activity(GO:0003996) |
| 3.3 | 19.9 | GO:0038064 | collagen receptor activity(GO:0038064) |
| 3.3 | 36.2 | GO:0031995 | insulin-like growth factor II binding(GO:0031995) |
| 3.2 | 19.1 | GO:0005119 | smoothened binding(GO:0005119) |
| 3.1 | 15.5 | GO:0004468 | lysine N-acetyltransferase activity, acting on acetyl phosphate as donor(GO:0004468) |
| 3.1 | 6.2 | GO:0034511 | U3 snoRNA binding(GO:0034511) |
| 3.1 | 6.2 | GO:0015333 | peptide:proton symporter activity(GO:0015333) proton-dependent peptide secondary active transmembrane transporter activity(GO:0022897) |
| 3.0 | 24.3 | GO:0030172 | troponin C binding(GO:0030172) |
| 3.0 | 9.1 | GO:0016899 | oxidoreductase activity, acting on the CH-OH group of donors, oxygen as acceptor(GO:0016899) |
| 3.0 | 42.3 | GO:0004065 | arylsulfatase activity(GO:0004065) |
| 3.0 | 9.0 | GO:1904455 | ubiquitin-specific protease activity involved in negative regulation of ERAD pathway(GO:1904455) |
| 3.0 | 8.9 | GO:0031727 | CCR2 chemokine receptor binding(GO:0031727) |
| 3.0 | 8.9 | GO:0001596 | angiotensin type I receptor activity(GO:0001596) |
| 3.0 | 29.7 | GO:0009374 | biotin binding(GO:0009374) |
| 3.0 | 8.9 | GO:0047223 | N-acetyllactosaminide beta-1,3-N-acetylglucosaminyltransferase activity(GO:0008532) beta-1,3-galactosyl-O-glycosyl-glycoprotein beta-1,3-N-acetylglucosaminyltransferase activity(GO:0047223) |
| 2.9 | 11.5 | GO:0008336 | gamma-butyrobetaine dioxygenase activity(GO:0008336) |
| 2.9 | 5.7 | GO:0043891 | glyceraldehyde-3-phosphate dehydrogenase (NAD+) (phosphorylating) activity(GO:0004365) glyceraldehyde-3-phosphate dehydrogenase (NAD(P)+) (phosphorylating) activity(GO:0043891) |
| 2.9 | 14.3 | GO:0005006 | epidermal growth factor-activated receptor activity(GO:0005006) |
| 2.9 | 11.4 | GO:0004505 | phenylalanine 4-monooxygenase activity(GO:0004505) |
| 2.9 | 8.6 | GO:0017129 | triglyceride binding(GO:0017129) |
| 2.8 | 8.5 | GO:0004768 | stearoyl-CoA 9-desaturase activity(GO:0004768) acyl-CoA desaturase activity(GO:0016215) |
| 2.8 | 2.8 | GO:0032794 | GTPase activating protein binding(GO:0032794) |
| 2.8 | 8.5 | GO:0008798 | beta-aspartyl-peptidase activity(GO:0008798) |
| 2.8 | 8.4 | GO:0000026 | alpha-1,2-mannosyltransferase activity(GO:0000026) |
| 2.8 | 11.1 | GO:0008889 | glycerophosphodiester phosphodiesterase activity(GO:0008889) |
| 2.8 | 16.6 | GO:0004882 | androgen receptor activity(GO:0004882) |
| 2.8 | 8.3 | GO:0008386 | cholesterol monooxygenase (side-chain-cleaving) activity(GO:0008386) |
| 2.7 | 8.2 | GO:0050698 | proteoglycan sulfotransferase activity(GO:0050698) |
| 2.7 | 5.4 | GO:0050473 | arachidonate 15-lipoxygenase activity(GO:0050473) |
| 2.7 | 10.8 | GO:0004740 | pyruvate dehydrogenase (acetyl-transferring) kinase activity(GO:0004740) |
| 2.7 | 8.0 | GO:0102007 | lactonohydrolase activity(GO:0046573) acyl-L-homoserine-lactone lactonohydrolase activity(GO:0102007) |
| 2.6 | 5.3 | GO:0035673 | oligopeptide transmembrane transporter activity(GO:0035673) |
| 2.6 | 18.4 | GO:0071553 | uridine nucleotide receptor activity(GO:0015065) G-protein coupled pyrimidinergic nucleotide receptor activity(GO:0071553) |
| 2.6 | 13.1 | GO:0016402 | pristanoyl-CoA oxidase activity(GO:0016402) |
| 2.6 | 10.5 | GO:0052798 | beta-galactoside alpha-2,3-sialyltransferase activity(GO:0052798) |
| 2.6 | 12.9 | GO:0005223 | intracellular cGMP activated cation channel activity(GO:0005223) |
| 2.5 | 7.6 | GO:0016435 | rRNA (guanine) methyltransferase activity(GO:0016435) |
| 2.5 | 22.8 | GO:0004689 | phosphorylase kinase activity(GO:0004689) |
| 2.5 | 20.1 | GO:0015651 | quaternary ammonium group transmembrane transporter activity(GO:0015651) |
| 2.5 | 50.2 | GO:0016712 | oxidoreductase activity, acting on paired donors, with incorporation or reduction of molecular oxygen, reduced flavin or flavoprotein as one donor, and incorporation of one atom of oxygen(GO:0016712) |
| 2.5 | 10.0 | GO:0016841 | ammonia-lyase activity(GO:0016841) |
| 2.5 | 5.0 | GO:0015111 | iodide transmembrane transporter activity(GO:0015111) |
| 2.5 | 7.5 | GO:0032767 | copper-dependent protein binding(GO:0032767) |
| 2.5 | 9.9 | GO:0008422 | beta-glucosidase activity(GO:0008422) |
| 2.5 | 14.9 | GO:0015272 | ATP-activated inward rectifier potassium channel activity(GO:0015272) |
| 2.5 | 39.6 | GO:0005391 | sodium:potassium-exchanging ATPase activity(GO:0005391) |
| 2.5 | 63.7 | GO:0005520 | insulin-like growth factor binding(GO:0005520) |
| 2.4 | 9.8 | GO:0004909 | interleukin-1, Type I, activating receptor activity(GO:0004909) |
| 2.4 | 9.8 | GO:0042500 | aspartic endopeptidase activity, intramembrane cleaving(GO:0042500) |
| 2.4 | 14.6 | GO:0005134 | interleukin-2 receptor binding(GO:0005134) |
| 2.4 | 12.2 | GO:0015204 | urea transmembrane transporter activity(GO:0015204) |
| 2.4 | 19.5 | GO:0008559 | xenobiotic-transporting ATPase activity(GO:0008559) |
| 2.4 | 12.1 | GO:0015307 | drug:proton antiporter activity(GO:0015307) |
| 2.4 | 16.9 | GO:0001517 | N-acetylglucosamine 6-O-sulfotransferase activity(GO:0001517) |
| 2.4 | 9.6 | GO:0071987 | WD40-repeat domain binding(GO:0071987) |
| 2.4 | 9.5 | GO:0050750 | low-density lipoprotein particle receptor binding(GO:0050750) |
| 2.3 | 11.7 | GO:0004668 | protein-arginine deiminase activity(GO:0004668) |
| 2.3 | 9.2 | GO:0004047 | aminomethyltransferase activity(GO:0004047) |
| 2.3 | 9.2 | GO:0004504 | peptidylglycine monooxygenase activity(GO:0004504) peptidylamidoglycolate lyase activity(GO:0004598) |
| 2.3 | 9.2 | GO:0003997 | acyl-CoA oxidase activity(GO:0003997) |
| 2.3 | 23.0 | GO:0031433 | telethonin binding(GO:0031433) |
| 2.3 | 29.8 | GO:0001011 | transcription factor activity, sequence-specific DNA binding, RNA polymerase recruiting(GO:0001011) transcription factor activity, TFIIB-class binding(GO:0001087) |
| 2.3 | 4.6 | GO:0047760 | butyrate-CoA ligase activity(GO:0047760) |
| 2.3 | 29.4 | GO:0005004 | GPI-linked ephrin receptor activity(GO:0005004) |
| 2.3 | 18.1 | GO:1990380 | Lys48-specific deubiquitinase activity(GO:1990380) |
| 2.2 | 31.5 | GO:0036374 | glutathione hydrolase activity(GO:0036374) |
| 2.2 | 9.0 | GO:0035373 | chondroitin sulfate proteoglycan binding(GO:0035373) |
| 2.2 | 11.2 | GO:0004925 | prolactin receptor activity(GO:0004925) |
| 2.2 | 20.1 | GO:0048495 | Roundabout binding(GO:0048495) |
| 2.2 | 28.9 | GO:0005372 | water transmembrane transporter activity(GO:0005372) |
| 2.2 | 15.5 | GO:0070891 | lipoteichoic acid binding(GO:0070891) |
| 2.2 | 6.6 | GO:0017002 | activin-activated receptor activity(GO:0017002) |
| 2.2 | 17.7 | GO:0003810 | protein-glutamine gamma-glutamyltransferase activity(GO:0003810) |
| 2.2 | 8.8 | GO:0032145 | 4-aminobutyrate transaminase activity(GO:0003867) succinate-semialdehyde dehydrogenase binding(GO:0032145) (S)-3-amino-2-methylpropionate transaminase activity(GO:0047298) |
| 2.2 | 15.3 | GO:0030250 | cyclase activator activity(GO:0010853) guanylate cyclase activator activity(GO:0030250) |
| 2.2 | 2.2 | GO:0032036 | myosin heavy chain binding(GO:0032036) |
| 2.2 | 21.7 | GO:0047498 | calcium-dependent phospholipase A2 activity(GO:0047498) |
| 2.2 | 10.9 | GO:0070097 | delta-catenin binding(GO:0070097) |
| 2.2 | 6.5 | GO:0043546 | molybdopterin cofactor binding(GO:0043546) |
| 2.2 | 17.3 | GO:0004565 | beta-galactosidase activity(GO:0004565) |
| 2.1 | 223.5 | GO:0004867 | serine-type endopeptidase inhibitor activity(GO:0004867) |
| 2.1 | 8.4 | GO:0052812 | 1-phosphatidylinositol-3-phosphate 4-kinase activity(GO:0052811) phosphatidylinositol-3,4-bisphosphate 5-kinase activity(GO:0052812) |
| 2.1 | 8.4 | GO:0047288 | monosialoganglioside sialyltransferase activity(GO:0047288) |
| 2.1 | 20.8 | GO:0015101 | organic cation transmembrane transporter activity(GO:0015101) |
| 2.1 | 18.6 | GO:0070915 | lysophosphatidic acid receptor activity(GO:0070915) |
| 2.0 | 12.2 | GO:0004471 | malate dehydrogenase (decarboxylating) (NAD+) activity(GO:0004471) malate dehydrogenase (decarboxylating) (NADP+) activity(GO:0004473) oxaloacetate decarboxylase activity(GO:0008948) |
| 2.0 | 8.1 | GO:0004140 | dephospho-CoA kinase activity(GO:0004140) |
| 2.0 | 6.1 | GO:0005350 | pyrimidine nucleobase transmembrane transporter activity(GO:0005350) pyrimidine- and adenine-specific:sodium symporter activity(GO:0015389) |
| 2.0 | 122.2 | GO:0050840 | extracellular matrix binding(GO:0050840) |
| 2.0 | 12.0 | GO:0016015 | morphogen activity(GO:0016015) |
| 2.0 | 8.0 | GO:0031711 | bradykinin receptor binding(GO:0031711) |
| 2.0 | 25.9 | GO:0033691 | sialic acid binding(GO:0033691) |
| 2.0 | 5.9 | GO:0015361 | low-affinity sodium:dicarboxylate symporter activity(GO:0015361) |
| 1.9 | 9.7 | GO:0001594 | trace-amine receptor activity(GO:0001594) |
| 1.9 | 38.8 | GO:0043560 | insulin receptor substrate binding(GO:0043560) |
| 1.9 | 1.9 | GO:0042975 | peroxisome proliferator activated receptor binding(GO:0042975) |
| 1.9 | 7.7 | GO:0022850 | serotonin-gated cation channel activity(GO:0022850) |
| 1.9 | 30.7 | GO:0004691 | cAMP-dependent protein kinase activity(GO:0004691) |
| 1.9 | 15.3 | GO:0036122 | BMP binding(GO:0036122) |
| 1.9 | 17.1 | GO:0005025 | transforming growth factor beta receptor activity, type I(GO:0005025) |
| 1.9 | 7.6 | GO:0070410 | co-SMAD binding(GO:0070410) |
| 1.9 | 9.4 | GO:0015232 | heme transporter activity(GO:0015232) |
| 1.9 | 7.5 | GO:0070290 | N-acylphosphatidylethanolamine-specific phospholipase D activity(GO:0070290) |
| 1.9 | 5.6 | GO:0034584 | piRNA binding(GO:0034584) |
| 1.9 | 13.0 | GO:0030368 | interleukin-17 receptor activity(GO:0030368) |
| 1.9 | 16.7 | GO:0030976 | thiamine pyrophosphate binding(GO:0030976) |
| 1.8 | 7.4 | GO:0030760 | nicotinamide N-methyltransferase activity(GO:0008112) pyridine N-methyltransferase activity(GO:0030760) |
| 1.8 | 27.5 | GO:0005402 | sugar:proton symporter activity(GO:0005351) cation:sugar symporter activity(GO:0005402) |
| 1.8 | 5.5 | GO:0004137 | deoxycytidine kinase activity(GO:0004137) |
| 1.8 | 54.6 | GO:0004181 | metallocarboxypeptidase activity(GO:0004181) |
| 1.8 | 7.3 | GO:0004634 | phosphopyruvate hydratase activity(GO:0004634) |
| 1.8 | 21.7 | GO:0045159 | myosin II binding(GO:0045159) |
| 1.8 | 7.2 | GO:0000702 | oxidized base lesion DNA N-glycosylase activity(GO:0000702) |
| 1.8 | 5.4 | GO:0004949 | cannabinoid receptor activity(GO:0004949) |
| 1.8 | 10.7 | GO:0043533 | inositol 1,3,4,5 tetrakisphosphate binding(GO:0043533) |
| 1.7 | 12.2 | GO:0032554 | purine deoxyribonucleotide binding(GO:0032554) |
| 1.7 | 7.0 | GO:0005412 | glucose:sodium symporter activity(GO:0005412) |
| 1.7 | 12.1 | GO:0016803 | ether hydrolase activity(GO:0016803) |
| 1.7 | 6.9 | GO:0020037 | heme binding(GO:0020037) |
| 1.7 | 8.6 | GO:0004994 | somatostatin receptor activity(GO:0004994) |
| 1.7 | 5.1 | GO:0034353 | RNA pyrophosphohydrolase activity(GO:0034353) |
| 1.7 | 8.5 | GO:0016901 | glycerol-3-phosphate dehydrogenase activity(GO:0004368) oxidoreductase activity, acting on the CH-OH group of donors, quinone or similar compound as acceptor(GO:0016901) |
| 1.7 | 3.4 | GO:0005501 | retinoid binding(GO:0005501) |
| 1.7 | 22.1 | GO:0046870 | cadmium ion binding(GO:0046870) |
| 1.7 | 26.4 | GO:0038191 | neuropilin binding(GO:0038191) |
| 1.6 | 8.2 | GO:0016300 | tRNA (uracil) methyltransferase activity(GO:0016300) |
| 1.6 | 9.9 | GO:0045569 | TRAIL binding(GO:0045569) |
| 1.6 | 9.8 | GO:0005157 | macrophage colony-stimulating factor receptor binding(GO:0005157) |
| 1.6 | 6.5 | GO:1990190 | peptide-glutamate-N-acetyltransferase activity(GO:1990190) |
| 1.6 | 14.6 | GO:0000062 | fatty-acyl-CoA binding(GO:0000062) |
| 1.6 | 58.5 | GO:0005184 | neuropeptide hormone activity(GO:0005184) |
| 1.6 | 4.8 | GO:0004382 | guanosine-diphosphatase activity(GO:0004382) |
| 1.6 | 43.1 | GO:0005212 | structural constituent of eye lens(GO:0005212) |
| 1.6 | 6.4 | GO:0005220 | inositol 1,4,5-trisphosphate-sensitive calcium-release channel activity(GO:0005220) |
| 1.6 | 73.2 | GO:0008009 | chemokine activity(GO:0008009) |
| 1.6 | 11.1 | GO:0004035 | alkaline phosphatase activity(GO:0004035) |
| 1.6 | 6.3 | GO:0097603 | temperature-gated ion channel activity(GO:0097603) |
| 1.6 | 22.0 | GO:0004029 | aldehyde dehydrogenase (NAD) activity(GO:0004029) |
| 1.6 | 32.9 | GO:0050811 | GABA receptor binding(GO:0050811) |
| 1.6 | 6.3 | GO:0015375 | glycine:sodium symporter activity(GO:0015375) |
| 1.6 | 12.5 | GO:0008131 | primary amine oxidase activity(GO:0008131) |
| 1.6 | 4.7 | GO:0001034 | RNA polymerase III transcription factor activity, sequence-specific DNA binding(GO:0001034) |
| 1.5 | 20.1 | GO:0051011 | microtubule minus-end binding(GO:0051011) |
| 1.5 | 6.2 | GO:0033906 | hyaluronoglucuronidase activity(GO:0033906) |
| 1.5 | 15.4 | GO:0005007 | fibroblast growth factor-activated receptor activity(GO:0005007) |
| 1.5 | 4.6 | GO:0004784 | superoxide dismutase activity(GO:0004784) oxidoreductase activity, acting on superoxide radicals as acceptor(GO:0016721) |
| 1.5 | 25.9 | GO:0004089 | carbonate dehydratase activity(GO:0004089) |
| 1.5 | 7.6 | GO:0042289 | MHC class II protein binding(GO:0042289) |
| 1.5 | 4.5 | GO:0004962 | endothelin receptor activity(GO:0004962) |
| 1.5 | 4.5 | GO:0070283 | lipoate synthase activity(GO:0016992) radical SAM enzyme activity(GO:0070283) |
| 1.5 | 12.1 | GO:0016406 | carnitine O-acyltransferase activity(GO:0016406) |
| 1.5 | 6.0 | GO:0004980 | melanocyte-stimulating hormone receptor activity(GO:0004980) |
| 1.5 | 9.0 | GO:0008568 | microtubule-severing ATPase activity(GO:0008568) |
| 1.5 | 3.0 | GO:0004332 | fructose-bisphosphate aldolase activity(GO:0004332) |
| 1.5 | 10.5 | GO:0008109 | N-acetyllactosaminide beta-1,6-N-acetylglucosaminyltransferase activity(GO:0008109) |
| 1.5 | 3.0 | GO:0035473 | lipase binding(GO:0035473) |
| 1.5 | 7.5 | GO:0060230 | lipoprotein lipase activator activity(GO:0060230) |
| 1.5 | 23.9 | GO:0043394 | proteoglycan binding(GO:0043394) |
| 1.5 | 8.9 | GO:0003958 | NADPH-hemoprotein reductase activity(GO:0003958) |
| 1.5 | 10.3 | GO:0060072 | large conductance calcium-activated potassium channel activity(GO:0060072) |
| 1.5 | 7.3 | GO:0070740 | tubulin-glutamic acid ligase activity(GO:0070740) |
| 1.5 | 2.9 | GO:0010465 | nerve growth factor receptor activity(GO:0010465) |
| 1.5 | 2.9 | GO:0008410 | CoA-transferase activity(GO:0008410) |
| 1.5 | 21.8 | GO:0008140 | cAMP response element binding protein binding(GO:0008140) |
| 1.4 | 18.8 | GO:0070700 | BMP receptor binding(GO:0070700) |
| 1.4 | 14.5 | GO:0045294 | alpha-catenin binding(GO:0045294) |
| 1.4 | 7.1 | GO:0004647 | phosphoserine phosphatase activity(GO:0004647) |
| 1.4 | 8.5 | GO:0008467 | [heparan sulfate]-glucosamine 3-sulfotransferase 1 activity(GO:0008467) |
| 1.4 | 8.4 | GO:0016647 | oxidoreductase activity, acting on the CH-NH group of donors, oxygen as acceptor(GO:0016647) |
| 1.4 | 8.4 | GO:0030020 | extracellular matrix structural constituent conferring tensile strength(GO:0030020) |
| 1.4 | 20.8 | GO:0005229 | intracellular calcium activated chloride channel activity(GO:0005229) |
| 1.4 | 9.7 | GO:0033130 | acetylcholine receptor binding(GO:0033130) |
| 1.4 | 2.7 | GO:0045118 | azole transporter activity(GO:0045118) |
| 1.4 | 20.4 | GO:0019215 | intermediate filament binding(GO:0019215) |
| 1.4 | 6.8 | GO:0016755 | transferase activity, transferring amino-acyl groups(GO:0016755) |
| 1.4 | 15.0 | GO:0043176 | amine binding(GO:0043176) serotonin binding(GO:0051378) |
| 1.3 | 40.3 | GO:0016709 | oxidoreductase activity, acting on paired donors, with incorporation or reduction of molecular oxygen, NAD(P)H as one donor, and incorporation of one atom of oxygen(GO:0016709) |
| 1.3 | 6.7 | GO:0001758 | retinal dehydrogenase activity(GO:0001758) |
| 1.3 | 5.3 | GO:0004060 | arylamine N-acetyltransferase activity(GO:0004060) |
| 1.3 | 4.0 | GO:0004878 | complement component C5a receptor activity(GO:0004878) |
| 1.3 | 8.0 | GO:0016941 | natriuretic peptide receptor activity(GO:0016941) |
| 1.3 | 5.3 | GO:0004886 | 9-cis retinoic acid receptor activity(GO:0004886) |
| 1.3 | 9.3 | GO:0008142 | oxysterol binding(GO:0008142) |
| 1.3 | 4.0 | GO:0061663 | NEDD8 ligase activity(GO:0061663) |
| 1.3 | 7.9 | GO:0005168 | neurotrophin TRKA receptor binding(GO:0005168) |
| 1.3 | 9.2 | GO:0042056 | chemoattractant activity(GO:0042056) |
| 1.3 | 69.0 | GO:0005044 | scavenger receptor activity(GO:0005044) |
| 1.3 | 3.9 | GO:0016434 | rRNA (cytosine) methyltransferase activity(GO:0016434) |
| 1.3 | 7.8 | GO:0004792 | thiosulfate sulfurtransferase activity(GO:0004792) |
| 1.3 | 3.9 | GO:0005375 | copper ion transmembrane transporter activity(GO:0005375) |
| 1.3 | 9.0 | GO:0050682 | AF-2 domain binding(GO:0050682) |
| 1.3 | 3.9 | GO:0004045 | aminoacyl-tRNA hydrolase activity(GO:0004045) |
| 1.3 | 5.1 | GO:0016971 | flavin-linked sulfhydryl oxidase activity(GO:0016971) thiol oxidase activity(GO:0016972) |
| 1.3 | 12.7 | GO:0047035 | testosterone dehydrogenase (NAD+) activity(GO:0047035) |
| 1.3 | 11.4 | GO:0005000 | vasopressin receptor activity(GO:0005000) |
| 1.3 | 10.2 | GO:0015349 | thyroid hormone transmembrane transporter activity(GO:0015349) |
| 1.3 | 1.3 | GO:0043199 | sulfate binding(GO:0043199) |
| 1.3 | 30.4 | GO:0001530 | lipopolysaccharide binding(GO:0001530) |
| 1.3 | 10.1 | GO:1904315 | neurotransmitter receptor activity involved in regulation of postsynaptic membrane potential(GO:0099529) transmitter-gated ion channel activity involved in regulation of postsynaptic membrane potential(GO:1904315) |
| 1.3 | 6.3 | GO:0030060 | L-malate dehydrogenase activity(GO:0030060) |
| 1.3 | 5.0 | GO:0004657 | proline dehydrogenase activity(GO:0004657) |
| 1.3 | 7.5 | GO:0000182 | rDNA binding(GO:0000182) |
| 1.2 | 5.0 | GO:0016494 | C-X-C chemokine receptor activity(GO:0016494) |
| 1.2 | 7.4 | GO:0070492 | oligosaccharide binding(GO:0070492) |
| 1.2 | 2.5 | GO:0016019 | peptidoglycan receptor activity(GO:0016019) |
| 1.2 | 9.9 | GO:0016846 | carbon-sulfur lyase activity(GO:0016846) |
| 1.2 | 6.2 | GO:0061665 | SUMO ligase activity(GO:0061665) |
| 1.2 | 3.7 | GO:0042954 | lipoprotein transporter activity(GO:0042954) |
| 1.2 | 6.2 | GO:0052846 | endopolyphosphatase activity(GO:0000298) diphosphoinositol-polyphosphate diphosphatase activity(GO:0008486) bis(5'-adenosyl)-hexaphosphatase activity(GO:0034431) bis(5'-adenosyl)-pentaphosphatase activity(GO:0034432) inositol diphosphate tetrakisphosphate diphosphatase activity(GO:0052840) inositol bisdiphosphate tetrakisphosphate diphosphatase activity(GO:0052841) inositol diphosphate pentakisphosphate diphosphatase activity(GO:0052842) inositol-1-diphosphate-2,3,4,5,6-pentakisphosphate diphosphatase activity(GO:0052843) inositol-3-diphosphate-1,2,4,5,6-pentakisphosphate diphosphatase activity(GO:0052844) inositol-5-diphosphate-1,2,3,4,6-pentakisphosphate diphosphatase activity(GO:0052845) inositol-1,5-bisdiphosphate-2,3,4,6-tetrakisphosphate 1-diphosphatase activity(GO:0052846) inositol-1,5-bisdiphosphate-2,3,4,6-tetrakisphosphate 5-diphosphatase activity(GO:0052847) inositol-3,5-bisdiphosphate-2,3,4,6-tetrakisphosphate 5-diphosphatase activity(GO:0052848) |
| 1.2 | 2.5 | GO:0031697 | beta-1 adrenergic receptor binding(GO:0031697) |
| 1.2 | 9.8 | GO:0008318 | protein prenyltransferase activity(GO:0008318) |
| 1.2 | 22.0 | GO:0102391 | decanoate--CoA ligase activity(GO:0102391) |
| 1.2 | 4.9 | GO:0001632 | leukotriene B4 receptor activity(GO:0001632) |
| 1.2 | 8.5 | GO:0000268 | peroxisome targeting sequence binding(GO:0000268) |
| 1.2 | 4.8 | GO:0005314 | high-affinity glutamate transmembrane transporter activity(GO:0005314) |
| 1.2 | 47.8 | GO:0003785 | actin monomer binding(GO:0003785) |
| 1.2 | 9.6 | GO:0030023 | extracellular matrix constituent conferring elasticity(GO:0030023) |
| 1.2 | 51.4 | GO:0005544 | calcium-dependent phospholipid binding(GO:0005544) |
| 1.2 | 4.7 | GO:0035939 | microsatellite binding(GO:0035939) |
| 1.2 | 10.6 | GO:0004198 | calcium-dependent cysteine-type endopeptidase activity(GO:0004198) |
| 1.2 | 7.0 | GO:0042805 | actinin binding(GO:0042805) |
| 1.2 | 2.3 | GO:0070404 | NADH binding(GO:0070404) |
| 1.2 | 27.0 | GO:0042813 | Wnt-activated receptor activity(GO:0042813) |
| 1.2 | 4.7 | GO:0035374 | chondroitin sulfate binding(GO:0035374) |
| 1.2 | 3.5 | GO:0001007 | transcription factor activity, RNA polymerase III transcription factor binding(GO:0001007) |
| 1.2 | 20.9 | GO:0008519 | ammonium transmembrane transporter activity(GO:0008519) |
| 1.2 | 6.9 | GO:0005332 | gamma-aminobutyric acid:sodium symporter activity(GO:0005332) gamma-aminobutyric acid transmembrane transporter activity(GO:0015185) |
| 1.2 | 13.8 | GO:0005021 | vascular endothelial growth factor-activated receptor activity(GO:0005021) |
| 1.1 | 12.6 | GO:0004568 | chitinase activity(GO:0004568) chitin binding(GO:0008061) |
| 1.1 | 5.7 | GO:0017060 | 3-galactosyl-N-acetylglucosaminide 4-alpha-L-fucosyltransferase activity(GO:0017060) |
| 1.1 | 12.5 | GO:0048407 | platelet-derived growth factor binding(GO:0048407) |
| 1.1 | 30.8 | GO:0015347 | sodium-independent organic anion transmembrane transporter activity(GO:0015347) |
| 1.1 | 4.6 | GO:0050262 | ribosylnicotinamide kinase activity(GO:0050262) ribosylnicotinate kinase activity(GO:0061769) |
| 1.1 | 3.4 | GO:0004961 | thromboxane receptor activity(GO:0004960) thromboxane A2 receptor activity(GO:0004961) |
| 1.1 | 3.4 | GO:0051377 | mannose-ethanolamine phosphotransferase activity(GO:0051377) |
| 1.1 | 3.4 | GO:0005549 | odorant binding(GO:0005549) |
| 1.1 | 3.3 | GO:0008481 | sphinganine kinase activity(GO:0008481) D-erythro-sphingosine kinase activity(GO:0017050) |
| 1.1 | 22.3 | GO:0045504 | dynein heavy chain binding(GO:0045504) |
| 1.1 | 4.4 | GO:0004706 | JUN kinase kinase kinase activity(GO:0004706) |
| 1.1 | 14.4 | GO:0097371 | MDM2/MDM4 family protein binding(GO:0097371) |
| 1.1 | 86.1 | GO:0003707 | steroid hormone receptor activity(GO:0003707) |
| 1.1 | 17.6 | GO:0004190 | aspartic-type endopeptidase activity(GO:0004190) aspartic-type peptidase activity(GO:0070001) |
| 1.1 | 5.5 | GO:0099583 | postsynaptic neurotransmitter receptor activity(GO:0098960) neurotransmitter receptor activity involved in regulation of postsynaptic cytosolic calcium ion concentration(GO:0099583) |
| 1.1 | 14.3 | GO:0047372 | acylglycerol lipase activity(GO:0047372) |
| 1.1 | 12.0 | GO:0008020 | G-protein coupled photoreceptor activity(GO:0008020) |
| 1.1 | 12.0 | GO:0001206 | transcriptional repressor activity, RNA polymerase II distal enhancer sequence-specific binding(GO:0001206) |
| 1.1 | 6.5 | GO:0015184 | L-cystine transmembrane transporter activity(GO:0015184) |
| 1.1 | 5.4 | GO:0004489 | methylenetetrahydrofolate reductase (NAD(P)H) activity(GO:0004489) |
| 1.1 | 9.7 | GO:0004679 | AMP-activated protein kinase activity(GO:0004679) |
| 1.1 | 3.2 | GO:0004965 | G-protein coupled GABA receptor activity(GO:0004965) |
| 1.1 | 11.7 | GO:0017154 | semaphorin receptor activity(GO:0017154) |
| 1.1 | 23.3 | GO:0003841 | 1-acylglycerol-3-phosphate O-acyltransferase activity(GO:0003841) |
| 1.1 | 29.6 | GO:0001972 | retinoic acid binding(GO:0001972) |
| 1.0 | 36.4 | GO:0044183 | protein binding involved in protein folding(GO:0044183) |
| 1.0 | 27.0 | GO:0031489 | myosin V binding(GO:0031489) |
| 1.0 | 3.1 | GO:0004574 | oligo-1,6-glucosidase activity(GO:0004574) |
| 1.0 | 15.5 | GO:0004861 | cyclin-dependent protein serine/threonine kinase inhibitor activity(GO:0004861) |
| 1.0 | 3.1 | GO:0098599 | palmitoyl-(protein) hydrolase activity(GO:0008474) palmitoyl hydrolase activity(GO:0098599) |
| 1.0 | 1.0 | GO:0005315 | inorganic phosphate transmembrane transporter activity(GO:0005315) |
| 1.0 | 50.3 | GO:0070412 | R-SMAD binding(GO:0070412) |
| 1.0 | 9.2 | GO:0055056 | D-glucose transmembrane transporter activity(GO:0055056) |
| 1.0 | 4.1 | GO:0008158 | hedgehog receptor activity(GO:0008158) |
| 1.0 | 5.1 | GO:0000179 | rRNA (adenine-N6,N6-)-dimethyltransferase activity(GO:0000179) |
| 1.0 | 4.0 | GO:0030305 | heparanase activity(GO:0030305) |
| 1.0 | 16.1 | GO:0016769 | transferase activity, transferring nitrogenous groups(GO:0016769) |
| 1.0 | 48.2 | GO:0004984 | olfactory receptor activity(GO:0004984) |
| 1.0 | 3.0 | GO:0070573 | metallodipeptidase activity(GO:0070573) |
| 1.0 | 22.0 | GO:0051371 | muscle alpha-actinin binding(GO:0051371) |
| 1.0 | 77.7 | GO:0008307 | structural constituent of muscle(GO:0008307) |
| 1.0 | 19.8 | GO:0070016 | armadillo repeat domain binding(GO:0070016) |
| 1.0 | 2.0 | GO:1990430 | extracellular matrix protein binding(GO:1990430) |
| 1.0 | 5.9 | GO:0070403 | NAD+ binding(GO:0070403) |
| 1.0 | 12.8 | GO:0019789 | SUMO transferase activity(GO:0019789) |
| 1.0 | 6.9 | GO:0016641 | oxidoreductase activity, acting on the CH-NH2 group of donors, oxygen as acceptor(GO:0016641) |
| 1.0 | 9.8 | GO:0015385 | monovalent cation:proton antiporter activity(GO:0005451) sodium:proton antiporter activity(GO:0015385) potassium:proton antiporter activity(GO:0015386) |
| 1.0 | 25.4 | GO:0005104 | fibroblast growth factor receptor binding(GO:0005104) |
| 1.0 | 44.8 | GO:0030507 | spectrin binding(GO:0030507) |
| 1.0 | 58.2 | GO:0048306 | calcium-dependent protein binding(GO:0048306) |
| 1.0 | 11.6 | GO:0008395 | steroid hydroxylase activity(GO:0008395) |
| 1.0 | 3.9 | GO:0017040 | ceramidase activity(GO:0017040) |
| 0.9 | 22.7 | GO:0016917 | GABA-A receptor activity(GO:0004890) GABA receptor activity(GO:0016917) |
| 0.9 | 5.7 | GO:0015248 | sterol transporter activity(GO:0015248) |
| 0.9 | 12.1 | GO:0048018 | receptor agonist activity(GO:0048018) |
| 0.9 | 6.5 | GO:0003906 | DNA-(apurinic or apyrimidinic site) lyase activity(GO:0003906) |
| 0.9 | 2.8 | GO:0005260 | channel-conductance-controlling ATPase activity(GO:0005260) |
| 0.9 | 20.2 | GO:0004383 | guanylate cyclase activity(GO:0004383) |
| 0.9 | 4.5 | GO:0004723 | calcium-dependent protein serine/threonine phosphatase activity(GO:0004723) |
| 0.9 | 8.1 | GO:0017151 | DEAD/H-box RNA helicase binding(GO:0017151) |
| 0.9 | 4.5 | GO:0044547 | DNA topoisomerase binding(GO:0044547) |
| 0.9 | 9.0 | GO:0017147 | Wnt-protein binding(GO:0017147) |
| 0.9 | 10.7 | GO:0043522 | leucine zipper domain binding(GO:0043522) |
| 0.9 | 9.8 | GO:0015379 | potassium:chloride symporter activity(GO:0015379) potassium ion symporter activity(GO:0022820) |
| 0.9 | 5.3 | GO:0004118 | cGMP-stimulated cyclic-nucleotide phosphodiesterase activity(GO:0004118) |
| 0.9 | 7.0 | GO:0071253 | connexin binding(GO:0071253) |
| 0.9 | 2.6 | GO:0031871 | proteinase activated receptor binding(GO:0031871) |
| 0.9 | 4.4 | GO:0035252 | UDP-xylosyltransferase activity(GO:0035252) xylosyltransferase activity(GO:0042285) |
| 0.9 | 10.5 | GO:0017022 | myosin binding(GO:0017022) |
| 0.9 | 40.0 | GO:0004364 | glutathione transferase activity(GO:0004364) |
| 0.9 | 13.9 | GO:0005523 | tropomyosin binding(GO:0005523) |
| 0.9 | 5.2 | GO:0008597 | calcium-dependent protein serine/threonine phosphatase regulator activity(GO:0008597) |
| 0.9 | 5.2 | GO:0019203 | carbohydrate phosphatase activity(GO:0019203) sugar-phosphatase activity(GO:0050308) |
| 0.9 | 6.0 | GO:0016413 | O-acetyltransferase activity(GO:0016413) |
| 0.9 | 2.6 | GO:0003980 | UDP-glucose:glycoprotein glucosyltransferase activity(GO:0003980) |
| 0.9 | 3.4 | GO:0004862 | cAMP-dependent protein kinase inhibitor activity(GO:0004862) |
| 0.9 | 2.6 | GO:0003846 | 2-acylglycerol O-acyltransferase activity(GO:0003846) |
| 0.8 | 2.5 | GO:0033878 | hormone-sensitive lipase activity(GO:0033878) |
| 0.8 | 4.2 | GO:0061676 | importin-alpha family protein binding(GO:0061676) |
| 0.8 | 2.5 | GO:0008332 | low voltage-gated calcium channel activity(GO:0008332) |
| 0.8 | 92.2 | GO:0004222 | metalloendopeptidase activity(GO:0004222) |
| 0.8 | 16.8 | GO:0008331 | high voltage-gated calcium channel activity(GO:0008331) |
| 0.8 | 10.9 | GO:0097109 | neuroligin family protein binding(GO:0097109) |
| 0.8 | 55.3 | GO:0005201 | extracellular matrix structural constituent(GO:0005201) |
| 0.8 | 4.9 | GO:0035368 | selenocysteine insertion sequence binding(GO:0035368) |
| 0.8 | 4.9 | GO:0003696 | satellite DNA binding(GO:0003696) |
| 0.8 | 6.5 | GO:0050693 | LBD domain binding(GO:0050693) |
| 0.8 | 17.7 | GO:0098641 | cadherin binding involved in cell-cell adhesion(GO:0098641) |
| 0.8 | 1.6 | GO:0034185 | apolipoprotein binding(GO:0034185) |
| 0.8 | 6.3 | GO:0047499 | calcium-independent phospholipase A2 activity(GO:0047499) |
| 0.8 | 5.5 | GO:0043426 | MRF binding(GO:0043426) |
| 0.8 | 2.4 | GO:0004769 | steroid delta-isomerase activity(GO:0004769) |
| 0.8 | 1.5 | GO:0005522 | profilin binding(GO:0005522) |
| 0.8 | 2.3 | GO:0034191 | apolipoprotein A-I receptor binding(GO:0034191) |
| 0.8 | 11.6 | GO:0052744 | phosphatidylinositol-3-phosphatase activity(GO:0004438) phosphatidylinositol monophosphate phosphatase activity(GO:0052744) |
| 0.8 | 36.9 | GO:0004114 | 3',5'-cyclic-nucleotide phosphodiesterase activity(GO:0004114) |
| 0.8 | 2.3 | GO:0046920 | alpha-(1->3)-fucosyltransferase activity(GO:0046920) |
| 0.8 | 11.3 | GO:0008409 | 5'-3' exonuclease activity(GO:0008409) |
| 0.8 | 3.8 | GO:0046974 | histone methyltransferase activity (H3-K9 specific)(GO:0046974) |
| 0.7 | 2.2 | GO:0046997 | sarcosine dehydrogenase activity(GO:0008480) oxidoreductase activity, acting on the CH-NH group of donors, flavin as acceptor(GO:0046997) |
| 0.7 | 6.7 | GO:0097642 | calcitonin family receptor activity(GO:0097642) |
| 0.7 | 3.7 | GO:0005030 | neurotrophin receptor activity(GO:0005030) |
| 0.7 | 10.2 | GO:0015278 | calcium-release channel activity(GO:0015278) ligand-gated calcium channel activity(GO:0099604) |
| 0.7 | 5.8 | GO:0015643 | toxic substance binding(GO:0015643) |
| 0.7 | 3.6 | GO:0044729 | hemi-methylated DNA-binding(GO:0044729) |
| 0.7 | 2.1 | GO:0070984 | SET domain binding(GO:0070984) |
| 0.7 | 2.1 | GO:0005497 | androgen binding(GO:0005497) |
| 0.7 | 9.2 | GO:0017162 | aryl hydrocarbon receptor binding(GO:0017162) |
| 0.7 | 156.8 | GO:0004252 | serine-type endopeptidase activity(GO:0004252) |
| 0.7 | 7.1 | GO:0008374 | O-acyltransferase activity(GO:0008374) |
| 0.7 | 2.1 | GO:0004781 | adenylylsulfate kinase activity(GO:0004020) sulfate adenylyltransferase activity(GO:0004779) sulfate adenylyltransferase (ATP) activity(GO:0004781) |
| 0.7 | 3.5 | GO:0030628 | pre-mRNA 3'-splice site binding(GO:0030628) |
| 0.7 | 5.6 | GO:0051864 | histone demethylase activity (H3-K36 specific)(GO:0051864) |
| 0.7 | 16.5 | GO:0019865 | immunoglobulin binding(GO:0019865) |
| 0.7 | 3.4 | GO:0031690 | adrenergic receptor binding(GO:0031690) |
| 0.7 | 3.4 | GO:0004991 | parathyroid hormone receptor activity(GO:0004991) |
| 0.7 | 2.0 | GO:0005174 | CD40 receptor binding(GO:0005174) |
| 0.7 | 2.6 | GO:0005246 | calcium channel regulator activity(GO:0005246) |
| 0.7 | 3.3 | GO:0003956 | NAD(P)+-protein-arginine ADP-ribosyltransferase activity(GO:0003956) |
| 0.7 | 2.0 | GO:0061752 | telomeric repeat-containing RNA binding(GO:0061752) |
| 0.7 | 0.7 | GO:0000405 | bubble DNA binding(GO:0000405) |
| 0.7 | 5.9 | GO:0004859 | phospholipase inhibitor activity(GO:0004859) |
| 0.7 | 5.9 | GO:0004435 | phosphatidylinositol phospholipase C activity(GO:0004435) |
| 0.7 | 9.8 | GO:0017075 | syntaxin-1 binding(GO:0017075) |
| 0.7 | 3.9 | GO:0004707 | MAP kinase activity(GO:0004707) |
| 0.6 | 21.4 | GO:0031683 | G-protein beta/gamma-subunit complex binding(GO:0031683) |
| 0.6 | 1.9 | GO:0008502 | melatonin receptor activity(GO:0008502) |
| 0.6 | 1.9 | GO:0004967 | glucagon receptor activity(GO:0004967) |
| 0.6 | 14.8 | GO:0019198 | transmembrane receptor protein tyrosine phosphatase activity(GO:0005001) transmembrane receptor protein phosphatase activity(GO:0019198) |
| 0.6 | 2.6 | GO:0005499 | vitamin D binding(GO:0005499) |
| 0.6 | 10.2 | GO:0004535 | poly(A)-specific ribonuclease activity(GO:0004535) |
| 0.6 | 1.9 | GO:0000990 | transcription factor activity, core RNA polymerase binding(GO:0000990) |
| 0.6 | 6.4 | GO:0017128 | phospholipid scramblase activity(GO:0017128) |
| 0.6 | 3.2 | GO:0070568 | guanylyltransferase activity(GO:0070568) |
| 0.6 | 3.8 | GO:0031705 | bombesin receptor binding(GO:0031705) |
| 0.6 | 1.9 | GO:0004833 | tryptophan 2,3-dioxygenase activity(GO:0004833) |
| 0.6 | 18.2 | GO:0015026 | coreceptor activity(GO:0015026) |
| 0.6 | 9.9 | GO:0031005 | filamin binding(GO:0031005) |
| 0.6 | 3.1 | GO:0004522 | ribonuclease A activity(GO:0004522) |
| 0.6 | 14.2 | GO:0004012 | phospholipid-translocating ATPase activity(GO:0004012) |
| 0.6 | 4.3 | GO:0015144 | carbohydrate transmembrane transporter activity(GO:0015144) carbohydrate transporter activity(GO:1901476) |
| 0.6 | 3.0 | GO:0036312 | phosphatidylinositol 3-kinase regulatory subunit binding(GO:0036312) |
| 0.6 | 3.0 | GO:0015056 | corticotrophin-releasing factor receptor activity(GO:0015056) |
| 0.6 | 4.2 | GO:0008271 | secondary active sulfate transmembrane transporter activity(GO:0008271) |
| 0.6 | 15.2 | GO:0005159 | insulin-like growth factor receptor binding(GO:0005159) |
| 0.6 | 1.2 | GO:0034481 | chondroitin sulfotransferase activity(GO:0034481) 3'-phosphoadenosine 5'-phosphosulfate binding(GO:0050656) |
| 0.6 | 7.0 | GO:0005545 | 1-phosphatidylinositol binding(GO:0005545) |
| 0.6 | 1.7 | GO:0047757 | chondroitin-glucuronate 5-epimerase activity(GO:0047757) |
| 0.6 | 6.4 | GO:0005243 | gap junction channel activity(GO:0005243) |
| 0.6 | 1.7 | GO:0042015 | interleukin-20 binding(GO:0042015) |
| 0.6 | 10.9 | GO:0008191 | metalloendopeptidase inhibitor activity(GO:0008191) |
| 0.6 | 2.3 | GO:0097001 | ceramide binding(GO:0097001) |
| 0.6 | 1.1 | GO:0098770 | FBXO family protein binding(GO:0098770) |
| 0.6 | 11.9 | GO:0071837 | HMG box domain binding(GO:0071837) |
| 0.6 | 6.8 | GO:0017017 | MAP kinase tyrosine/serine/threonine phosphatase activity(GO:0017017) |
| 0.6 | 1.7 | GO:0000822 | inositol hexakisphosphate binding(GO:0000822) |
| 0.6 | 1.1 | GO:0016639 | oxidoreductase activity, acting on the CH-NH2 group of donors, NAD or NADP as acceptor(GO:0016639) |
| 0.6 | 9.6 | GO:0015467 | G-protein activated inward rectifier potassium channel activity(GO:0015467) |
| 0.6 | 20.0 | GO:0004714 | transmembrane receptor protein tyrosine kinase activity(GO:0004714) |
| 0.6 | 10.0 | GO:0043015 | gamma-tubulin binding(GO:0043015) |
| 0.5 | 1.6 | GO:0042030 | ATPase inhibitor activity(GO:0042030) |
| 0.5 | 2.7 | GO:0008172 | S-methyltransferase activity(GO:0008172) |
| 0.5 | 3.3 | GO:1903135 | cupric ion binding(GO:1903135) |
| 0.5 | 9.8 | GO:0015106 | bicarbonate transmembrane transporter activity(GO:0015106) |
| 0.5 | 9.2 | GO:0016303 | 1-phosphatidylinositol-3-kinase activity(GO:0016303) |
| 0.5 | 8.6 | GO:0015271 | outward rectifier potassium channel activity(GO:0015271) |
| 0.5 | 3.2 | GO:0051033 | nucleic acid transmembrane transporter activity(GO:0051032) RNA transmembrane transporter activity(GO:0051033) |
| 0.5 | 14.9 | GO:0008198 | ferrous iron binding(GO:0008198) |
| 0.5 | 8.5 | GO:0050321 | tau-protein kinase activity(GO:0050321) |
| 0.5 | 12.1 | GO:0046875 | ephrin receptor binding(GO:0046875) |
| 0.5 | 7.3 | GO:0047617 | acyl-CoA hydrolase activity(GO:0047617) |
| 0.5 | 3.1 | GO:0030276 | clathrin binding(GO:0030276) |
| 0.5 | 3.1 | GO:0052742 | phosphatidylinositol kinase activity(GO:0052742) |
| 0.5 | 2.6 | GO:0003836 | beta-galactoside (CMP) alpha-2,3-sialyltransferase activity(GO:0003836) |
| 0.5 | 5.5 | GO:0043422 | protein kinase B binding(GO:0043422) |
| 0.5 | 21.4 | GO:0017080 | sodium channel regulator activity(GO:0017080) |
| 0.5 | 73.2 | GO:0017137 | Rab GTPase binding(GO:0017137) |
| 0.5 | 1.5 | GO:0008424 | glycoprotein 6-alpha-L-fucosyltransferase activity(GO:0008424) alpha-(1->6)-fucosyltransferase activity(GO:0046921) |
| 0.5 | 4.3 | GO:0060229 | phospholipase activator activity(GO:0016004) lipase activator activity(GO:0060229) |
| 0.5 | 1.9 | GO:0017127 | cholesterol transporter activity(GO:0017127) |
| 0.5 | 2.4 | GO:0017018 | myosin phosphatase activity(GO:0017018) |
| 0.5 | 15.3 | GO:0031624 | ubiquitin conjugating enzyme binding(GO:0031624) |
| 0.5 | 2.8 | GO:0008569 | ATP-dependent microtubule motor activity, minus-end-directed(GO:0008569) |
| 0.5 | 20.3 | GO:0051539 | 4 iron, 4 sulfur cluster binding(GO:0051539) |
| 0.5 | 4.6 | GO:0003995 | acyl-CoA dehydrogenase activity(GO:0003995) |
| 0.5 | 2.3 | GO:0003796 | lysozyme activity(GO:0003796) |
| 0.5 | 1.8 | GO:0004351 | glutamate decarboxylase activity(GO:0004351) |
| 0.4 | 4.5 | GO:0008429 | phosphatidylethanolamine binding(GO:0008429) |
| 0.4 | 1.3 | GO:0090482 | vitamin transmembrane transporter activity(GO:0090482) |
| 0.4 | 4.0 | GO:0032051 | clathrin light chain binding(GO:0032051) |
| 0.4 | 3.5 | GO:0004957 | prostaglandin E receptor activity(GO:0004957) |
| 0.4 | 10.9 | GO:0005086 | ARF guanyl-nucleotide exchange factor activity(GO:0005086) |
| 0.4 | 1.7 | GO:0050119 | N-acetylglucosamine deacetylase activity(GO:0050119) |
| 0.4 | 3.9 | GO:0003910 | DNA ligase (ATP) activity(GO:0003910) |
| 0.4 | 7.7 | GO:0051959 | dynein light intermediate chain binding(GO:0051959) |
| 0.4 | 2.9 | GO:0004996 | thyroid-stimulating hormone receptor activity(GO:0004996) |
| 0.4 | 1.2 | GO:0055102 | lipase inhibitor activity(GO:0055102) |
| 0.4 | 2.9 | GO:0005172 | vascular endothelial growth factor receptor binding(GO:0005172) |
| 0.4 | 26.7 | GO:0005179 | hormone activity(GO:0005179) |
| 0.4 | 3.7 | GO:0004971 | AMPA glutamate receptor activity(GO:0004971) |
| 0.4 | 5.7 | GO:1905030 | voltage-gated sodium channel activity(GO:0005248) voltage-gated ion channel activity involved in regulation of postsynaptic membrane potential(GO:1905030) |
| 0.4 | 1.6 | GO:0004955 | prostaglandin receptor activity(GO:0004955) |
| 0.4 | 4.0 | GO:0004767 | sphingomyelin phosphodiesterase activity(GO:0004767) |
| 0.4 | 5.1 | GO:0015279 | store-operated calcium channel activity(GO:0015279) |
| 0.4 | 9.9 | GO:0016706 | oxidoreductase activity, acting on paired donors, with incorporation or reduction of molecular oxygen, 2-oxoglutarate as one donor, and incorporation of one atom each of oxygen into both donors(GO:0016706) |
| 0.4 | 1.2 | GO:0047696 | beta-adrenergic receptor kinase activity(GO:0047696) |
| 0.4 | 12.5 | GO:0051721 | protein phosphatase 2A binding(GO:0051721) |
| 0.4 | 2.3 | GO:1900750 | glutathione binding(GO:0043295) oligopeptide binding(GO:1900750) |
| 0.4 | 4.6 | GO:0004017 | adenylate kinase activity(GO:0004017) |
| 0.4 | 2.6 | GO:0004969 | histamine receptor activity(GO:0004969) |
| 0.4 | 1.1 | GO:0002113 | interleukin-33 binding(GO:0002113) |
| 0.4 | 7.0 | GO:0004497 | monooxygenase activity(GO:0004497) |
| 0.4 | 8.7 | GO:0005035 | tumor necrosis factor-activated receptor activity(GO:0005031) death receptor activity(GO:0005035) |
| 0.4 | 2.2 | GO:0005221 | intracellular cyclic nucleotide activated cation channel activity(GO:0005221) cyclic nucleotide-gated ion channel activity(GO:0043855) |
| 0.4 | 3.3 | GO:0008526 | phosphatidylinositol transporter activity(GO:0008526) |
| 0.4 | 1.1 | GO:0032422 | purine-rich negative regulatory element binding(GO:0032422) |
| 0.3 | 1.0 | GO:0015116 | sulfate transmembrane transporter activity(GO:0015116) thiosulfate transmembrane transporter activity(GO:0015117) oxaloacetate transmembrane transporter activity(GO:0015131) |
| 0.3 | 1.4 | GO:0015299 | solute:proton antiporter activity(GO:0015299) |
| 0.3 | 1.4 | GO:0070905 | serine binding(GO:0070905) |
| 0.3 | 2.1 | GO:0005261 | cation channel activity(GO:0005261) |
| 0.3 | 1.4 | GO:0035325 | Toll-like receptor binding(GO:0035325) |
| 0.3 | 2.3 | GO:0015491 | cation:cation antiporter activity(GO:0015491) |
| 0.3 | 2.3 | GO:0016783 | sulfurtransferase activity(GO:0016783) |
| 0.3 | 18.2 | GO:0005262 | calcium channel activity(GO:0005262) |
| 0.3 | 1.3 | GO:0008296 | 3'-5'-exodeoxyribonuclease activity(GO:0008296) |
| 0.3 | 2.0 | GO:0008440 | inositol-1,4,5-trisphosphate 3-kinase activity(GO:0008440) |
| 0.3 | 1.6 | GO:0034483 | heparan sulfate sulfotransferase activity(GO:0034483) |
| 0.3 | 0.3 | GO:0045505 | dynein intermediate chain binding(GO:0045505) |
| 0.3 | 1.0 | GO:0035727 | lysophosphatidic acid binding(GO:0035727) |
| 0.3 | 5.5 | GO:0043425 | bHLH transcription factor binding(GO:0043425) |
| 0.3 | 1.6 | GO:0010385 | double-stranded methylated DNA binding(GO:0010385) |
| 0.3 | 1.0 | GO:0004376 | glycolipid mannosyltransferase activity(GO:0004376) |
| 0.3 | 1.9 | GO:0009378 | four-way junction helicase activity(GO:0009378) |
| 0.3 | 1.2 | GO:0072320 | volume-sensitive chloride channel activity(GO:0072320) |
| 0.3 | 14.0 | GO:0017112 | Rab guanyl-nucleotide exchange factor activity(GO:0017112) |
| 0.3 | 2.1 | GO:0001042 | RNA polymerase I core binding(GO:0001042) |
| 0.3 | 4.9 | GO:0008320 | protein transmembrane transporter activity(GO:0008320) |
| 0.3 | 1.2 | GO:0070139 | ubiquitin-like protein-specific endopeptidase activity(GO:0070137) SUMO-specific endopeptidase activity(GO:0070139) |
| 0.3 | 1.5 | GO:0032050 | clathrin heavy chain binding(GO:0032050) |
| 0.3 | 1.8 | GO:0019855 | calcium channel inhibitor activity(GO:0019855) |
| 0.3 | 6.6 | GO:0008157 | protein phosphatase 1 binding(GO:0008157) |
| 0.3 | 3.4 | GO:0016702 | oxidoreductase activity, acting on single donors with incorporation of molecular oxygen, incorporation of two atoms of oxygen(GO:0016702) |
| 0.3 | 2.5 | GO:0030506 | ankyrin binding(GO:0030506) |
| 0.3 | 26.1 | GO:0005516 | calmodulin binding(GO:0005516) |
| 0.3 | 3.6 | GO:0004806 | triglyceride lipase activity(GO:0004806) |
| 0.3 | 1.4 | GO:0046790 | virion binding(GO:0046790) |
| 0.3 | 1.1 | GO:0016499 | orexin receptor activity(GO:0016499) |
| 0.3 | 2.4 | GO:0032027 | myosin light chain binding(GO:0032027) |
| 0.3 | 1.9 | GO:1990381 | ubiquitin-specific protease binding(GO:1990381) |
| 0.3 | 140.6 | GO:0005509 | calcium ion binding(GO:0005509) |
| 0.3 | 5.2 | GO:0000146 | microfilament motor activity(GO:0000146) |
| 0.3 | 1.5 | GO:0003886 | DNA (cytosine-5-)-methyltransferase activity(GO:0003886) |
| 0.3 | 2.6 | GO:0030884 | lipid antigen binding(GO:0030882) endogenous lipid antigen binding(GO:0030883) exogenous lipid antigen binding(GO:0030884) |
| 0.2 | 0.7 | GO:0030377 | urokinase plasminogen activator receptor activity(GO:0030377) |
| 0.2 | 1.2 | GO:0004982 | N-formyl peptide receptor activity(GO:0004982) |
| 0.2 | 0.7 | GO:0004603 | phenylethanolamine N-methyltransferase activity(GO:0004603) |
| 0.2 | 1.9 | GO:0071933 | Arp2/3 complex binding(GO:0071933) |
| 0.2 | 2.1 | GO:0030306 | ADP-ribosylation factor binding(GO:0030306) |
| 0.2 | 0.5 | GO:0030109 | HLA-B specific inhibitory MHC class I receptor activity(GO:0030109) inhibitory MHC class I receptor activity(GO:0032396) |
| 0.2 | 34.0 | GO:0001078 | transcriptional repressor activity, RNA polymerase II core promoter proximal region sequence-specific binding(GO:0001078) |
| 0.2 | 0.2 | GO:0051185 | coenzyme transporter activity(GO:0051185) |
| 0.2 | 3.2 | GO:0008179 | adenylate cyclase binding(GO:0008179) |
| 0.2 | 2.3 | GO:0001608 | G-protein coupled nucleotide receptor activity(GO:0001608) G-protein coupled purinergic nucleotide receptor activity(GO:0045028) |
| 0.2 | 20.2 | GO:0005089 | Rho guanyl-nucleotide exchange factor activity(GO:0005089) |
| 0.2 | 0.2 | GO:0005343 | organic acid:sodium symporter activity(GO:0005343) |
| 0.2 | 1.3 | GO:0016312 | inositol bisphosphate phosphatase activity(GO:0016312) |
| 0.2 | 4.0 | GO:0015085 | calcium ion transmembrane transporter activity(GO:0015085) |
| 0.2 | 2.3 | GO:0015459 | potassium channel regulator activity(GO:0015459) |
| 0.2 | 4.8 | GO:0004532 | exoribonuclease activity(GO:0004532) |
| 0.2 | 1.9 | GO:0004305 | ethanolamine kinase activity(GO:0004305) |
| 0.2 | 225.8 | GO:0001071 | nucleic acid binding transcription factor activity(GO:0001071) transcription factor activity, sequence-specific DNA binding(GO:0003700) |
| 0.2 | 1.0 | GO:0044736 | acid-sensing ion channel activity(GO:0044736) |
| 0.2 | 5.0 | GO:0046934 | phosphatidylinositol-4,5-bisphosphate 3-kinase activity(GO:0046934) |
| 0.2 | 6.5 | GO:0042169 | SH2 domain binding(GO:0042169) |
| 0.2 | 2.0 | GO:0005078 | MAP-kinase scaffold activity(GO:0005078) |
| 0.2 | 1.3 | GO:0097322 | 7SK snRNA binding(GO:0097322) |
| 0.2 | 1.5 | GO:1990932 | 5.8S rRNA binding(GO:1990932) |
| 0.2 | 1.5 | GO:0004111 | creatine kinase activity(GO:0004111) |
| 0.2 | 0.2 | GO:0050508 | glucuronosyl-N-acetylglucosaminyl-proteoglycan 4-alpha-N-acetylglucosaminyltransferase activity(GO:0050508) |
| 0.2 | 0.5 | GO:0038187 | signaling pattern recognition receptor activity(GO:0008329) pattern recognition receptor activity(GO:0038187) |
| 0.2 | 2.0 | GO:0004745 | retinol dehydrogenase activity(GO:0004745) |
| 0.2 | 0.4 | GO:0016422 | mRNA (2'-O-methyladenosine-N6-)-methyltransferase activity(GO:0016422) |
| 0.2 | 0.5 | GO:0004694 | eukaryotic translation initiation factor 2alpha kinase activity(GO:0004694) |
| 0.2 | 6.0 | GO:0022843 | voltage-gated cation channel activity(GO:0022843) |
| 0.2 | 0.5 | GO:0001025 | RNA polymerase III transcription factor binding(GO:0001025) |
| 0.2 | 1.1 | GO:0042043 | neurexin family protein binding(GO:0042043) |
| 0.2 | 3.4 | GO:0005158 | insulin receptor binding(GO:0005158) |
| 0.2 | 1.2 | GO:0005328 | neurotransmitter:sodium symporter activity(GO:0005328) |
| 0.1 | 4.0 | GO:0005057 | receptor signaling protein activity(GO:0005057) |
| 0.1 | 0.4 | GO:0033743 | peptide-methionine (R)-S-oxide reductase activity(GO:0033743) |
| 0.1 | 3.0 | GO:0008066 | glutamate receptor activity(GO:0008066) |
| 0.1 | 2.1 | GO:0001103 | RNA polymerase II repressing transcription factor binding(GO:0001103) |
| 0.1 | 0.7 | GO:0031434 | mitogen-activated protein kinase kinase binding(GO:0031434) |
| 0.1 | 1.0 | GO:0070064 | proline-rich region binding(GO:0070064) |
| 0.1 | 0.8 | GO:0034452 | dynactin binding(GO:0034452) |
| 0.1 | 1.9 | GO:0015095 | magnesium ion transmembrane transporter activity(GO:0015095) |
| 0.1 | 1.9 | GO:0015276 | ligand-gated ion channel activity(GO:0015276) ligand-gated channel activity(GO:0022834) |
| 0.1 | 0.7 | GO:0097016 | L27 domain binding(GO:0097016) |
| 0.1 | 2.8 | GO:0005109 | frizzled binding(GO:0005109) |
| 0.1 | 2.7 | GO:0004708 | MAP kinase kinase activity(GO:0004708) |
| 0.1 | 1.7 | GO:0004653 | polypeptide N-acetylgalactosaminyltransferase activity(GO:0004653) |
| 0.1 | 0.1 | GO:0032181 | heteroduplex DNA loop binding(GO:0000404) double-strand/single-strand DNA junction binding(GO:0000406) dinucleotide repeat insertion binding(GO:0032181) |
| 0.1 | 1.9 | GO:0070006 | metalloaminopeptidase activity(GO:0070006) |
| 0.1 | 1.0 | GO:0015174 | basic amino acid transmembrane transporter activity(GO:0015174) |
| 0.1 | 0.3 | GO:0004605 | phosphatidate cytidylyltransferase activity(GO:0004605) |
| 0.1 | 0.3 | GO:0047429 | nucleoside-triphosphate diphosphatase activity(GO:0047429) |
| 0.1 | 0.3 | GO:0004105 | choline-phosphate cytidylyltransferase activity(GO:0004105) |
| 0.1 | 0.4 | GO:0042019 | interleukin-23 binding(GO:0042019) interleukin-23 receptor activity(GO:0042020) |
| 0.1 | 0.8 | GO:0017034 | Rap guanyl-nucleotide exchange factor activity(GO:0017034) |
| 0.1 | 2.2 | GO:0004950 | G-protein coupled chemoattractant receptor activity(GO:0001637) chemokine receptor activity(GO:0004950) |
| 0.1 | 1.3 | GO:0005132 | type I interferon receptor binding(GO:0005132) |
| 0.1 | 1.8 | GO:0003887 | DNA-directed DNA polymerase activity(GO:0003887) |
| 0.1 | 0.9 | GO:1990841 | promoter-specific chromatin binding(GO:1990841) |
| 0.1 | 1.9 | GO:0030552 | cAMP binding(GO:0030552) |
| 0.1 | 0.3 | GO:0019166 | trans-2-enoyl-CoA reductase (NADPH) activity(GO:0019166) |
| 0.1 | 0.7 | GO:0005310 | dicarboxylic acid transmembrane transporter activity(GO:0005310) |
| 0.1 | 0.8 | GO:0004908 | interleukin-1 receptor activity(GO:0004908) |
| 0.1 | 0.3 | GO:0004594 | pantothenate kinase activity(GO:0004594) |
| 0.1 | 1.4 | GO:0015020 | glucuronosyltransferase activity(GO:0015020) |
| 0.1 | 2.0 | GO:0005254 | chloride channel activity(GO:0005254) |
| 0.1 | 0.6 | GO:0070840 | dynein complex binding(GO:0070840) |
| 0.1 | 0.3 | GO:0045125 | bioactive lipid receptor activity(GO:0045125) |
| 0.1 | 1.2 | GO:0042165 | neurotransmitter binding(GO:0042165) |
| 0.1 | 0.4 | GO:0035198 | miRNA binding(GO:0035198) |
| 0.1 | 0.7 | GO:0022839 | ion gated channel activity(GO:0022839) |
| 0.1 | 0.4 | GO:0005547 | phosphatidylinositol-3,4,5-trisphosphate binding(GO:0005547) |
| 0.1 | 0.2 | GO:0052794 | exo-alpha-(2->3)-sialidase activity(GO:0052794) exo-alpha-(2->6)-sialidase activity(GO:0052795) exo-alpha-(2->8)-sialidase activity(GO:0052796) |
| 0.1 | 0.5 | GO:0005112 | Notch binding(GO:0005112) |
| 0.0 | 0.4 | GO:0030159 | receptor signaling complex scaffold activity(GO:0030159) |
| 0.0 | 1.1 | GO:0046915 | transition metal ion transmembrane transporter activity(GO:0046915) |
| 0.0 | 0.2 | GO:0004690 | cyclic nucleotide-dependent protein kinase activity(GO:0004690) |
| 0.0 | 1.1 | GO:0004709 | MAP kinase kinase kinase activity(GO:0004709) |
| 0.0 | 1.0 | GO:0001540 | beta-amyloid binding(GO:0001540) |
| 0.0 | 0.5 | GO:0071889 | 14-3-3 protein binding(GO:0071889) |
| 0.0 | 0.2 | GO:0000293 | ferric-chelate reductase activity(GO:0000293) |
| 0.0 | 0.1 | GO:0003835 | beta-galactoside alpha-2,6-sialyltransferase activity(GO:0003835) |
| 0.0 | 6.0 | GO:0004930 | G-protein coupled receptor activity(GO:0004930) |
| 0.0 | 4.2 | GO:0005085 | guanyl-nucleotide exchange factor activity(GO:0005085) |
| 0.0 | 0.2 | GO:0008376 | acetylgalactosaminyltransferase activity(GO:0008376) |
| 0.0 | 0.4 | GO:0008081 | phosphoric diester hydrolase activity(GO:0008081) |
| 0.0 | 0.1 | GO:0019211 | phosphatase activator activity(GO:0019211) |
| 0.0 | 1.5 | GO:0008080 | N-acetyltransferase activity(GO:0008080) |
| 0.0 | 0.1 | GO:0005477 | pyruvate secondary active transmembrane transporter activity(GO:0005477) |
| 0.0 | 0.0 | GO:0030249 | cyclase regulator activity(GO:0010851) guanylate cyclase regulator activity(GO:0030249) |
| 0.0 | 0.4 | GO:0032266 | phosphatidylinositol-3-phosphate binding(GO:0032266) |
| 0.0 | 0.2 | GO:0004873 | asialoglycoprotein receptor activity(GO:0004873) |
| 0.0 | 0.1 | GO:0050833 | pyruvate transmembrane transporter activity(GO:0050833) |
Gene overrepresentation in C2:CP category:
| Log-likelihood per target | Total log-likelihood | Term | Description |
|---|---|---|---|
| 4.9 | 4.9 | ST INTERFERON GAMMA PATHWAY | Interferon gamma pathway. |
| 2.7 | 32.7 | ST JAK STAT PATHWAY | Jak-STAT Pathway |
| 2.1 | 60.8 | PID S1P S1P2 PATHWAY | S1P2 pathway |
| 1.8 | 104.3 | SIG CD40PATHWAYMAP | Genes related to CD40 signaling |
| 1.8 | 426.0 | NABA ECM GLYCOPROTEINS | Genes encoding structural ECM glycoproteins |
| 1.8 | 33.6 | NABA BASEMENT MEMBRANES | Genes encoding structural components of basement membranes |
| 1.7 | 297.4 | NABA ECM AFFILIATED | Genes encoding proteins affiliated structurally or functionally to extracellular matrix proteins |
| 1.7 | 59.7 | ST WNT CA2 CYCLIC GMP PATHWAY | Wnt/Ca2+/cyclic GMP signaling. |
| 1.6 | 30.4 | ST GAQ PATHWAY | G alpha q Pathway |
| 1.5 | 3.1 | PID IL27 PATHWAY | IL27-mediated signaling events |
| 1.5 | 15.4 | ST ADRENERGIC | Adrenergic Pathway |
| 1.5 | 104.6 | PID AMB2 NEUTROPHILS PATHWAY | amb2 Integrin signaling |
| 1.4 | 364.9 | NABA ECM REGULATORS | Genes encoding enzymes and their regulators involved in the remodeling of the extracellular matrix |
| 1.4 | 32.3 | ST MYOCYTE AD PATHWAY | Myocyte Adrenergic Pathway is a specific case of the generalized Adrenergic Pathway. |
| 1.3 | 24.2 | PID LPA4 PATHWAY | LPA4-mediated signaling events |
| 1.2 | 28.2 | PID ERB GENOMIC PATHWAY | Validated nuclear estrogen receptor beta network |
| 1.1 | 77.3 | PID HNF3B PATHWAY | FOXA2 and FOXA3 transcription factor networks |
| 1.0 | 5.2 | PID AR NONGENOMIC PATHWAY | Nongenotropic Androgen signaling |
| 1.0 | 23.1 | SA PROGRAMMED CELL DEATH | Programmed cell death, or apoptosis, eliminates damaged or unneeded cells. |
| 1.0 | 52.3 | NABA PROTEOGLYCANS | Genes encoding proteoglycans |
| 0.9 | 4.6 | PID CD40 PATHWAY | CD40/CD40L signaling |
| 0.9 | 16.8 | PID VEGF VEGFR PATHWAY | VEGF and VEGFR signaling network |
| 0.9 | 25.3 | NABA COLLAGENS | Genes encoding collagen proteins |
| 0.9 | 6.8 | PID ECADHERIN KERATINOCYTE PATHWAY | E-cadherin signaling in keratinocytes |
| 0.8 | 21.2 | ST WNT BETA CATENIN PATHWAY | Wnt/beta-catenin Pathway |
| 0.8 | 19.5 | PID INTEGRIN1 PATHWAY | Beta1 integrin cell surface interactions |
| 0.8 | 34.1 | PID NCADHERIN PATHWAY | N-cadherin signaling events |
| 0.8 | 6.2 | PID FRA PATHWAY | Validated transcriptional targets of AP1 family members Fra1 and Fra2 |
| 0.8 | 19.0 | SIG INSULIN RECEPTOR PATHWAY IN CARDIAC MYOCYTES | Genes related to the insulin receptor pathway |
| 0.7 | 12.0 | PID NECTIN PATHWAY | Nectin adhesion pathway |
| 0.7 | 17.6 | PID EPHA FWDPATHWAY | EPHA forward signaling |
| 0.7 | 16.7 | PID BETA CATENIN DEG PATHWAY | Degradation of beta catenin |
| 0.7 | 18.0 | ST DIFFERENTIATION PATHWAY IN PC12 CELLS | Differentiation Pathway in PC12 Cells; this is a specific case of PAC1 Receptor Pathway. |
| 0.7 | 7.0 | PID ALK1 PATHWAY | ALK1 signaling events |
| 0.7 | 15.2 | PID CONE PATHWAY | Visual signal transduction: Cones |
| 0.7 | 12.8 | PID ANGIOPOIETIN RECEPTOR PATHWAY | Angiopoietin receptor Tie2-mediated signaling |
| 0.6 | 5.1 | PID ERBB2 ERBB3 PATHWAY | ErbB2/ErbB3 signaling events |
| 0.6 | 11.9 | PID ALK2 PATHWAY | ALK2 signaling events |
| 0.6 | 14.9 | PID MAPK TRK PATHWAY | Trk receptor signaling mediated by the MAPK pathway |
| 0.6 | 8.1 | ST GA13 PATHWAY | G alpha 13 Pathway |
| 0.6 | 15.4 | PID NETRIN PATHWAY | Netrin-mediated signaling events |
| 0.6 | 12.9 | ST GA12 PATHWAY | G alpha 12 Pathway |
| 0.6 | 4.3 | PID INTEGRIN4 PATHWAY | Alpha6 beta4 integrin-ligand interactions |
| 0.6 | 20.4 | PID SHP2 PATHWAY | SHP2 signaling |
| 0.6 | 226.6 | NABA MATRISOME | Ensemble of genes encoding extracellular matrix and extracellular matrix-associated proteins |
| 0.6 | 4.1 | PID EPHB FWD PATHWAY | EPHB forward signaling |
| 0.6 | 15.7 | ST JNK MAPK PATHWAY | JNK MAPK Pathway |
| 0.6 | 6.9 | PID CXCR3 PATHWAY | CXCR3-mediated signaling events |
| 0.6 | 9.2 | PID RET PATHWAY | Signaling events regulated by Ret tyrosine kinase |
| 0.6 | 3.9 | PID IL6 7 PATHWAY | IL6-mediated signaling events |
| 0.6 | 14.5 | PID FGF PATHWAY | FGF signaling pathway |
| 0.5 | 5.4 | PID UPA UPAR PATHWAY | Urokinase-type plasminogen activator (uPA) and uPAR-mediated signaling |
| 0.5 | 9.7 | PID SMAD2 3NUCLEAR PATHWAY | Regulation of nuclear SMAD2/3 signaling |
| 0.5 | 6.5 | PID RHODOPSIN PATHWAY | Visual signal transduction: Rods |
| 0.5 | 5.5 | PID ATF2 PATHWAY | ATF-2 transcription factor network |
| 0.5 | 16.3 | PID HDAC CLASSIII PATHWAY | Signaling events mediated by HDAC Class III |
| 0.5 | 11.0 | PID ER NONGENOMIC PATHWAY | Plasma membrane estrogen receptor signaling |
| 0.4 | 15.5 | PID RXR VDR PATHWAY | RXR and RAR heterodimerization with other nuclear receptor |
| 0.4 | 41.0 | PID MYC REPRESS PATHWAY | Validated targets of C-MYC transcriptional repression |
| 0.4 | 20.4 | PID MTOR 4PATHWAY | mTOR signaling pathway |
| 0.4 | 7.9 | PID LYSOPHOSPHOLIPID PATHWAY | LPA receptor mediated events |
| 0.3 | 26.2 | PID AP1 PATHWAY | AP-1 transcription factor network |
| 0.3 | 2.3 | PID SYNDECAN 4 PATHWAY | Syndecan-4-mediated signaling events |
| 0.3 | 18.8 | PID REG GR PATHWAY | Glucocorticoid receptor regulatory network |
| 0.3 | 1.8 | SA PTEN PATHWAY | PTEN is a tumor suppressor that dephosphorylates the lipid messenger phosphatidylinositol triphosphate. |
| 0.3 | 7.5 | PID A6B1 A6B4 INTEGRIN PATHWAY | a6b1 and a6b4 Integrin signaling |
| 0.3 | 2.7 | PID NEPHRIN NEPH1 PATHWAY | Nephrin/Neph1 signaling in the kidney podocyte |
| 0.2 | 0.7 | PID NFAT 3PATHWAY | Role of Calcineurin-dependent NFAT signaling in lymphocytes |
| 0.2 | 3.2 | PID AR TF PATHWAY | Regulation of Androgen receptor activity |
| 0.2 | 7.2 | PID PDGFRB PATHWAY | PDGFR-beta signaling pathway |
| 0.2 | 9.0 | PID CDC42 REG PATHWAY | Regulation of CDC42 activity |
| 0.2 | 2.0 | PID INTEGRIN5 PATHWAY | Beta5 beta6 beta7 and beta8 integrin cell surface interactions |
| 0.2 | 1.6 | PID DNA PK PATHWAY | DNA-PK pathway in nonhomologous end joining |
| 0.2 | 0.3 | PID S1P S1P4 PATHWAY | S1P4 pathway |
| 0.2 | 0.3 | PID IL5 PATHWAY | IL5-mediated signaling events |
| 0.1 | 2.3 | PID ERBB4 PATHWAY | ErbB4 signaling events |
| 0.1 | 1.1 | PID PI3KCI PATHWAY | Class I PI3K signaling events |
| 0.1 | 2.1 | PID WNT SIGNALING PATHWAY | Wnt signaling network |
| 0.1 | 5.0 | PID ATM PATHWAY | ATM pathway |
| 0.1 | 0.8 | PID AVB3 INTEGRIN PATHWAY | Integrins in angiogenesis |
| 0.1 | 0.9 | PID ERBB1 INTERNALIZATION PATHWAY | Internalization of ErbB1 |
| 0.1 | 0.8 | PID PI3K PLC TRK PATHWAY | Trk receptor signaling mediated by PI3K and PLC-gamma |
| 0.1 | 0.5 | PID ENDOTHELIN PATHWAY | Endothelins |
| 0.1 | 1.0 | PID SYNDECAN 3 PATHWAY | Syndecan-3-mediated signaling events |
| 0.1 | 0.2 | PID PDGFRA PATHWAY | PDGFR-alpha signaling pathway |
| 0.1 | 1.2 | PID HEDGEHOG 2PATHWAY | Signaling events mediated by the Hedgehog family |
| 0.1 | 1.1 | PID TRAIL PATHWAY | TRAIL signaling pathway |
| 0.1 | 1.0 | PID HIV NEF PATHWAY | HIV-1 Nef: Negative effector of Fas and TNF-alpha |
| 0.0 | 0.5 | PID INTEGRIN A9B1 PATHWAY | Alpha9 beta1 integrin signaling events |
| 0.0 | 1.0 | PID HES HEY PATHWAY | Notch-mediated HES/HEY network |
| 0.0 | 0.1 | PID NFKAPPAB ATYPICAL PATHWAY | Atypical NF-kappaB pathway |
| 0.0 | 0.9 | PID LKB1 PATHWAY | LKB1 signaling events |
| 0.0 | 0.1 | PID TNF PATHWAY | TNF receptor signaling pathway |
Gene overrepresentation in C2:CP:REACTOME category:
| Log-likelihood per target | Total log-likelihood | Term | Description |
|---|---|---|---|
| 4.6 | 82.8 | REACTOME NOREPINEPHRINE NEUROTRANSMITTER RELEASE CYCLE | Genes involved in Norepinephrine Neurotransmitter Release Cycle |
| 4.2 | 84.9 | REACTOME INTRINSIC PATHWAY | Genes involved in Intrinsic Pathway |
| 4.2 | 20.8 | REACTOME DESTABILIZATION OF MRNA BY AUF1 HNRNP D0 | Genes involved in Destabilization of mRNA by AUF1 (hnRNP D0) |
| 3.6 | 25.3 | REACTOME TANDEM PORE DOMAIN POTASSIUM CHANNELS | Genes involved in Tandem pore domain potassium channels |
| 3.6 | 42.7 | REACTOME THE ACTIVATION OF ARYLSULFATASES | Genes involved in The activation of arylsulfatases |
| 3.5 | 10.4 | REACTOME TRAFFICKING OF GLUR2 CONTAINING AMPA RECEPTORS | Genes involved in Trafficking of GluR2-containing AMPA receptors |
| 3.3 | 36.7 | REACTOME CREATION OF C4 AND C2 ACTIVATORS | Genes involved in Creation of C4 and C2 activators |
| 3.3 | 59.2 | REACTOME XENOBIOTICS | Genes involved in Xenobiotics |
| 3.2 | 3.2 | REACTOME RAS ACTIVATION UOPN CA2 INFUX THROUGH NMDA RECEPTOR | Genes involved in Ras activation uopn Ca2+ infux through NMDA receptor |
| 2.9 | 29.2 | REACTOME INITIAL TRIGGERING OF COMPLEMENT | Genes involved in Initial triggering of complement |
| 2.8 | 39.2 | REACTOME PASSIVE TRANSPORT BY AQUAPORINS | Genes involved in Passive Transport by Aquaporins |
| 2.8 | 67.2 | REACTOME AMINE DERIVED HORMONES | Genes involved in Amine-derived hormones |
| 2.7 | 65.6 | REACTOME OTHER SEMAPHORIN INTERACTIONS | Genes involved in Other semaphorin interactions |
| 2.7 | 66.3 | REACTOME REGULATION OF INSULIN LIKE GROWTH FACTOR IGF ACTIVITY BY INSULIN LIKE GROWTH FACTOR BINDING PROTEINS IGFBPS | Genes involved in Regulation of Insulin-like Growth Factor (IGF) Activity by Insulin-like Growth Factor Binding Proteins (IGFBPs) |
| 2.6 | 26.1 | REACTOME IRAK2 MEDIATED ACTIVATION OF TAK1 COMPLEX UPON TLR7 8 OR 9 STIMULATION | Genes involved in IRAK2 mediated activation of TAK1 complex upon TLR7/8 or 9 stimulation |
| 2.6 | 31.3 | REACTOME ABACAVIR TRANSPORT AND METABOLISM | Genes involved in Abacavir transport and metabolism |
| 2.4 | 63.0 | REACTOME CS DS DEGRADATION | Genes involved in CS/DS degradation |
| 2.2 | 44.1 | REACTOME ACTIVATION OF THE AP1 FAMILY OF TRANSCRIPTION FACTORS | Genes involved in Activation of the AP-1 family of transcription factors |
| 2.2 | 32.4 | REACTOME ACYL CHAIN REMODELLING OF PG | Genes involved in Acyl chain remodelling of PG |
| 1.9 | 13.6 | REACTOME RECEPTOR LIGAND BINDING INITIATES THE SECOND PROTEOLYTIC CLEAVAGE OF NOTCH RECEPTOR | Genes involved in Receptor-ligand binding initiates the second proteolytic cleavage of Notch receptor |
| 1.9 | 34.7 | REACTOME INTEGRIN CELL SURFACE INTERACTIONS | Genes involved in Integrin cell surface interactions |
| 1.8 | 23.1 | REACTOME SEROTONIN RECEPTORS | Genes involved in Serotonin receptors |
| 1.8 | 16.0 | REACTOME PLATELET ADHESION TO EXPOSED COLLAGEN | Genes involved in Platelet Adhesion to exposed collagen |
| 1.8 | 61.4 | REACTOME GLUTATHIONE CONJUGATION | Genes involved in Glutathione conjugation |
| 1.6 | 24.5 | REACTOME REVERSIBLE HYDRATION OF CARBON DIOXIDE | Genes involved in Reversible Hydration of Carbon Dioxide |
| 1.5 | 29.7 | REACTOME A TETRASACCHARIDE LINKER SEQUENCE IS REQUIRED FOR GAG SYNTHESIS | Genes involved in A tetrasaccharide linker sequence is required for GAG synthesis |
| 1.5 | 5.8 | REACTOME ACYL CHAIN REMODELLING OF PS | Genes involved in Acyl chain remodelling of PS |
| 1.5 | 23.3 | REACTOME ORGANIC CATION ANION ZWITTERION TRANSPORT | Genes involved in Organic cation/anion/zwitterion transport |
| 1.5 | 24.7 | REACTOME SYNTHESIS OF PA | Genes involved in Synthesis of PA |
| 1.4 | 40.0 | REACTOME CYTOCHROME P450 ARRANGED BY SUBSTRATE TYPE | Genes involved in Cytochrome P450 - arranged by substrate type |
| 1.4 | 44.1 | REACTOME ACTIVATED AMPK STIMULATES FATTY ACID OXIDATION IN MUSCLE | Genes involved in Activated AMPK stimulates fatty-acid oxidation in muscle |
| 1.4 | 50.9 | REACTOME STEROID HORMONES | Genes involved in Steroid hormones |
| 1.3 | 43.6 | REACTOME KERATAN SULFATE BIOSYNTHESIS | Genes involved in Keratan sulfate biosynthesis |
| 1.3 | 28.6 | REACTOME TRANSPORT OF ORGANIC ANIONS | Genes involved in Transport of organic anions |
| 1.3 | 69.5 | REACTOME ION TRANSPORT BY P TYPE ATPASES | Genes involved in Ion transport by P-type ATPases |
| 1.2 | 23.6 | REACTOME SYNTHESIS OF PE | Genes involved in Synthesis of PE |
| 1.2 | 27.2 | REACTOME PHASE1 FUNCTIONALIZATION OF COMPOUNDS | Genes involved in Phase 1 - Functionalization of compounds |
| 1.2 | 85.1 | REACTOME STRIATED MUSCLE CONTRACTION | Genes involved in Striated Muscle Contraction |
| 1.2 | 43.5 | REACTOME ABC FAMILY PROTEINS MEDIATED TRANSPORT | Genes involved in ABC-family proteins mediated transport |
| 1.1 | 16.1 | REACTOME COMMON PATHWAY | Genes involved in Common Pathway |
| 1.1 | 33.3 | REACTOME AMINE COMPOUND SLC TRANSPORTERS | Genes involved in Amine compound SLC transporters |
| 1.1 | 33.2 | REACTOME HORMONE SENSITIVE LIPASE HSL MEDIATED TRIACYLGLYCEROL HYDROLYSIS | Genes involved in Hormone-sensitive lipase (HSL)-mediated triacylglycerol hydrolysis |
| 1.1 | 26.1 | REACTOME BMAL1 CLOCK NPAS2 ACTIVATES CIRCADIAN EXPRESSION | Genes involved in BMAL1:CLOCK/NPAS2 Activates Circadian Expression |
| 1.1 | 15.9 | REACTOME PYRIMIDINE CATABOLISM | Genes involved in Pyrimidine catabolism |
| 1.1 | 26.0 | REACTOME CRMPS IN SEMA3A SIGNALING | Genes involved in CRMPs in Sema3A signaling |
| 1.1 | 42.8 | REACTOME TIGHT JUNCTION INTERACTIONS | Genes involved in Tight junction interactions |
| 1.1 | 15.7 | REACTOME VEGF LIGAND RECEPTOR INTERACTIONS | Genes involved in VEGF ligand-receptor interactions |
| 1.1 | 14.5 | REACTOME THROMBIN SIGNALLING THROUGH PROTEINASE ACTIVATED RECEPTORS PARS | Genes involved in Thrombin signalling through proteinase activated receptors (PARs) |
| 1.1 | 21.2 | REACTOME P2Y RECEPTORS | Genes involved in P2Y receptors |
| 1.1 | 214.7 | REACTOME PEPTIDE LIGAND BINDING RECEPTORS | Genes involved in Peptide ligand-binding receptors |
| 1.1 | 22.7 | REACTOME SIGNALING BY BMP | Genes involved in Signaling by BMP |
| 1.1 | 11.7 | REACTOME REGULATION OF INSULIN SECRETION BY ACETYLCHOLINE | Genes involved in Regulation of Insulin Secretion by Acetylcholine |
| 1.0 | 11.2 | REACTOME BILE SALT AND ORGANIC ANION SLC TRANSPORTERS | Genes involved in Bile salt and organic anion SLC transporters |
| 1.0 | 5.0 | REACTOME ACYL CHAIN REMODELLING OF PI | Genes involved in Acyl chain remodelling of PI |
| 1.0 | 2.0 | REACTOME SIGNALING BY FGFR | Genes involved in Signaling by FGFR |
| 1.0 | 49.4 | REACTOME OLFACTORY SIGNALING PATHWAY | Genes involved in Olfactory Signaling Pathway |
| 0.9 | 12.0 | REACTOME ROLE OF DCC IN REGULATING APOPTOSIS | Genes involved in Role of DCC in regulating apoptosis |
| 0.9 | 12.0 | REACTOME CIRCADIAN CLOCK | Genes involved in Circadian Clock |
| 0.9 | 3.7 | REACTOME ACYL CHAIN REMODELLING OF PE | Genes involved in Acyl chain remodelling of PE |
| 0.9 | 50.8 | REACTOME NITRIC OXIDE STIMULATES GUANYLATE CYCLASE | Genes involved in Nitric oxide stimulates guanylate cyclase |
| 0.9 | 39.6 | REACTOME TRANSCRIPTIONAL REGULATION OF WHITE ADIPOCYTE DIFFERENTIATION | Genes involved in Transcriptional Regulation of White Adipocyte Differentiation |
| 0.9 | 16.3 | REACTOME GAP JUNCTION ASSEMBLY | Genes involved in Gap junction assembly |
| 0.9 | 59.9 | REACTOME NUCLEAR SIGNALING BY ERBB4 | Genes involved in Nuclear signaling by ERBB4 |
| 0.9 | 16.0 | REACTOME CLASS C 3 METABOTROPIC GLUTAMATE PHEROMONE RECEPTORS | Genes involved in Class C/3 (Metabotropic glutamate/pheromone receptors) |
| 0.9 | 20.2 | REACTOME UNBLOCKING OF NMDA RECEPTOR GLUTAMATE BINDING AND ACTIVATION | Genes involved in Unblocking of NMDA receptor, glutamate binding and activation |
| 0.9 | 74.0 | REACTOME CELL SURFACE INTERACTIONS AT THE VASCULAR WALL | Genes involved in Cell surface interactions at the vascular wall |
| 0.8 | 70.4 | REACTOME NUCLEAR RECEPTOR TRANSCRIPTION PATHWAY | Genes involved in Nuclear Receptor transcription pathway |
| 0.8 | 25.7 | REACTOME CASPASE MEDIATED CLEAVAGE OF CYTOSKELETAL PROTEINS | Genes involved in Caspase-mediated cleavage of cytoskeletal proteins |
| 0.8 | 2.5 | REACTOME NEPHRIN INTERACTIONS | Genes involved in Nephrin interactions |
| 0.8 | 41.8 | REACTOME GPVI MEDIATED ACTIVATION CASCADE | Genes involved in GPVI-mediated activation cascade |
| 0.8 | 43.2 | REACTOME AMINO ACID AND OLIGOPEPTIDE SLC TRANSPORTERS | Genes involved in Amino acid and oligopeptide SLC transporters |
| 0.8 | 4.6 | REACTOME SPRY REGULATION OF FGF SIGNALING | Genes involved in Spry regulation of FGF signaling |
| 0.8 | 23.7 | REACTOME GABA A RECEPTOR ACTIVATION | Genes involved in GABA A receptor activation |
| 0.8 | 12.2 | REACTOME EICOSANOID LIGAND BINDING RECEPTORS | Genes involved in Eicosanoid ligand-binding receptors |
| 0.8 | 25.1 | REACTOME DEGRADATION OF THE EXTRACELLULAR MATRIX | Genes involved in Degradation of the extracellular matrix |
| 0.7 | 11.6 | REACTOME FGFR2C LIGAND BINDING AND ACTIVATION | Genes involved in FGFR2c ligand binding and activation |
| 0.7 | 16.4 | REACTOME REGULATION OF GENE EXPRESSION IN BETA CELLS | Genes involved in Regulation of gene expression in beta cells |
| 0.7 | 21.4 | REACTOME SYNTHESIS OF PIPS AT THE PLASMA MEMBRANE | Genes involved in Synthesis of PIPs at the plasma membrane |
| 0.7 | 10.6 | REACTOME DEFENSINS | Genes involved in Defensins |
| 0.7 | 14.2 | REACTOME GLYCOGEN BREAKDOWN GLYCOGENOLYSIS | Genes involved in Glycogen breakdown (glycogenolysis) |
| 0.7 | 2.7 | REACTOME G PROTEIN ACTIVATION | Genes involved in G-protein activation |
| 0.7 | 20.2 | REACTOME AMINE LIGAND BINDING RECEPTORS | Genes involved in Amine ligand-binding receptors |
| 0.7 | 20.9 | REACTOME ADHERENS JUNCTIONS INTERACTIONS | Genes involved in Adherens junctions interactions |
| 0.7 | 2.6 | REACTOME SYNTHESIS SECRETION AND DEACYLATION OF GHRELIN | Genes involved in Synthesis, Secretion, and Deacylation of Ghrelin |
| 0.7 | 5.9 | REACTOME SIGNAL ATTENUATION | Genes involved in Signal attenuation |
| 0.6 | 39.2 | REACTOME NCAM1 INTERACTIONS | Genes involved in NCAM1 interactions |
| 0.6 | 7.0 | REACTOME OPSINS | Genes involved in Opsins |
| 0.6 | 10.0 | REACTOME TERMINATION OF O GLYCAN BIOSYNTHESIS | Genes involved in Termination of O-glycan biosynthesis |
| 0.6 | 25.3 | REACTOME MYOGENESIS | Genes involved in Myogenesis |
| 0.6 | 26.7 | REACTOME MUSCLE CONTRACTION | Genes involved in Muscle contraction |
| 0.6 | 10.8 | REACTOME HDL MEDIATED LIPID TRANSPORT | Genes involved in HDL-mediated lipid transport |
| 0.6 | 12.9 | REACTOME ERK MAPK TARGETS | Genes involved in ERK/MAPK targets |
| 0.6 | 5.8 | REACTOME GABA SYNTHESIS RELEASE REUPTAKE AND DEGRADATION | Genes involved in GABA synthesis, release, reuptake and degradation |
| 0.6 | 8.0 | REACTOME NEGATIVE REGULATION OF FGFR SIGNALING | Genes involved in Negative regulation of FGFR signaling |
| 0.6 | 3.4 | REACTOME FORMATION OF FIBRIN CLOT CLOTTING CASCADE | Genes involved in Formation of Fibrin Clot (Clotting Cascade) |
| 0.6 | 0.6 | REACTOME E2F ENABLED INHIBITION OF PRE REPLICATION COMPLEX FORMATION | Genes involved in E2F-enabled inhibition of pre-replication complex formation |
| 0.5 | 11.0 | REACTOME HS GAG BIOSYNTHESIS | Genes involved in HS-GAG biosynthesis |
| 0.5 | 6.8 | REACTOME SIGNALING BY CONSTITUTIVELY ACTIVE EGFR | Genes involved in Signaling by constitutively active EGFR |
| 0.5 | 4.1 | REACTOME REGULATION OF BETA CELL DEVELOPMENT | Genes involved in Regulation of beta-cell development |
| 0.5 | 16.0 | REACTOME INTERACTION BETWEEN L1 AND ANKYRINS | Genes involved in Interaction between L1 and Ankyrins |
| 0.5 | 14.9 | REACTOME SIGNALING BY NODAL | Genes involved in Signaling by NODAL |
| 0.5 | 5.3 | REACTOME DIGESTION OF DIETARY CARBOHYDRATE | Genes involved in Digestion of dietary carbohydrate |
| 0.5 | 1.9 | REACTOME ELONGATION ARREST AND RECOVERY | Genes involved in Elongation arrest and recovery |
| 0.5 | 1.4 | REACTOME PLATELET AGGREGATION PLUG FORMATION | Genes involved in Platelet Aggregation (Plug Formation) |
| 0.4 | 13.9 | REACTOME SULFUR AMINO ACID METABOLISM | Genes involved in Sulfur amino acid metabolism |
| 0.4 | 3.0 | REACTOME RNA POL I PROMOTER OPENING | Genes involved in RNA Polymerase I Promoter Opening |
| 0.4 | 23.5 | REACTOME TRANSPORT OF INORGANIC CATIONS ANIONS AND AMINO ACIDS OLIGOPEPTIDES | Genes involved in Transport of inorganic cations/anions and amino acids/oligopeptides |
| 0.4 | 5.1 | REACTOME TRAFFICKING AND PROCESSING OF ENDOSOMAL TLR | Genes involved in Trafficking and processing of endosomal TLR |
| 0.4 | 11.4 | REACTOME COMPLEMENT CASCADE | Genes involved in Complement cascade |
| 0.4 | 4.1 | REACTOME DOWNSTREAM SIGNALING EVENTS OF B CELL RECEPTOR BCR | Genes involved in Downstream Signaling Events Of B Cell Receptor (BCR) |
| 0.4 | 113.4 | REACTOME GENERIC TRANSCRIPTION PATHWAY | Genes involved in Generic Transcription Pathway |
| 0.4 | 3.9 | REACTOME SIGNAL REGULATORY PROTEIN SIRP FAMILY INTERACTIONS | Genes involved in Signal regulatory protein (SIRP) family interactions |
| 0.4 | 13.5 | REACTOME NOTCH1 INTRACELLULAR DOMAIN REGULATES TRANSCRIPTION | Genes involved in NOTCH1 Intracellular Domain Regulates Transcription |
| 0.4 | 12.6 | REACTOME SIGNALING BY ROBO RECEPTOR | Genes involved in Signaling by Robo receptor |
| 0.4 | 4.9 | REACTOME SYNTHESIS SECRETION AND INACTIVATION OF GIP | Genes involved in Synthesis, Secretion, and Inactivation of Glucose-dependent Insulinotropic Polypeptide (GIP) |
| 0.3 | 1.7 | REACTOME ACETYLCHOLINE NEUROTRANSMITTER RELEASE CYCLE | Genes involved in Acetylcholine Neurotransmitter Release Cycle |
| 0.3 | 4.5 | REACTOME HORMONE LIGAND BINDING RECEPTORS | Genes involved in Hormone ligand-binding receptors |
| 0.3 | 31.6 | REACTOME CLASS B 2 SECRETIN FAMILY RECEPTORS | Genes involved in Class B/2 (Secretin family receptors) |
| 0.3 | 5.6 | REACTOME PRESYNAPTIC NICOTINIC ACETYLCHOLINE RECEPTORS | Genes involved in Presynaptic nicotinic acetylcholine receptors |
| 0.3 | 8.7 | REACTOME BRANCHED CHAIN AMINO ACID CATABOLISM | Genes involved in Branched-chain amino acid catabolism |
| 0.3 | 8.2 | REACTOME GLUCURONIDATION | Genes involved in Glucuronidation |
| 0.3 | 3.7 | REACTOME PLATELET CALCIUM HOMEOSTASIS | Genes involved in Platelet calcium homeostasis |
| 0.3 | 3.1 | REACTOME LIGAND GATED ION CHANNEL TRANSPORT | Genes involved in Ligand-gated ion channel transport |
| 0.3 | 5.2 | REACTOME IONOTROPIC ACTIVITY OF KAINATE RECEPTORS | Genes involved in Ionotropic activity of Kainate Receptors |
| 0.3 | 12.2 | REACTOME NETRIN1 SIGNALING | Genes involved in Netrin-1 signaling |
| 0.3 | 8.5 | REACTOME PEROXISOMAL LIPID METABOLISM | Genes involved in Peroxisomal lipid metabolism |
| 0.3 | 5.6 | REACTOME SYNTHESIS OF GLYCOSYLPHOSPHATIDYLINOSITOL GPI | Genes involved in Synthesis of glycosylphosphatidylinositol (GPI) |
| 0.3 | 6.1 | REACTOME FANCONI ANEMIA PATHWAY | Genes involved in Fanconi Anemia pathway |
| 0.3 | 6.2 | REACTOME METAL ION SLC TRANSPORTERS | Genes involved in Metal ion SLC transporters |
| 0.2 | 11.5 | REACTOME VOLTAGE GATED POTASSIUM CHANNELS | Genes involved in Voltage gated Potassium channels |
| 0.2 | 8.2 | REACTOME CLASS A1 RHODOPSIN LIKE RECEPTORS | Genes involved in Class A/1 (Rhodopsin-like receptors) |
| 0.2 | 3.7 | REACTOME TRAF3 DEPENDENT IRF ACTIVATION PATHWAY | Genes involved in TRAF3-dependent IRF activation pathway |
| 0.2 | 7.5 | REACTOME DEADENYLATION OF MRNA | Genes involved in Deadenylation of mRNA |
| 0.2 | 3.6 | REACTOME PTM GAMMA CARBOXYLATION HYPUSINE FORMATION AND ARYLSULFATASE ACTIVATION | Genes involved in PTM: gamma carboxylation, hypusine formation and arylsulfatase activation |
| 0.2 | 3.5 | REACTOME G ALPHA I SIGNALLING EVENTS | Genes involved in G alpha (i) signalling events |
| 0.2 | 9.0 | REACTOME PHASE II CONJUGATION | Genes involved in Phase II conjugation |
| 0.2 | 6.1 | REACTOME INWARDLY RECTIFYING K CHANNELS | Genes involved in Inwardly rectifying K+ channels |
| 0.2 | 1.8 | REACTOME SIGNALING BY NOTCH1 | Genes involved in Signaling by NOTCH1 |
| 0.2 | 1.0 | REACTOME REGULATION OF KIT SIGNALING | Genes involved in Regulation of KIT signaling |
| 0.2 | 1.5 | REACTOME SYNTHESIS OF PIPS AT THE LATE ENDOSOME MEMBRANE | Genes involved in Synthesis of PIPs at the late endosome membrane |
| 0.2 | 0.7 | REACTOME AQUAPORIN MEDIATED TRANSPORT | Genes involved in Aquaporin-mediated transport |
| 0.2 | 2.6 | REACTOME REGULATION OF MRNA STABILITY BY PROTEINS THAT BIND AU RICH ELEMENTS | Genes involved in Regulation of mRNA Stability by Proteins that Bind AU-rich Elements |
| 0.2 | 4.9 | REACTOME G ALPHA S SIGNALLING EVENTS | Genes involved in G alpha (s) signalling events |
| 0.1 | 4.1 | REACTOME TRIGLYCERIDE BIOSYNTHESIS | Genes involved in Triglyceride Biosynthesis |
| 0.1 | 0.1 | REACTOME VIF MEDIATED DEGRADATION OF APOBEC3G | Genes involved in Vif-mediated degradation of APOBEC3G |
| 0.1 | 7.4 | REACTOME AMYLOIDS | Genes involved in Amyloids |
| 0.1 | 0.6 | REACTOME POTASSIUM CHANNELS | Genes involved in Potassium Channels |
| 0.1 | 1.9 | REACTOME REGULATION OF INSULIN SECRETION BY GLUCAGON LIKE PEPTIDE1 | Genes involved in Regulation of Insulin Secretion by Glucagon-like Peptide-1 |
| 0.1 | 2.5 | REACTOME GLYCEROPHOSPHOLIPID BIOSYNTHESIS | Genes involved in Glycerophospholipid biosynthesis |
| 0.1 | 1.6 | REACTOME TRANSPORT OF GLUCOSE AND OTHER SUGARS BILE SALTS AND ORGANIC ACIDS METAL IONS AND AMINE COMPOUNDS | Genes involved in Transport of glucose and other sugars, bile salts and organic acids, metal ions and amine compounds |
| 0.0 | 1.1 | REACTOME TRANSPORT OF VITAMINS NUCLEOSIDES AND RELATED MOLECULES | Genes involved in Transport of vitamins, nucleosides, and related molecules |
| 0.0 | 1.3 | REACTOME SEMA4D INDUCED CELL MIGRATION AND GROWTH CONE COLLAPSE | Genes involved in Sema4D induced cell migration and growth-cone collapse |
| 0.0 | 0.2 | REACTOME ANTIGEN PRESENTATION FOLDING ASSEMBLY AND PEPTIDE LOADING OF CLASS I MHC | Genes involved in Antigen Presentation: Folding, assembly and peptide loading of class I MHC |
| 0.0 | 0.5 | REACTOME TRAF6 MEDIATED IRF7 ACTIVATION | Genes involved in TRAF6 mediated IRF7 activation |
| 0.0 | 0.2 | REACTOME N GLYCAN ANTENNAE ELONGATION | Genes involved in N-Glycan antennae elongation |
| 0.0 | 1.1 | REACTOME RESPONSE TO ELEVATED PLATELET CYTOSOLIC CA2 | Genes involved in Response to elevated platelet cytosolic Ca2+ |
| 0.0 | 0.2 | REACTOME SIGNALING BY EGFR IN CANCER | Genes involved in Signaling by EGFR in Cancer |