Project
GNF SymAtlas + NCI-60 cancer cell lines, comparison of cancers vs non-cancers, human (Su, 2004; Ross, 2000)
Navigation
Downloads
Results for NKX1-1
Z-value: 0.23
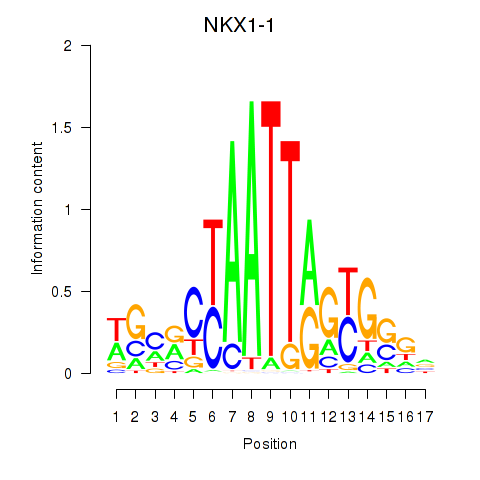
Motif logo
Transcription factors associated with NKX1-1
| Gene Symbol | Gene ID | Gene Info |
|---|---|---|
|
NKX1-1
|
ENSG00000235608.1 | NK1 homeobox 1 |
Activity profile of NKX1-1 motif
Sorted Z-values of NKX1-1 motif
| Promoter | Log-likelihood | Transcript | Gene | Gene Info |
|---|---|---|---|---|
| chr2_+_8822113 | 7.70 |
ENST00000396290.1
ENST00000331129.3 |
ID2
|
inhibitor of DNA binding 2, dominant negative helix-loop-helix protein |
| chr1_-_197115818 | 3.35 |
ENST00000367409.4
ENST00000294732.7 |
ASPM
|
asp (abnormal spindle) homolog, microcephaly associated (Drosophila) |
| chr17_-_8113886 | 2.74 |
ENST00000577833.1
ENST00000534871.1 ENST00000583915.1 ENST00000316199.6 ENST00000581511.1 ENST00000585124.1 |
AURKB
|
aurora kinase B |
| chr7_-_86849883 | 2.69 |
ENST00000433078.1
|
TMEM243
|
transmembrane protein 243, mitochondrial |
| chr6_+_34204642 | 2.67 |
ENST00000347617.6
ENST00000401473.3 ENST00000311487.5 ENST00000447654.1 ENST00000395004.3 |
HMGA1
|
high mobility group AT-hook 1 |
| chr1_+_155278539 | 2.63 |
ENST00000447866.1
|
FDPS
|
farnesyl diphosphate synthase |
| chr1_+_155278625 | 2.56 |
ENST00000368356.4
ENST00000356657.6 |
FDPS
|
farnesyl diphosphate synthase |
| chr3_-_52567792 | 2.47 |
ENST00000307092.4
ENST00000422318.2 ENST00000459839.1 |
NT5DC2
|
5'-nucleotidase domain containing 2 |
| chr12_-_102513843 | 1.89 |
ENST00000551744.2
ENST00000552283.1 |
NUP37
|
nucleoporin 37kDa |
| chr8_+_98656693 | 1.81 |
ENST00000519934.1
|
MTDH
|
metadherin |
| chr8_+_98656336 | 1.78 |
ENST00000336273.3
|
MTDH
|
metadherin |
| chr19_-_8070474 | 1.68 |
ENST00000407627.2
ENST00000593807.1 |
ELAVL1
|
ELAV like RNA binding protein 1 |
| chr9_+_34646624 | 1.57 |
ENST00000450095.2
ENST00000556278.1 |
GALT
GALT
|
galactose-1-phosphate uridylyltransferase Uncharacterized protein |
| chr17_-_61777459 | 1.53 |
ENST00000578993.1
ENST00000583211.1 ENST00000259006.3 |
LIMD2
|
LIM domain containing 2 |
| chr1_+_174843548 | 1.47 |
ENST00000478442.1
ENST00000465412.1 |
RABGAP1L
|
RAB GTPase activating protein 1-like |
| chr12_+_28410128 | 1.44 |
ENST00000381259.1
ENST00000381256.1 |
CCDC91
|
coiled-coil domain containing 91 |
| chr9_+_34646651 | 1.41 |
ENST00000378842.3
|
GALT
|
galactose-1-phosphate uridylyltransferase |
| chr18_+_55888767 | 1.39 |
ENST00000431212.2
ENST00000586268.1 ENST00000587190.1 |
NEDD4L
|
neural precursor cell expressed, developmentally down-regulated 4-like, E3 ubiquitin protein ligase |
| chr19_+_41256764 | 1.36 |
ENST00000243563.3
ENST00000601253.1 ENST00000597353.1 ENST00000599362.1 |
SNRPA
|
small nuclear ribonucleoprotein polypeptide A |
| chr19_+_11071546 | 1.27 |
ENST00000358026.2
|
SMARCA4
|
SWI/SNF related, matrix associated, actin dependent regulator of chromatin, subfamily a, member 4 |
| chr3_+_23851928 | 1.25 |
ENST00000467766.1
ENST00000424381.1 |
UBE2E1
|
ubiquitin-conjugating enzyme E2E 1 |
| chr10_-_1095050 | 1.22 |
ENST00000381344.3
|
IDI1
|
isopentenyl-diphosphate delta isomerase 1 |
| chr3_-_105588231 | 1.19 |
ENST00000545639.1
ENST00000394027.3 ENST00000438603.1 ENST00000447441.1 ENST00000443752.1 |
CBLB
|
Cbl proto-oncogene B, E3 ubiquitin protein ligase |
| chr2_+_187371440 | 1.17 |
ENST00000445547.1
|
ZC3H15
|
zinc finger CCCH-type containing 15 |
| chr3_+_158519654 | 1.10 |
ENST00000415822.2
ENST00000392813.4 ENST00000264266.8 |
MFSD1
|
major facilitator superfamily domain containing 1 |
| chr11_-_111741994 | 1.09 |
ENST00000398006.2
|
ALG9
|
ALG9, alpha-1,2-mannosyltransferase |
| chr8_+_94929077 | 1.04 |
ENST00000297598.4
ENST00000520614.1 |
PDP1
|
pyruvate dehyrogenase phosphatase catalytic subunit 1 |
| chr8_+_94929110 | 1.03 |
ENST00000520728.1
|
PDP1
|
pyruvate dehyrogenase phosphatase catalytic subunit 1 |
| chr8_+_94929168 | 1.01 |
ENST00000518107.1
ENST00000396200.3 |
PDP1
|
pyruvate dehyrogenase phosphatase catalytic subunit 1 |
| chr4_-_103682145 | 0.99 |
ENST00000226578.4
|
MANBA
|
mannosidase, beta A, lysosomal |
| chr7_-_99716952 | 0.97 |
ENST00000523306.1
ENST00000344095.4 ENST00000417349.1 ENST00000493322.1 ENST00000520135.1 ENST00000418432.2 ENST00000460673.2 ENST00000452041.1 ENST00000452438.2 ENST00000451699.1 ENST00000453269.2 |
TAF6
|
TAF6 RNA polymerase II, TATA box binding protein (TBP)-associated factor, 80kDa |
| chr17_-_27418537 | 0.94 |
ENST00000408971.2
|
TIAF1
|
TGFB1-induced anti-apoptotic factor 1 |
| chr19_+_45504688 | 0.78 |
ENST00000221452.8
ENST00000540120.1 ENST00000505236.1 |
RELB
|
v-rel avian reticuloendotheliosis viral oncogene homolog B |
| chr16_-_66864806 | 0.75 |
ENST00000566336.1
ENST00000394074.2 ENST00000563185.2 ENST00000359087.4 ENST00000379463.2 ENST00000565535.1 ENST00000290810.3 |
NAE1
|
NEDD8 activating enzyme E1 subunit 1 |
| chr6_-_82957433 | 0.73 |
ENST00000306270.7
|
IBTK
|
inhibitor of Bruton agammaglobulinemia tyrosine kinase |
| chr11_-_71823796 | 0.72 |
ENST00000545680.1
ENST00000543587.1 ENST00000538393.1 ENST00000535234.1 ENST00000227618.4 ENST00000535503.1 |
ANAPC15
|
anaphase promoting complex subunit 15 |
| chr3_+_57261743 | 0.71 |
ENST00000288266.3
|
APPL1
|
adaptor protein, phosphotyrosine interaction, PH domain and leucine zipper containing 1 |
| chr16_-_11036300 | 0.70 |
ENST00000331808.4
|
DEXI
|
Dexi homolog (mouse) |
| chr12_+_102513950 | 0.68 |
ENST00000378128.3
ENST00000327680.2 ENST00000541394.1 ENST00000543784.1 |
PARPBP
|
PARP1 binding protein |
| chrX_+_19362011 | 0.66 |
ENST00000379806.5
ENST00000545074.1 ENST00000540249.1 ENST00000423505.1 ENST00000417819.1 ENST00000422285.2 ENST00000355808.5 ENST00000379805.3 |
PDHA1
|
pyruvate dehydrogenase (lipoamide) alpha 1 |
| chr7_-_99717463 | 0.66 |
ENST00000437822.2
|
TAF6
|
TAF6 RNA polymerase II, TATA box binding protein (TBP)-associated factor, 80kDa |
| chr4_-_66536057 | 0.64 |
ENST00000273854.3
|
EPHA5
|
EPH receptor A5 |
| chr17_+_45286387 | 0.64 |
ENST00000572316.1
ENST00000354968.1 ENST00000576874.1 ENST00000536623.2 |
MYL4
|
myosin, light chain 4, alkali; atrial, embryonic |
| chr17_-_45266542 | 0.64 |
ENST00000531206.1
ENST00000527547.1 ENST00000446365.2 ENST00000575483.1 ENST00000066544.3 |
CDC27
|
cell division cycle 27 |
| chr2_-_47143160 | 0.62 |
ENST00000409800.1
ENST00000409218.1 |
MCFD2
|
multiple coagulation factor deficiency 2 |
| chr1_+_62439037 | 0.61 |
ENST00000545929.1
|
INADL
|
InaD-like (Drosophila) |
| chr18_-_33709268 | 0.60 |
ENST00000269187.5
ENST00000590986.1 ENST00000440549.2 |
SLC39A6
|
solute carrier family 39 (zinc transporter), member 6 |
| chr10_+_1095416 | 0.59 |
ENST00000358220.1
|
WDR37
|
WD repeat domain 37 |
| chr7_+_50348268 | 0.57 |
ENST00000438033.1
ENST00000439701.1 |
IKZF1
|
IKAROS family zinc finger 1 (Ikaros) |
| chr9_+_139780942 | 0.56 |
ENST00000247668.2
ENST00000359662.3 |
TRAF2
|
TNF receptor-associated factor 2 |
| chrX_+_55026763 | 0.55 |
ENST00000374987.3
|
APEX2
|
APEX nuclease (apurinic/apyrimidinic endonuclease) 2 |
| chr12_-_6961050 | 0.54 |
ENST00000538862.2
|
CDCA3
|
cell division cycle associated 3 |
| chr1_-_51796987 | 0.53 |
ENST00000262676.5
|
TTC39A
|
tetratricopeptide repeat domain 39A |
| chr14_-_24711470 | 0.53 |
ENST00000559969.1
|
TINF2
|
TERF1 (TRF1)-interacting nuclear factor 2 |
| chr11_-_47198380 | 0.51 |
ENST00000419701.2
ENST00000526342.1 ENST00000528444.1 ENST00000530596.1 ENST00000525398.1 ENST00000319543.6 ENST00000426335.2 ENST00000527927.1 ENST00000525314.1 |
ARFGAP2
|
ADP-ribosylation factor GTPase activating protein 2 |
| chr11_-_71823715 | 0.51 |
ENST00000545944.1
ENST00000502597.2 |
ANAPC15
|
anaphase promoting complex subunit 15 |
| chr12_+_2921788 | 0.49 |
ENST00000228799.2
ENST00000419778.2 ENST00000542548.1 |
ITFG2
|
integrin alpha FG-GAP repeat containing 2 |
| chr1_-_221915418 | 0.47 |
ENST00000323825.3
ENST00000366899.3 |
DUSP10
|
dual specificity phosphatase 10 |
| chr4_-_66536196 | 0.45 |
ENST00000511294.1
|
EPHA5
|
EPH receptor A5 |
| chr17_+_45286706 | 0.41 |
ENST00000393450.1
ENST00000572303.1 |
MYL4
|
myosin, light chain 4, alkali; atrial, embryonic |
| chr10_+_5238793 | 0.38 |
ENST00000263126.1
|
AKR1C4
|
aldo-keto reductase family 1, member C4 |
| chr13_-_36050819 | 0.37 |
ENST00000379919.4
|
MAB21L1
|
mab-21-like 1 (C. elegans) |
| chr14_-_24711806 | 0.37 |
ENST00000540705.1
ENST00000538777.1 ENST00000558566.1 ENST00000559019.1 |
TINF2
|
TERF1 (TRF1)-interacting nuclear factor 2 |
| chr14_-_24711865 | 0.36 |
ENST00000399423.4
ENST00000267415.7 |
TINF2
|
TERF1 (TRF1)-interacting nuclear factor 2 |
| chr16_-_2318373 | 0.34 |
ENST00000566458.1
ENST00000320225.5 |
RNPS1
|
RNA binding protein S1, serine-rich domain |
| chr3_+_186560476 | 0.30 |
ENST00000320741.2
ENST00000444204.2 |
ADIPOQ
|
adiponectin, C1Q and collagen domain containing |
| chr3_+_186560462 | 0.29 |
ENST00000412955.2
|
ADIPOQ
|
adiponectin, C1Q and collagen domain containing |
| chr5_-_22853429 | 0.27 |
ENST00000504376.2
|
CDH12
|
cadherin 12, type 2 (N-cadherin 2) |
| chr19_-_6424783 | 0.26 |
ENST00000398148.3
|
KHSRP
|
KH-type splicing regulatory protein |
| chr7_+_120628731 | 0.25 |
ENST00000310396.5
|
CPED1
|
cadherin-like and PC-esterase domain containing 1 |
| chr7_+_12727250 | 0.24 |
ENST00000404894.1
|
ARL4A
|
ADP-ribosylation factor-like 4A |
| chr21_-_37914898 | 0.23 |
ENST00000399136.1
|
CLDN14
|
claudin 14 |
| chr2_-_47142884 | 0.22 |
ENST00000409105.1
ENST00000409973.1 ENST00000409913.1 ENST00000319466.4 |
MCFD2
|
multiple coagulation factor deficiency 2 |
| chr7_+_6048856 | 0.20 |
ENST00000223029.3
ENST00000400479.2 ENST00000395236.2 |
AIMP2
|
aminoacyl tRNA synthetase complex-interacting multifunctional protein 2 |
| chr17_-_10372875 | 0.19 |
ENST00000255381.2
|
MYH4
|
myosin, heavy chain 4, skeletal muscle |
| chr7_-_6048650 | 0.18 |
ENST00000382321.4
ENST00000406569.3 |
PMS2
|
PMS2 postmeiotic segregation increased 2 (S. cerevisiae) |
| chr16_-_2318055 | 0.18 |
ENST00000561518.1
ENST00000561718.1 ENST00000567147.1 ENST00000562690.1 ENST00000569598.2 |
RNPS1
|
RNA binding protein S1, serine-rich domain |
| chr9_+_116225999 | 0.16 |
ENST00000317613.6
|
RGS3
|
regulator of G-protein signaling 3 |
| chr11_+_134201768 | 0.16 |
ENST00000535456.2
ENST00000339772.7 |
GLB1L2
|
galactosidase, beta 1-like 2 |
| chr2_-_167232484 | 0.16 |
ENST00000375387.4
ENST00000303354.6 ENST00000409672.1 |
SCN9A
|
sodium channel, voltage-gated, type IX, alpha subunit |
| chr7_+_26331541 | 0.16 |
ENST00000416246.1
ENST00000338523.4 ENST00000412416.1 |
SNX10
|
sorting nexin 10 |
| chr22_+_22730353 | 0.13 |
ENST00000390296.2
|
IGLV5-45
|
immunoglobulin lambda variable 5-45 |
| chr4_+_87515454 | 0.08 |
ENST00000427191.2
ENST00000436978.1 ENST00000502971.1 |
PTPN13
|
protein tyrosine phosphatase, non-receptor type 13 (APO-1/CD95 (Fas)-associated phosphatase) |
| chr1_-_51796226 | 0.07 |
ENST00000451380.1
ENST00000371747.3 ENST00000439482.1 |
TTC39A
|
tetratricopeptide repeat domain 39A |
| chrX_-_153363188 | 0.03 |
ENST00000303391.6
|
MECP2
|
methyl CpG binding protein 2 (Rett syndrome) |
| chr12_-_91451758 | 0.02 |
ENST00000266719.3
|
KERA
|
keratocan |
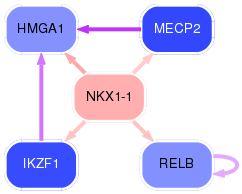
Network of associatons between targets according to the STRING database.

First level regulatory network of NKX1-1
Gene Ontology Analysis
Gene overrepresentation in biological_process category:
| Log-likelihood per target | Total log-likelihood | Term | Description |
|---|---|---|---|
| 1.9 | 7.7 | GO:0061030 | epithelial cell differentiation involved in mammary gland alveolus development(GO:0061030) |
| 1.0 | 5.2 | GO:0033383 | geranyl diphosphate metabolic process(GO:0033383) geranyl diphosphate biosynthetic process(GO:0033384) farnesyl diphosphate biosynthetic process(GO:0045337) |
| 1.0 | 3.0 | GO:0006258 | UDP-glucose catabolic process(GO:0006258) galactose catabolic process via UDP-galactose(GO:0033499) |
| 0.9 | 2.7 | GO:0044878 | mitotic cytokinesis checkpoint(GO:0044878) |
| 0.7 | 2.7 | GO:0090402 | oncogene-induced cell senescence(GO:0090402) |
| 0.6 | 3.4 | GO:0051661 | maintenance of centrosome location(GO:0051661) |
| 0.3 | 1.2 | GO:0046490 | isopentenyl diphosphate biosynthetic process(GO:0009240) isopentenyl diphosphate metabolic process(GO:0046490) |
| 0.3 | 1.4 | GO:2001288 | positive regulation of caveolin-mediated endocytosis(GO:2001288) |
| 0.3 | 1.3 | GO:0007068 | negative regulation of transcription during mitosis(GO:0007068) negative regulation of transcription from RNA polymerase II promoter during mitosis(GO:0007070) |
| 0.2 | 3.6 | GO:0035970 | peptidyl-threonine dephosphorylation(GO:0035970) |
| 0.2 | 1.3 | GO:0010836 | negative regulation of protein ADP-ribosylation(GO:0010836) |
| 0.2 | 0.6 | GO:0097018 | renal albumin absorption(GO:0097018) regulation of renal albumin absorption(GO:2000532) regulation of platelet-derived growth factor receptor-alpha signaling pathway(GO:2000583) negative regulation of platelet-derived growth factor receptor-alpha signaling pathway(GO:2000584) |
| 0.2 | 1.2 | GO:0032020 | ISG15-protein conjugation(GO:0032020) |
| 0.1 | 0.7 | GO:0033314 | mitotic DNA replication checkpoint(GO:0033314) |
| 0.1 | 0.6 | GO:1903721 | regulation of I-kappaB phosphorylation(GO:1903719) positive regulation of I-kappaB phosphorylation(GO:1903721) |
| 0.1 | 0.5 | GO:0002314 | germinal center B cell differentiation(GO:0002314) |
| 0.1 | 1.4 | GO:0090160 | Golgi to lysosome transport(GO:0090160) |
| 0.1 | 1.7 | GO:0060965 | negative regulation of gene silencing by miRNA(GO:0060965) |
| 0.1 | 0.7 | GO:0061732 | mitochondrial acetyl-CoA biosynthetic process from pyruvate(GO:0061732) |
| 0.1 | 0.8 | GO:0007175 | negative regulation of epidermal growth factor-activated receptor activity(GO:0007175) |
| 0.1 | 1.2 | GO:1903504 | regulation of mitotic cell cycle spindle assembly checkpoint(GO:0090266) regulation of mitotic spindle checkpoint(GO:1903504) |
| 0.1 | 1.1 | GO:0006488 | dolichol-linked oligosaccharide biosynthetic process(GO:0006488) |
| 0.1 | 0.2 | GO:1903630 | regulation of aminoacyl-tRNA ligase activity(GO:1903630) |
| 0.1 | 1.0 | GO:0009313 | oligosaccharide catabolic process(GO:0009313) |
| 0.1 | 0.6 | GO:0071578 | zinc II ion transmembrane import(GO:0071578) |
| 0.1 | 1.4 | GO:1900363 | regulation of mRNA polyadenylation(GO:1900363) |
| 0.1 | 0.4 | GO:0071395 | response to jasmonic acid(GO:0009753) cellular response to jasmonic acid stimulus(GO:0071395) |
| 0.1 | 1.1 | GO:0032793 | positive regulation of CREB transcription factor activity(GO:0032793) |
| 0.0 | 0.8 | GO:0032688 | negative regulation of interferon-beta production(GO:0032688) |
| 0.0 | 3.6 | GO:0031663 | lipopolysaccharide-mediated signaling pathway(GO:0031663) |
| 0.0 | 0.7 | GO:0061099 | negative regulation of protein tyrosine kinase activity(GO:0061099) |
| 0.0 | 1.9 | GO:0071431 | tRNA export from nucleus(GO:0006409) tRNA-containing ribonucleoprotein complex export from nucleus(GO:0071431) |
| 0.0 | 1.1 | GO:0002026 | regulation of the force of heart contraction(GO:0002026) |
| 0.0 | 0.3 | GO:2000628 | regulation of miRNA metabolic process(GO:2000628) |
| 0.0 | 0.6 | GO:0000470 | maturation of LSU-rRNA(GO:0000470) |
| 0.0 | 1.6 | GO:0042795 | snRNA transcription(GO:0009301) snRNA transcription from RNA polymerase II promoter(GO:0042795) |
| 0.0 | 0.1 | GO:2000042 | negative regulation of double-strand break repair via homologous recombination(GO:2000042) |
| 0.0 | 1.5 | GO:0031338 | regulation of vesicle fusion(GO:0031338) |
| 0.0 | 0.5 | GO:0048025 | negative regulation of mRNA splicing, via spliceosome(GO:0048025) |
| 0.0 | 0.6 | GO:0007091 | metaphase/anaphase transition of mitotic cell cycle(GO:0007091) |
| 0.0 | 0.8 | GO:0018279 | protein N-linked glycosylation via asparagine(GO:0018279) |
| 0.0 | 0.7 | GO:0090003 | regulation of establishment of protein localization to plasma membrane(GO:0090003) |
| 0.0 | 0.6 | GO:0006284 | base-excision repair(GO:0006284) |
Gene overrepresentation in cellular_component category:
| Log-likelihood per target | Total log-likelihood | Term | Description |
|---|---|---|---|
| 0.5 | 3.6 | GO:0046581 | intercellular canaliculus(GO:0046581) |
| 0.5 | 3.4 | GO:0036449 | microtubule minus-end(GO:0036449) |
| 0.3 | 2.7 | GO:0032133 | chromosome passenger complex(GO:0032133) |
| 0.2 | 2.7 | GO:0035985 | senescence-associated heterochromatin focus(GO:0035985) |
| 0.2 | 0.6 | GO:0097057 | TRAF2-GSTP1 complex(GO:0097057) |
| 0.1 | 1.3 | GO:0070187 | telosome(GO:0070187) |
| 0.1 | 1.9 | GO:0031080 | nuclear pore outer ring(GO:0031080) |
| 0.1 | 0.6 | GO:0070545 | PeBoW complex(GO:0070545) |
| 0.1 | 0.7 | GO:0045254 | pyruvate dehydrogenase complex(GO:0045254) |
| 0.1 | 0.8 | GO:0033256 | I-kappaB/NF-kappaB complex(GO:0033256) |
| 0.1 | 1.9 | GO:0005680 | anaphase-promoting complex(GO:0005680) |
| 0.1 | 0.5 | GO:0061574 | ASAP complex(GO:0061574) |
| 0.1 | 1.3 | GO:0071564 | npBAF complex(GO:0071564) |
| 0.0 | 0.9 | GO:0033276 | transcription factor TFTC complex(GO:0033276) |
| 0.0 | 1.4 | GO:0005685 | U1 snRNP(GO:0005685) |
| 0.0 | 0.6 | GO:0031618 | nuclear pericentric heterochromatin(GO:0031618) |
| 0.0 | 0.2 | GO:0031313 | extrinsic component of endosome membrane(GO:0031313) |
| 0.0 | 0.7 | GO:0090545 | NuRD complex(GO:0016581) CHD-type complex(GO:0090545) |
| 0.0 | 1.4 | GO:0005771 | multivesicular body(GO:0005771) |
| 0.0 | 1.0 | GO:0035577 | azurophil granule membrane(GO:0035577) |
| 0.0 | 1.1 | GO:0031672 | A band(GO:0031672) |
| 0.0 | 0.5 | GO:0031258 | lamellipodium membrane(GO:0031258) |
| 0.0 | 0.2 | GO:0032982 | myosin filament(GO:0032982) |
| 0.0 | 0.8 | GO:0012507 | ER to Golgi transport vesicle membrane(GO:0012507) |
Gene overrepresentation in molecular_function category:
| Log-likelihood per target | Total log-likelihood | Term | Description |
|---|---|---|---|
| 1.0 | 5.2 | GO:0004337 | dimethylallyltranstransferase activity(GO:0004161) geranyltranstransferase activity(GO:0004337) |
| 0.5 | 3.1 | GO:0004741 | [pyruvate dehydrogenase (lipoamide)] phosphatase activity(GO:0004741) |
| 0.4 | 1.1 | GO:0000026 | alpha-1,2-mannosyltransferase activity(GO:0000026) |
| 0.3 | 2.7 | GO:0035174 | histone serine kinase activity(GO:0035174) |
| 0.3 | 3.0 | GO:0070569 | uridylyltransferase activity(GO:0070569) |
| 0.3 | 1.1 | GO:0032038 | myosin II heavy chain binding(GO:0032038) |
| 0.2 | 2.5 | GO:0008253 | 5'-nucleotidase activity(GO:0008253) |
| 0.2 | 1.2 | GO:0042296 | ISG15 transferase activity(GO:0042296) |
| 0.2 | 1.4 | GO:0035614 | snRNA stem-loop binding(GO:0035614) |
| 0.2 | 2.7 | GO:0042975 | peroxisome proliferator activated receptor binding(GO:0042975) |
| 0.2 | 0.6 | GO:0005174 | CD40 receptor binding(GO:0005174) |
| 0.2 | 0.6 | GO:0008309 | double-stranded DNA exodeoxyribonuclease activity(GO:0008309) |
| 0.2 | 0.7 | GO:0030292 | protein tyrosine kinase inhibitor activity(GO:0030292) |
| 0.2 | 1.4 | GO:0019871 | sodium channel inhibitor activity(GO:0019871) |
| 0.2 | 0.7 | GO:0004739 | pyruvate dehydrogenase (acetyl-transferring) activity(GO:0004739) |
| 0.1 | 1.9 | GO:0035925 | mRNA 3'-UTR AU-rich region binding(GO:0035925) |
| 0.1 | 1.6 | GO:0017162 | aryl hydrocarbon receptor binding(GO:0017162) |
| 0.1 | 1.1 | GO:0005005 | transmembrane-ephrin receptor activity(GO:0005005) |
| 0.1 | 1.3 | GO:0030957 | Tat protein binding(GO:0030957) |
| 0.1 | 0.4 | GO:0047023 | androsterone dehydrogenase activity(GO:0047023) |
| 0.1 | 3.6 | GO:0051059 | NF-kappaB binding(GO:0051059) |
| 0.1 | 1.2 | GO:0016863 | intramolecular oxidoreductase activity, transposing C=C bonds(GO:0016863) |
| 0.1 | 0.7 | GO:0008641 | small protein activating enzyme activity(GO:0008641) |
| 0.1 | 1.0 | GO:0015923 | mannosidase activity(GO:0015923) |
| 0.0 | 0.6 | GO:0033691 | sialic acid binding(GO:0033691) |
| 0.0 | 7.1 | GO:0044325 | ion channel binding(GO:0044325) |
| 0.0 | 0.7 | GO:0043422 | protein kinase B binding(GO:0043422) |
| 0.0 | 0.6 | GO:0005385 | zinc ion transmembrane transporter activity(GO:0005385) |
| 0.0 | 0.5 | GO:0017017 | MAP kinase tyrosine/serine/threonine phosphatase activity(GO:0017017) mitogen-activated protein kinase p38 binding(GO:0048273) |
| 0.0 | 1.3 | GO:0042162 | telomeric DNA binding(GO:0042162) |
| 0.0 | 0.2 | GO:0004565 | beta-galactosidase activity(GO:0004565) |
| 0.0 | 0.1 | GO:0036312 | phosphatidylinositol 3-kinase regulatory subunit binding(GO:0036312) |
| 0.0 | 0.8 | GO:0001784 | phosphotyrosine binding(GO:0001784) |
| 0.0 | 3.5 | GO:0005516 | calmodulin binding(GO:0005516) |
| 0.0 | 0.2 | GO:0005545 | 1-phosphatidylinositol binding(GO:0005545) |
Gene overrepresentation in C2:CP category:
| Log-likelihood per target | Total log-likelihood | Term | Description |
|---|---|---|---|
| 0.1 | 13.3 | PID MYC ACTIV PATHWAY | Validated targets of C-MYC transcriptional activation |
| 0.1 | 1.3 | PID ERB GENOMIC PATHWAY | Validated nuclear estrogen receptor beta network |
| 0.0 | 2.7 | PID AURORA B PATHWAY | Aurora B signaling |
| 0.0 | 1.4 | PID CD40 PATHWAY | CD40/CD40L signaling |
| 0.0 | 0.9 | PID EPHA FWDPATHWAY | EPHA forward signaling |
| 0.0 | 0.5 | PID P38 ALPHA BETA PATHWAY | Regulation of p38-alpha and p38-beta |
| 0.0 | 1.4 | PID TGFBR PATHWAY | TGF-beta receptor signaling |
| 0.0 | 1.3 | PID TELOMERASE PATHWAY | Regulation of Telomerase |
Gene overrepresentation in C2:CP:REACTOME category:
| Log-likelihood per target | Total log-likelihood | Term | Description |
|---|---|---|---|
| 0.3 | 2.7 | REACTOME APOBEC3G MEDIATED RESISTANCE TO HIV1 INFECTION | Genes involved in APOBEC3G mediated resistance to HIV-1 infection |
| 0.2 | 3.7 | REACTOME REGULATION OF PYRUVATE DEHYDROGENASE PDH COMPLEX | Genes involved in Regulation of pyruvate dehydrogenase (PDH) complex |
| 0.2 | 6.4 | REACTOME CHOLESTEROL BIOSYNTHESIS | Genes involved in Cholesterol biosynthesis |
| 0.1 | 1.9 | REACTOME PHOSPHORYLATION OF THE APC C | Genes involved in Phosphorylation of the APC/C |
| 0.1 | 0.7 | REACTOME ROLE OF DCC IN REGULATING APOPTOSIS | Genes involved in Role of DCC in regulating apoptosis |
| 0.0 | 1.9 | REACTOME NEP NS2 INTERACTS WITH THE CELLULAR EXPORT MACHINERY | Genes involved in NEP/NS2 Interacts with the Cellular Export Machinery |
| 0.0 | 1.1 | REACTOME BIOSYNTHESIS OF THE N GLYCAN PRECURSOR DOLICHOL LIPID LINKED OLIGOSACCHARIDE LLO AND TRANSFER TO A NASCENT PROTEIN | Genes involved in Biosynthesis of the N-glycan precursor (dolichol lipid-linked oligosaccharide, LLO) and transfer to a nascent protein |
| 0.0 | 0.4 | REACTOME SYNTHESIS OF BILE ACIDS AND BILE SALTS VIA 24 HYDROXYCHOLESTEROL | Genes involved in Synthesis of bile acids and bile salts via 24-hydroxycholesterol |
| 0.0 | 0.6 | REACTOME ZINC TRANSPORTERS | Genes involved in Zinc transporters |
| 0.0 | 2.7 | REACTOME APC C CDH1 MEDIATED DEGRADATION OF CDC20 AND OTHER APC C CDH1 TARGETED PROTEINS IN LATE MITOSIS EARLY G1 | Genes involved in APC/C:Cdh1 mediated degradation of Cdc20 and other APC/C:Cdh1 targeted proteins in late mitosis/early G1 |
| 0.0 | 1.9 | REACTOME REGULATION OF MRNA STABILITY BY PROTEINS THAT BIND AU RICH ELEMENTS | Genes involved in Regulation of mRNA Stability by Proteins that Bind AU-rich Elements |
| 0.0 | 1.3 | REACTOME PACKAGING OF TELOMERE ENDS | Genes involved in Packaging Of Telomere Ends |
| 0.0 | 0.8 | REACTOME TIGHT JUNCTION INTERACTIONS | Genes involved in Tight junction interactions |
| 0.0 | 0.6 | REACTOME EXTRINSIC PATHWAY FOR APOPTOSIS | Genes involved in Extrinsic Pathway for Apoptosis |
| 0.0 | 0.8 | REACTOME ANTIGEN ACTIVATES B CELL RECEPTOR LEADING TO GENERATION OF SECOND MESSENGERS | Genes involved in Antigen Activates B Cell Receptor Leading to Generation of Second Messengers |
| 0.0 | 0.9 | REACTOME RNA POL II TRANSCRIPTION PRE INITIATION AND PROMOTER OPENING | Genes involved in RNA Polymerase II Transcription Pre-Initiation And Promoter Opening |
| 0.0 | 1.1 | REACTOME STRIATED MUSCLE CONTRACTION | Genes involved in Striated Muscle Contraction |
| 0.0 | 1.9 | REACTOME MRNA SPLICING | Genes involved in mRNA Splicing |
| 0.0 | 0.8 | REACTOME TRANSPORT TO THE GOLGI AND SUBSEQUENT MODIFICATION | Genes involved in Transport to the Golgi and subsequent modification |