Project
GNF SymAtlas + NCI-60 cancer cell lines, comparison of cancers vs non-cancers, human (Su, 2004; Ross, 2000)
Navigation
Downloads
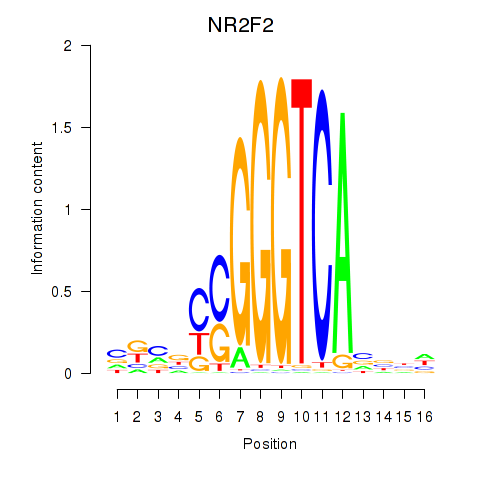
Results for NR2F2
Z-value: 0.49
Motif logo
Transcription factors associated with NR2F2
| Gene Symbol | Gene ID | Gene Info |
|---|---|---|
|
NR2F2
|
ENSG00000185551.8 | nuclear receptor subfamily 2 group F member 2 |
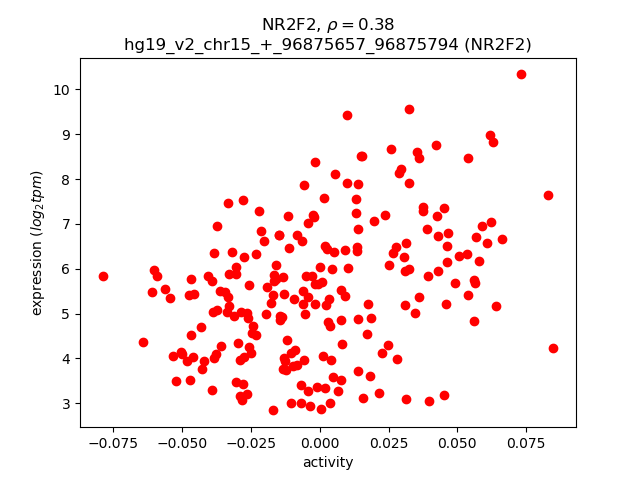
Activity-expression correlation:
| Gene | Promoter | Pearson corr. coef. | P-value | Plot |
|---|---|---|---|---|
| NR2F2 | hg19_v2_chr15_+_96875657_96875794 | 0.38 | 1.0e-08 | Click! |
Activity profile of NR2F2 motif
Sorted Z-values of NR2F2 motif
| Promoter | Log-likelihood | Transcript | Gene | Gene Info |
|---|---|---|---|---|
| chr16_-_23607598 | 13.02 |
ENST00000562133.1
ENST00000570319.1 ENST00000007516.3 |
NDUFAB1
|
NADH dehydrogenase (ubiquinone) 1, alpha/beta subcomplex, 1, 8kDa |
| chr15_-_63448973 | 10.81 |
ENST00000462430.1
|
RPS27L
|
ribosomal protein S27-like |
| chr7_+_116139744 | 10.50 |
ENST00000343213.2
|
CAV2
|
caveolin 2 |
| chrX_+_118602363 | 10.21 |
ENST00000317881.8
|
SLC25A5
|
solute carrier family 25 (mitochondrial carrier; adenine nucleotide translocator), member 5 |
| chr3_-_185641681 | 10.05 |
ENST00000259043.7
|
TRA2B
|
transformer 2 beta homolog (Drosophila) |
| chr14_-_24616426 | 9.88 |
ENST00000216802.5
|
PSME2
|
proteasome (prosome, macropain) activator subunit 2 (PA28 beta) |
| chr2_+_201170770 | 9.67 |
ENST00000409988.3
ENST00000409385.1 |
SPATS2L
|
spermatogenesis associated, serine-rich 2-like |
| chr12_+_52626898 | 9.49 |
ENST00000331817.5
|
KRT7
|
keratin 7 |
| chr19_+_36631867 | 9.36 |
ENST00000588780.1
|
CAPNS1
|
calpain, small subunit 1 |
| chr8_-_121457332 | 9.07 |
ENST00000518918.1
|
MRPL13
|
mitochondrial ribosomal protein L13 |
| chr19_+_572543 | 9.02 |
ENST00000333511.3
ENST00000573216.1 ENST00000353555.4 |
BSG
|
basigin (Ok blood group) |
| chr15_+_22892663 | 8.46 |
ENST00000313077.7
ENST00000561274.1 ENST00000560848.1 |
CYFIP1
|
cytoplasmic FMR1 interacting protein 1 |
| chr18_+_12948000 | 8.38 |
ENST00000585730.1
ENST00000399892.2 ENST00000589446.1 ENST00000587761.1 |
SEH1L
|
SEH1-like (S. cerevisiae) |
| chr2_-_151344172 | 8.12 |
ENST00000375734.2
ENST00000263895.4 ENST00000454202.1 |
RND3
|
Rho family GTPase 3 |
| chrX_+_13707235 | 7.99 |
ENST00000464506.1
|
RAB9A
|
RAB9A, member RAS oncogene family |
| chr10_+_115438920 | 7.69 |
ENST00000429617.1
ENST00000369331.4 |
CASP7
|
caspase 7, apoptosis-related cysteine peptidase |
| chr13_+_28195988 | 7.57 |
ENST00000399697.3
ENST00000399696.1 |
POLR1D
|
polymerase (RNA) I polypeptide D, 16kDa |
| chr8_-_101965559 | 7.51 |
ENST00000353245.3
|
YWHAZ
|
tyrosine 3-monooxygenase/tryptophan 5-monooxygenase activation protein, zeta |
| chr14_+_24605389 | 7.41 |
ENST00000382708.3
ENST00000561435.1 |
PSME1
|
proteasome (prosome, macropain) activator subunit 1 (PA28 alpha) |
| chr14_+_23791159 | 7.28 |
ENST00000557702.1
|
PABPN1
|
poly(A) binding protein, nuclear 1 |
| chr4_+_107236692 | 7.27 |
ENST00000510207.1
|
AIMP1
|
aminoacyl tRNA synthetase complex-interacting multifunctional protein 1 |
| chr4_-_140223614 | 7.27 |
ENST00000394223.1
|
NDUFC1
|
NADH dehydrogenase (ubiquinone) 1, subcomplex unknown, 1, 6kDa |
| chr19_-_42463418 | 7.18 |
ENST00000600292.1
ENST00000601078.1 ENST00000601891.1 ENST00000222008.6 |
RABAC1
|
Rab acceptor 1 (prenylated) |
| chr5_+_33440802 | 7.11 |
ENST00000502553.1
ENST00000514259.1 ENST00000265112.3 |
TARS
|
threonyl-tRNA synthetase |
| chr8_-_71520513 | 7.10 |
ENST00000262213.2
ENST00000536748.1 ENST00000518678.1 |
TRAM1
|
translocation associated membrane protein 1 |
| chr14_+_23790690 | 7.03 |
ENST00000556821.1
|
PABPN1
|
poly(A) binding protein, nuclear 1 |
| chr5_+_1801503 | 6.98 |
ENST00000274137.5
ENST00000469176.1 |
NDUFS6
|
NADH dehydrogenase (ubiquinone) Fe-S protein 6, 13kDa (NADH-coenzyme Q reductase) |
| chr4_-_183838596 | 6.95 |
ENST00000508994.1
ENST00000512766.1 |
DCTD
|
dCMP deaminase |
| chr20_+_44520009 | 6.89 |
ENST00000607482.1
ENST00000372459.2 |
CTSA
|
cathepsin A |
| chr1_+_165796753 | 6.75 |
ENST00000367879.4
|
UCK2
|
uridine-cytidine kinase 2 |
| chr20_+_44519948 | 6.69 |
ENST00000354880.5
ENST00000191018.5 |
CTSA
|
cathepsin A |
| chr5_-_131563501 | 6.67 |
ENST00000401867.1
ENST00000379086.1 ENST00000418055.1 ENST00000453286.1 ENST00000166534.4 |
P4HA2
|
prolyl 4-hydroxylase, alpha polypeptide II |
| chr8_-_121457608 | 6.61 |
ENST00000306185.3
|
MRPL13
|
mitochondrial ribosomal protein L13 |
| chr13_+_43597269 | 6.61 |
ENST00000379221.2
|
DNAJC15
|
DnaJ (Hsp40) homolog, subfamily C, member 15 |
| chr13_+_113951607 | 6.50 |
ENST00000397181.3
|
LAMP1
|
lysosomal-associated membrane protein 1 |
| chr4_-_140223670 | 6.49 |
ENST00000394228.1
ENST00000539387.1 |
NDUFC1
|
NADH dehydrogenase (ubiquinone) 1, subcomplex unknown, 1, 6kDa |
| chr22_-_19165917 | 6.41 |
ENST00000451283.1
|
SLC25A1
|
solute carrier family 25 (mitochondrial carrier; citrate transporter), member 1 |
| chr17_-_73178599 | 6.36 |
ENST00000578238.1
|
SUMO2
|
small ubiquitin-like modifier 2 |
| chr2_+_15731289 | 6.33 |
ENST00000381341.2
|
DDX1
|
DEAD (Asp-Glu-Ala-Asp) box helicase 1 |
| chr2_+_189157536 | 6.23 |
ENST00000409580.1
ENST00000409637.3 |
GULP1
|
GULP, engulfment adaptor PTB domain containing 1 |
| chr2_+_189157498 | 6.12 |
ENST00000359135.3
|
GULP1
|
GULP, engulfment adaptor PTB domain containing 1 |
| chr1_+_44440575 | 6.11 |
ENST00000532642.1
ENST00000236067.4 ENST00000471859.2 |
ATP6V0B
|
ATPase, H+ transporting, lysosomal 21kDa, V0 subunit b |
| chr5_-_131562935 | 6.07 |
ENST00000379104.2
ENST00000379100.2 ENST00000428369.1 |
P4HA2
|
prolyl 4-hydroxylase, alpha polypeptide II |
| chr1_+_32687971 | 6.00 |
ENST00000373586.1
|
EIF3I
|
eukaryotic translation initiation factor 3, subunit I |
| chr15_-_66790146 | 6.00 |
ENST00000316634.5
|
SNAPC5
|
small nuclear RNA activating complex, polypeptide 5, 19kDa |
| chr12_+_16035307 | 5.97 |
ENST00000538352.1
ENST00000025399.6 ENST00000419869.2 |
STRAP
|
serine/threonine kinase receptor associated protein |
| chr19_-_55919087 | 5.96 |
ENST00000587845.1
ENST00000589978.1 ENST00000264552.9 |
UBE2S
|
ubiquitin-conjugating enzyme E2S |
| chr21_-_43187231 | 5.93 |
ENST00000332512.3
ENST00000352483.2 |
RIPK4
|
receptor-interacting serine-threonine kinase 4 |
| chr19_+_36630961 | 5.89 |
ENST00000587718.1
ENST00000592483.1 ENST00000590874.1 ENST00000588815.1 |
CAPNS1
|
calpain, small subunit 1 |
| chr11_+_1968508 | 5.88 |
ENST00000397298.3
ENST00000381519.1 ENST00000397297.3 ENST00000381514.3 ENST00000397294.3 |
MRPL23
|
mitochondrial ribosomal protein L23 |
| chr11_-_65325430 | 5.84 |
ENST00000322147.4
|
LTBP3
|
latent transforming growth factor beta binding protein 3 |
| chr1_-_3816779 | 5.78 |
ENST00000361605.3
|
C1orf174
|
chromosome 1 open reading frame 174 |
| chr13_+_76123883 | 5.77 |
ENST00000377595.3
|
UCHL3
|
ubiquitin carboxyl-terminal esterase L3 (ubiquitin thiolesterase) |
| chr11_-_65308082 | 5.72 |
ENST00000532661.1
|
LTBP3
|
latent transforming growth factor beta binding protein 3 |
| chr7_-_105752971 | 5.69 |
ENST00000011473.2
|
SYPL1
|
synaptophysin-like 1 |
| chr17_-_47785504 | 5.66 |
ENST00000514907.1
ENST00000503334.1 ENST00000508520.1 |
SLC35B1
|
solute carrier family 35, member B1 |
| chr11_-_8986474 | 5.58 |
ENST00000525069.1
|
TMEM9B
|
TMEM9 domain family, member B |
| chr20_-_5107180 | 5.56 |
ENST00000379160.3
|
PCNA
|
proliferating cell nuclear antigen |
| chr17_-_4843206 | 5.54 |
ENST00000576951.1
|
SLC25A11
|
solute carrier family 25 (mitochondrial carrier; oxoglutarate carrier), member 11 |
| chr2_+_192110199 | 5.53 |
ENST00000304164.4
|
MYO1B
|
myosin IB |
| chr5_+_68530668 | 5.49 |
ENST00000506563.1
|
CDK7
|
cyclin-dependent kinase 7 |
| chr22_+_50312379 | 5.47 |
ENST00000407217.3
ENST00000403427.3 |
CRELD2
|
cysteine-rich with EGF-like domains 2 |
| chr15_-_37393406 | 5.46 |
ENST00000338564.5
ENST00000558313.1 ENST00000340545.5 |
MEIS2
|
Meis homeobox 2 |
| chr3_-_107941230 | 5.46 |
ENST00000264538.3
|
IFT57
|
intraflagellar transport 57 homolog (Chlamydomonas) |
| chr6_-_2971792 | 5.37 |
ENST00000380546.3
|
SERPINB6
|
serpin peptidase inhibitor, clade B (ovalbumin), member 6 |
| chr4_-_183838747 | 5.29 |
ENST00000438320.2
|
DCTD
|
dCMP deaminase |
| chr19_+_54694119 | 5.27 |
ENST00000456872.1
ENST00000302937.4 ENST00000429671.2 |
TSEN34
|
TSEN34 tRNA splicing endonuclease subunit |
| chr2_-_150444116 | 5.27 |
ENST00000428879.1
ENST00000422782.2 |
MMADHC
|
methylmalonic aciduria (cobalamin deficiency) cblD type, with homocystinuria |
| chr1_+_223889285 | 5.27 |
ENST00000433674.2
|
CAPN2
|
calpain 2, (m/II) large subunit |
| chr19_+_16186903 | 5.26 |
ENST00000588507.1
|
TPM4
|
tropomyosin 4 |
| chr2_-_62115659 | 5.25 |
ENST00000544185.1
|
CCT4
|
chaperonin containing TCP1, subunit 4 (delta) |
| chr1_-_150208498 | 5.22 |
ENST00000314136.8
|
ANP32E
|
acidic (leucine-rich) nuclear phosphoprotein 32 family, member E |
| chr2_-_150444300 | 5.22 |
ENST00000303319.5
|
MMADHC
|
methylmalonic aciduria (cobalamin deficiency) cblD type, with homocystinuria |
| chr14_-_100841670 | 5.22 |
ENST00000557297.1
ENST00000555813.1 ENST00000557135.1 ENST00000556698.1 ENST00000554509.1 ENST00000555410.1 |
WARS
|
tryptophanyl-tRNA synthetase |
| chr7_+_5085452 | 5.21 |
ENST00000353796.3
ENST00000396912.1 ENST00000396904.2 |
RBAK
RBAK-RBAKDN
|
RB-associated KRAB zinc finger RBAK-RBAKDN readthrough |
| chr7_-_45960850 | 5.18 |
ENST00000381083.4
ENST00000381086.5 ENST00000275521.6 |
IGFBP3
|
insulin-like growth factor binding protein 3 |
| chr4_+_39699664 | 5.17 |
ENST00000261427.5
ENST00000510934.1 ENST00000295963.6 |
UBE2K
|
ubiquitin-conjugating enzyme E2K |
| chr6_-_2971429 | 5.14 |
ENST00000380529.1
|
SERPINB6
|
serpin peptidase inhibitor, clade B (ovalbumin), member 6 |
| chr5_+_177019159 | 5.12 |
ENST00000332598.6
|
TMED9
|
transmembrane emp24 protein transport domain containing 9 |
| chr14_+_103801140 | 5.09 |
ENST00000561325.1
ENST00000392715.2 ENST00000559130.1 ENST00000559532.1 ENST00000558506.1 |
EIF5
|
eukaryotic translation initiation factor 5 |
| chr10_+_70748487 | 5.09 |
ENST00000361983.4
|
KIAA1279
|
KIAA1279 |
| chr2_-_3523507 | 5.02 |
ENST00000327435.6
|
ADI1
|
acireductone dioxygenase 1 |
| chr14_+_52456327 | 4.99 |
ENST00000556760.1
|
C14orf166
|
chromosome 14 open reading frame 166 |
| chr2_-_62115725 | 4.98 |
ENST00000538252.1
ENST00000544079.1 ENST00000394440.3 |
CCT4
|
chaperonin containing TCP1, subunit 4 (delta) |
| chr15_-_90777277 | 4.96 |
ENST00000328649.6
|
CIB1
|
calcium and integrin binding 1 (calmyrin) |
| chr14_+_52456193 | 4.95 |
ENST00000261700.3
|
C14orf166
|
chromosome 14 open reading frame 166 |
| chr14_-_74959978 | 4.92 |
ENST00000541064.1
|
NPC2
|
Niemann-Pick disease, type C2 |
| chr18_+_19749386 | 4.92 |
ENST00000269216.3
|
GATA6
|
GATA binding protein 6 |
| chr17_+_66244071 | 4.90 |
ENST00000580548.1
ENST00000580753.1 ENST00000392720.2 ENST00000359783.4 ENST00000584837.1 ENST00000579724.1 ENST00000584494.1 ENST00000580837.1 |
AMZ2
|
archaelysin family metallopeptidase 2 |
| chr14_+_93651296 | 4.87 |
ENST00000283534.4
ENST00000557574.1 |
TMEM251
RP11-371E8.4
|
transmembrane protein 251 Uncharacterized protein |
| chr2_-_264024 | 4.87 |
ENST00000403712.2
ENST00000356150.5 ENST00000405430.1 |
SH3YL1
|
SH3 and SYLF domain containing 1 |
| chr14_+_24605361 | 4.84 |
ENST00000206451.6
ENST00000559123.1 |
PSME1
|
proteasome (prosome, macropain) activator subunit 1 (PA28 alpha) |
| chr6_-_2971494 | 4.81 |
ENST00000380539.1
|
SERPINB6
|
serpin peptidase inhibitor, clade B (ovalbumin), member 6 |
| chr14_-_74960030 | 4.79 |
ENST00000553490.1
ENST00000557510.1 |
NPC2
|
Niemann-Pick disease, type C2 |
| chr6_-_5260963 | 4.77 |
ENST00000464010.1
ENST00000468929.1 ENST00000480566.1 |
LYRM4
|
LYR motif containing 4 |
| chr22_+_24309089 | 4.77 |
ENST00000215770.5
|
DDTL
|
D-dopachrome tautomerase-like |
| chr3_+_52232102 | 4.74 |
ENST00000469224.1
ENST00000394965.2 ENST00000310271.2 ENST00000484952.1 |
ALAS1
|
aminolevulinate, delta-, synthase 1 |
| chr19_-_13068012 | 4.73 |
ENST00000316939.1
|
GADD45GIP1
|
growth arrest and DNA-damage-inducible, gamma interacting protein 1 |
| chr10_+_51565108 | 4.71 |
ENST00000438493.1
ENST00000452682.1 |
NCOA4
|
nuclear receptor coactivator 4 |
| chr18_+_12947981 | 4.71 |
ENST00000262124.11
|
SEH1L
|
SEH1-like (S. cerevisiae) |
| chr2_+_63816295 | 4.71 |
ENST00000539945.1
ENST00000544381.1 |
MDH1
|
malate dehydrogenase 1, NAD (soluble) |
| chr14_-_45603657 | 4.71 |
ENST00000396062.3
|
FKBP3
|
FK506 binding protein 3, 25kDa |
| chr5_+_33441053 | 4.66 |
ENST00000541634.1
ENST00000455217.2 ENST00000414361.2 |
TARS
|
threonyl-tRNA synthetase |
| chr9_+_127631399 | 4.65 |
ENST00000259477.6
|
ARPC5L
|
actin related protein 2/3 complex, subunit 5-like |
| chr3_-_183602515 | 4.64 |
ENST00000449306.1
ENST00000435888.1 ENST00000311101.5 ENST00000317096.4 |
PARL
|
presenilin associated, rhomboid-like |
| chr1_+_155178481 | 4.63 |
ENST00000368376.3
|
MTX1
|
metaxin 1 |
| chr7_+_79764104 | 4.61 |
ENST00000351004.3
|
GNAI1
|
guanine nucleotide binding protein (G protein), alpha inhibiting activity polypeptide 1 |
| chr7_-_107642348 | 4.57 |
ENST00000393561.1
|
LAMB1
|
laminin, beta 1 |
| chr16_-_11680791 | 4.54 |
ENST00000571976.1
ENST00000413364.2 |
LITAF
|
lipopolysaccharide-induced TNF factor |
| chr17_+_42427826 | 4.52 |
ENST00000586443.1
|
GRN
|
granulin |
| chr17_+_15902694 | 4.52 |
ENST00000261647.5
ENST00000486880.2 |
TTC19
|
tetratricopeptide repeat domain 19 |
| chr1_-_43855444 | 4.50 |
ENST00000372455.4
|
MED8
|
mediator complex subunit 8 |
| chr14_-_74959994 | 4.50 |
ENST00000238633.2
ENST00000434013.2 |
NPC2
|
Niemann-Pick disease, type C2 |
| chr22_-_32058166 | 4.41 |
ENST00000435900.1
ENST00000336566.4 |
PISD
|
phosphatidylserine decarboxylase |
| chr10_+_89419370 | 4.37 |
ENST00000361175.4
ENST00000456849.1 |
PAPSS2
|
3'-phosphoadenosine 5'-phosphosulfate synthase 2 |
| chr7_+_2394445 | 4.36 |
ENST00000360876.4
ENST00000413917.1 ENST00000397011.2 |
EIF3B
|
eukaryotic translation initiation factor 3, subunit B |
| chr10_+_51565188 | 4.32 |
ENST00000430396.2
ENST00000374087.4 ENST00000414907.2 |
NCOA4
|
nuclear receptor coactivator 4 |
| chr7_+_143079000 | 4.32 |
ENST00000392910.2
|
ZYX
|
zyxin |
| chr8_+_37887772 | 4.30 |
ENST00000338825.4
|
EIF4EBP1
|
eukaryotic translation initiation factor 4E binding protein 1 |
| chr2_-_37899323 | 4.30 |
ENST00000295324.3
ENST00000457889.1 |
CDC42EP3
|
CDC42 effector protein (Rho GTPase binding) 3 |
| chr9_-_116172617 | 4.26 |
ENST00000374169.3
|
POLE3
|
polymerase (DNA directed), epsilon 3, accessory subunit |
| chrX_+_54834004 | 4.25 |
ENST00000375068.1
|
MAGED2
|
melanoma antigen family D, 2 |
| chr2_-_86790593 | 4.25 |
ENST00000263856.4
ENST00000409225.2 |
CHMP3
|
charged multivesicular body protein 3 |
| chr22_+_21996549 | 4.24 |
ENST00000248958.4
|
SDF2L1
|
stromal cell-derived factor 2-like 1 |
| chr21_+_47518011 | 4.24 |
ENST00000300527.4
ENST00000357838.4 ENST00000310645.5 |
COL6A2
|
collagen, type VI, alpha 2 |
| chr5_+_68530697 | 4.16 |
ENST00000256443.3
ENST00000514676.1 |
CDK7
|
cyclin-dependent kinase 7 |
| chr14_+_93651358 | 4.12 |
ENST00000415050.2
|
TMEM251
|
transmembrane protein 251 |
| chr14_-_105262055 | 4.10 |
ENST00000349310.3
|
AKT1
|
v-akt murine thymoma viral oncogene homolog 1 |
| chr21_-_27107344 | 4.09 |
ENST00000457143.2
|
ATP5J
|
ATP synthase, H+ transporting, mitochondrial Fo complex, subunit F6 |
| chr9_-_116172946 | 4.07 |
ENST00000374171.4
|
POLE3
|
polymerase (DNA directed), epsilon 3, accessory subunit |
| chr3_+_184079492 | 4.07 |
ENST00000456318.1
ENST00000412877.1 ENST00000438240.1 |
POLR2H
|
polymerase (RNA) II (DNA directed) polypeptide H |
| chr12_+_4758264 | 4.04 |
ENST00000266544.5
|
NDUFA9
|
NADH dehydrogenase (ubiquinone) 1 alpha subcomplex, 9, 39kDa |
| chr13_+_113951532 | 4.03 |
ENST00000332556.4
|
LAMP1
|
lysosomal-associated membrane protein 1 |
| chr1_+_43996518 | 4.03 |
ENST00000359947.4
ENST00000438120.1 |
PTPRF
|
protein tyrosine phosphatase, receptor type, F |
| chr16_+_14726672 | 4.03 |
ENST00000261658.2
ENST00000563971.1 |
BFAR
|
bifunctional apoptosis regulator |
| chr2_+_264869 | 4.03 |
ENST00000272067.6
ENST00000272065.5 ENST00000407983.3 |
ACP1
|
acid phosphatase 1, soluble |
| chr15_-_75248954 | 4.01 |
ENST00000499788.2
|
RPP25
|
ribonuclease P/MRP 25kDa subunit |
| chr12_+_102091400 | 4.00 |
ENST00000229266.3
ENST00000549872.1 |
CHPT1
|
choline phosphotransferase 1 |
| chr1_-_110950255 | 4.00 |
ENST00000483260.1
ENST00000474861.2 ENST00000602318.1 |
LAMTOR5
|
late endosomal/lysosomal adaptor, MAPK and MTOR activator 5 |
| chr16_-_69364467 | 4.00 |
ENST00000288022.1
|
PDF
|
peptide deformylase (mitochondrial) |
| chr21_-_27107198 | 3.98 |
ENST00000400094.1
|
ATP5J
|
ATP synthase, H+ transporting, mitochondrial Fo complex, subunit F6 |
| chr8_+_48920960 | 3.97 |
ENST00000523111.2
ENST00000523432.1 ENST00000521346.1 ENST00000517630.1 |
UBE2V2
|
ubiquitin-conjugating enzyme E2 variant 2 |
| chr5_-_114961858 | 3.96 |
ENST00000282382.4
ENST00000456936.3 ENST00000408996.4 |
TMED7-TICAM2
TMED7
TICAM2
|
TMED7-TICAM2 readthrough transmembrane emp24 protein transport domain containing 7 toll-like receptor adaptor molecule 2 |
| chr8_+_97274119 | 3.93 |
ENST00000455950.2
|
PTDSS1
|
phosphatidylserine synthase 1 |
| chr1_-_150207017 | 3.91 |
ENST00000369119.3
|
ANP32E
|
acidic (leucine-rich) nuclear phosphoprotein 32 family, member E |
| chr1_-_53704157 | 3.91 |
ENST00000371466.4
ENST00000371470.3 |
MAGOH
|
mago-nashi homolog, proliferation-associated (Drosophila) |
| chr1_-_19638566 | 3.90 |
ENST00000330072.5
ENST00000235835.3 |
AKR7A2
|
aldo-keto reductase family 7, member A2 (aflatoxin aldehyde reductase) |
| chr14_-_105262016 | 3.90 |
ENST00000407796.2
|
AKT1
|
v-akt murine thymoma viral oncogene homolog 1 |
| chr17_-_80231300 | 3.87 |
ENST00000398519.5
ENST00000580446.1 |
CSNK1D
|
casein kinase 1, delta |
| chrX_+_54834791 | 3.86 |
ENST00000218439.4
ENST00000375058.1 ENST00000375060.1 |
MAGED2
|
melanoma antigen family D, 2 |
| chr15_+_75628394 | 3.85 |
ENST00000564815.1
ENST00000338995.6 |
COMMD4
|
COMM domain containing 4 |
| chr3_-_142608001 | 3.83 |
ENST00000295992.3
|
PCOLCE2
|
procollagen C-endopeptidase enhancer 2 |
| chr20_+_34129770 | 3.81 |
ENST00000348547.2
ENST00000357394.4 ENST00000447986.1 ENST00000279052.6 ENST00000416206.1 ENST00000411577.1 ENST00000413587.1 |
ERGIC3
|
ERGIC and golgi 3 |
| chr17_+_79650962 | 3.79 |
ENST00000329138.4
|
HGS
|
hepatocyte growth factor-regulated tyrosine kinase substrate |
| chr15_+_75628232 | 3.79 |
ENST00000267935.8
ENST00000567195.1 |
COMMD4
|
COMM domain containing 4 |
| chr20_+_25388293 | 3.79 |
ENST00000262460.4
ENST00000429262.2 |
GINS1
|
GINS complex subunit 1 (Psf1 homolog) |
| chr19_-_2050852 | 3.78 |
ENST00000541165.1
ENST00000591601.1 |
MKNK2
|
MAP kinase interacting serine/threonine kinase 2 |
| chr17_-_73179046 | 3.77 |
ENST00000314523.7
ENST00000420826.2 |
SUMO2
|
small ubiquitin-like modifier 2 |
| chr12_+_7033616 | 3.76 |
ENST00000356654.4
|
ATN1
|
atrophin 1 |
| chr6_-_127664736 | 3.76 |
ENST00000368291.2
ENST00000309620.9 ENST00000454859.3 |
ECHDC1
|
enoyl CoA hydratase domain containing 1 |
| chr4_+_39699776 | 3.75 |
ENST00000503368.1
ENST00000445950.2 |
UBE2K
|
ubiquitin-conjugating enzyme E2K |
| chr9_-_127952187 | 3.73 |
ENST00000451402.1
ENST00000415905.1 |
PPP6C
|
protein phosphatase 6, catalytic subunit |
| chr1_-_68962805 | 3.73 |
ENST00000370966.5
|
DEPDC1
|
DEP domain containing 1 |
| chr19_-_4540486 | 3.72 |
ENST00000306390.6
|
LRG1
|
leucine-rich alpha-2-glycoprotein 1 |
| chr4_+_110354928 | 3.72 |
ENST00000504968.2
ENST00000399100.2 ENST00000265175.5 |
SEC24B
|
SEC24 family member B |
| chr17_+_8191815 | 3.70 |
ENST00000226105.6
ENST00000407006.4 ENST00000580434.1 ENST00000439238.3 |
RANGRF
|
RAN guanine nucleotide release factor |
| chr6_-_127664683 | 3.69 |
ENST00000528402.1
ENST00000454591.2 |
ECHDC1
|
enoyl CoA hydratase domain containing 1 |
| chr1_-_211848899 | 3.68 |
ENST00000366998.3
ENST00000540251.1 ENST00000366999.4 |
NEK2
|
NIMA-related kinase 2 |
| chr6_+_29910301 | 3.67 |
ENST00000376809.5
ENST00000376802.2 |
HLA-A
|
major histocompatibility complex, class I, A |
| chr4_+_107236722 | 3.67 |
ENST00000442366.1
|
AIMP1
|
aminoacyl tRNA synthetase complex-interacting multifunctional protein 1 |
| chrX_+_38660704 | 3.64 |
ENST00000378474.3
|
MID1IP1
|
MID1 interacting protein 1 |
| chr16_-_29875057 | 3.64 |
ENST00000219789.6
|
CDIPT
|
CDP-diacylglycerol--inositol 3-phosphatidyltransferase |
| chr7_+_148395733 | 3.63 |
ENST00000602748.1
|
CUL1
|
cullin 1 |
| chr22_+_38349670 | 3.62 |
ENST00000442738.2
ENST00000460648.1 ENST00000407936.1 ENST00000488684.1 ENST00000492213.1 ENST00000606538.1 ENST00000405557.1 |
POLR2F
|
polymerase (RNA) II (DNA directed) polypeptide F |
| chr21_-_27107283 | 3.62 |
ENST00000284971.3
ENST00000400099.1 |
ATP5J
|
ATP synthase, H+ transporting, mitochondrial Fo complex, subunit F6 |
| chr4_+_107236847 | 3.54 |
ENST00000358008.3
|
AIMP1
|
aminoacyl tRNA synthetase complex-interacting multifunctional protein 1 |
| chrX_+_38660682 | 3.51 |
ENST00000457894.1
|
MID1IP1
|
MID1 interacting protein 1 |
| chr16_+_69458428 | 3.47 |
ENST00000512062.1
ENST00000307892.8 |
CYB5B
|
cytochrome b5 type B (outer mitochondrial membrane) |
| chr1_+_76190357 | 3.43 |
ENST00000370834.5
ENST00000541113.1 ENST00000543667.1 ENST00000420607.2 |
ACADM
|
acyl-CoA dehydrogenase, C-4 to C-12 straight chain |
| chr3_+_49059038 | 3.42 |
ENST00000451378.2
|
NDUFAF3
|
NADH dehydrogenase (ubiquinone) complex I, assembly factor 3 |
| chr16_-_11680759 | 3.42 |
ENST00000571459.1
ENST00000570798.1 ENST00000572255.1 ENST00000574763.1 ENST00000574703.1 ENST00000571277.1 ENST00000381810.3 |
LITAF
|
lipopolysaccharide-induced TNF factor |
| chr17_+_57784826 | 3.42 |
ENST00000262291.4
|
VMP1
|
vacuole membrane protein 1 |
| chr7_+_150065879 | 3.42 |
ENST00000397281.2
ENST00000444957.1 ENST00000466559.1 ENST00000489432.2 ENST00000475514.1 ENST00000482680.1 ENST00000488943.1 ENST00000518514.1 ENST00000478789.1 |
REPIN1
ZNF775
|
replication initiator 1 zinc finger protein 775 |
| chr17_-_53809473 | 3.40 |
ENST00000575734.1
|
TMEM100
|
transmembrane protein 100 |
| chr6_+_7541845 | 3.37 |
ENST00000418664.2
|
DSP
|
desmoplakin |
| chr6_-_35888905 | 3.37 |
ENST00000510290.1
ENST00000423325.2 ENST00000373822.1 |
SRPK1
|
SRSF protein kinase 1 |
| chr3_+_127317066 | 3.36 |
ENST00000265056.7
|
MCM2
|
minichromosome maintenance complex component 2 |
| chr20_+_388935 | 3.31 |
ENST00000382181.2
ENST00000400247.3 |
RBCK1
|
RanBP-type and C3HC4-type zinc finger containing 1 |
| chr1_+_155178518 | 3.31 |
ENST00000316721.4
|
MTX1
|
metaxin 1 |
| chr17_-_72864739 | 3.31 |
ENST00000579893.1
ENST00000544854.1 |
FDXR
|
ferredoxin reductase |
| chrX_+_11129388 | 3.29 |
ENST00000321143.4
ENST00000380763.3 ENST00000380762.4 |
HCCS
|
holocytochrome c synthase |
| chr22_+_45072958 | 3.29 |
ENST00000403581.1
|
PRR5
|
proline rich 5 (renal) |
| chr22_+_45072925 | 3.28 |
ENST00000006251.7
|
PRR5
|
proline rich 5 (renal) |
| chr22_+_37415776 | 3.27 |
ENST00000341116.3
ENST00000429360.2 ENST00000404393.1 |
MPST
|
mercaptopyruvate sulfurtransferase |
| chr3_-_52486841 | 3.27 |
ENST00000496590.1
|
TNNC1
|
troponin C type 1 (slow) |
| chr5_+_138609441 | 3.22 |
ENST00000509990.1
ENST00000506147.1 ENST00000512107.1 |
MATR3
|
matrin 3 |
| chr9_-_79009414 | 3.21 |
ENST00000376736.1
|
RFK
|
riboflavin kinase |
| chr14_-_75536182 | 3.20 |
ENST00000555463.1
|
ACYP1
|
acylphosphatase 1, erythrocyte (common) type |
| chr12_-_125348329 | 3.19 |
ENST00000546215.1
ENST00000415380.2 ENST00000261693.6 ENST00000376788.1 ENST00000545493.1 |
SCARB1
|
scavenger receptor class B, member 1 |
| chr20_+_43160409 | 3.19 |
ENST00000372894.3
ENST00000372892.3 ENST00000372891.3 |
PKIG
|
protein kinase (cAMP-dependent, catalytic) inhibitor gamma |
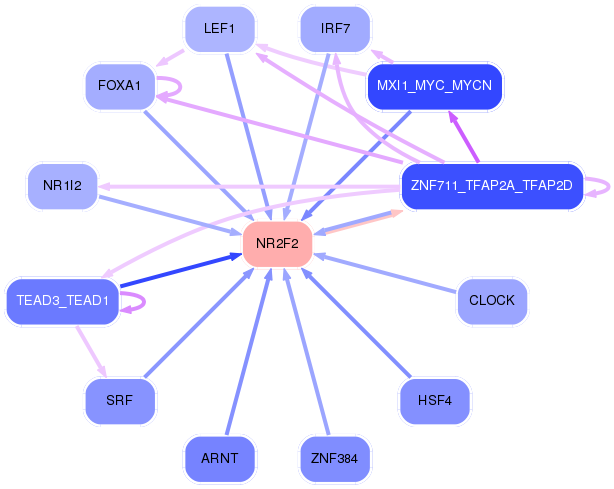
Network of associatons between targets according to the STRING database.

First level regulatory network of NR2F2
Gene Ontology Analysis
Gene overrepresentation in biological_process category:
| Log-likelihood per target | Total log-likelihood | Term | Description |
|---|---|---|---|
| 6.6 | 6.6 | GO:1902957 | negative regulation of mitochondrial electron transport, NADH to ubiquinone(GO:1902957) |
| 5.8 | 17.4 | GO:1904247 | positive regulation of polynucleotide adenylyltransferase activity(GO:1904247) |
| 3.9 | 11.8 | GO:0006435 | threonyl-tRNA aminoacylation(GO:0006435) |
| 3.6 | 14.2 | GO:0019747 | regulation of isoprenoid metabolic process(GO:0019747) |
| 2.9 | 11.6 | GO:1902462 | regulation of mesenchymal stem cell proliferation(GO:1902460) positive regulation of mesenchymal stem cell proliferation(GO:1902462) |
| 2.6 | 10.5 | GO:0043321 | regulation of natural killer cell degranulation(GO:0043321) positive regulation of natural killer cell degranulation(GO:0043323) |
| 2.5 | 10.1 | GO:0021796 | cerebral cortex regionalization(GO:0021796) |
| 2.2 | 6.6 | GO:1901301 | regulation of cargo loading into COPII-coated vesicle(GO:1901301) |
| 2.1 | 8.5 | GO:1903422 | negative regulation of synaptic vesicle recycling(GO:1903422) |
| 2.0 | 18.3 | GO:0046073 | dTMP biosynthetic process(GO:0006231) dTMP metabolic process(GO:0046073) |
| 2.0 | 6.0 | GO:0044314 | protein K27-linked ubiquitination(GO:0044314) |
| 1.9 | 13.6 | GO:0032077 | positive regulation of deoxyribonuclease activity(GO:0032077) |
| 1.9 | 5.7 | GO:0015785 | UDP-galactose transport(GO:0015785) UDP-galactose transmembrane transport(GO:0072334) |
| 1.9 | 5.6 | GO:0042727 | flavin-containing compound biosynthetic process(GO:0042727) |
| 1.8 | 21.5 | GO:0006388 | tRNA splicing, via endonucleolytic cleavage and ligation(GO:0006388) |
| 1.7 | 10.5 | GO:0044791 | modulation by host of viral release from host cell(GO:0044789) positive regulation by host of viral release from host cell(GO:0044791) |
| 1.7 | 10.2 | GO:1901029 | adenine transport(GO:0015853) negative regulation of mitochondrial outer membrane permeabilization involved in apoptotic signaling pathway(GO:1901029) |
| 1.7 | 11.9 | GO:0070294 | renal sodium ion absorption(GO:0070294) |
| 1.7 | 6.7 | GO:0009224 | CMP salvage(GO:0006238) CMP biosynthetic process(GO:0009224) CMP metabolic process(GO:0046035) |
| 1.7 | 6.6 | GO:0002086 | diaphragm contraction(GO:0002086) |
| 1.7 | 5.0 | GO:0038163 | endomitotic cell cycle(GO:0007113) thrombopoietin-mediated signaling pathway(GO:0038163) |
| 1.6 | 4.9 | GO:0032911 | negative regulation of transforming growth factor beta1 production(GO:0032911) |
| 1.6 | 6.4 | GO:0015746 | tricarboxylic acid transport(GO:0006842) citrate transport(GO:0015746) |
| 1.5 | 13.6 | GO:1904715 | negative regulation of chaperone-mediated autophagy(GO:1904715) |
| 1.3 | 13.0 | GO:0009249 | protein lipoylation(GO:0009249) |
| 1.3 | 7.8 | GO:0015742 | alpha-ketoglutarate transport(GO:0015742) |
| 1.3 | 5.1 | GO:0048200 | COPI-coated vesicle budding(GO:0035964) Golgi transport vesicle coating(GO:0048200) COPI coating of Golgi vesicle(GO:0048205) |
| 1.3 | 8.9 | GO:0010993 | regulation of ubiquitin homeostasis(GO:0010993) free ubiquitin chain polymerization(GO:0010994) |
| 1.2 | 8.3 | GO:0038203 | TORC2 signaling(GO:0038203) |
| 1.2 | 4.7 | GO:1903862 | positive regulation of oxidative phosphorylation(GO:1903862) |
| 1.2 | 7.0 | GO:0071651 | positive regulation of chemokine (C-C motif) ligand 5 production(GO:0071651) |
| 1.1 | 3.4 | GO:0019254 | carnitine metabolic process, CoA-linked(GO:0019254) |
| 1.1 | 4.6 | GO:0021812 | neuronal-glial interaction involved in cerebral cortex radial glia guided migration(GO:0021812) |
| 1.1 | 8.0 | GO:0052405 | negative regulation by host of symbiont molecular function(GO:0052405) |
| 1.1 | 5.5 | GO:0009440 | cyanate metabolic process(GO:0009439) cyanate catabolic process(GO:0009440) |
| 1.1 | 4.4 | GO:0000103 | sulfate assimilation(GO:0000103) |
| 1.1 | 13.1 | GO:1904263 | positive regulation of TORC1 signaling(GO:1904263) |
| 1.1 | 3.2 | GO:0015920 | lipopolysaccharide transport(GO:0015920) |
| 1.0 | 5.2 | GO:0006436 | tryptophanyl-tRNA aminoacylation(GO:0006436) |
| 1.0 | 3.1 | GO:1901355 | response to rapamycin(GO:1901355) |
| 1.0 | 10.2 | GO:0090666 | scaRNA localization to Cajal body(GO:0090666) |
| 1.0 | 4.0 | GO:0006663 | platelet activating factor biosynthetic process(GO:0006663) |
| 1.0 | 7.7 | GO:0072733 | response to staurosporine(GO:0072733) cellular response to staurosporine(GO:0072734) |
| 0.9 | 3.7 | GO:0098905 | regulation of bundle of His cell action potential(GO:0098905) |
| 0.9 | 2.8 | GO:0000965 | mitochondrial RNA 3'-end processing(GO:0000965) |
| 0.9 | 2.7 | GO:0006427 | histidyl-tRNA aminoacylation(GO:0006427) |
| 0.9 | 4.4 | GO:0070682 | proteasome regulatory particle assembly(GO:0070682) |
| 0.9 | 2.6 | GO:1901837 | positive regulation of maintenance of sister chromatid cohesion(GO:0034093) positive regulation of maintenance of mitotic sister chromatid cohesion(GO:0034184) negative regulation of transcription of nuclear large rRNA transcript from RNA polymerase I promoter(GO:1901837) negative regulation of protein localization to chromosome, telomeric region(GO:1904815) |
| 0.8 | 12.7 | GO:0019511 | peptidyl-proline hydroxylation(GO:0019511) |
| 0.8 | 3.3 | GO:0090481 | pyrimidine nucleotide-sugar transmembrane transport(GO:0090481) |
| 0.8 | 3.2 | GO:0001545 | primary ovarian follicle growth(GO:0001545) |
| 0.8 | 5.7 | GO:1902963 | regulation of metalloendopeptidase activity involved in amyloid precursor protein catabolic process(GO:1902962) negative regulation of metalloendopeptidase activity involved in amyloid precursor protein catabolic process(GO:1902963) |
| 0.8 | 2.3 | GO:0031548 | regulation of brain-derived neurotrophic factor receptor signaling pathway(GO:0031548) |
| 0.7 | 3.7 | GO:0030997 | regulation of centriole-centriole cohesion(GO:0030997) |
| 0.7 | 2.1 | GO:0006269 | DNA replication, synthesis of RNA primer(GO:0006269) |
| 0.7 | 17.7 | GO:0000028 | ribosomal small subunit assembly(GO:0000028) |
| 0.7 | 10.4 | GO:0090168 | Golgi reassembly(GO:0090168) |
| 0.7 | 6.9 | GO:0010265 | SCF complex assembly(GO:0010265) |
| 0.7 | 2.0 | GO:0042823 | pyridoxal phosphate metabolic process(GO:0042822) pyridoxal phosphate biosynthetic process(GO:0042823) |
| 0.7 | 4.0 | GO:0007185 | transmembrane receptor protein tyrosine phosphatase signaling pathway(GO:0007185) |
| 0.7 | 2.6 | GO:0046116 | queuosine biosynthetic process(GO:0008616) queuosine metabolic process(GO:0046116) |
| 0.6 | 1.9 | GO:0007518 | myoblast fate determination(GO:0007518) |
| 0.6 | 1.2 | GO:0090073 | positive regulation of protein homodimerization activity(GO:0090073) |
| 0.6 | 7.2 | GO:0006108 | malate metabolic process(GO:0006108) |
| 0.6 | 2.4 | GO:0021896 | forebrain astrocyte differentiation(GO:0021896) forebrain astrocyte development(GO:0021897) |
| 0.6 | 18.9 | GO:0006622 | protein targeting to lysosome(GO:0006622) |
| 0.6 | 27.2 | GO:0006363 | termination of RNA polymerase I transcription(GO:0006363) |
| 0.6 | 4.0 | GO:1903895 | negative regulation of IRE1-mediated unfolded protein response(GO:1903895) |
| 0.6 | 2.3 | GO:0014040 | positive regulation of Schwann cell differentiation(GO:0014040) |
| 0.6 | 6.9 | GO:0046689 | response to mercury ion(GO:0046689) |
| 0.6 | 2.8 | GO:2000814 | regulation of unidimensional cell growth(GO:0051510) negative regulation of unidimensional cell growth(GO:0051511) establishment of cell polarity regulating cell shape(GO:0071964) regulation of establishment or maintenance of cell polarity regulating cell shape(GO:2000769) positive regulation of establishment or maintenance of cell polarity regulating cell shape(GO:2000771) regulation of establishment of cell polarity regulating cell shape(GO:2000782) positive regulation of establishment of cell polarity regulating cell shape(GO:2000784) regulation of barbed-end actin filament capping(GO:2000812) positive regulation of barbed-end actin filament capping(GO:2000814) |
| 0.6 | 4.5 | GO:0097033 | respiratory chain complex III assembly(GO:0017062) mitochondrial respiratory chain complex III assembly(GO:0034551) mitochondrial respiratory chain complex III biogenesis(GO:0097033) |
| 0.6 | 5.1 | GO:0019509 | L-methionine biosynthetic process from methylthioadenosine(GO:0019509) |
| 0.6 | 2.2 | GO:0006556 | S-adenosylmethionine biosynthetic process(GO:0006556) |
| 0.6 | 7.7 | GO:1904776 | regulation of protein localization to cell cortex(GO:1904776) positive regulation of protein localization to cell cortex(GO:1904778) |
| 0.5 | 2.2 | GO:0002270 | plasmacytoid dendritic cell activation(GO:0002270) T cell mediated immune response to tumor cell(GO:0002424) regulation of T cell mediated immune response to tumor cell(GO:0002840) regulation of restriction endodeoxyribonuclease activity(GO:0032072) negative regulation of apoptotic cell clearance(GO:2000426) |
| 0.5 | 4.4 | GO:0075525 | viral translational termination-reinitiation(GO:0075525) |
| 0.5 | 3.2 | GO:0014805 | smooth muscle adaptation(GO:0014805) |
| 0.5 | 1.6 | GO:1901253 | negative regulation of intracellular transport of viral material(GO:1901253) |
| 0.5 | 4.3 | GO:1902188 | positive regulation of viral release from host cell(GO:1902188) |
| 0.5 | 2.0 | GO:0000350 | generation of catalytic spliceosome for second transesterification step(GO:0000350) |
| 0.5 | 3.4 | GO:0060842 | arterial endothelial cell differentiation(GO:0060842) |
| 0.5 | 3.4 | GO:0071896 | protein localization to adherens junction(GO:0071896) |
| 0.5 | 1.4 | GO:0007057 | spindle assembly involved in female meiosis I(GO:0007057) |
| 0.5 | 19.1 | GO:0042407 | cristae formation(GO:0042407) |
| 0.5 | 1.4 | GO:1904933 | cardiac right atrium morphogenesis(GO:0003213) negative regulation of melanin biosynthetic process(GO:0048022) positive regulation of anagen(GO:0051885) cervix development(GO:0060067) lateral sprouting involved in mammary gland duct morphogenesis(GO:0060599) negative regulation of secondary metabolite biosynthetic process(GO:1900377) regulation of cell proliferation in midbrain(GO:1904933) |
| 0.5 | 18.5 | GO:0070911 | global genome nucleotide-excision repair(GO:0070911) |
| 0.5 | 2.8 | GO:0038172 | interleukin-33-mediated signaling pathway(GO:0038172) |
| 0.5 | 3.7 | GO:1903690 | negative regulation of wound healing, spreading of epidermal cells(GO:1903690) |
| 0.5 | 4.6 | GO:0035092 | sperm chromatin condensation(GO:0035092) |
| 0.5 | 3.7 | GO:0006384 | transcription initiation from RNA polymerase III promoter(GO:0006384) |
| 0.5 | 1.4 | GO:0050894 | determination of affect(GO:0050894) |
| 0.4 | 1.3 | GO:0030644 | cellular chloride ion homeostasis(GO:0030644) |
| 0.4 | 0.9 | GO:0051683 | establishment of Golgi localization(GO:0051683) |
| 0.4 | 11.1 | GO:0009235 | cobalamin metabolic process(GO:0009235) |
| 0.4 | 30.4 | GO:0097031 | NADH dehydrogenase complex assembly(GO:0010257) mitochondrial respiratory chain complex I assembly(GO:0032981) mitochondrial respiratory chain complex I biogenesis(GO:0097031) |
| 0.4 | 1.7 | GO:0070131 | positive regulation of mitochondrial translation(GO:0070131) |
| 0.4 | 2.9 | GO:0046322 | negative regulation of fatty acid oxidation(GO:0046322) |
| 0.4 | 2.0 | GO:0061107 | prostate gland stromal morphogenesis(GO:0060741) seminal vesicle development(GO:0061107) |
| 0.4 | 3.7 | GO:0006268 | DNA unwinding involved in DNA replication(GO:0006268) |
| 0.4 | 7.3 | GO:0006853 | carnitine shuttle(GO:0006853) |
| 0.4 | 3.2 | GO:0006659 | phosphatidylserine biosynthetic process(GO:0006659) |
| 0.4 | 4.7 | GO:0006782 | protoporphyrinogen IX biosynthetic process(GO:0006782) |
| 0.4 | 14.5 | GO:0001937 | negative regulation of endothelial cell proliferation(GO:0001937) |
| 0.4 | 3.9 | GO:0044597 | polyketide metabolic process(GO:0030638) aminoglycoside antibiotic metabolic process(GO:0030647) daunorubicin metabolic process(GO:0044597) doxorubicin metabolic process(GO:0044598) |
| 0.4 | 2.7 | GO:1905247 | regulation of aspartic-type endopeptidase activity involved in amyloid precursor protein catabolic process(GO:1902959) positive regulation of aspartic-type endopeptidase activity involved in amyloid precursor protein catabolic process(GO:1902961) regulation of aspartic-type peptidase activity(GO:1905245) positive regulation of aspartic-type peptidase activity(GO:1905247) |
| 0.4 | 1.5 | GO:0003409 | optic cup structural organization(GO:0003409) |
| 0.4 | 5.7 | GO:0060546 | negative regulation of necroptotic process(GO:0060546) |
| 0.4 | 3.8 | GO:0001833 | inner cell mass cell proliferation(GO:0001833) |
| 0.4 | 1.1 | GO:1903926 | signal transduction involved in intra-S DNA damage checkpoint(GO:0072428) response to bisphenol A(GO:1903925) cellular response to bisphenol A(GO:1903926) |
| 0.4 | 3.0 | GO:0006452 | translational frameshifting(GO:0006452) positive regulation of translational termination(GO:0045905) |
| 0.4 | 4.1 | GO:0035986 | senescence-associated heterochromatin focus assembly(GO:0035986) |
| 0.4 | 3.7 | GO:0002480 | antigen processing and presentation of exogenous peptide antigen via MHC class I, TAP-independent(GO:0002480) |
| 0.4 | 2.2 | GO:0070164 | negative regulation of adiponectin secretion(GO:0070164) |
| 0.4 | 2.9 | GO:0033211 | adiponectin-activated signaling pathway(GO:0033211) |
| 0.3 | 3.8 | GO:0001731 | formation of translation preinitiation complex(GO:0001731) |
| 0.3 | 1.0 | GO:0051684 | maintenance of Golgi location(GO:0051684) |
| 0.3 | 2.7 | GO:0001955 | blood vessel maturation(GO:0001955) |
| 0.3 | 5.5 | GO:0060394 | negative regulation of pathway-restricted SMAD protein phosphorylation(GO:0060394) |
| 0.3 | 3.1 | GO:0048050 | post-embryonic eye morphogenesis(GO:0048050) |
| 0.3 | 5.7 | GO:0070208 | protein heterotrimerization(GO:0070208) |
| 0.3 | 4.0 | GO:0018206 | peptidyl-methionine modification(GO:0018206) |
| 0.3 | 4.3 | GO:0031274 | positive regulation of pseudopodium assembly(GO:0031274) |
| 0.3 | 0.7 | GO:0034471 | endonucleolytic cleavage to generate mature 5'-end of SSU-rRNA from (SSU-rRNA, 5.8S rRNA, LSU-rRNA)(GO:0000472) rRNA 5'-end processing(GO:0000967) ncRNA 5'-end processing(GO:0034471) |
| 0.3 | 4.2 | GO:0002192 | IRES-dependent translational initiation(GO:0002192) |
| 0.3 | 1.2 | GO:0090118 | receptor-mediated endocytosis of low-density lipoprotein particle involved in cholesterol transport(GO:0090118) |
| 0.3 | 1.8 | GO:0070966 | nuclear-transcribed mRNA catabolic process, no-go decay(GO:0070966) |
| 0.3 | 1.4 | GO:0010637 | negative regulation of mitochondrial fusion(GO:0010637) |
| 0.3 | 5.0 | GO:0046341 | CDP-diacylglycerol metabolic process(GO:0046341) |
| 0.3 | 7.9 | GO:0007035 | vacuolar acidification(GO:0007035) |
| 0.3 | 0.3 | GO:0035973 | aggrephagy(GO:0035973) |
| 0.3 | 22.8 | GO:0031146 | SCF-dependent proteasomal ubiquitin-dependent protein catabolic process(GO:0031146) |
| 0.3 | 5.2 | GO:0043568 | positive regulation of insulin-like growth factor receptor signaling pathway(GO:0043568) |
| 0.3 | 1.8 | GO:0010918 | positive regulation of mitochondrial membrane potential(GO:0010918) |
| 0.3 | 2.1 | GO:2000507 | positive regulation of energy homeostasis(GO:2000507) |
| 0.3 | 1.5 | GO:0051013 | microtubule severing(GO:0051013) |
| 0.3 | 8.4 | GO:0042347 | negative regulation of NF-kappaB import into nucleus(GO:0042347) |
| 0.3 | 3.8 | GO:0071243 | cellular response to arsenic-containing substance(GO:0071243) |
| 0.3 | 17.1 | GO:0070126 | mitochondrial translational elongation(GO:0070125) mitochondrial translational termination(GO:0070126) |
| 0.2 | 6.2 | GO:0032201 | telomere maintenance via semi-conservative replication(GO:0032201) |
| 0.2 | 2.5 | GO:2001224 | positive regulation of neuron migration(GO:2001224) |
| 0.2 | 1.2 | GO:0035524 | proline transmembrane transport(GO:0035524) |
| 0.2 | 10.5 | GO:0071470 | cellular response to osmotic stress(GO:0071470) |
| 0.2 | 4.6 | GO:0006851 | mitochondrial calcium ion transport(GO:0006851) |
| 0.2 | 3.9 | GO:0043562 | cellular response to nitrogen starvation(GO:0006995) cellular response to nitrogen levels(GO:0043562) |
| 0.2 | 3.9 | GO:0071539 | protein localization to centrosome(GO:0071539) |
| 0.2 | 1.1 | GO:1903361 | protein localization to basolateral plasma membrane(GO:1903361) |
| 0.2 | 1.5 | GO:0051418 | interphase microtubule nucleation by interphase microtubule organizing center(GO:0051415) microtubule nucleation by microtubule organizing center(GO:0051418) |
| 0.2 | 3.3 | GO:0017004 | cytochrome complex assembly(GO:0017004) |
| 0.2 | 4.1 | GO:0016540 | protein autoprocessing(GO:0016540) |
| 0.2 | 1.3 | GO:1903147 | negative regulation of macromitophagy(GO:1901525) negative regulation of mitophagy(GO:1903147) |
| 0.2 | 1.3 | GO:0046985 | positive regulation of hemoglobin biosynthetic process(GO:0046985) |
| 0.2 | 5.1 | GO:0032008 | positive regulation of TOR signaling(GO:0032008) |
| 0.2 | 9.2 | GO:0043486 | histone exchange(GO:0043486) |
| 0.2 | 0.8 | GO:0002572 | pro-T cell differentiation(GO:0002572) |
| 0.2 | 1.0 | GO:0006741 | NADP biosynthetic process(GO:0006741) |
| 0.2 | 3.2 | GO:2000480 | negative regulation of cAMP-dependent protein kinase activity(GO:2000480) |
| 0.2 | 3.0 | GO:0001682 | tRNA 5'-leader removal(GO:0001682) |
| 0.2 | 0.6 | GO:0015879 | carnitine transport(GO:0015879) |
| 0.2 | 1.7 | GO:1904714 | regulation of chaperone-mediated autophagy(GO:1904714) |
| 0.2 | 2.2 | GO:0070327 | thyroid hormone transport(GO:0070327) |
| 0.2 | 3.3 | GO:0006744 | ubiquinone biosynthetic process(GO:0006744) quinone biosynthetic process(GO:1901663) |
| 0.2 | 0.5 | GO:0006612 | protein targeting to membrane(GO:0006612) |
| 0.2 | 1.1 | GO:0048268 | clathrin coat assembly(GO:0048268) |
| 0.2 | 3.0 | GO:0031114 | negative regulation of microtubule depolymerization(GO:0007026) regulation of microtubule depolymerization(GO:0031114) |
| 0.2 | 2.6 | GO:0051256 | mitotic spindle midzone assembly(GO:0051256) |
| 0.2 | 6.9 | GO:0097178 | ruffle assembly(GO:0097178) |
| 0.2 | 1.6 | GO:0043382 | positive regulation of memory T cell differentiation(GO:0043382) |
| 0.2 | 1.3 | GO:0032482 | Rab protein signal transduction(GO:0032482) |
| 0.2 | 0.5 | GO:0090675 | intermicrovillar adhesion(GO:0090675) |
| 0.2 | 17.8 | GO:0070268 | cornification(GO:0070268) |
| 0.1 | 2.2 | GO:0090383 | phagosome acidification(GO:0090383) |
| 0.1 | 2.7 | GO:0042340 | keratan sulfate catabolic process(GO:0042340) |
| 0.1 | 0.6 | GO:0031507 | heterochromatin assembly(GO:0031507) |
| 0.1 | 1.3 | GO:0071763 | nuclear membrane organization(GO:0071763) |
| 0.1 | 0.5 | GO:0051958 | methotrexate transport(GO:0051958) reduced folate transmembrane transport(GO:0098838) |
| 0.1 | 4.2 | GO:0030262 | apoptotic nuclear changes(GO:0030262) |
| 0.1 | 0.4 | GO:0002184 | cytoplasmic translational termination(GO:0002184) |
| 0.1 | 0.5 | GO:0060528 | secretory columnal luminar epithelial cell differentiation involved in prostate glandular acinus development(GO:0060528) |
| 0.1 | 0.2 | GO:0002541 | activation of plasma proteins involved in acute inflammatory response(GO:0002541) |
| 0.1 | 1.9 | GO:0090557 | establishment of endothelial intestinal barrier(GO:0090557) |
| 0.1 | 1.5 | GO:0006054 | N-acetylneuraminate metabolic process(GO:0006054) |
| 0.1 | 2.6 | GO:2000637 | positive regulation of posttranscriptional gene silencing(GO:0060148) positive regulation of gene silencing by miRNA(GO:2000637) |
| 0.1 | 0.2 | GO:0002024 | diet induced thermogenesis(GO:0002024) |
| 0.1 | 2.9 | GO:0043101 | purine-containing compound salvage(GO:0043101) |
| 0.1 | 0.8 | GO:1904153 | negative regulation of protein exit from endoplasmic reticulum(GO:0070862) negative regulation of retrograde protein transport, ER to cytosol(GO:1904153) |
| 0.1 | 2.5 | GO:0060397 | JAK-STAT cascade involved in growth hormone signaling pathway(GO:0060397) |
| 0.1 | 1.2 | GO:1903003 | positive regulation of protein deubiquitination(GO:1903003) |
| 0.1 | 0.4 | GO:0060335 | positive regulation of response to interferon-gamma(GO:0060332) positive regulation of interferon-gamma-mediated signaling pathway(GO:0060335) |
| 0.1 | 3.7 | GO:0050873 | brown fat cell differentiation(GO:0050873) |
| 0.1 | 0.3 | GO:0032815 | negative regulation of natural killer cell activation(GO:0032815) |
| 0.1 | 2.3 | GO:0031581 | hemidesmosome assembly(GO:0031581) |
| 0.1 | 4.7 | GO:0018208 | peptidyl-proline modification(GO:0018208) |
| 0.1 | 0.3 | GO:1903697 | negative regulation of microvillus assembly(GO:1903697) |
| 0.1 | 0.2 | GO:0075509 | receptor-mediated endocytosis of virus by host cell(GO:0019065) endocytosis involved in viral entry into host cell(GO:0075509) |
| 0.1 | 13.2 | GO:0006613 | cotranslational protein targeting to membrane(GO:0006613) |
| 0.1 | 0.3 | GO:0034196 | acylglycerol transport(GO:0034196) triglyceride transport(GO:0034197) |
| 0.1 | 3.0 | GO:0043928 | exonucleolytic nuclear-transcribed mRNA catabolic process involved in deadenylation-dependent decay(GO:0043928) |
| 0.1 | 2.9 | GO:0051437 | positive regulation of ubiquitin-protein ligase activity involved in regulation of mitotic cell cycle transition(GO:0051437) |
| 0.1 | 1.3 | GO:0090026 | positive regulation of monocyte chemotaxis(GO:0090026) |
| 0.1 | 3.2 | GO:0035735 | intraciliary transport involved in cilium morphogenesis(GO:0035735) |
| 0.1 | 1.2 | GO:2000311 | regulation of alpha-amino-3-hydroxy-5-methyl-4-isoxazole propionate selective glutamate receptor activity(GO:2000311) |
| 0.1 | 5.9 | GO:0006635 | fatty acid beta-oxidation(GO:0006635) |
| 0.1 | 3.4 | GO:0007029 | endoplasmic reticulum organization(GO:0007029) |
| 0.1 | 4.3 | GO:0051092 | positive regulation of NF-kappaB transcription factor activity(GO:0051092) |
| 0.1 | 2.1 | GO:2000785 | regulation of autophagosome assembly(GO:2000785) |
| 0.1 | 9.0 | GO:0006413 | translational initiation(GO:0006413) |
| 0.1 | 0.4 | GO:0010727 | negative regulation of hydrogen peroxide metabolic process(GO:0010727) |
| 0.1 | 1.0 | GO:0045022 | early endosome to late endosome transport(GO:0045022) |
| 0.1 | 0.6 | GO:0072383 | plus-end-directed vesicle transport along microtubule(GO:0072383) |
| 0.1 | 1.7 | GO:0090200 | positive regulation of release of cytochrome c from mitochondria(GO:0090200) |
| 0.1 | 1.1 | GO:0030157 | pancreatic juice secretion(GO:0030157) |
| 0.1 | 0.4 | GO:0015986 | energy coupled proton transport, down electrochemical gradient(GO:0015985) ATP synthesis coupled proton transport(GO:0015986) |
| 0.1 | 2.8 | GO:0034314 | Arp2/3 complex-mediated actin nucleation(GO:0034314) |
| 0.1 | 3.6 | GO:0045071 | negative regulation of viral genome replication(GO:0045071) |
| 0.1 | 0.1 | GO:1904783 | positive regulation of NMDA glutamate receptor activity(GO:1904783) |
| 0.1 | 0.5 | GO:0006122 | mitochondrial electron transport, ubiquinol to cytochrome c(GO:0006122) |
| 0.1 | 0.4 | GO:0071502 | cellular response to temperature stimulus(GO:0071502) |
| 0.0 | 3.2 | GO:0000380 | alternative mRNA splicing, via spliceosome(GO:0000380) |
| 0.0 | 0.7 | GO:1902236 | negative regulation of endoplasmic reticulum stress-induced intrinsic apoptotic signaling pathway(GO:1902236) |
| 0.0 | 5.5 | GO:0006911 | phagocytosis, engulfment(GO:0006911) |
| 0.0 | 1.6 | GO:1900078 | positive regulation of cellular response to insulin stimulus(GO:1900078) |
| 0.0 | 7.5 | GO:0006805 | xenobiotic metabolic process(GO:0006805) |
| 0.0 | 0.4 | GO:0036500 | ATF6-mediated unfolded protein response(GO:0036500) |
| 0.0 | 1.0 | GO:0042921 | corticosteroid receptor signaling pathway(GO:0031958) glucocorticoid receptor signaling pathway(GO:0042921) |
| 0.0 | 0.3 | GO:0006021 | inositol biosynthetic process(GO:0006021) |
| 0.0 | 1.0 | GO:0006957 | complement activation, alternative pathway(GO:0006957) |
| 0.0 | 2.2 | GO:0035914 | skeletal muscle cell differentiation(GO:0035914) |
| 0.0 | 0.5 | GO:0035269 | protein O-linked mannosylation(GO:0035269) ER-associated misfolded protein catabolic process(GO:0071712) |
| 0.0 | 2.1 | GO:0042246 | tissue regeneration(GO:0042246) |
| 0.0 | 1.0 | GO:0090162 | establishment of epithelial cell polarity(GO:0090162) |
| 0.0 | 2.5 | GO:0042267 | natural killer cell mediated cytotoxicity(GO:0042267) |
| 0.0 | 0.2 | GO:0042986 | positive regulation of amyloid precursor protein biosynthetic process(GO:0042986) |
| 0.0 | 0.5 | GO:1901881 | positive regulation of protein depolymerization(GO:1901881) |
| 0.0 | 2.4 | GO:0045638 | negative regulation of myeloid cell differentiation(GO:0045638) |
| 0.0 | 0.8 | GO:0006337 | nucleosome disassembly(GO:0006337) protein-DNA complex disassembly(GO:0032986) |
| 0.0 | 0.3 | GO:0090080 | positive regulation of MAPKKK cascade by fibroblast growth factor receptor signaling pathway(GO:0090080) |
| 0.0 | 0.5 | GO:0031115 | negative regulation of microtubule polymerization(GO:0031115) |
| 0.0 | 2.6 | GO:0033275 | muscle filament sliding(GO:0030049) actin-myosin filament sliding(GO:0033275) |
| 0.0 | 0.6 | GO:0006260 | DNA replication(GO:0006260) |
| 0.0 | 0.7 | GO:0043011 | myeloid dendritic cell differentiation(GO:0043011) |
| 0.0 | 0.4 | GO:0032957 | inositol trisphosphate metabolic process(GO:0032957) |
| 0.0 | 0.3 | GO:0034058 | endosomal vesicle fusion(GO:0034058) |
| 0.0 | 0.6 | GO:0061099 | negative regulation of protein tyrosine kinase activity(GO:0061099) |
| 0.0 | 1.8 | GO:0045454 | cell redox homeostasis(GO:0045454) |
| 0.0 | 0.6 | GO:0009452 | 7-methylguanosine RNA capping(GO:0009452) RNA capping(GO:0036260) |
| 0.0 | 1.3 | GO:0007030 | Golgi organization(GO:0007030) |
| 0.0 | 0.1 | GO:0097460 | ferrous iron import into cell(GO:0097460) ferrous iron import across plasma membrane(GO:0098707) |
| 0.0 | 3.3 | GO:0007229 | integrin-mediated signaling pathway(GO:0007229) |
| 0.0 | 5.7 | GO:0000377 | RNA splicing, via transesterification reactions with bulged adenosine as nucleophile(GO:0000377) mRNA splicing, via spliceosome(GO:0000398) |
| 0.0 | 0.5 | GO:0061049 | physiological muscle hypertrophy(GO:0003298) physiological cardiac muscle hypertrophy(GO:0003301) cell growth involved in cardiac muscle cell development(GO:0061049) |
| 0.0 | 1.1 | GO:0006611 | protein export from nucleus(GO:0006611) |
| 0.0 | 0.2 | GO:0006474 | N-terminal protein amino acid acetylation(GO:0006474) |
| 0.0 | 0.5 | GO:0060561 | apoptotic process involved in morphogenesis(GO:0060561) |
| 0.0 | 0.0 | GO:0016476 | regulation of embryonic cell shape(GO:0016476) |
| 0.0 | 0.1 | GO:0006049 | UDP-N-acetylglucosamine catabolic process(GO:0006049) |
| 0.0 | 0.4 | GO:0045103 | intermediate filament-based process(GO:0045103) |
| 0.0 | 1.0 | GO:0032481 | positive regulation of type I interferon production(GO:0032481) |
| 0.0 | 1.0 | GO:0043966 | histone H3 acetylation(GO:0043966) |
| 0.0 | 2.0 | GO:0030048 | actin filament-based movement(GO:0030048) |
| 0.0 | 0.6 | GO:0008156 | negative regulation of DNA replication(GO:0008156) |
| 0.0 | 1.5 | GO:0006626 | protein targeting to mitochondrion(GO:0006626) |
| 0.0 | 2.1 | GO:0006367 | transcription initiation from RNA polymerase II promoter(GO:0006367) |
Gene overrepresentation in cellular_component category:
| Log-likelihood per target | Total log-likelihood | Term | Description |
|---|---|---|---|
| 3.7 | 22.1 | GO:0008537 | proteasome activator complex(GO:0008537) |
| 2.9 | 14.5 | GO:0017102 | methionyl glutamyl tRNA synthetase complex(GO:0017102) |
| 2.4 | 9.7 | GO:0070985 | TFIIK complex(GO:0070985) |
| 2.3 | 16.3 | GO:0072669 | tRNA-splicing ligase complex(GO:0072669) |
| 1.9 | 13.6 | GO:0098575 | lumenal side of lysosomal membrane(GO:0098575) |
| 1.9 | 5.6 | GO:0070557 | PCNA-p21 complex(GO:0070557) |
| 1.7 | 25.7 | GO:0044754 | autolysosome(GO:0044754) |
| 1.7 | 10.2 | GO:0071817 | MMXD complex(GO:0071817) |
| 1.7 | 8.3 | GO:0008622 | epsilon DNA polymerase complex(GO:0008622) |
| 1.5 | 4.6 | GO:0005607 | laminin-2 complex(GO:0005607) |
| 1.5 | 10.2 | GO:0061700 | GATOR2 complex(GO:0061700) |
| 1.3 | 8.0 | GO:0098560 | cytoplasmic side of late endosome membrane(GO:0098560) |
| 1.3 | 4.0 | GO:0031372 | UBC13-MMS2 complex(GO:0031372) |
| 1.3 | 5.3 | GO:0000214 | tRNA-intron endonuclease complex(GO:0000214) |
| 1.3 | 3.8 | GO:0033565 | ESCRT-0 complex(GO:0033565) |
| 1.2 | 13.9 | GO:0044292 | dendrite terminus(GO:0044292) |
| 1.2 | 17.4 | GO:0042405 | nuclear inclusion body(GO:0042405) |
| 1.2 | 10.4 | GO:0071541 | eukaryotic translation initiation factor 3 complex, eIF3m(GO:0071541) |
| 1.0 | 17.5 | GO:0005736 | DNA-directed RNA polymerase I complex(GO:0005736) |
| 0.9 | 3.8 | GO:0000811 | GINS complex(GO:0000811) |
| 0.9 | 5.7 | GO:0070381 | endosome to plasma membrane transport vesicle(GO:0070381) |
| 0.8 | 4.0 | GO:0071986 | Ragulator complex(GO:0071986) |
| 0.8 | 21.4 | GO:0002080 | acrosomal membrane(GO:0002080) |
| 0.8 | 10.2 | GO:0002199 | zona pellucida receptor complex(GO:0002199) |
| 0.8 | 5.4 | GO:1990452 | Parkin-FBXW7-Cul1 ubiquitin ligase complex(GO:1990452) |
| 0.8 | 2.3 | GO:0071159 | NF-kappaB complex(GO:0071159) |
| 0.7 | 2.2 | GO:0048269 | methionine adenosyltransferase complex(GO:0048269) |
| 0.7 | 13.9 | GO:0032433 | filopodium tip(GO:0032433) |
| 0.7 | 2.9 | GO:0032937 | SREBP-SCAP-Insig complex(GO:0032937) |
| 0.7 | 9.2 | GO:0000808 | origin recognition complex(GO:0000808) nuclear origin of replication recognition complex(GO:0005664) |
| 0.7 | 3.4 | GO:0071797 | LUBAC complex(GO:0071797) |
| 0.7 | 6.1 | GO:0000220 | vacuolar proton-transporting V-type ATPase, V0 domain(GO:0000220) |
| 0.7 | 6.0 | GO:0032797 | SMN complex(GO:0032797) |
| 0.6 | 11.7 | GO:0000276 | mitochondrial proton-transporting ATP synthase complex, coupling factor F(o)(GO:0000276) |
| 0.6 | 3.7 | GO:0030981 | cortical microtubule cytoskeleton(GO:0030981) |
| 0.6 | 11.4 | GO:0038201 | TOR complex(GO:0038201) |
| 0.6 | 5.9 | GO:0030126 | COPI vesicle coat(GO:0030126) |
| 0.6 | 5.2 | GO:0042567 | insulin-like growth factor ternary complex(GO:0042567) |
| 0.6 | 37.8 | GO:0045271 | mitochondrial respiratory chain complex I(GO:0005747) NADH dehydrogenase complex(GO:0030964) respiratory chain complex I(GO:0045271) |
| 0.6 | 22.5 | GO:0000315 | organellar large ribosomal subunit(GO:0000315) mitochondrial large ribosomal subunit(GO:0005762) |
| 0.5 | 3.3 | GO:1990584 | cardiac Troponin complex(GO:1990584) |
| 0.5 | 3.2 | GO:0005854 | nascent polypeptide-associated complex(GO:0005854) |
| 0.4 | 3.0 | GO:1990726 | Lsm1-7-Pat1 complex(GO:1990726) |
| 0.4 | 3.0 | GO:0000172 | ribonuclease MRP complex(GO:0000172) |
| 0.4 | 2.6 | GO:0001740 | Barr body(GO:0001740) |
| 0.4 | 4.2 | GO:0098799 | outer mitochondrial membrane protein complex(GO:0098799) |
| 0.4 | 1.7 | GO:0043625 | delta DNA polymerase complex(GO:0043625) |
| 0.4 | 2.4 | GO:1902560 | GMP reductase complex(GO:1902560) |
| 0.4 | 1.1 | GO:1990876 | cytoplasmic side of nuclear pore(GO:1990876) |
| 0.4 | 27.5 | GO:0022627 | cytosolic small ribosomal subunit(GO:0022627) |
| 0.4 | 4.1 | GO:0035985 | senescence-associated heterochromatin focus(GO:0035985) |
| 0.4 | 2.1 | GO:0005658 | alpha DNA polymerase:primase complex(GO:0005658) |
| 0.3 | 5.7 | GO:0098563 | integral component of synaptic vesicle membrane(GO:0030285) intrinsic component of synaptic vesicle membrane(GO:0098563) |
| 0.3 | 3.7 | GO:0042612 | MHC class I protein complex(GO:0042612) |
| 0.3 | 4.2 | GO:0000815 | ESCRT III complex(GO:0000815) |
| 0.3 | 1.3 | GO:0033596 | TSC1-TSC2 complex(GO:0033596) |
| 0.3 | 2.2 | GO:0000275 | mitochondrial proton-transporting ATP synthase complex, catalytic core F(1)(GO:0000275) |
| 0.3 | 1.5 | GO:0008275 | gamma-tubulin small complex(GO:0008275) |
| 0.3 | 0.9 | GO:0043291 | RAVE complex(GO:0043291) |
| 0.3 | 8.9 | GO:0005680 | anaphase-promoting complex(GO:0005680) |
| 0.3 | 1.2 | GO:0071001 | U4/U6 snRNP(GO:0071001) |
| 0.3 | 1.7 | GO:0098574 | cytoplasmic side of lysosomal membrane(GO:0098574) |
| 0.3 | 5.3 | GO:0005862 | muscle thin filament tropomyosin(GO:0005862) |
| 0.3 | 4.7 | GO:0097038 | perinuclear endoplasmic reticulum(GO:0097038) |
| 0.3 | 3.0 | GO:0005642 | annulate lamellae(GO:0005642) |
| 0.3 | 1.3 | GO:0098837 | postsynaptic recycling endosome(GO:0098837) |
| 0.2 | 5.0 | GO:0030672 | synaptic vesicle membrane(GO:0030672) exocytic vesicle membrane(GO:0099501) |
| 0.2 | 4.7 | GO:0005885 | Arp2/3 protein complex(GO:0005885) |
| 0.2 | 4.4 | GO:0008540 | proteasome regulatory particle, base subcomplex(GO:0008540) |
| 0.2 | 3.9 | GO:0097225 | sperm midpiece(GO:0097225) |
| 0.2 | 22.7 | GO:0035578 | azurophil granule lumen(GO:0035578) |
| 0.2 | 4.7 | GO:0000812 | Swr1 complex(GO:0000812) |
| 0.2 | 4.2 | GO:0034663 | endoplasmic reticulum chaperone complex(GO:0034663) |
| 0.2 | 3.1 | GO:0008091 | spectrin(GO:0008091) |
| 0.2 | 0.7 | GO:0030689 | Noc complex(GO:0030689) |
| 0.2 | 16.3 | GO:0101003 | ficolin-1-rich granule membrane(GO:0101003) |
| 0.2 | 3.0 | GO:0016281 | eukaryotic translation initiation factor 4F complex(GO:0016281) |
| 0.2 | 0.8 | GO:0070695 | FHF complex(GO:0070695) |
| 0.2 | 8.7 | GO:0045095 | keratin filament(GO:0045095) |
| 0.2 | 2.0 | GO:0071014 | post-mRNA release spliceosomal complex(GO:0071014) |
| 0.2 | 3.7 | GO:0030127 | COPII vesicle coat(GO:0030127) |
| 0.2 | 12.4 | GO:0005637 | nuclear inner membrane(GO:0005637) |
| 0.2 | 4.3 | GO:0031528 | microvillus membrane(GO:0031528) |
| 0.2 | 4.0 | GO:0000313 | organellar ribosome(GO:0000313) mitochondrial ribosome(GO:0005761) |
| 0.1 | 2.2 | GO:0016471 | vacuolar proton-transporting V-type ATPase complex(GO:0016471) |
| 0.1 | 13.5 | GO:0032588 | trans-Golgi network membrane(GO:0032588) |
| 0.1 | 3.1 | GO:0043205 | microfibril(GO:0001527) fibril(GO:0043205) |
| 0.1 | 4.6 | GO:0099738 | cell cortex region(GO:0099738) |
| 0.1 | 11.2 | GO:0033116 | endoplasmic reticulum-Golgi intermediate compartment membrane(GO:0033116) |
| 0.1 | 0.4 | GO:0018444 | translation release factor complex(GO:0018444) |
| 0.1 | 16.6 | GO:0016605 | PML body(GO:0016605) |
| 0.1 | 12.9 | GO:0031093 | platelet alpha granule lumen(GO:0031093) |
| 0.1 | 2.1 | GO:0005665 | DNA-directed RNA polymerase II, core complex(GO:0005665) |
| 0.1 | 1.8 | GO:0030014 | CCR4-NOT complex(GO:0030014) |
| 0.1 | 1.0 | GO:0033588 | Elongator holoenzyme complex(GO:0033588) |
| 0.1 | 1.5 | GO:0017146 | NMDA selective glutamate receptor complex(GO:0017146) |
| 0.1 | 1.2 | GO:0097440 | apical dendrite(GO:0097440) |
| 0.1 | 1.2 | GO:0008021 | synaptic vesicle(GO:0008021) |
| 0.1 | 0.7 | GO:0005785 | signal recognition particle receptor complex(GO:0005785) |
| 0.1 | 4.7 | GO:0042645 | nucleoid(GO:0009295) mitochondrial nucleoid(GO:0042645) |
| 0.1 | 0.9 | GO:0016593 | Cdc73/Paf1 complex(GO:0016593) |
| 0.1 | 3.0 | GO:0005685 | U1 snRNP(GO:0005685) |
| 0.1 | 8.9 | GO:0016363 | nuclear matrix(GO:0016363) |
| 0.1 | 1.1 | GO:0097025 | MPP7-DLG1-LIN7 complex(GO:0097025) |
| 0.1 | 3.1 | GO:0030173 | integral component of Golgi membrane(GO:0030173) |
| 0.1 | 2.8 | GO:0031258 | lamellipodium membrane(GO:0031258) |
| 0.1 | 3.9 | GO:0043034 | costamere(GO:0043034) |
| 0.1 | 1.4 | GO:0030122 | AP-2 adaptor complex(GO:0030122) |
| 0.1 | 2.0 | GO:0071565 | nBAF complex(GO:0071565) |
| 0.1 | 1.8 | GO:0032592 | integral component of mitochondrial membrane(GO:0032592) |
| 0.1 | 1.2 | GO:0032591 | dendritic spine membrane(GO:0032591) |
| 0.1 | 0.7 | GO:0005677 | chromatin silencing complex(GO:0005677) |
| 0.1 | 6.4 | GO:0005913 | cell-cell adherens junction(GO:0005913) |
| 0.1 | 5.7 | GO:0036064 | ciliary basal body(GO:0036064) |
| 0.1 | 0.7 | GO:0008541 | proteasome regulatory particle, lid subcomplex(GO:0008541) |
| 0.1 | 2.2 | GO:0000118 | histone deacetylase complex(GO:0000118) |
| 0.1 | 1.4 | GO:0030669 | clathrin-coated endocytic vesicle membrane(GO:0030669) |
| 0.1 | 0.5 | GO:0033269 | internode region of axon(GO:0033269) |
| 0.1 | 3.7 | GO:0045171 | intercellular bridge(GO:0045171) |
| 0.1 | 3.0 | GO:0031904 | endosome lumen(GO:0031904) |
| 0.1 | 22.2 | GO:0019866 | mitochondrial inner membrane(GO:0005743) organelle inner membrane(GO:0019866) |
| 0.1 | 8.4 | GO:0042470 | melanosome(GO:0042470) pigment granule(GO:0048770) |
| 0.1 | 6.9 | GO:0031901 | early endosome membrane(GO:0031901) |
| 0.1 | 5.7 | GO:0071013 | catalytic step 2 spliceosome(GO:0071013) |
| 0.1 | 0.5 | GO:1990111 | spermatoproteasome complex(GO:1990111) |
| 0.1 | 3.9 | GO:0044291 | cell-cell contact zone(GO:0044291) |
| 0.1 | 0.5 | GO:0034709 | methylosome(GO:0034709) |
| 0.1 | 0.3 | GO:0033263 | CORVET complex(GO:0033263) |
| 0.1 | 17.0 | GO:0005759 | mitochondrial matrix(GO:0005759) |
| 0.1 | 0.2 | GO:0031417 | NatC complex(GO:0031417) |
| 0.0 | 1.4 | GO:0005902 | microvillus(GO:0005902) |
| 0.0 | 2.2 | GO:0005793 | endoplasmic reticulum-Golgi intermediate compartment(GO:0005793) |
| 0.0 | 4.4 | GO:0005581 | collagen trimer(GO:0005581) |
| 0.0 | 1.2 | GO:0070822 | Sin3-type complex(GO:0070822) |
| 0.0 | 0.6 | GO:0030532 | small nuclear ribonucleoprotein complex(GO:0030532) |
| 0.0 | 7.0 | GO:0005788 | endoplasmic reticulum lumen(GO:0005788) |
| 0.0 | 0.3 | GO:0042555 | MCM complex(GO:0042555) |
| 0.0 | 1.2 | GO:0001726 | ruffle(GO:0001726) |
| 0.0 | 1.7 | GO:0035580 | specific granule lumen(GO:0035580) |
| 0.0 | 1.3 | GO:0005782 | peroxisomal matrix(GO:0005782) microbody lumen(GO:0031907) |
| 0.0 | 1.8 | GO:0017053 | transcriptional repressor complex(GO:0017053) |
| 0.0 | 2.4 | GO:0000922 | spindle pole(GO:0000922) |
| 0.0 | 2.1 | GO:0032587 | ruffle membrane(GO:0032587) |
| 0.0 | 0.1 | GO:0005968 | Rab-protein geranylgeranyltransferase complex(GO:0005968) |
| 0.0 | 1.8 | GO:0035579 | specific granule membrane(GO:0035579) |
| 0.0 | 2.4 | GO:0001650 | fibrillar center(GO:0001650) |
| 0.0 | 0.1 | GO:0032154 | cleavage furrow(GO:0032154) cell surface furrow(GO:0097610) |
| 0.0 | 0.1 | GO:1990712 | HFE-transferrin receptor complex(GO:1990712) |
| 0.0 | 1.0 | GO:0045335 | phagocytic vesicle(GO:0045335) |
| 0.0 | 0.2 | GO:0031233 | intrinsic component of external side of plasma membrane(GO:0031233) |
| 0.0 | 1.0 | GO:0035097 | histone methyltransferase complex(GO:0035097) |
| 0.0 | 0.5 | GO:0005901 | caveola(GO:0005901) |
| 0.0 | 0.8 | GO:0005882 | intermediate filament(GO:0005882) |
| 0.0 | 1.4 | GO:0043204 | perikaryon(GO:0043204) |
| 0.0 | 11.3 | GO:0005739 | mitochondrion(GO:0005739) |
Gene overrepresentation in molecular_function category:
| Log-likelihood per target | Total log-likelihood | Term | Description |
|---|---|---|---|
| 4.3 | 13.0 | GO:0000035 | acyl binding(GO:0000035) phosphopantetheine binding(GO:0031177) |
| 3.9 | 11.8 | GO:0004829 | threonine-tRNA ligase activity(GO:0004829) |
| 3.2 | 22.1 | GO:0061133 | endopeptidase activator activity(GO:0061133) |
| 3.1 | 9.4 | GO:0004492 | methylmalonyl-CoA decarboxylase activity(GO:0004492) |
| 3.1 | 12.2 | GO:0004132 | dCMP deaminase activity(GO:0004132) |
| 2.6 | 10.2 | GO:0015207 | ATP:ADP antiporter activity(GO:0005471) adenine transmembrane transporter activity(GO:0015207) |
| 2.5 | 12.7 | GO:0019798 | procollagen-proline 4-dioxygenase activity(GO:0004656) procollagen-proline dioxygenase activity(GO:0019798) |
| 1.9 | 5.7 | GO:0005459 | UDP-galactose transmembrane transporter activity(GO:0005459) |
| 1.8 | 5.3 | GO:0000213 | tRNA-intron endonuclease activity(GO:0000213) |
| 1.7 | 13.6 | GO:0004308 | exo-alpha-sialidase activity(GO:0004308) alpha-sialidase activity(GO:0016997) |
| 1.6 | 6.4 | GO:0015142 | citrate transmembrane transporter activity(GO:0015137) tricarboxylic acid transmembrane transporter activity(GO:0015142) |
| 1.6 | 4.7 | GO:0003870 | 5-aminolevulinate synthase activity(GO:0003870) N-succinyltransferase activity(GO:0016749) |
| 1.6 | 7.8 | GO:0015140 | malate transmembrane transporter activity(GO:0015140) |
| 1.5 | 4.4 | GO:0004609 | phosphatidylserine decarboxylase activity(GO:0004609) |
| 1.5 | 4.4 | GO:0004779 | adenylylsulfate kinase activity(GO:0004020) sulfate adenylyltransferase activity(GO:0004779) sulfate adenylyltransferase (ATP) activity(GO:0004781) |
| 1.4 | 7.2 | GO:0030060 | L-malate dehydrogenase activity(GO:0030060) |
| 1.4 | 5.6 | GO:0030337 | DNA polymerase processivity factor activity(GO:0030337) |
| 1.4 | 5.5 | GO:0016784 | 3-mercaptopyruvate sulfurtransferase activity(GO:0016784) |
| 1.2 | 6.1 | GO:0070905 | serine binding(GO:0070905) |
| 1.2 | 3.6 | GO:0003881 | CDP-diacylglycerol-inositol 3-phosphatidyltransferase activity(GO:0003881) |
| 1.1 | 6.8 | GO:0010858 | calcium-dependent protein kinase regulator activity(GO:0010858) |
| 1.1 | 3.4 | GO:0004574 | oligo-1,6-glucosidase activity(GO:0004574) |
| 1.1 | 4.4 | GO:0043398 | HLH domain binding(GO:0043398) |
| 1.1 | 3.3 | GO:0016731 | ferredoxin-NADP+ reductase activity(GO:0004324) NADPH-adrenodoxin reductase activity(GO:0015039) oxidoreductase activity, acting on iron-sulfur proteins as donors(GO:0016730) oxidoreductase activity, acting on iron-sulfur proteins as donors, NAD or NADP as acceptor(GO:0016731) |
| 1.1 | 8.5 | GO:0000340 | RNA 7-methylguanosine cap binding(GO:0000340) |
| 1.0 | 5.2 | GO:0004830 | tryptophan-tRNA ligase activity(GO:0004830) |
| 1.0 | 3.0 | GO:0035614 | snRNA stem-loop binding(GO:0035614) |
| 1.0 | 4.0 | GO:0035373 | chondroitin sulfate proteoglycan binding(GO:0035373) |
| 1.0 | 4.0 | GO:0004142 | diacylglycerol cholinephosphotransferase activity(GO:0004142) |
| 1.0 | 17.5 | GO:0001054 | RNA polymerase I activity(GO:0001054) |
| 1.0 | 6.7 | GO:0004849 | uridine kinase activity(GO:0004849) |
| 0.9 | 2.8 | GO:0002113 | interleukin-33 binding(GO:0002113) |
| 0.9 | 3.7 | GO:0043515 | kinetochore binding(GO:0043515) |
| 0.9 | 2.7 | GO:0004821 | histidine-tRNA ligase activity(GO:0004821) |
| 0.8 | 10.1 | GO:0031386 | protein tag(GO:0031386) |
| 0.8 | 12.6 | GO:0008190 | eukaryotic initiation factor 4E binding(GO:0008190) |
| 0.8 | 3.2 | GO:0004963 | follicle-stimulating hormone receptor activity(GO:0004963) |
| 0.8 | 3.2 | GO:0034186 | apolipoprotein A-I binding(GO:0034186) |
| 0.8 | 2.3 | GO:0005169 | neurotrophin TRKB receptor binding(GO:0005169) |
| 0.8 | 3.8 | GO:0071074 | eukaryotic initiation factor eIF2 binding(GO:0071074) |
| 0.8 | 2.3 | GO:0004531 | deoxyribonuclease II activity(GO:0004531) |
| 0.7 | 5.2 | GO:0072542 | protein phosphatase activator activity(GO:0072542) |
| 0.7 | 2.9 | GO:0004466 | long-chain-acyl-CoA dehydrogenase activity(GO:0004466) |
| 0.7 | 15.2 | GO:0032794 | GTPase activating protein binding(GO:0032794) |
| 0.7 | 10.8 | GO:0008494 | translation activator activity(GO:0008494) |
| 0.7 | 2.7 | GO:0008449 | N-acetylglucosamine-6-sulfatase activity(GO:0008449) |
| 0.7 | 3.3 | GO:0015165 | pyrimidine nucleotide-sugar transmembrane transporter activity(GO:0015165) |
| 0.7 | 5.2 | GO:0070181 | small ribosomal subunit rRNA binding(GO:0070181) |
| 0.6 | 2.4 | GO:0003985 | acetyl-CoA C-acetyltransferase activity(GO:0003985) |
| 0.6 | 5.8 | GO:0019784 | NEDD8-specific protease activity(GO:0019784) |
| 0.6 | 3.9 | GO:0004301 | epoxide hydrolase activity(GO:0004301) |
| 0.5 | 16.4 | GO:0070717 | poly-purine tract binding(GO:0070717) |
| 0.5 | 3.2 | GO:0003998 | acylphosphatase activity(GO:0003998) |
| 0.5 | 8.0 | GO:0034450 | ubiquitin-ubiquitin ligase activity(GO:0034450) |
| 0.5 | 3.7 | GO:0071532 | ankyrin repeat binding(GO:0071532) |
| 0.5 | 2.6 | GO:0008479 | queuine tRNA-ribosyltransferase activity(GO:0008479) |
| 0.5 | 24.8 | GO:0008137 | NADH dehydrogenase (ubiquinone) activity(GO:0008137) NADH dehydrogenase (quinone) activity(GO:0050136) |
| 0.5 | 1.4 | GO:0004392 | heme oxygenase (decyclizing) activity(GO:0004392) |
| 0.5 | 5.7 | GO:0032050 | clathrin heavy chain binding(GO:0032050) |
| 0.5 | 1.8 | GO:0050220 | prostaglandin-E synthase activity(GO:0050220) |
| 0.5 | 9.0 | GO:0005537 | mannose binding(GO:0005537) |
| 0.4 | 2.9 | GO:0030267 | hydroxypyruvate reductase activity(GO:0016618) glyoxylate reductase (NADP) activity(GO:0030267) |
| 0.4 | 5.8 | GO:0003993 | acid phosphatase activity(GO:0003993) non-membrane spanning protein tyrosine phosphatase activity(GO:0004726) |
| 0.4 | 3.3 | GO:0016846 | carbon-sulfur lyase activity(GO:0016846) |
| 0.4 | 9.7 | GO:0008353 | RNA polymerase II carboxy-terminal domain kinase activity(GO:0008353) |
| 0.4 | 2.4 | GO:0016657 | GMP reductase activity(GO:0003920) oxidoreductase activity, acting on NAD(P)H, nitrogenous group as acceptor(GO:0016657) |
| 0.4 | 2.3 | GO:0000285 | 1-phosphatidylinositol-3-phosphate 5-kinase activity(GO:0000285) phosphatidylinositol-3,5-bisphosphate 5-phosphatase activity(GO:0043813) |
| 0.4 | 2.2 | GO:0008553 | hydrogen-exporting ATPase activity, phosphorylative mechanism(GO:0008553) |
| 0.4 | 2.6 | GO:0033592 | RNA strand annealing activity(GO:0033592) |
| 0.4 | 11.0 | GO:0000993 | RNA polymerase II core binding(GO:0000993) |
| 0.3 | 10.0 | GO:0003887 | DNA-directed DNA polymerase activity(GO:0003887) |
| 0.3 | 12.3 | GO:0070063 | RNA polymerase binding(GO:0070063) |
| 0.3 | 5.8 | GO:0004549 | tRNA-specific ribonuclease activity(GO:0004549) |
| 0.3 | 4.0 | GO:0089720 | caspase binding(GO:0089720) |
| 0.3 | 11.6 | GO:0050431 | transforming growth factor beta binding(GO:0050431) |
| 0.3 | 12.7 | GO:0004198 | calcium-dependent cysteine-type endopeptidase activity(GO:0004198) |
| 0.3 | 5.4 | GO:1990381 | ubiquitin-specific protease binding(GO:1990381) |
| 0.3 | 15.9 | GO:0000049 | tRNA binding(GO:0000049) |
| 0.3 | 3.8 | GO:0043138 | 3'-5' DNA helicase activity(GO:0043138) |
| 0.3 | 3.1 | GO:0042731 | PH domain binding(GO:0042731) |
| 0.3 | 2.8 | GO:0005005 | transmembrane-ephrin receptor activity(GO:0005005) |
| 0.3 | 10.2 | GO:0044183 | protein binding involved in protein folding(GO:0044183) |
| 0.3 | 2.7 | GO:0086083 | cell adhesive protein binding involved in bundle of His cell-Purkinje myocyte communication(GO:0086083) |
| 0.3 | 1.1 | GO:0022865 | transmembrane electron transfer carrier(GO:0022865) |
| 0.3 | 0.8 | GO:0052595 | tryptamine:oxygen oxidoreductase (deaminating) activity(GO:0052593) aminoacetone:oxygen oxidoreductase(deaminating) activity(GO:0052594) aliphatic-amine oxidase activity(GO:0052595) phenethylamine:oxygen oxidoreductase (deaminating) activity(GO:0052596) |
| 0.3 | 2.2 | GO:0015349 | thyroid hormone transmembrane transporter activity(GO:0015349) |
| 0.3 | 12.2 | GO:0050699 | WW domain binding(GO:0050699) |
| 0.3 | 6.1 | GO:0046961 | hydrogen-exporting ATPase activity(GO:0036442) proton-transporting ATPase activity, rotational mechanism(GO:0046961) |
| 0.3 | 4.2 | GO:0051787 | misfolded protein binding(GO:0051787) |
| 0.3 | 3.4 | GO:0003995 | acyl-CoA dehydrogenase activity(GO:0003995) |
| 0.3 | 1.5 | GO:0008568 | microtubule-severing ATPase activity(GO:0008568) |
| 0.3 | 3.0 | GO:0000339 | RNA cap binding(GO:0000339) |
| 0.2 | 13.4 | GO:0015485 | cholesterol binding(GO:0015485) |
| 0.2 | 5.5 | GO:0030898 | actin-dependent ATPase activity(GO:0030898) |
| 0.2 | 7.2 | GO:0070064 | proline-rich region binding(GO:0070064) |
| 0.2 | 4.3 | GO:0017049 | GTP-Rho binding(GO:0017049) |
| 0.2 | 19.9 | GO:0032947 | protein complex scaffold(GO:0032947) |
| 0.2 | 3.1 | GO:0047429 | nucleoside-triphosphate diphosphatase activity(GO:0047429) |
| 0.2 | 1.2 | GO:0015193 | L-proline transmembrane transporter activity(GO:0015193) |
| 0.2 | 3.3 | GO:0031014 | troponin T binding(GO:0031014) |
| 0.2 | 2.3 | GO:0034594 | phosphatidylinositol-3,4,5-trisphosphate 5-phosphatase activity(GO:0034485) phosphatidylinositol trisphosphate phosphatase activity(GO:0034594) |
| 0.2 | 1.6 | GO:0016423 | tRNA (guanine) methyltransferase activity(GO:0016423) |
| 0.2 | 3.4 | GO:0003688 | DNA replication origin binding(GO:0003688) |
| 0.2 | 1.1 | GO:0097016 | L27 domain binding(GO:0097016) |
| 0.2 | 2.0 | GO:0000182 | rDNA binding(GO:0000182) |
| 0.2 | 5.0 | GO:0016702 | oxidoreductase activity, acting on single donors with incorporation of molecular oxygen, incorporation of two atoms of oxygen(GO:0016702) |
| 0.2 | 10.0 | GO:0061650 | ubiquitin conjugating enzyme activity(GO:0061631) ubiquitin-like protein conjugating enzyme activity(GO:0061650) |
| 0.2 | 3.7 | GO:0030881 | beta-2-microglobulin binding(GO:0030881) |
| 0.2 | 1.6 | GO:0043024 | ribosomal small subunit binding(GO:0043024) |
| 0.2 | 3.0 | GO:0017070 | U6 snRNA binding(GO:0017070) |
| 0.2 | 3.8 | GO:0009931 | calcium-dependent protein serine/threonine kinase activity(GO:0009931) |
| 0.2 | 2.9 | GO:0016500 | protein-hormone receptor activity(GO:0016500) |
| 0.2 | 0.6 | GO:0004137 | deoxycytidine kinase activity(GO:0004137) |
| 0.2 | 5.6 | GO:0016773 | phosphotransferase activity, alcohol group as acceptor(GO:0016773) |
| 0.2 | 3.9 | GO:0050321 | tau-protein kinase activity(GO:0050321) |
| 0.2 | 9.1 | GO:0019212 | phosphatase inhibitor activity(GO:0019212) |
| 0.2 | 12.8 | GO:0019003 | GDP binding(GO:0019003) |
| 0.2 | 3.3 | GO:0004862 | cAMP-dependent protein kinase inhibitor activity(GO:0004862) |
| 0.1 | 0.6 | GO:0005124 | scavenger receptor binding(GO:0005124) |
| 0.1 | 1.4 | GO:0055104 | ligase inhibitor activity(GO:0055104) ubiquitin ligase inhibitor activity(GO:1990948) |
| 0.1 | 1.3 | GO:0030274 | LIM domain binding(GO:0030274) |
| 0.1 | 12.8 | GO:0015078 | hydrogen ion transmembrane transporter activity(GO:0015078) |
| 0.1 | 8.7 | GO:0050681 | androgen receptor binding(GO:0050681) |
| 0.1 | 0.5 | GO:0008518 | reduced folate carrier activity(GO:0008518) methotrexate transporter activity(GO:0015350) |
| 0.1 | 6.0 | GO:0003743 | translation initiation factor activity(GO:0003743) |
| 0.1 | 0.9 | GO:0005087 | Ran guanyl-nucleotide exchange factor activity(GO:0005087) |
| 0.1 | 0.4 | GO:0052827 | inositol tetrakisphosphate 1-kinase activity(GO:0047325) inositol tetrakisphosphate kinase activity(GO:0051765) inositol-1,3,4-trisphosphate 6-kinase activity(GO:0052725) inositol-1,3,4-trisphosphate 5-kinase activity(GO:0052726) inositol-1,3,4,5,6-pentakisphosphate 1-phosphatase activity(GO:0052825) inositol pentakisphosphate phosphatase activity(GO:0052827) inositol-1,3,4,6-tetrakisphosphate 6-phosphatase activity(GO:0052830) inositol-1,3,4,6-tetrakisphosphate 1-phosphatase activity(GO:0052831) inositol-3,4,6-trisphosphate 1-kinase activity(GO:0052835) |
| 0.1 | 4.1 | GO:0051059 | NF-kappaB binding(GO:0051059) |
| 0.1 | 1.5 | GO:0051011 | microtubule minus-end binding(GO:0051011) |
| 0.1 | 1.8 | GO:0004535 | poly(A)-specific ribonuclease activity(GO:0004535) |
| 0.1 | 23.2 | GO:0003735 | structural constituent of ribosome(GO:0003735) |
| 0.1 | 2.0 | GO:0031402 | sodium ion binding(GO:0031402) |
| 0.1 | 4.7 | GO:0016504 | peptidase activator activity(GO:0016504) |
| 0.1 | 1.6 | GO:0097200 | cysteine-type endopeptidase activity involved in execution phase of apoptosis(GO:0097200) |
| 0.1 | 1.2 | GO:0022820 | potassium:chloride symporter activity(GO:0015379) potassium ion symporter activity(GO:0022820) |
| 0.1 | 4.7 | GO:0003755 | peptidyl-prolyl cis-trans isomerase activity(GO:0003755) |
| 0.1 | 1.1 | GO:0005049 | nuclear export signal receptor activity(GO:0005049) |
| 0.1 | 3.9 | GO:0048487 | beta-tubulin binding(GO:0048487) |
| 0.1 | 3.3 | GO:0017025 | TBP-class protein binding(GO:0017025) |
| 0.1 | 8.0 | GO:0008307 | structural constituent of muscle(GO:0008307) |
| 0.1 | 0.3 | GO:0004102 | choline O-acetyltransferase activity(GO:0004102) |
| 0.1 | 8.1 | GO:0004867 | serine-type endopeptidase inhibitor activity(GO:0004867) |
| 0.1 | 4.0 | GO:0005160 | transforming growth factor beta receptor binding(GO:0005160) |
| 0.1 | 0.3 | GO:0008422 | beta-glucuronidase activity(GO:0004566) beta-glucosidase activity(GO:0008422) |
| 0.1 | 1.8 | GO:0005123 | death receptor binding(GO:0005123) |
| 0.1 | 6.0 | GO:0001618 | virus receptor activity(GO:0001618) |
| 0.1 | 0.1 | GO:0004998 | transferrin receptor activity(GO:0004998) |
| 0.1 | 0.4 | GO:0008079 | translation release factor activity(GO:0003747) translation termination factor activity(GO:0008079) |
| 0.1 | 0.2 | GO:0004980 | melanocyte-stimulating hormone receptor activity(GO:0004980) |
| 0.1 | 1.7 | GO:0070577 | lysine-acetylated histone binding(GO:0070577) |
| 0.1 | 5.0 | GO:0004872 | receptor activity(GO:0004872) molecular transducer activity(GO:0060089) |
| 0.1 | 1.3 | GO:0030552 | cAMP binding(GO:0030552) |
| 0.1 | 0.8 | GO:0016829 | lyase activity(GO:0016829) |
| 0.0 | 4.5 | GO:0000979 | RNA polymerase II core promoter sequence-specific DNA binding(GO:0000979) |
| 0.0 | 0.6 | GO:0008429 | phosphatidylethanolamine binding(GO:0008429) |
| 0.0 | 1.4 | GO:0005521 | lamin binding(GO:0005521) |
| 0.0 | 0.5 | GO:0019215 | intermediate filament binding(GO:0019215) |
| 0.0 | 1.0 | GO:0046965 | retinoid X receptor binding(GO:0046965) |
| 0.0 | 1.0 | GO:0003841 | 1-acylglycerol-3-phosphate O-acyltransferase activity(GO:0003841) |
| 0.0 | 0.9 | GO:0070530 | K63-linked polyubiquitin binding(GO:0070530) |
| 0.0 | 0.6 | GO:0017166 | vinculin binding(GO:0017166) |
| 0.0 | 0.9 | GO:0048018 | receptor agonist activity(GO:0048018) |
| 0.0 | 0.5 | GO:0016274 | arginine N-methyltransferase activity(GO:0016273) protein-arginine N-methyltransferase activity(GO:0016274) |
| 0.0 | 1.4 | GO:0043022 | ribosome binding(GO:0043022) |
| 0.0 | 0.1 | GO:0001665 | alpha-N-acetylgalactosaminide alpha-2,6-sialyltransferase activity(GO:0001665) |
| 0.0 | 1.2 | GO:0003899 | DNA-directed RNA polymerase activity(GO:0003899) RNA polymerase activity(GO:0034062) |
| 0.0 | 1.0 | GO:0003951 | NAD+ kinase activity(GO:0003951) |
| 0.0 | 0.9 | GO:0031492 | nucleosomal DNA binding(GO:0031492) |
| 0.0 | 1.0 | GO:0008574 | ATP-dependent microtubule motor activity, plus-end-directed(GO:0008574) |
| 0.0 | 0.5 | GO:0046875 | ephrin receptor binding(GO:0046875) |
| 0.0 | 5.2 | GO:0044325 | ion channel binding(GO:0044325) |
| 0.0 | 5.1 | GO:0020037 | heme binding(GO:0020037) |
| 0.0 | 2.8 | GO:1902936 | phosphatidylinositol bisphosphate binding(GO:1902936) |
| 0.0 | 3.1 | GO:0005201 | extracellular matrix structural constituent(GO:0005201) |
| 0.0 | 0.7 | GO:0030515 | snoRNA binding(GO:0030515) |
| 0.0 | 0.4 | GO:0070567 | cytidylyltransferase activity(GO:0070567) |
| 0.0 | 2.6 | GO:0004722 | protein serine/threonine phosphatase activity(GO:0004722) |
| 0.0 | 0.6 | GO:0019843 | rRNA binding(GO:0019843) |
| 0.0 | 2.6 | GO:0016811 | hydrolase activity, acting on carbon-nitrogen (but not peptide) bonds, in linear amides(GO:0016811) |
| 0.0 | 0.2 | GO:0004596 | peptide alpha-N-acetyltransferase activity(GO:0004596) |
| 0.0 | 1.2 | GO:0005044 | scavenger receptor activity(GO:0005044) |
| 0.0 | 0.3 | GO:0005545 | 1-phosphatidylinositol binding(GO:0005545) |
| 0.0 | 0.1 | GO:0042974 | retinoic acid receptor binding(GO:0042974) |
| 0.0 | 0.3 | GO:0004708 | MAP kinase kinase activity(GO:0004708) |
| 0.0 | 0.1 | GO:0004731 | purine-nucleoside phosphorylase activity(GO:0004731) |
| 0.0 | 0.1 | GO:0003827 | alpha-1,3-mannosylglycoprotein 2-beta-N-acetylglucosaminyltransferase activity(GO:0003827) |
| 0.0 | 0.5 | GO:0031683 | G-protein beta/gamma-subunit complex binding(GO:0031683) |
| 0.0 | 0.1 | GO:0004663 | Rab geranylgeranyltransferase activity(GO:0004663) |
| 0.0 | 0.8 | GO:0004879 | RNA polymerase II transcription factor activity, ligand-activated sequence-specific DNA binding(GO:0004879) transcription factor activity, direct ligand regulated sequence-specific DNA binding(GO:0098531) |
| 0.0 | 0.6 | GO:0043425 | bHLH transcription factor binding(GO:0043425) |
| 0.0 | 0.1 | GO:0004972 | NMDA glutamate receptor activity(GO:0004972) |
| 0.0 | 0.4 | GO:0060589 | nucleoside-triphosphatase regulator activity(GO:0060589) |
| 0.0 | 0.3 | GO:0003697 | single-stranded DNA binding(GO:0003697) |
| 0.0 | 0.4 | GO:0005520 | insulin-like growth factor binding(GO:0005520) |
| 0.0 | 0.3 | GO:0051959 | dynein light intermediate chain binding(GO:0051959) |
| 0.0 | 0.7 | GO:0042379 | chemokine receptor binding(GO:0042379) |
| 0.0 | 0.2 | GO:0031434 | mitogen-activated protein kinase kinase binding(GO:0031434) |
| 0.0 | 0.2 | GO:0031593 | polyubiquitin binding(GO:0031593) |
Gene overrepresentation in C2:CP category:
| Log-likelihood per target | Total log-likelihood | Term | Description |
|---|---|---|---|
| 0.6 | 8.5 | SA G2 AND M PHASES | Cdc25 activates the cdc2/cyclin B complex to induce the G2/M transition. |
| 0.4 | 37.2 | PID MTOR 4PATHWAY | mTOR signaling pathway |
| 0.3 | 9.3 | PID BETA CATENIN DEG PATHWAY | Degradation of beta catenin |
| 0.3 | 4.6 | PID S1P S1P4 PATHWAY | S1P4 pathway |
| 0.3 | 5.8 | PID EPHA2 FWD PATHWAY | EPHA2 forward signaling |
| 0.3 | 4.4 | PID RANBP2 PATHWAY | Sumoylation by RanBP2 regulates transcriptional repression |
| 0.3 | 6.9 | SA G1 AND S PHASES | Cdk2, 4, and 6 bind cyclin D in G1, while cdk2/cyclin E promotes the G1/S transition. |
| 0.2 | 2.7 | PID S1P S1P2 PATHWAY | S1P2 pathway |
| 0.2 | 11.5 | PID ARF6 PATHWAY | Arf6 signaling events |
| 0.2 | 4.0 | ST G ALPHA S PATHWAY | G alpha s Pathway |
| 0.2 | 4.6 | PID ECADHERIN KERATINOCYTE PATHWAY | E-cadherin signaling in keratinocytes |
| 0.2 | 4.6 | PID INTEGRIN4 PATHWAY | Alpha6 beta4 integrin-ligand interactions |
| 0.2 | 13.4 | PID SYNDECAN 1 PATHWAY | Syndecan-1-mediated signaling events |
| 0.2 | 12.0 | SIG INSULIN RECEPTOR PATHWAY IN CARDIAC MYOCYTES | Genes related to the insulin receptor pathway |
| 0.2 | 14.9 | PID HNF3A PATHWAY | FOXA1 transcription factor network |
| 0.2 | 9.9 | PID AJDISS 2PATHWAY | Posttranslational regulation of adherens junction stability and dissassembly |
| 0.2 | 7.2 | PID SYNDECAN 2 PATHWAY | Syndecan-2-mediated signaling events |
| 0.2 | 11.1 | PID HNF3B PATHWAY | FOXA2 and FOXA3 transcription factor networks |
| 0.2 | 2.2 | PID ARF6 DOWNSTREAM PATHWAY | Arf6 downstream pathway |
| 0.2 | 9.4 | PID TAP63 PATHWAY | Validated transcriptional targets of TAp63 isoforms |
| 0.2 | 6.5 | PID BARD1 PATHWAY | BARD1 signaling events |
| 0.2 | 8.3 | PID HES HEY PATHWAY | Notch-mediated HES/HEY network |
| 0.1 | 4.8 | PID FOXM1 PATHWAY | FOXM1 transcription factor network |
| 0.1 | 3.7 | PID A6B1 A6B4 INTEGRIN PATHWAY | a6b1 and a6b4 Integrin signaling |
| 0.1 | 6.3 | PID IL1 PATHWAY | IL1-mediated signaling events |
| 0.1 | 4.4 | PID ERBB1 INTERNALIZATION PATHWAY | Internalization of ErbB1 |
| 0.1 | 20.3 | NABA ECM GLYCOPROTEINS | Genes encoding structural ECM glycoproteins |
| 0.1 | 1.8 | PID IFNG PATHWAY | IFN-gamma pathway |
| 0.1 | 4.3 | SIG REGULATION OF THE ACTIN CYTOSKELETON BY RHO GTPASES | Genes related to regulation of the actin cytoskeleton |
| 0.1 | 8.0 | PID REG GR PATHWAY | Glucocorticoid receptor regulatory network |
| 0.1 | 1.4 | PID WNT NONCANONICAL PATHWAY | Noncanonical Wnt signaling pathway |
| 0.1 | 19.7 | NABA ECM REGULATORS | Genes encoding enzymes and their regulators involved in the remodeling of the extracellular matrix |
| 0.1 | 2.3 | PID MAPK TRK PATHWAY | Trk receptor signaling mediated by the MAPK pathway |
| 0.1 | 2.2 | PID INTEGRIN3 PATHWAY | Beta3 integrin cell surface interactions |
| 0.1 | 7.2 | PID AR PATHWAY | Coregulation of Androgen receptor activity |
| 0.1 | 2.9 | PID FAK PATHWAY | Signaling events mediated by focal adhesion kinase |
| 0.1 | 1.2 | ST ERK1 ERK2 MAPK PATHWAY | ERK1/ERK2 MAPK Pathway |
| 0.1 | 2.0 | PID IL2 PI3K PATHWAY | IL2 signaling events mediated by PI3K |
| 0.1 | 1.4 | PID SMAD2 3PATHWAY | Regulation of cytoplasmic and nuclear SMAD2/3 signaling |
| 0.1 | 2.4 | PID LKB1 PATHWAY | LKB1 signaling events |
| 0.1 | 3.8 | PID HDAC CLASSI PATHWAY | Signaling events mediated by HDAC Class I |
| 0.1 | 5.4 | PID MYC ACTIV PATHWAY | Validated targets of C-MYC transcriptional activation |
| 0.1 | 6.6 | PID P53 DOWNSTREAM PATHWAY | Direct p53 effectors |
| 0.0 | 1.5 | PID LIS1 PATHWAY | Lissencephaly gene (LIS1) in neuronal migration and development |
| 0.0 | 1.1 | PID EPHA FWDPATHWAY | EPHA forward signaling |
| 0.0 | 0.2 | ST JAK STAT PATHWAY | Jak-STAT Pathway |
| 0.0 | 2.0 | PID IL12 2PATHWAY | IL12-mediated signaling events |
| 0.0 | 0.5 | PID ER NONGENOMIC PATHWAY | Plasma membrane estrogen receptor signaling |
| 0.0 | 0.4 | PID EPHRINB REV PATHWAY | Ephrin B reverse signaling |
| 0.0 | 1.4 | PID HIF1 TFPATHWAY | HIF-1-alpha transcription factor network |
| 0.0 | 1.4 | PID CMYB PATHWAY | C-MYB transcription factor network |
| 0.0 | 0.7 | PID BCR 5PATHWAY | BCR signaling pathway |
| 0.0 | 0.4 | ST G ALPHA I PATHWAY | G alpha i Pathway |
| 0.0 | 0.2 | PID SYNDECAN 3 PATHWAY | Syndecan-3-mediated signaling events |
Gene overrepresentation in C2:CP:REACTOME category:
| Log-likelihood per target | Total log-likelihood | Term | Description |
|---|---|---|---|
| 1.0 | 9.1 | REACTOME NEGATIVE REGULATION OF THE PI3K AKT NETWORK | Genes involved in Negative regulation of the PI3K/AKT network |
| 1.0 | 17.4 | REACTOME PROCESSING OF INTRONLESS PRE MRNAS | Genes involved in Processing of Intronless Pre-mRNAs |
| 0.9 | 33.9 | REACTOME CYTOSOLIC TRNA AMINOACYLATION | Genes involved in Cytosolic tRNA aminoacylation |
| 0.8 | 17.5 | REACTOME RNA POL III CHAIN ELONGATION | Genes involved in RNA Polymerase III Chain Elongation |
| 0.6 | 9.4 | REACTOME POL SWITCHING | Genes involved in Polymerase switching |
| 0.6 | 13.9 | REACTOME FORMATION OF ATP BY CHEMIOSMOTIC COUPLING | Genes involved in Formation of ATP by chemiosmotic coupling |
| 0.5 | 17.1 | REACTOME PYRIMIDINE METABOLISM | Genes involved in Pyrimidine metabolism |
| 0.5 | 23.7 | REACTOME INTERACTIONS OF VPR WITH HOST CELLULAR PROTEINS | Genes involved in Interactions of Vpr with host cellular proteins |
| 0.5 | 7.4 | REACTOME UNWINDING OF DNA | Genes involved in Unwinding of DNA |
| 0.4 | 10.1 | REACTOME DESTABILIZATION OF MRNA BY KSRP | Genes involved in Destabilization of mRNA by KSRP |
| 0.4 | 34.6 | REACTOME SCF BETA TRCP MEDIATED DEGRADATION OF EMI1 | Genes involved in SCF-beta-TrCP mediated degradation of Emi1 |
| 0.4 | 8.3 | REACTOME MTORC1 MEDIATED SIGNALLING | Genes involved in mTORC1-mediated signalling |
| 0.4 | 8.0 | REACTOME ENDOSOMAL SORTING COMPLEX REQUIRED FOR TRANSPORT ESCRT | Genes involved in Endosomal Sorting Complex Required For Transport (ESCRT) |
| 0.4 | 3.7 | REACTOME ENDOSOMAL VACUOLAR PATHWAY | Genes involved in Endosomal/Vacuolar pathway |
| 0.4 | 31.1 | REACTOME RESPIRATORY ELECTRON TRANSPORT | Genes involved in Respiratory electron transport |
| 0.4 | 9.7 | REACTOME RNA POL I TRANSCRIPTION TERMINATION | Genes involved in RNA Polymerase I Transcription Termination |
| 0.4 | 6.3 | REACTOME MITOCHONDRIAL FATTY ACID BETA OXIDATION | Genes involved in Mitochondrial Fatty Acid Beta-Oxidation |
| 0.3 | 10.7 | REACTOME FORMATION OF TUBULIN FOLDING INTERMEDIATES BY CCT TRIC | Genes involved in Formation of tubulin folding intermediates by CCT/TriC |
| 0.3 | 4.0 | REACTOME IKK COMPLEX RECRUITMENT MEDIATED BY RIP1 | Genes involved in IKK complex recruitment mediated by RIP1 |
| 0.3 | 4.2 | REACTOME RNA POL III TRANSCRIPTION INITIATION FROM TYPE 3 PROMOTER | Genes involved in RNA Polymerase III Transcription Initiation From Type 3 Promoter |
| 0.3 | 8.4 | REACTOME INSULIN RECEPTOR RECYCLING | Genes involved in Insulin receptor recycling |
| 0.3 | 12.9 | REACTOME GLYCOSPHINGOLIPID METABOLISM | Genes involved in Glycosphingolipid metabolism |
| 0.3 | 22.9 | REACTOME ACTIVATION OF THE MRNA UPON BINDING OF THE CAP BINDING COMPLEX AND EIFS AND SUBSEQUENT BINDING TO 43S | Genes involved in Activation of the mRNA upon binding of the cap-binding complex and eIFs, and subsequent binding to 43S |
| 0.3 | 16.7 | REACTOME GLUCONEOGENESIS | Genes involved in Gluconeogenesis |
| 0.3 | 2.3 | REACTOME NFKB IS ACTIVATED AND SIGNALS SURVIVAL | Genes involved in NF-kB is activated and signals survival |
| 0.2 | 6.6 | REACTOME APC CDC20 MEDIATED DEGRADATION OF NEK2A | Genes involved in APC-Cdc20 mediated degradation of Nek2A |
| 0.2 | 2.3 | REACTOME SYNTHESIS OF PIPS AT THE LATE ENDOSOME MEMBRANE | Genes involved in Synthesis of PIPs at the late endosome membrane |
| 0.2 | 6.2 | REACTOME METABOLISM OF PORPHYRINS | Genes involved in Metabolism of porphyrins |
| 0.2 | 2.7 | REACTOME KERATAN SULFATE DEGRADATION | Genes involved in Keratan sulfate degradation |
| 0.2 | 3.0 | REACTOME MRNA DECAY BY 5 TO 3 EXORIBONUCLEASE | Genes involved in mRNA Decay by 5' to 3' Exoribonuclease |
| 0.2 | 7.2 | REACTOME CASPASE MEDIATED CLEAVAGE OF CYTOSKELETAL PROTEINS | Genes involved in Caspase-mediated cleavage of cytoskeletal proteins |
| 0.2 | 5.1 | REACTOME METABOLISM OF POLYAMINES | Genes involved in Metabolism of polyamines |
| 0.2 | 3.2 | REACTOME HORMONE LIGAND BINDING RECEPTORS | Genes involved in Hormone ligand-binding receptors |
| 0.2 | 5.2 | REACTOME REGULATION OF INSULIN LIKE GROWTH FACTOR IGF ACTIVITY BY INSULIN LIKE GROWTH FACTOR BINDING PROTEINS IGFBPS | Genes involved in Regulation of Insulin-like Growth Factor (IGF) Activity by Insulin-like Growth Factor Binding Proteins (IGFBPs) |
| 0.2 | 3.4 | REACTOME APOPTOTIC CLEAVAGE OF CELL ADHESION PROTEINS | Genes involved in Apoptotic cleavage of cell adhesion proteins |
| 0.2 | 3.9 | REACTOME SIGNALLING TO P38 VIA RIT AND RIN | Genes involved in Signalling to p38 via RIT and RIN |
| 0.2 | 8.8 | REACTOME NEGATIVE REGULATORS OF RIG I MDA5 SIGNALING | Genes involved in Negative regulators of RIG-I/MDA5 signaling |
| 0.2 | 2.0 | REACTOME NOTCH HLH TRANSCRIPTION PATHWAY | Genes involved in Notch-HLH transcription pathway |
| 0.2 | 6.0 | REACTOME DOWNREGULATION OF TGF BETA RECEPTOR SIGNALING | Genes involved in Downregulation of TGF-beta receptor signaling |
| 0.2 | 11.7 | REACTOME METABOLISM OF VITAMINS AND COFACTORS | Genes involved in Metabolism of vitamins and cofactors |
| 0.2 | 3.0 | REACTOME PROLACTIN RECEPTOR SIGNALING | Genes involved in Prolactin receptor signaling |
| 0.2 | 4.4 | REACTOME SYNTHESIS OF PC | Genes involved in Synthesis of PC |
| 0.1 | 7.2 | REACTOME MITOCHONDRIAL PROTEIN IMPORT | Genes involved in Mitochondrial Protein Import |
| 0.1 | 3.9 | REACTOME MRNA 3 END PROCESSING | Genes involved in mRNA 3'-end processing |
| 0.1 | 3.7 | REACTOME ANTIGEN PRESENTATION FOLDING ASSEMBLY AND PEPTIDE LOADING OF CLASS I MHC | Genes involved in Antigen Presentation: Folding, assembly and peptide loading of class I MHC |
| 0.1 | 8.8 | REACTOME COLLAGEN FORMATION | Genes involved in Collagen formation |
| 0.1 | 3.5 | REACTOME HDL MEDIATED LIPID TRANSPORT | Genes involved in HDL-mediated lipid transport |
| 0.1 | 8.5 | REACTOME STRIATED MUSCLE CONTRACTION | Genes involved in Striated Muscle Contraction |
| 0.1 | 1.3 | REACTOME COPI MEDIATED TRANSPORT | Genes involved in COPI Mediated Transport |
| 0.1 | 5.5 | REACTOME TRANSPORT OF VITAMINS NUCLEOSIDES AND RELATED MOLECULES | Genes involved in Transport of vitamins, nucleosides, and related molecules |
| 0.1 | 2.2 | REACTOME APOPTOSIS INDUCED DNA FRAGMENTATION | Genes involved in Apoptosis induced DNA fragmentation |
| 0.1 | 3.0 | REACTOME PTM GAMMA CARBOXYLATION HYPUSINE FORMATION AND ARYLSULFATASE ACTIVATION | Genes involved in PTM: gamma carboxylation, hypusine formation and arylsulfatase activation |
| 0.1 | 1.5 | REACTOME RECRUITMENT OF NUMA TO MITOTIC CENTROSOMES | Genes involved in Recruitment of NuMA to mitotic centrosomes |
| 0.1 | 2.8 | REACTOME SEMA3A PAK DEPENDENT AXON REPULSION | Genes involved in Sema3A PAK dependent Axon repulsion |
| 0.1 | 2.6 | REACTOME ADP SIGNALLING THROUGH P2RY12 | Genes involved in ADP signalling through P2Y purinoceptor 12 |
| 0.1 | 3.0 | REACTOME PYRUVATE METABOLISM | Genes involved in Pyruvate metabolism |
| 0.1 | 1.8 | REACTOME LATENT INFECTION OF HOMO SAPIENS WITH MYCOBACTERIUM TUBERCULOSIS | Genes involved in Latent infection of Homo sapiens with Mycobacterium tuberculosis |
| 0.1 | 1.2 | REACTOME CHYLOMICRON MEDIATED LIPID TRANSPORT | Genes involved in Chylomicron-mediated lipid transport |
| 0.1 | 5.1 | REACTOME SIGNALING BY ROBO RECEPTOR | Genes involved in Signaling by Robo receptor |
| 0.1 | 2.4 | REACTOME PURINE SALVAGE | Genes involved in Purine salvage |
| 0.1 | 7.9 | REACTOME TRANS GOLGI NETWORK VESICLE BUDDING | Genes involved in trans-Golgi Network Vesicle Budding |
| 0.1 | 14.3 | REACTOME TRANSLATION | Genes involved in Translation |
| 0.1 | 2.2 | REACTOME SULFUR AMINO ACID METABOLISM | Genes involved in Sulfur amino acid metabolism |
| 0.1 | 2.5 | REACTOME SYNTHESIS OF PA | Genes involved in Synthesis of PA |
| 0.1 | 1.1 | REACTOME G2 M DNA DAMAGE CHECKPOINT | Genes involved in G2/M DNA damage checkpoint |
| 0.1 | 1.4 | REACTOME REGULATION OF RHEB GTPASE ACTIVITY BY AMPK | Genes involved in Regulation of Rheb GTPase activity by AMPK |
| 0.1 | 5.4 | REACTOME CIRCADIAN CLOCK | Genes involved in Circadian Clock |
| 0.1 | 1.9 | REACTOME KINESINS | Genes involved in Kinesins |
| 0.1 | 2.4 | REACTOME APOPTOTIC CLEAVAGE OF CELLULAR PROTEINS | Genes involved in Apoptotic cleavage of cellular proteins |
| 0.1 | 1.2 | REACTOME NA CL DEPENDENT NEUROTRANSMITTER TRANSPORTERS | Genes involved in Na+/Cl- dependent neurotransmitter transporters |
| 0.1 | 2.3 | REACTOME SYNTHESIS OF PIPS AT THE PLASMA MEMBRANE | Genes involved in Synthesis of PIPs at the plasma membrane |
| 0.1 | 8.2 | REACTOME ANTIGEN PROCESSING UBIQUITINATION PROTEASOME DEGRADATION | Genes involved in Antigen processing: Ubiquitination & Proteasome degradation |
| 0.0 | 4.7 | REACTOME MRNA SPLICING | Genes involved in mRNA Splicing |
| 0.0 | 0.6 | REACTOME ACTIVATION OF BH3 ONLY PROTEINS | Genes involved in Activation of BH3-only proteins |
| 0.0 | 5.3 | REACTOME FACTORS INVOLVED IN MEGAKARYOCYTE DEVELOPMENT AND PLATELET PRODUCTION | Genes involved in Factors involved in megakaryocyte development and platelet production |
| 0.0 | 0.5 | REACTOME ERKS ARE INACTIVATED | Genes involved in ERKs are inactivated |
| 0.0 | 1.2 | REACTOME RECYCLING PATHWAY OF L1 | Genes involved in Recycling pathway of L1 |
| 0.0 | 0.4 | REACTOME ACTIVATION OF CHAPERONES BY ATF6 ALPHA | Genes involved in Activation of Chaperones by ATF6-alpha |
| 0.0 | 0.5 | REACTOME METABOLISM OF NON CODING RNA | Genes involved in Metabolism of non-coding RNA |
| 0.0 | 0.9 | REACTOME CYTOSOLIC SULFONATION OF SMALL MOLECULES | Genes involved in Cytosolic sulfonation of small molecules |
| 0.0 | 1.0 | REACTOME EXTRACELLULAR MATRIX ORGANIZATION | Genes involved in Extracellular matrix organization |
| 0.0 | 0.3 | REACTOME ACTIVATED TAK1 MEDIATES P38 MAPK ACTIVATION | Genes involved in activated TAK1 mediates p38 MAPK activation |
| 0.0 | 0.8 | REACTOME G1 PHASE | Genes involved in G1 Phase |
| 0.0 | 0.6 | REACTOME AMINO ACID TRANSPORT ACROSS THE PLASMA MEMBRANE | Genes involved in Amino acid transport across the plasma membrane |
| 0.0 | 0.3 | REACTOME FANCONI ANEMIA PATHWAY | Genes involved in Fanconi Anemia pathway |
| 0.0 | 1.3 | REACTOME PPARA ACTIVATES GENE EXPRESSION | Genes involved in PPARA Activates Gene Expression |
| 0.0 | 0.2 | REACTOME EGFR DOWNREGULATION | Genes involved in EGFR downregulation |
| 0.0 | 0.6 | REACTOME INTERFERON ALPHA BETA SIGNALING | Genes involved in Interferon alpha/beta signaling |
| 0.0 | 0.3 | REACTOME RAP1 SIGNALLING | Genes involved in Rap1 signalling |
| 0.0 | 0.5 | REACTOME OLFACTORY SIGNALING PATHWAY | Genes involved in Olfactory Signaling Pathway |