Project
GNF SymAtlas + NCI-60 cancer cell lines, comparison of cancers vs non-cancers, human (Su, 2004; Ross, 2000)
Navigation
Downloads
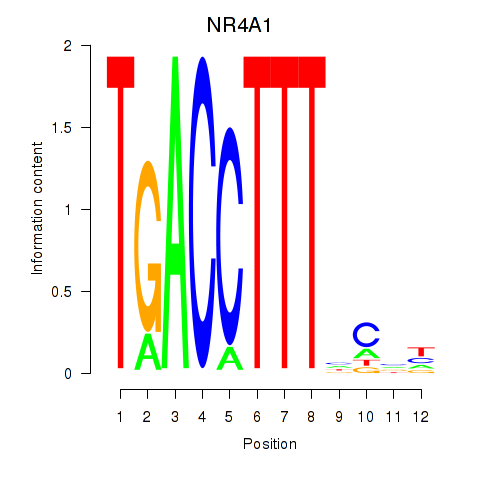
Results for NR4A1
Z-value: 0.73
Motif logo
Transcription factors associated with NR4A1
| Gene Symbol | Gene ID | Gene Info |
|---|---|---|
|
NR4A1
|
ENSG00000123358.15 | nuclear receptor subfamily 4 group A member 1 |
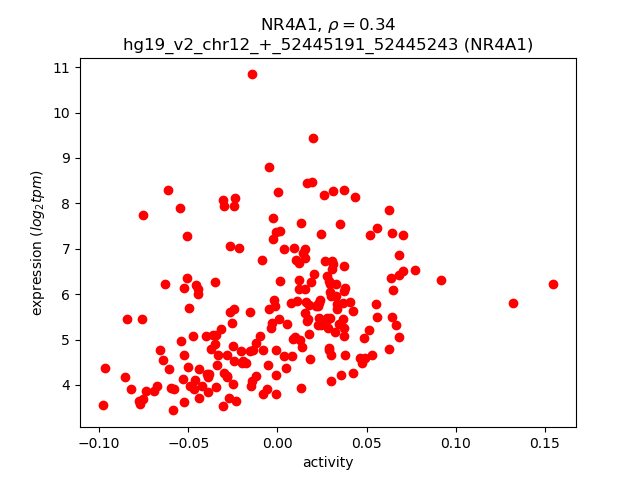
Activity-expression correlation:
| Gene | Promoter | Pearson corr. coef. | P-value | Plot |
|---|---|---|---|---|
| NR4A1 | hg19_v2_chr12_+_52445191_52445243 | 0.34 | 3.2e-07 | Click! |
Activity profile of NR4A1 motif
Sorted Z-values of NR4A1 motif
| Promoter | Log-likelihood | Transcript | Gene | Gene Info |
|---|---|---|---|---|
| chr3_-_138763734 | 30.75 |
ENST00000413199.1
ENST00000502927.2 |
PRR23C
|
proline rich 23C |
| chr11_-_111794446 | 15.87 |
ENST00000527950.1
|
CRYAB
|
crystallin, alpha B |
| chr22_+_24891210 | 14.46 |
ENST00000382760.2
|
UPB1
|
ureidopropionase, beta |
| chr12_-_16759711 | 10.53 |
ENST00000447609.1
|
LMO3
|
LIM domain only 3 (rhombotin-like 2) |
| chr3_+_14989186 | 10.50 |
ENST00000435454.1
ENST00000323373.6 |
NR2C2
|
nuclear receptor subfamily 2, group C, member 2 |
| chr8_-_120685608 | 10.00 |
ENST00000427067.2
|
ENPP2
|
ectonucleotide pyrophosphatase/phosphodiesterase 2 |
| chr13_-_33112823 | 8.17 |
ENST00000504114.1
|
N4BP2L2
|
NEDD4 binding protein 2-like 2 |
| chr1_+_236849754 | 8.12 |
ENST00000542672.1
ENST00000366578.4 |
ACTN2
|
actinin, alpha 2 |
| chr17_+_4855053 | 7.88 |
ENST00000518175.1
|
ENO3
|
enolase 3 (beta, muscle) |
| chr4_+_159593271 | 7.73 |
ENST00000512251.1
ENST00000511912.1 |
ETFDH
|
electron-transferring-flavoprotein dehydrogenase |
| chr7_-_37488834 | 7.46 |
ENST00000310758.4
|
ELMO1
|
engulfment and cell motility 1 |
| chr17_+_4854375 | 7.36 |
ENST00000521811.1
ENST00000519602.1 ENST00000323997.6 ENST00000522249.1 ENST00000519584.1 |
ENO3
|
enolase 3 (beta, muscle) |
| chr1_+_16062820 | 6.84 |
ENST00000294454.5
|
SLC25A34
|
solute carrier family 25, member 34 |
| chr15_-_42783303 | 6.71 |
ENST00000565380.1
ENST00000564754.1 |
ZNF106
|
zinc finger protein 106 |
| chr12_+_109577202 | 6.38 |
ENST00000377848.3
ENST00000377854.5 |
ACACB
|
acetyl-CoA carboxylase beta |
| chrX_-_43741594 | 6.23 |
ENST00000536181.1
ENST00000378069.4 |
MAOB
|
monoamine oxidase B |
| chr10_-_75634219 | 6.19 |
ENST00000305762.7
|
CAMK2G
|
calcium/calmodulin-dependent protein kinase II gamma |
| chr12_-_95467267 | 5.98 |
ENST00000330677.7
|
NR2C1
|
nuclear receptor subfamily 2, group C, member 1 |
| chr19_+_54926601 | 5.96 |
ENST00000301194.4
|
TTYH1
|
tweety family member 1 |
| chr4_+_176986978 | 5.72 |
ENST00000508596.1
ENST00000393643.2 |
WDR17
|
WD repeat domain 17 |
| chr19_+_54926621 | 5.70 |
ENST00000376530.3
ENST00000445095.1 ENST00000391739.3 ENST00000376531.3 |
TTYH1
|
tweety family member 1 |
| chr1_+_14075903 | 5.68 |
ENST00000343137.4
ENST00000503842.1 ENST00000407521.3 ENST00000505823.1 |
PRDM2
|
PR domain containing 2, with ZNF domain |
| chr1_+_156589051 | 5.47 |
ENST00000255039.1
|
HAPLN2
|
hyaluronan and proteoglycan link protein 2 |
| chr2_+_234216454 | 5.41 |
ENST00000447536.1
ENST00000409110.1 |
SAG
|
S-antigen; retina and pineal gland (arrestin) |
| chr13_-_33112899 | 5.27 |
ENST00000267068.3
ENST00000357505.6 ENST00000399396.3 |
N4BP2L2
|
NEDD4 binding protein 2-like 2 |
| chr3_+_14989076 | 5.25 |
ENST00000413118.1
ENST00000425241.1 |
NR2C2
|
nuclear receptor subfamily 2, group C, member 2 |
| chr12_+_6644443 | 5.21 |
ENST00000396858.1
|
GAPDH
|
glyceraldehyde-3-phosphate dehydrogenase |
| chr14_-_101295407 | 5.13 |
ENST00000596284.1
|
AL117190.2
|
AL117190.2 |
| chr12_+_21679220 | 4.86 |
ENST00000256969.2
|
C12orf39
|
chromosome 12 open reading frame 39 |
| chr22_-_51016846 | 4.86 |
ENST00000312108.7
ENST00000395650.2 |
CPT1B
|
carnitine palmitoyltransferase 1B (muscle) |
| chr17_-_29624343 | 4.77 |
ENST00000247271.4
|
OMG
|
oligodendrocyte myelin glycoprotein |
| chr7_-_72936608 | 4.76 |
ENST00000404251.1
|
BAZ1B
|
bromodomain adjacent to zinc finger domain, 1B |
| chr14_+_29236269 | 4.71 |
ENST00000313071.4
|
FOXG1
|
forkhead box G1 |
| chr12_+_32655048 | 4.62 |
ENST00000427716.2
ENST00000266482.3 |
FGD4
|
FYVE, RhoGEF and PH domain containing 4 |
| chr19_-_41256207 | 4.59 |
ENST00000598485.2
ENST00000470681.1 ENST00000339153.3 ENST00000598729.1 |
C19orf54
|
chromosome 19 open reading frame 54 |
| chr2_+_162016827 | 4.57 |
ENST00000429217.1
ENST00000406287.1 ENST00000402568.1 |
TANK
|
TRAF family member-associated NFKB activator |
| chr6_+_30594619 | 4.43 |
ENST00000318999.7
ENST00000376485.4 ENST00000376478.2 ENST00000319027.5 ENST00000376483.4 ENST00000329992.8 ENST00000330083.5 |
ATAT1
|
alpha tubulin acetyltransferase 1 |
| chr22_-_51017084 | 4.34 |
ENST00000360719.2
ENST00000457250.1 ENST00000440709.1 |
CPT1B
|
carnitine palmitoyltransferase 1B (muscle) |
| chr13_-_33112956 | 4.08 |
ENST00000505213.1
|
N4BP2L2
|
NEDD4 binding protein 2-like 2 |
| chr19_+_49713991 | 4.07 |
ENST00000597316.1
|
TRPM4
|
transient receptor potential cation channel, subfamily M, member 4 |
| chr3_+_101443476 | 4.06 |
ENST00000327230.4
ENST00000494050.1 |
CEP97
|
centrosomal protein 97kDa |
| chr20_+_3052264 | 4.06 |
ENST00000217386.2
|
OXT
|
oxytocin/neurophysin I prepropeptide |
| chr17_-_7123021 | 3.86 |
ENST00000399510.2
|
DLG4
|
discs, large homolog 4 (Drosophila) |
| chr4_-_89744314 | 3.84 |
ENST00000508369.1
|
FAM13A
|
family with sequence similarity 13, member A |
| chrX_+_2746818 | 3.84 |
ENST00000398806.3
|
GYG2
|
glycogenin 2 |
| chr1_+_176432298 | 3.79 |
ENST00000367661.3
ENST00000367662.3 |
PAPPA2
|
pappalysin 2 |
| chr1_+_104293028 | 3.75 |
ENST00000370079.3
|
AMY1C
|
amylase, alpha 1C (salivary) |
| chr14_-_21567009 | 3.69 |
ENST00000556174.1
ENST00000554478.1 ENST00000553980.1 ENST00000421093.2 |
ZNF219
|
zinc finger protein 219 |
| chr10_-_103815874 | 3.67 |
ENST00000370033.4
ENST00000311122.5 |
C10orf76
|
chromosome 10 open reading frame 76 |
| chr10_-_17171817 | 3.64 |
ENST00000377833.4
|
CUBN
|
cubilin (intrinsic factor-cobalamin receptor) |
| chr3_-_44519131 | 3.62 |
ENST00000425708.2
ENST00000396077.2 |
ZNF445
|
zinc finger protein 445 |
| chr20_+_37590942 | 3.59 |
ENST00000373325.2
ENST00000252011.3 ENST00000373323.4 |
DHX35
|
DEAH (Asp-Glu-Ala-His) box polypeptide 35 |
| chr10_+_12110963 | 3.57 |
ENST00000263035.4
ENST00000437298.1 |
DHTKD1
|
dehydrogenase E1 and transketolase domain containing 1 |
| chr3_-_133648656 | 3.56 |
ENST00000408895.2
|
C3orf36
|
chromosome 3 open reading frame 36 |
| chr6_-_152958521 | 3.55 |
ENST00000367255.5
ENST00000265368.4 ENST00000448038.1 ENST00000341594.5 |
SYNE1
|
spectrin repeat containing, nuclear envelope 1 |
| chr3_-_48936272 | 3.54 |
ENST00000544097.1
ENST00000430379.1 ENST00000319017.4 |
SLC25A20
|
solute carrier family 25 (carnitine/acylcarnitine translocase), member 20 |
| chr16_+_21312170 | 3.51 |
ENST00000338573.5
ENST00000561968.1 |
CRYM-AS1
|
CRYM antisense RNA 1 |
| chr4_-_89744365 | 3.47 |
ENST00000513837.1
ENST00000503556.1 |
FAM13A
|
family with sequence similarity 13, member A |
| chr10_-_75634260 | 3.39 |
ENST00000372765.1
ENST00000351293.3 |
CAMK2G
|
calcium/calmodulin-dependent protein kinase II gamma |
| chr6_-_33771757 | 3.16 |
ENST00000507738.1
ENST00000266003.5 ENST00000430124.2 |
MLN
|
motilin |
| chr6_-_152489484 | 3.11 |
ENST00000354674.4
ENST00000539504.1 |
SYNE1
|
spectrin repeat containing, nuclear envelope 1 |
| chr8_+_99956662 | 3.02 |
ENST00000523368.1
ENST00000297565.4 ENST00000435298.2 |
OSR2
|
odd-skipped related transciption factor 2 |
| chr6_+_69942298 | 3.02 |
ENST00000238918.8
|
BAI3
|
brain-specific angiogenesis inhibitor 3 |
| chr14_-_24711470 | 2.96 |
ENST00000559969.1
|
TINF2
|
TERF1 (TRF1)-interacting nuclear factor 2 |
| chr1_+_173793777 | 2.89 |
ENST00000239457.5
|
DARS2
|
aspartyl-tRNA synthetase 2, mitochondrial |
| chr11_+_116700614 | 2.88 |
ENST00000375345.1
|
APOC3
|
apolipoprotein C-III |
| chr7_-_81399329 | 2.86 |
ENST00000453411.1
ENST00000444829.2 |
HGF
|
hepatocyte growth factor (hepapoietin A; scatter factor) |
| chr1_-_111743285 | 2.73 |
ENST00000357640.4
|
DENND2D
|
DENN/MADD domain containing 2D |
| chr11_+_116700600 | 2.72 |
ENST00000227667.3
|
APOC3
|
apolipoprotein C-III |
| chr10_-_75634326 | 2.67 |
ENST00000322635.3
ENST00000444854.2 ENST00000423381.1 ENST00000322680.3 ENST00000394762.2 |
CAMK2G
|
calcium/calmodulin-dependent protein kinase II gamma |
| chr7_-_81399411 | 2.62 |
ENST00000423064.2
|
HGF
|
hepatocyte growth factor (hepapoietin A; scatter factor) |
| chr11_+_3876859 | 2.47 |
ENST00000300737.4
|
STIM1
|
stromal interaction molecule 1 |
| chr7_+_119913688 | 2.41 |
ENST00000331113.4
|
KCND2
|
potassium voltage-gated channel, Shal-related subfamily, member 2 |
| chr12_+_49687425 | 2.36 |
ENST00000257860.4
|
PRPH
|
peripherin |
| chr17_-_66287257 | 2.36 |
ENST00000327268.4
|
SLC16A6
|
solute carrier family 16, member 6 |
| chr6_+_149068464 | 2.30 |
ENST00000367463.4
|
UST
|
uronyl-2-sulfotransferase |
| chr7_+_99933730 | 2.29 |
ENST00000610247.1
|
PILRB
|
paired immunoglobin-like type 2 receptor beta |
| chr18_+_43753974 | 2.24 |
ENST00000282059.6
ENST00000321319.6 |
C18orf25
|
chromosome 18 open reading frame 25 |
| chr2_+_162016916 | 2.22 |
ENST00000405852.1
|
TANK
|
TRAF family member-associated NFKB activator |
| chr15_-_41120896 | 2.21 |
ENST00000299174.5
ENST00000427255.2 |
PPP1R14D
|
protein phosphatase 1, regulatory (inhibitor) subunit 14D |
| chr5_-_27038683 | 2.16 |
ENST00000511822.1
ENST00000231021.4 |
CDH9
|
cadherin 9, type 2 (T1-cadherin) |
| chrX_+_2746850 | 2.11 |
ENST00000381163.3
ENST00000338623.5 ENST00000542787.1 |
GYG2
|
glycogenin 2 |
| chr6_+_118869452 | 2.09 |
ENST00000357525.5
|
PLN
|
phospholamban |
| chr3_+_51741072 | 2.09 |
ENST00000395052.3
|
GRM2
|
glutamate receptor, metabotropic 2 |
| chr7_-_6048702 | 2.03 |
ENST00000265849.7
|
PMS2
|
PMS2 postmeiotic segregation increased 2 (S. cerevisiae) |
| chr7_-_81399438 | 2.01 |
ENST00000222390.5
|
HGF
|
hepatocyte growth factor (hepapoietin A; scatter factor) |
| chr8_+_99956759 | 1.97 |
ENST00000522510.1
ENST00000457907.2 |
OSR2
|
odd-skipped related transciption factor 2 |
| chr6_+_64346386 | 1.96 |
ENST00000509330.1
|
PHF3
|
PHD finger protein 3 |
| chr1_-_161102421 | 1.92 |
ENST00000490843.2
ENST00000368006.3 ENST00000392188.1 ENST00000545495.1 |
DEDD
|
death effector domain containing |
| chr18_-_60986613 | 1.92 |
ENST00000444484.1
|
BCL2
|
B-cell CLL/lymphoma 2 |
| chr3_+_29322437 | 1.89 |
ENST00000434693.2
|
RBMS3
|
RNA binding motif, single stranded interacting protein 3 |
| chr14_+_22386325 | 1.82 |
ENST00000390439.2
|
TRAV13-2
|
T cell receptor alpha variable 13-2 |
| chr17_+_1646130 | 1.77 |
ENST00000453066.1
ENST00000324015.3 ENST00000450523.2 ENST00000453723.1 ENST00000382061.4 |
SERPINF2
|
serpin peptidase inhibitor, clade F (alpha-2 antiplasmin, pigment epithelium derived factor), member 2 |
| chr18_-_60986962 | 1.67 |
ENST00000333681.4
|
BCL2
|
B-cell CLL/lymphoma 2 |
| chr10_+_101542462 | 1.58 |
ENST00000370449.4
ENST00000370434.1 |
ABCC2
|
ATP-binding cassette, sub-family C (CFTR/MRP), member 2 |
| chr20_-_44485835 | 1.40 |
ENST00000457981.1
ENST00000426915.1 ENST00000217455.4 |
ACOT8
|
acyl-CoA thioesterase 8 |
| chr6_+_31895467 | 1.38 |
ENST00000556679.1
ENST00000456570.1 |
CFB
CFB
|
complement factor B Complement factor B; Uncharacterized protein; cDNA FLJ55673, highly similar to Complement factor B |
| chr5_-_74162605 | 1.38 |
ENST00000389156.4
ENST00000510496.1 ENST00000380515.3 |
FAM169A
|
family with sequence similarity 169, member A |
| chr4_+_100495864 | 1.37 |
ENST00000265517.5
ENST00000422897.2 |
MTTP
|
microsomal triglyceride transfer protein |
| chr19_-_11639931 | 1.35 |
ENST00000592312.1
ENST00000590480.1 ENST00000585318.1 ENST00000252440.7 ENST00000417981.2 ENST00000270517.7 |
ECSIT
|
ECSIT signalling integrator |
| chr7_-_107443652 | 1.31 |
ENST00000340010.5
ENST00000422236.2 ENST00000453332.1 |
SLC26A3
|
solute carrier family 26 (anion exchanger), member 3 |
| chr2_+_162016804 | 1.27 |
ENST00000392749.2
ENST00000440506.1 |
TANK
|
TRAF family member-associated NFKB activator |
| chr6_+_31895480 | 1.25 |
ENST00000418949.2
ENST00000383177.3 ENST00000477310.1 |
C2
CFB
|
complement component 2 Complement factor B; Uncharacterized protein; cDNA FLJ55673, highly similar to Complement factor B |
| chr4_+_71108300 | 1.25 |
ENST00000304954.3
|
CSN3
|
casein kappa |
| chr1_+_50569575 | 0.99 |
ENST00000371827.1
|
ELAVL4
|
ELAV like neuron-specific RNA binding protein 4 |
| chr6_+_31895254 | 0.93 |
ENST00000299367.5
ENST00000442278.2 |
C2
|
complement component 2 |
| chr7_+_120969045 | 0.92 |
ENST00000222462.2
|
WNT16
|
wingless-type MMTV integration site family, member 16 |
| chr19_-_11639910 | 0.89 |
ENST00000588998.1
ENST00000586149.1 |
ECSIT
|
ECSIT signalling integrator |
| chr1_-_161102367 | 0.83 |
ENST00000464113.1
|
DEDD
|
death effector domain containing |
| chr1_+_2398876 | 0.72 |
ENST00000449969.1
|
PLCH2
|
phospholipase C, eta 2 |
| chr11_-_113577052 | 0.66 |
ENST00000540540.1
ENST00000545579.1 ENST00000538955.1 ENST00000299882.5 |
TMPRSS5
|
transmembrane protease, serine 5 |
| chr6_+_44126545 | 0.63 |
ENST00000532171.1
ENST00000398776.1 ENST00000542245.1 |
CAPN11
|
calpain 11 |
| chrX_+_135618258 | 0.62 |
ENST00000440515.1
ENST00000456412.1 |
VGLL1
|
vestigial like 1 (Drosophila) |
| chr11_-_113577014 | 0.57 |
ENST00000544634.1
ENST00000539732.1 ENST00000538770.1 ENST00000536856.1 ENST00000544476.1 |
TMPRSS5
|
transmembrane protease, serine 5 |
| chr18_-_52969844 | 0.52 |
ENST00000561831.3
|
TCF4
|
transcription factor 4 |
| chr7_-_105517021 | 0.45 |
ENST00000318724.4
ENST00000419735.3 |
ATXN7L1
|
ataxin 7-like 1 |
| chr12_+_93963590 | 0.40 |
ENST00000340600.2
|
SOCS2
|
suppressor of cytokine signaling 2 |
| chr7_-_6048650 | 0.38 |
ENST00000382321.4
ENST00000406569.3 |
PMS2
|
PMS2 postmeiotic segregation increased 2 (S. cerevisiae) |
| chr7_-_81399355 | 0.38 |
ENST00000457544.2
|
HGF
|
hepatocyte growth factor (hepapoietin A; scatter factor) |
| chr8_+_123793633 | 0.37 |
ENST00000314393.4
|
ZHX2
|
zinc fingers and homeoboxes 2 |
| chr9_-_75567962 | 0.29 |
ENST00000297785.3
ENST00000376939.1 |
ALDH1A1
|
aldehyde dehydrogenase 1 family, member A1 |
| chr7_-_105516923 | 0.24 |
ENST00000478915.1
|
ATXN7L1
|
ataxin 7-like 1 |
| chr4_-_89744457 | 0.23 |
ENST00000395002.2
|
FAM13A
|
family with sequence similarity 13, member A |
| chr11_+_120971882 | 0.20 |
ENST00000392793.1
|
TECTA
|
tectorin alpha |
| chr4_-_111563076 | 0.06 |
ENST00000354925.2
ENST00000511990.1 |
PITX2
|
paired-like homeodomain 2 |
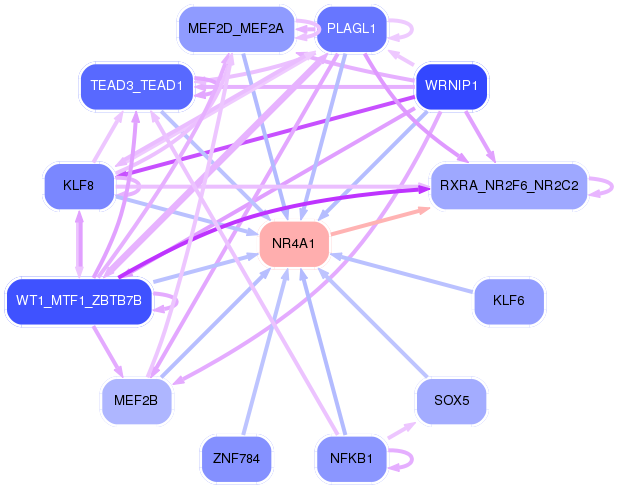
Network of associatons between targets according to the STRING database.

First level regulatory network of NR4A1
Gene Ontology Analysis
Gene overrepresentation in biological_process category:
| Log-likelihood per target | Total log-likelihood | Term | Description |
|---|---|---|---|
| 4.8 | 14.5 | GO:0019482 | beta-alanine metabolic process(GO:0019482) |
| 2.5 | 17.5 | GO:1902035 | positive regulation of hematopoietic stem cell proliferation(GO:1902035) |
| 2.0 | 8.1 | GO:0086097 | phospholipase C-activating angiotensin-activated signaling pathway(GO:0086097) |
| 1.9 | 5.6 | GO:0060620 | regulation of cholesterol import(GO:0060620) negative regulation of cholesterol import(GO:0060621) regulation of sterol import(GO:2000909) negative regulation of sterol import(GO:2000910) |
| 1.8 | 10.5 | GO:2000324 | positive regulation of glucocorticoid receptor signaling pathway(GO:2000324) |
| 1.7 | 5.2 | GO:0035606 | peptidyl-cysteine S-trans-nitrosylation(GO:0035606) |
| 1.6 | 6.4 | GO:2001295 | malonyl-CoA biosynthetic process(GO:2001295) |
| 1.4 | 4.1 | GO:0002125 | maternal aggressive behavior(GO:0002125) positive regulation of female receptivity(GO:0045925) |
| 1.3 | 8.1 | GO:2000158 | positive regulation of ubiquitin-specific protease activity(GO:2000158) |
| 1.2 | 5.0 | GO:0036023 | limb joint morphogenesis(GO:0036022) embryonic skeletal limb joint morphogenesis(GO:0036023) |
| 1.1 | 5.5 | GO:0008065 | establishment of blood-nerve barrier(GO:0008065) |
| 1.0 | 4.1 | GO:1903949 | positive regulation of cardiac conduction(GO:1903781) positive regulation of atrial cardiac muscle cell action potential(GO:1903949) positive regulation of regulation of vascular smooth muscle cell membrane depolarization(GO:1904199) regulation of vascular smooth muscle cell membrane depolarization(GO:1990736) |
| 1.0 | 7.9 | GO:0060665 | regulation of branching involved in salivary gland morphogenesis by mesenchymal-epithelial signaling(GO:0060665) |
| 1.0 | 2.9 | GO:0006421 | asparaginyl-tRNA aminoacylation(GO:0006421) |
| 0.9 | 3.6 | GO:0046671 | negative regulation of cellular pH reduction(GO:0032848) CD8-positive, alpha-beta T cell lineage commitment(GO:0043375) negative regulation of retinal cell programmed cell death(GO:0046671) |
| 0.9 | 6.2 | GO:0010269 | response to selenium ion(GO:0010269) |
| 0.9 | 15.9 | GO:0007021 | tubulin complex assembly(GO:0007021) |
| 0.8 | 2.5 | GO:0032237 | activation of store-operated calcium channel activity(GO:0032237) positive regulation of store-operated calcium channel activity(GO:1901341) |
| 0.8 | 12.7 | GO:0006853 | carnitine shuttle(GO:0006853) |
| 0.8 | 14.3 | GO:1901897 | regulation of relaxation of cardiac muscle(GO:1901897) |
| 0.7 | 10.0 | GO:0034638 | phosphatidylcholine catabolic process(GO:0034638) |
| 0.7 | 6.7 | GO:0090292 | nuclear matrix anchoring at nuclear membrane(GO:0090292) |
| 0.7 | 6.0 | GO:0048386 | positive regulation of retinoic acid receptor signaling pathway(GO:0048386) |
| 0.6 | 3.9 | GO:0097688 | AMPA glutamate receptor clustering(GO:0097113) glutamate receptor clustering(GO:0097688) |
| 0.5 | 1.6 | GO:0050787 | antibiotic metabolic process(GO:0016999) detoxification of mercury ion(GO:0050787) response to antineoplastic agent(GO:0097327) |
| 0.5 | 3.0 | GO:0010836 | negative regulation of protein ADP-ribosylation(GO:0010836) |
| 0.5 | 7.1 | GO:0033539 | fatty acid beta-oxidation using acyl-CoA dehydrogenase(GO:0033539) |
| 0.4 | 4.4 | GO:1900227 | positive regulation of NLRP3 inflammasome complex assembly(GO:1900227) |
| 0.4 | 11.7 | GO:0034755 | iron ion transmembrane transport(GO:0034755) |
| 0.4 | 3.6 | GO:0015889 | cobalamin transport(GO:0015889) |
| 0.4 | 1.8 | GO:0003072 | regulation of blood vessel size by renin-angiotensin(GO:0002034) renal control of peripheral vascular resistance involved in regulation of systemic arterial blood pressure(GO:0003072) |
| 0.3 | 15.2 | GO:0061621 | NADH regeneration(GO:0006735) canonical glycolysis(GO:0061621) glucose catabolic process to pyruvate(GO:0061718) |
| 0.3 | 4.1 | GO:1902018 | negative regulation of cilium assembly(GO:1902018) |
| 0.3 | 0.9 | GO:0090403 | oxidative stress-induced premature senescence(GO:0090403) |
| 0.3 | 5.7 | GO:0008340 | determination of adult lifespan(GO:0008340) |
| 0.3 | 2.3 | GO:0006477 | protein sulfation(GO:0006477) |
| 0.2 | 1.4 | GO:0034196 | acylglycerol transport(GO:0034196) triglyceride transport(GO:0034197) |
| 0.2 | 7.5 | GO:0016601 | Rac protein signal transduction(GO:0016601) |
| 0.2 | 1.3 | GO:0019532 | oxalate transport(GO:0019532) |
| 0.2 | 2.4 | GO:0016446 | somatic hypermutation of immunoglobulin genes(GO:0016446) |
| 0.2 | 2.2 | GO:2000427 | positive regulation of apoptotic cell clearance(GO:2000427) |
| 0.2 | 2.4 | GO:0045475 | locomotor rhythm(GO:0045475) |
| 0.2 | 5.4 | GO:0022400 | regulation of rhodopsin mediated signaling pathway(GO:0022400) |
| 0.1 | 0.3 | GO:0061624 | fructose catabolic process(GO:0006001) fructose catabolic process to hydroxyacetone phosphate and glyceraldehyde-3-phosphate(GO:0061624) |
| 0.1 | 2.1 | GO:0007196 | adenylate cyclase-inhibiting G-protein coupled glutamate receptor signaling pathway(GO:0007196) |
| 0.1 | 1.4 | GO:0010561 | negative regulation of glycoprotein biosynthetic process(GO:0010561) |
| 0.1 | 3.6 | GO:0006099 | tricarboxylic acid cycle(GO:0006099) |
| 0.1 | 2.3 | GO:0007171 | activation of transmembrane receptor protein tyrosine kinase activity(GO:0007171) |
| 0.1 | 1.4 | GO:0006957 | complement activation, alternative pathway(GO:0006957) |
| 0.1 | 4.6 | GO:0046847 | filopodium assembly(GO:0046847) |
| 0.1 | 16.2 | GO:0006367 | transcription initiation from RNA polymerase II promoter(GO:0006367) |
| 0.0 | 1.7 | GO:0007595 | lactation(GO:0007595) |
| 0.0 | 3.8 | GO:0060349 | bone morphogenesis(GO:0060349) |
| 0.0 | 2.2 | GO:0051341 | regulation of oxidoreductase activity(GO:0051341) |
| 0.0 | 0.1 | GO:0035993 | subthalamic nucleus development(GO:0021763) deltoid tuberosity development(GO:0035993) prolactin secreting cell differentiation(GO:0060127) left lung morphogenesis(GO:0060460) pulmonary vein morphogenesis(GO:0060577) superior vena cava morphogenesis(GO:0060578) |
| 0.0 | 6.2 | GO:0051056 | regulation of small GTPase mediated signal transduction(GO:0051056) |
| 0.0 | 2.4 | GO:0015718 | monocarboxylic acid transport(GO:0015718) |
| 0.0 | 2.2 | GO:0034332 | adherens junction organization(GO:0034332) |
| 0.0 | 2.2 | GO:0008286 | insulin receptor signaling pathway(GO:0008286) |
| 0.0 | 3.4 | GO:0001505 | regulation of neurotransmitter levels(GO:0001505) |
| 0.0 | 1.9 | GO:0045727 | positive regulation of translation(GO:0045727) |
| 0.0 | 0.7 | GO:0043647 | inositol phosphate metabolic process(GO:0043647) |
| 0.0 | 1.1 | GO:0008625 | extrinsic apoptotic signaling pathway via death domain receptors(GO:0008625) |
Gene overrepresentation in cellular_component category:
| Log-likelihood per target | Total log-likelihood | Term | Description |
|---|---|---|---|
| 2.5 | 15.2 | GO:0000015 | phosphopyruvate hydratase complex(GO:0000015) |
| 1.3 | 11.7 | GO:0030868 | smooth endoplasmic reticulum membrane(GO:0030868) smooth endoplasmic reticulum part(GO:0097425) |
| 1.0 | 15.9 | GO:0097512 | cardiac myofibril(GO:0097512) |
| 0.7 | 5.2 | GO:0097452 | GAIT complex(GO:0097452) |
| 0.7 | 5.6 | GO:0034363 | intermediate-density lipoprotein particle(GO:0034363) |
| 0.6 | 7.5 | GO:0032045 | guanyl-nucleotide exchange factor complex(GO:0032045) |
| 0.6 | 3.6 | GO:0031232 | extrinsic component of external side of plasma membrane(GO:0031232) |
| 0.6 | 3.0 | GO:0010370 | perinucleolar chromocenter(GO:0010370) |
| 0.5 | 6.7 | GO:0034992 | microtubule organizing center attachment site(GO:0034992) LINC complex(GO:0034993) |
| 0.5 | 3.6 | GO:0045252 | oxoglutarate dehydrogenase complex(GO:0045252) |
| 0.4 | 4.4 | GO:0097427 | microtubule bundle(GO:0097427) |
| 0.4 | 3.9 | GO:0098839 | postsynaptic density membrane(GO:0098839) |
| 0.4 | 2.5 | GO:0032541 | cortical endoplasmic reticulum(GO:0032541) |
| 0.3 | 2.4 | GO:0032389 | MutLalpha complex(GO:0032389) |
| 0.3 | 8.1 | GO:0031143 | pseudopodium(GO:0031143) |
| 0.3 | 13.3 | GO:0033017 | sarcoplasmic reticulum membrane(GO:0033017) |
| 0.3 | 7.7 | GO:0031304 | intrinsic component of mitochondrial inner membrane(GO:0031304) integral component of mitochondrial inner membrane(GO:0031305) |
| 0.2 | 1.6 | GO:0046581 | intercellular canaliculus(GO:0046581) |
| 0.2 | 4.1 | GO:0034706 | sodium channel complex(GO:0034706) |
| 0.2 | 17.5 | GO:0017053 | transcriptional repressor complex(GO:0017053) |
| 0.1 | 1.8 | GO:0005577 | fibrinogen complex(GO:0005577) |
| 0.1 | 5.4 | GO:0001917 | photoreceptor inner segment(GO:0001917) |
| 0.1 | 24.0 | GO:0005741 | mitochondrial outer membrane(GO:0005741) |
| 0.1 | 2.4 | GO:0032809 | neuronal cell body membrane(GO:0032809) cell body membrane(GO:0044298) |
| 0.1 | 1.3 | GO:0097225 | sperm midpiece(GO:0097225) |
| 0.1 | 5.7 | GO:0031093 | platelet alpha granule lumen(GO:0031093) |
| 0.0 | 1.4 | GO:0043235 | receptor complex(GO:0043235) |
| 0.0 | 6.0 | GO:0016605 | PML body(GO:0016605) |
| 0.0 | 4.1 | GO:0043195 | terminal bouton(GO:0043195) |
| 0.0 | 5.9 | GO:0043202 | lysosomal lumen(GO:0043202) |
| 0.0 | 4.6 | GO:0030175 | filopodium(GO:0030175) |
| 0.0 | 5.0 | GO:0031225 | anchored component of membrane(GO:0031225) |
| 0.0 | 1.4 | GO:0031907 | peroxisomal matrix(GO:0005782) microbody lumen(GO:0031907) |
| 0.0 | 2.1 | GO:0042734 | presynaptic membrane(GO:0042734) |
| 0.0 | 2.6 | GO:0072562 | blood microparticle(GO:0072562) |
| 0.0 | 4.8 | GO:0005578 | proteinaceous extracellular matrix(GO:0005578) |
Gene overrepresentation in molecular_function category:
| Log-likelihood per target | Total log-likelihood | Term | Description |
|---|---|---|---|
| 2.5 | 15.2 | GO:0004634 | phosphopyruvate hydratase activity(GO:0004634) |
| 2.5 | 10.0 | GO:0047391 | alkylglycerophosphoethanolamine phosphodiesterase activity(GO:0047391) |
| 2.0 | 8.1 | GO:0010861 | thyroid hormone receptor activator activity(GO:0010861) thyroid hormone receptor coactivator activity(GO:0030375) |
| 1.9 | 11.7 | GO:0072320 | volume-sensitive chloride channel activity(GO:0072320) |
| 1.8 | 9.2 | GO:0004095 | carnitine O-palmitoyltransferase activity(GO:0004095) |
| 1.6 | 6.4 | GO:0003989 | acetyl-CoA carboxylase activity(GO:0003989) |
| 1.5 | 5.9 | GO:0008466 | glycogenin glucosyltransferase activity(GO:0008466) |
| 1.4 | 5.6 | GO:0070653 | high-density lipoprotein particle receptor binding(GO:0070653) |
| 1.3 | 8.1 | GO:0035800 | deubiquitinase activator activity(GO:0035800) |
| 1.3 | 5.2 | GO:0004365 | glyceraldehyde-3-phosphate dehydrogenase (NAD+) (phosphorylating) activity(GO:0004365) aspartic-type endopeptidase inhibitor activity(GO:0019828) glyceraldehyde-3-phosphate dehydrogenase (NAD(P)+) (phosphorylating) activity(GO:0043891) |
| 1.3 | 7.7 | GO:0048039 | ubiquinone binding(GO:0048039) |
| 1.3 | 3.9 | GO:0031812 | G-protein coupled nucleotide receptor binding(GO:0031811) P2Y1 nucleotide receptor binding(GO:0031812) |
| 1.2 | 3.5 | GO:0015199 | amino-acid betaine transmembrane transporter activity(GO:0015199) carnitine transmembrane transporter activity(GO:0015226) |
| 1.1 | 5.4 | GO:0002046 | opsin binding(GO:0002046) |
| 0.9 | 4.4 | GO:0004468 | lysine N-acetyltransferase activity, acting on acetyl phosphate as donor(GO:0004468) |
| 0.9 | 12.3 | GO:0004723 | calcium-dependent protein serine/threonine phosphatase activity(GO:0004723) |
| 0.8 | 6.2 | GO:0008131 | primary amine oxidase activity(GO:0008131) |
| 0.7 | 3.6 | GO:0004591 | oxoglutarate dehydrogenase (succinyl-transferring) activity(GO:0004591) |
| 0.6 | 2.9 | GO:0004815 | aspartate-tRNA ligase activity(GO:0004815) |
| 0.5 | 2.1 | GO:0042030 | ATPase inhibitor activity(GO:0042030) |
| 0.5 | 15.9 | GO:0005212 | structural constituent of eye lens(GO:0005212) |
| 0.4 | 2.1 | GO:0001641 | group II metabotropic glutamate receptor activity(GO:0001641) |
| 0.4 | 17.5 | GO:0001106 | RNA polymerase II transcription corepressor activity(GO:0001106) |
| 0.4 | 3.4 | GO:0004969 | histamine receptor activity(GO:0004969) |
| 0.3 | 2.4 | GO:0032138 | single base insertion or deletion binding(GO:0032138) |
| 0.3 | 3.6 | GO:0031419 | cobalamin binding(GO:0031419) |
| 0.3 | 3.6 | GO:0051434 | BH3 domain binding(GO:0051434) |
| 0.3 | 2.4 | GO:0005250 | A-type (transient outward) potassium channel activity(GO:0005250) |
| 0.2 | 6.7 | GO:0005521 | lamin binding(GO:0005521) |
| 0.2 | 1.3 | GO:0019531 | oxalate transmembrane transporter activity(GO:0019531) |
| 0.2 | 5.5 | GO:0005540 | hyaluronic acid binding(GO:0005540) |
| 0.2 | 21.6 | GO:0003707 | steroid hormone receptor activity(GO:0003707) |
| 0.2 | 7.9 | GO:0042056 | chemoattractant activity(GO:0042056) |
| 0.1 | 14.5 | GO:0016811 | hydrolase activity, acting on carbon-nitrogen (but not peptide) bonds, in linear amides(GO:0016811) |
| 0.1 | 1.6 | GO:0043225 | anion transmembrane-transporting ATPase activity(GO:0043225) |
| 0.1 | 1.4 | GO:0016290 | palmitoyl-CoA hydrolase activity(GO:0016290) |
| 0.1 | 4.1 | GO:0005184 | neuropeptide hormone activity(GO:0005184) |
| 0.1 | 5.7 | GO:0018024 | histone-lysine N-methyltransferase activity(GO:0018024) |
| 0.1 | 4.1 | GO:0005227 | calcium activated cation channel activity(GO:0005227) |
| 0.1 | 2.5 | GO:0051010 | microtubule plus-end binding(GO:0051010) |
| 0.1 | 2.6 | GO:0001848 | complement binding(GO:0001848) |
| 0.1 | 13.6 | GO:0017124 | SH3 domain binding(GO:0017124) |
| 0.1 | 2.3 | GO:0042288 | MHC class I protein binding(GO:0042288) |
| 0.1 | 0.4 | GO:0008269 | JAK pathway signal transduction adaptor activity(GO:0008269) |
| 0.1 | 2.9 | GO:0042162 | telomeric DNA binding(GO:0042162) |
| 0.1 | 0.3 | GO:0018479 | benzaldehyde dehydrogenase (NAD+) activity(GO:0018479) |
| 0.1 | 2.7 | GO:0017112 | Rab guanyl-nucleotide exchange factor activity(GO:0017112) |
| 0.1 | 2.2 | GO:0004864 | protein phosphatase inhibitor activity(GO:0004864) |
| 0.0 | 3.6 | GO:0004004 | ATP-dependent RNA helicase activity(GO:0004004) |
| 0.0 | 4.6 | GO:0005089 | Rho guanyl-nucleotide exchange factor activity(GO:0005089) |
| 0.0 | 2.4 | GO:0008028 | monocarboxylic acid transmembrane transporter activity(GO:0008028) |
| 0.0 | 0.5 | GO:0001011 | transcription factor activity, sequence-specific DNA binding, RNA polymerase recruiting(GO:0001011) transcription factor activity, TFIIB-class binding(GO:0001087) |
| 0.0 | 2.3 | GO:0008146 | sulfotransferase activity(GO:0008146) |
| 0.0 | 3.8 | GO:0004222 | metalloendopeptidase activity(GO:0004222) |
| 0.0 | 2.9 | GO:0003730 | mRNA 3'-UTR binding(GO:0003730) |
| 0.0 | 1.4 | GO:0005548 | phospholipid transporter activity(GO:0005548) |
| 0.0 | 0.9 | GO:0005109 | frizzled binding(GO:0005109) |
| 0.0 | 0.7 | GO:0004435 | phosphatidylinositol phospholipase C activity(GO:0004435) |
| 0.0 | 6.9 | GO:0005096 | GTPase activator activity(GO:0005096) |
| 0.0 | 1.2 | GO:0005044 | scavenger receptor activity(GO:0005044) |
| 0.0 | 1.6 | GO:0005179 | hormone activity(GO:0005179) |
| 0.0 | 1.8 | GO:0004867 | serine-type endopeptidase inhibitor activity(GO:0004867) |
| 0.0 | 0.6 | GO:0004198 | calcium-dependent cysteine-type endopeptidase activity(GO:0004198) |
| 0.0 | 4.1 | GO:0005516 | calmodulin binding(GO:0005516) |
Gene overrepresentation in C2:CP category:
| Log-likelihood per target | Total log-likelihood | Term | Description |
|---|---|---|---|
| 0.4 | 14.9 | ST WNT CA2 CYCLIC GMP PATHWAY | Wnt/Ca2+/cyclic GMP signaling. |
| 0.3 | 15.8 | ST TUMOR NECROSIS FACTOR PATHWAY | Tumor Necrosis Factor Pathway. |
| 0.3 | 3.6 | SA FAS SIGNALING | The TNF-type receptor Fas induces apoptosis on ligand binding. |
| 0.2 | 5.4 | PID RHODOPSIN PATHWAY | Visual signal transduction: Rods |
| 0.2 | 6.0 | ST MYOCYTE AD PATHWAY | Myocyte Adrenergic Pathway is a specific case of the generalized Adrenergic Pathway. |
| 0.1 | 7.5 | PID IL8 CXCR2 PATHWAY | IL8- and CXCR2-mediated signaling events |
| 0.1 | 7.9 | PID ARF6 PATHWAY | Arf6 signaling events |
| 0.1 | 8.5 | PID HNF3B PATHWAY | FOXA2 and FOXA3 transcription factor networks |
| 0.1 | 6.2 | PID ALPHA SYNUCLEIN PATHWAY | Alpha-synuclein signaling |
| 0.1 | 5.5 | NABA PROTEOGLYCANS | Genes encoding proteoglycans |
| 0.1 | 6.0 | PID AR TF PATHWAY | Regulation of Androgen receptor activity |
| 0.1 | 6.1 | WNT SIGNALING | Genes related to Wnt-mediated signal transduction |
| 0.1 | 2.8 | ST FAS SIGNALING PATHWAY | Fas Signaling Pathway |
| 0.0 | 4.8 | PID P75 NTR PATHWAY | p75(NTR)-mediated signaling |
| 0.0 | 2.5 | PID CD8 TCR PATHWAY | TCR signaling in naïve CD8+ T cells |
| 0.0 | 3.1 | PID SMAD2 3NUCLEAR PATHWAY | Regulation of nuclear SMAD2/3 signaling |
| 0.0 | 2.9 | PID TELOMERASE PATHWAY | Regulation of Telomerase |
| 0.0 | 4.5 | NABA ECM REGULATORS | Genes encoding enzymes and their regulators involved in the remodeling of the extracellular matrix |
Gene overrepresentation in C2:CP:REACTOME category:
| Log-likelihood per target | Total log-likelihood | Term | Description |
|---|---|---|---|
| 1.0 | 14.5 | REACTOME PYRIMIDINE CATABOLISM | Genes involved in Pyrimidine catabolism |
| 0.6 | 19.1 | REACTOME ACTIVATED AMPK STIMULATES FATTY ACID OXIDATION IN MUSCLE | Genes involved in Activated AMPK stimulates fatty-acid oxidation in muscle |
| 0.4 | 20.5 | REACTOME GLYCOLYSIS | Genes involved in Glycolysis |
| 0.4 | 8.1 | REACTOME RAS ACTIVATION UOPN CA2 INFUX THROUGH NMDA RECEPTOR | Genes involved in Ras activation uopn Ca2+ infux through NMDA receptor |
| 0.4 | 7.9 | REACTOME IL 7 SIGNALING | Genes involved in Interleukin-7 signaling |
| 0.4 | 9.2 | REACTOME HDL MEDIATED LIPID TRANSPORT | Genes involved in HDL-mediated lipid transport |
| 0.3 | 3.7 | REACTOME DIGESTION OF DIETARY CARBOHYDRATE | Genes involved in Digestion of dietary carbohydrate |
| 0.2 | 2.5 | REACTOME ELEVATION OF CYTOSOLIC CA2 LEVELS | Genes involved in Elevation of cytosolic Ca2+ levels |
| 0.2 | 8.1 | REACTOME TRAF6 MEDIATED IRF7 ACTIVATION | Genes involved in TRAF6 mediated IRF7 activation |
| 0.2 | 3.6 | REACTOME INITIAL TRIGGERING OF COMPLEMENT | Genes involved in Initial triggering of complement |
| 0.2 | 7.5 | REACTOME THE ROLE OF NEF IN HIV1 REPLICATION AND DISEASE PATHOGENESIS | Genes involved in The role of Nef in HIV-1 replication and disease pathogenesis |
| 0.1 | 3.8 | REACTOME REGULATION OF INSULIN LIKE GROWTH FACTOR IGF ACTIVITY BY INSULIN LIKE GROWTH FACTOR BINDING PROTEINS IGFBPS | Genes involved in Regulation of Insulin-like Growth Factor (IGF) Activity by Insulin-like Growth Factor Binding Proteins (IGFBPs) |
| 0.1 | 3.6 | REACTOME ACTIVATION OF BH3 ONLY PROTEINS | Genes involved in Activation of BH3-only proteins |
| 0.1 | 2.9 | REACTOME MITOCHONDRIAL TRNA AMINOACYLATION | Genes involved in Mitochondrial tRNA aminoacylation |
| 0.1 | 2.1 | REACTOME CLASS C 3 METABOTROPIC GLUTAMATE PHEROMONE RECEPTORS | Genes involved in Class C/3 (Metabotropic glutamate/pheromone receptors) |
| 0.1 | 9.6 | REACTOME MEIOTIC SYNAPSIS | Genes involved in Meiotic Synapsis |
| 0.1 | 1.4 | REACTOME CHYLOMICRON MEDIATED LIPID TRANSPORT | Genes involved in Chylomicron-mediated lipid transport |
| 0.1 | 4.6 | REACTOME NRAGE SIGNALS DEATH THROUGH JNK | Genes involved in NRAGE signals death through JNK |
| 0.1 | 4.8 | REACTOME P75 NTR RECEPTOR MEDIATED SIGNALLING | Genes involved in p75 NTR receptor-mediated signalling |
| 0.1 | 1.4 | REACTOME ALPHA LINOLENIC ACID ALA METABOLISM | Genes involved in alpha-linolenic acid (ALA) metabolism |
| 0.1 | 6.5 | REACTOME PHASE1 FUNCTIONALIZATION OF COMPOUNDS | Genes involved in Phase 1 - Functionalization of compounds |
| 0.1 | 2.2 | REACTOME ADHERENS JUNCTIONS INTERACTIONS | Genes involved in Adherens junctions interactions |
| 0.1 | 7.5 | REACTOME SIGNALING BY RHO GTPASES | Genes involved in Signaling by Rho GTPases |
| 0.0 | 2.4 | REACTOME VOLTAGE GATED POTASSIUM CHANNELS | Genes involved in Voltage gated Potassium channels |
| 0.0 | 1.6 | REACTOME ABC FAMILY PROTEINS MEDIATED TRANSPORT | Genes involved in ABC-family proteins mediated transport |
| 0.0 | 2.3 | REACTOME CHONDROITIN SULFATE DERMATAN SULFATE METABOLISM | Genes involved in Chondroitin sulfate/dermatan sulfate metabolism |
| 0.0 | 3.0 | REACTOME RESPIRATORY ELECTRON TRANSPORT | Genes involved in Respiratory electron transport |
| 0.0 | 7.2 | REACTOME G ALPHA Q SIGNALLING EVENTS | Genes involved in G alpha (q) signalling events |
| 0.0 | 2.2 | REACTOME TRAF6 MEDIATED INDUCTION OF NFKB AND MAP KINASES UPON TLR7 8 OR 9 ACTIVATION | Genes involved in TRAF6 mediated induction of NFkB and MAP kinases upon TLR7/8 or 9 activation |
| 0.0 | 0.5 | REACTOME MYOGENESIS | Genes involved in Myogenesis |
| 0.0 | 1.8 | REACTOME RESPONSE TO ELEVATED PLATELET CYTOSOLIC CA2 | Genes involved in Response to elevated platelet cytosolic Ca2+ |
| 0.0 | 0.4 | REACTOME GROWTH HORMONE RECEPTOR SIGNALING | Genes involved in Growth hormone receptor signaling |