Project
GNF SymAtlas + NCI-60 cancer cell lines, comparison of cancers vs non-cancers, human (Su, 2004; Ross, 2000)
Navigation
Downloads
Results for OLIG2_NEUROD1_ATOH1
Z-value: 0.31
Motif logo
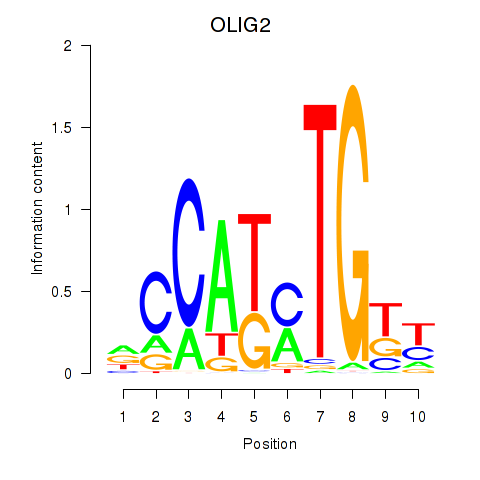
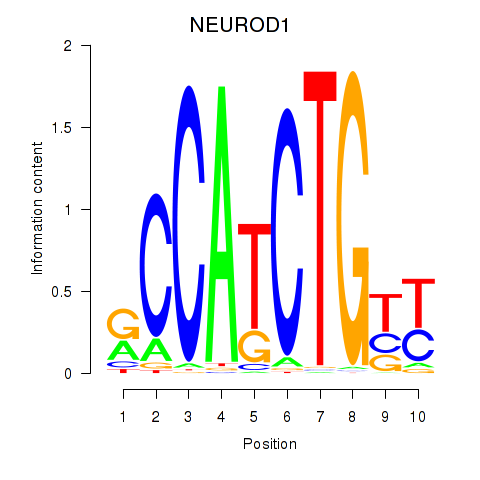
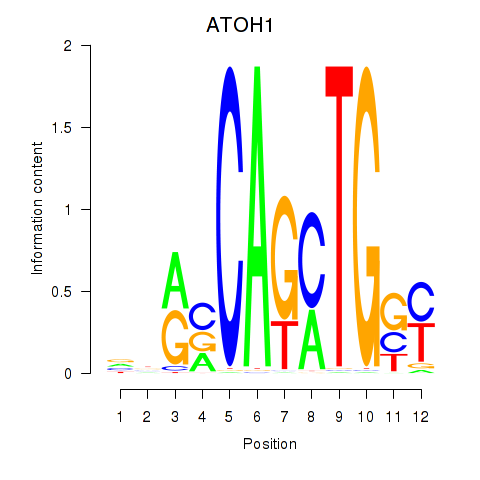
Transcription factors associated with OLIG2_NEUROD1_ATOH1
| Gene Symbol | Gene ID | Gene Info |
|---|---|---|
|
OLIG2
|
ENSG00000205927.4 | oligodendrocyte transcription factor 2 |
|
NEUROD1
|
ENSG00000162992.3 | neuronal differentiation 1 |
|
ATOH1
|
ENSG00000172238.3 | atonal bHLH transcription factor 1 |
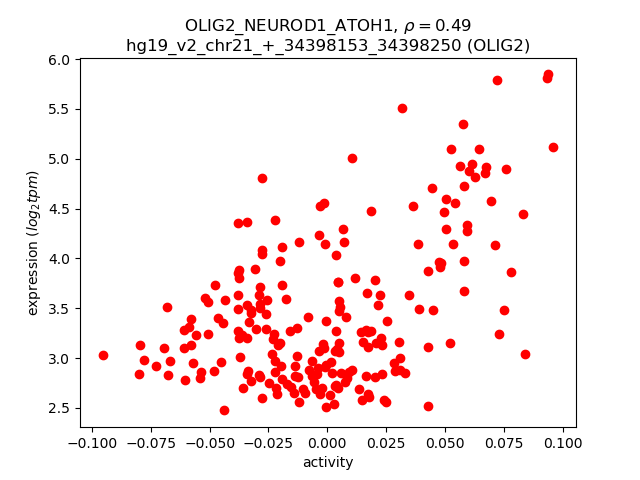
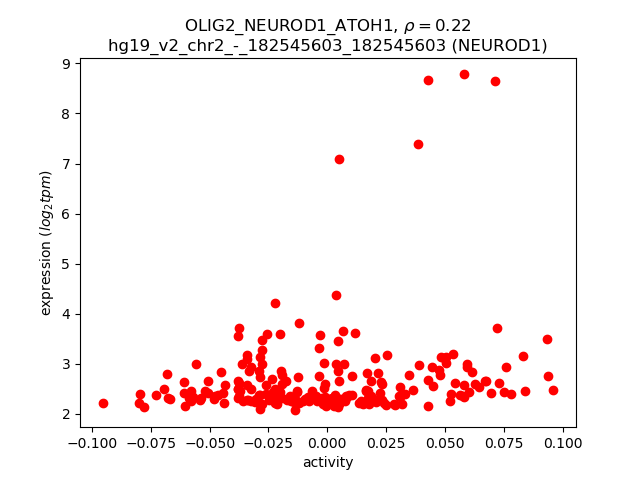
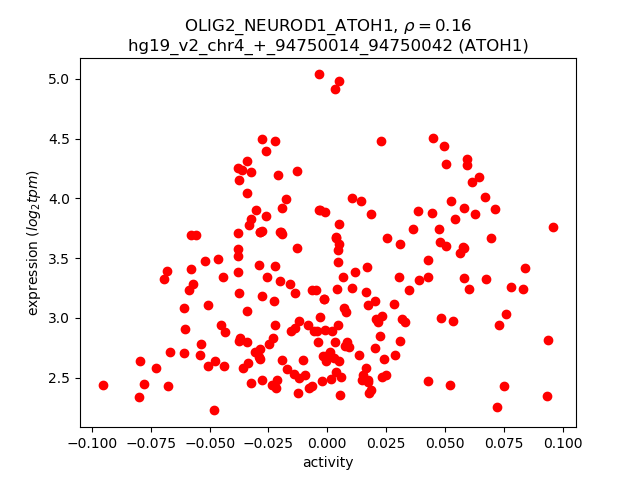
Activity-expression correlation:
| Gene | Promoter | Pearson corr. coef. | P-value | Plot |
|---|---|---|---|---|
| OLIG2 | hg19_v2_chr21_+_34398153_34398250 | 0.49 | 1.2e-14 | Click! |
| NEUROD1 | hg19_v2_chr2_-_182545603_182545603 | 0.22 | 1.3e-03 | Click! |
| ATOH1 | hg19_v2_chr4_+_94750014_94750042 | 0.16 | 2.1e-02 | Click! |
Activity profile of OLIG2_NEUROD1_ATOH1 motif
Sorted Z-values of OLIG2_NEUROD1_ATOH1 motif
| Promoter | Log-likelihood | Transcript | Gene | Gene Info |
|---|---|---|---|---|
| chr12_+_6309963 | 22.05 |
ENST00000382515.2
|
CD9
|
CD9 molecule |
| chr7_-_30029574 | 20.26 |
ENST00000426154.1
ENST00000421434.1 ENST00000434476.2 |
SCRN1
|
secernin 1 |
| chr7_-_30029367 | 20.10 |
ENST00000242059.5
|
SCRN1
|
secernin 1 |
| chr12_+_6309517 | 19.69 |
ENST00000382519.4
ENST00000009180.4 |
CD9
|
CD9 molecule |
| chr3_-_195310802 | 19.60 |
ENST00000421243.1
ENST00000453131.1 |
APOD
|
apolipoprotein D |
| chr10_-_15413035 | 17.78 |
ENST00000378116.4
ENST00000455654.1 |
FAM171A1
|
family with sequence similarity 171, member A1 |
| chr5_+_102201722 | 15.19 |
ENST00000274392.9
ENST00000455264.2 |
PAM
|
peptidylglycine alpha-amidating monooxygenase |
| chr4_+_113970772 | 14.06 |
ENST00000504454.1
ENST00000394537.3 ENST00000357077.4 ENST00000264366.6 |
ANK2
|
ankyrin 2, neuronal |
| chr10_-_73848764 | 13.81 |
ENST00000317376.4
ENST00000412663.1 |
SPOCK2
|
sparc/osteonectin, cwcv and kazal-like domains proteoglycan (testican) 2 |
| chr5_+_102201509 | 13.44 |
ENST00000348126.2
ENST00000379787.4 |
PAM
|
peptidylglycine alpha-amidating monooxygenase |
| chr5_+_102201687 | 13.42 |
ENST00000304400.7
|
PAM
|
peptidylglycine alpha-amidating monooxygenase |
| chr10_-_62149433 | 13.27 |
ENST00000280772.2
|
ANK3
|
ankyrin 3, node of Ranvier (ankyrin G) |
| chr6_+_30851840 | 12.70 |
ENST00000511510.1
ENST00000376569.3 ENST00000376575.3 ENST00000376570.4 ENST00000446312.1 ENST00000504927.1 |
DDR1
|
discoidin domain receptor tyrosine kinase 1 |
| chr5_+_173472607 | 12.61 |
ENST00000303177.3
ENST00000519867.1 |
NSG2
|
Neuron-specific protein family member 2 |
| chr19_-_49944806 | 12.59 |
ENST00000221485.3
|
SLC17A7
|
solute carrier family 17 (vesicular glutamate transporter), member 7 |
| chr16_+_23847267 | 12.56 |
ENST00000321728.7
|
PRKCB
|
protein kinase C, beta |
| chr2_-_175711133 | 12.24 |
ENST00000409597.1
ENST00000413882.1 |
CHN1
|
chimerin 1 |
| chr4_+_114214125 | 11.95 |
ENST00000509550.1
|
ANK2
|
ankyrin 2, neuronal |
| chr12_-_123752624 | 11.75 |
ENST00000542174.1
ENST00000535796.1 |
CDK2AP1
|
cyclin-dependent kinase 2 associated protein 1 |
| chr3_+_159570722 | 11.41 |
ENST00000482804.1
|
SCHIP1
|
schwannomin interacting protein 1 |
| chr16_-_21289627 | 11.17 |
ENST00000396023.2
ENST00000415987.2 |
CRYM
|
crystallin, mu |
| chr1_+_10271674 | 11.16 |
ENST00000377086.1
|
KIF1B
|
kinesin family member 1B |
| chr1_+_92632542 | 10.97 |
ENST00000409154.4
ENST00000370378.4 |
KIAA1107
|
KIAA1107 |
| chr10_-_73848531 | 10.30 |
ENST00000373109.2
|
SPOCK2
|
sparc/osteonectin, cwcv and kazal-like domains proteoglycan (testican) 2 |
| chr8_+_26371763 | 9.78 |
ENST00000521913.1
|
DPYSL2
|
dihydropyrimidinase-like 2 |
| chr16_+_56623433 | 9.57 |
ENST00000570176.1
|
MT3
|
metallothionein 3 |
| chr9_-_140351928 | 9.54 |
ENST00000339554.3
|
NSMF
|
NMDA receptor synaptonuclear signaling and neuronal migration factor |
| chrX_-_13835147 | 8.95 |
ENST00000493677.1
ENST00000355135.2 |
GPM6B
|
glycoprotein M6B |
| chr10_-_97321165 | 8.91 |
ENST00000306402.6
|
SORBS1
|
sorbin and SH3 domain containing 1 |
| chr17_-_15168624 | 8.75 |
ENST00000312280.3
ENST00000494511.1 ENST00000580584.1 |
PMP22
|
peripheral myelin protein 22 |
| chr3_-_18480260 | 8.62 |
ENST00000454909.2
|
SATB1
|
SATB homeobox 1 |
| chr15_+_63354769 | 8.54 |
ENST00000558910.1
|
TPM1
|
tropomyosin 1 (alpha) |
| chr19_-_51466681 | 8.54 |
ENST00000456750.2
|
KLK6
|
kallikrein-related peptidase 6 |
| chr5_+_102201430 | 8.48 |
ENST00000438793.3
ENST00000346918.2 |
PAM
|
peptidylglycine alpha-amidating monooxygenase |
| chr17_+_77681075 | 8.40 |
ENST00000397549.2
|
CTD-2116F7.1
|
CTD-2116F7.1 |
| chr1_+_226736446 | 8.32 |
ENST00000366788.3
ENST00000366789.4 |
C1orf95
|
chromosome 1 open reading frame 95 |
| chrX_+_135278908 | 8.31 |
ENST00000539015.1
ENST00000370683.1 |
FHL1
|
four and a half LIM domains 1 |
| chr5_-_16936340 | 8.21 |
ENST00000507288.1
ENST00000513610.1 |
MYO10
|
myosin X |
| chr4_-_176733897 | 8.18 |
ENST00000393658.2
|
GPM6A
|
glycoprotein M6A |
| chr2_-_152830441 | 7.72 |
ENST00000534999.1
ENST00000397327.2 |
CACNB4
|
calcium channel, voltage-dependent, beta 4 subunit |
| chr13_-_36705425 | 7.65 |
ENST00000255448.4
ENST00000360631.3 ENST00000379892.4 |
DCLK1
|
doublecortin-like kinase 1 |
| chrX_-_13835461 | 7.48 |
ENST00000316715.4
ENST00000356942.5 |
GPM6B
|
glycoprotein M6B |
| chr11_-_66115032 | 7.32 |
ENST00000311181.4
|
B3GNT1
|
UDP-GlcNAc:betaGal beta-1,3-N-acetylglucosaminyltransferase 1 |
| chr16_+_23847339 | 7.22 |
ENST00000303531.7
|
PRKCB
|
protein kinase C, beta |
| chr16_+_6533729 | 7.02 |
ENST00000551752.1
|
RBFOX1
|
RNA binding protein, fox-1 homolog (C. elegans) 1 |
| chr19_+_41222998 | 6.70 |
ENST00000263370.2
|
ITPKC
|
inositol-trisphosphate 3-kinase C |
| chr5_-_171433579 | 6.65 |
ENST00000265094.5
ENST00000393802.2 |
FBXW11
|
F-box and WD repeat domain containing 11 |
| chr1_+_36023035 | 6.48 |
ENST00000373253.3
|
NCDN
|
neurochondrin |
| chr3_+_111717511 | 6.46 |
ENST00000478951.1
ENST00000393917.2 |
TAGLN3
|
transgelin 3 |
| chr4_+_1795012 | 6.23 |
ENST00000481110.2
ENST00000340107.4 ENST00000440486.2 ENST00000412135.2 |
FGFR3
|
fibroblast growth factor receptor 3 |
| chr11_-_695162 | 5.94 |
ENST00000338675.6
|
DEAF1
|
DEAF1 transcription factor |
| chr1_+_171810606 | 5.78 |
ENST00000358155.4
ENST00000367733.2 ENST00000355305.5 ENST00000367731.1 |
DNM3
|
dynamin 3 |
| chr1_+_50569575 | 5.61 |
ENST00000371827.1
|
ELAVL4
|
ELAV like neuron-specific RNA binding protein 4 |
| chr14_+_90863327 | 5.55 |
ENST00000356978.4
|
CALM1
|
calmodulin 1 (phosphorylase kinase, delta) |
| chr5_-_171433819 | 5.52 |
ENST00000296933.6
|
FBXW11
|
F-box and WD repeat domain containing 11 |
| chr1_+_169075554 | 5.42 |
ENST00000367815.4
|
ATP1B1
|
ATPase, Na+/K+ transporting, beta 1 polypeptide |
| chr11_-_1587166 | 5.39 |
ENST00000331588.4
|
DUSP8
|
dual specificity phosphatase 8 |
| chr2_-_2334888 | 5.38 |
ENST00000428368.2
ENST00000399161.2 |
MYT1L
|
myelin transcription factor 1-like |
| chr10_-_97321112 | 5.36 |
ENST00000607232.1
ENST00000371227.4 ENST00000371249.2 ENST00000371247.2 ENST00000371246.2 ENST00000393949.1 ENST00000353505.5 ENST00000347291.4 |
SORBS1
|
sorbin and SH3 domain containing 1 |
| chr1_-_149889382 | 5.35 |
ENST00000369145.1
ENST00000369146.3 |
SV2A
|
synaptic vesicle glycoprotein 2A |
| chr15_-_45670924 | 5.25 |
ENST00000396659.3
|
GATM
|
glycine amidinotransferase (L-arginine:glycine amidinotransferase) |
| chr6_+_30852130 | 5.24 |
ENST00000428153.2
ENST00000376568.3 ENST00000452441.1 ENST00000515219.1 |
DDR1
|
discoidin domain receptor tyrosine kinase 1 |
| chr16_+_56385290 | 5.22 |
ENST00000564727.1
|
GNAO1
|
guanine nucleotide binding protein (G protein), alpha activating activity polypeptide O |
| chr2_-_183903133 | 5.20 |
ENST00000361354.4
|
NCKAP1
|
NCK-associated protein 1 |
| chrX_+_135279179 | 5.16 |
ENST00000370676.3
|
FHL1
|
four and a half LIM domains 1 |
| chr22_-_36236623 | 5.08 |
ENST00000405409.2
|
RBFOX2
|
RNA binding protein, fox-1 homolog (C. elegans) 2 |
| chr14_+_93389425 | 4.94 |
ENST00000216492.5
ENST00000334654.4 |
CHGA
|
chromogranin A (parathyroid secretory protein 1) |
| chr2_-_241759622 | 4.78 |
ENST00000320389.7
ENST00000498729.2 |
KIF1A
|
kinesin family member 1A |
| chr8_+_9413410 | 4.68 |
ENST00000520408.1
ENST00000310430.6 ENST00000522110.1 |
TNKS
|
tankyrase, TRF1-interacting ankyrin-related ADP-ribose polymerase |
| chr19_-_47164386 | 4.59 |
ENST00000391916.2
ENST00000410105.2 |
DACT3
|
dishevelled-binding antagonist of beta-catenin 3 |
| chr12_+_122150646 | 4.48 |
ENST00000449592.2
|
TMEM120B
|
transmembrane protein 120B |
| chr19_-_39368887 | 4.36 |
ENST00000340740.3
ENST00000591812.1 |
RINL
|
Ras and Rab interactor-like |
| chr11_+_45918092 | 4.32 |
ENST00000395629.2
|
MAPK8IP1
|
mitogen-activated protein kinase 8 interacting protein 1 |
| chr15_-_73925651 | 4.28 |
ENST00000545878.1
ENST00000287226.8 ENST00000345330.4 |
NPTN
|
neuroplastin |
| chr6_-_52860171 | 4.26 |
ENST00000370963.4
|
GSTA4
|
glutathione S-transferase alpha 4 |
| chr17_-_1090599 | 4.23 |
ENST00000544583.2
|
ABR
|
active BCR-related |
| chr2_-_152830479 | 4.20 |
ENST00000360283.6
|
CACNB4
|
calcium channel, voltage-dependent, beta 4 subunit |
| chr19_-_45826125 | 4.20 |
ENST00000221476.3
|
CKM
|
creatine kinase, muscle |
| chr19_+_36249057 | 4.19 |
ENST00000301165.5
ENST00000536950.1 ENST00000537459.1 ENST00000421853.2 |
C19orf55
|
chromosome 19 open reading frame 55 |
| chr19_-_3772209 | 4.17 |
ENST00000555978.1
ENST00000555633.1 |
RAX2
|
retina and anterior neural fold homeobox 2 |
| chr2_+_79740118 | 4.06 |
ENST00000496558.1
ENST00000451966.1 |
CTNNA2
|
catenin (cadherin-associated protein), alpha 2 |
| chr4_+_7045042 | 4.05 |
ENST00000310074.7
ENST00000512388.1 |
TADA2B
|
transcriptional adaptor 2B |
| chr6_-_52859968 | 4.01 |
ENST00000370959.1
|
GSTA4
|
glutathione S-transferase alpha 4 |
| chr14_+_100150622 | 4.00 |
ENST00000261835.3
|
CYP46A1
|
cytochrome P450, family 46, subfamily A, polypeptide 1 |
| chr16_+_6533380 | 3.99 |
ENST00000552089.1
|
RBFOX1
|
RNA binding protein, fox-1 homolog (C. elegans) 1 |
| chr7_-_97881429 | 3.96 |
ENST00000420697.1
ENST00000379795.3 ENST00000415086.1 ENST00000542604.1 ENST00000447648.2 |
TECPR1
|
tectonin beta-propeller repeat containing 1 |
| chr10_-_69597810 | 3.93 |
ENST00000483798.2
|
DNAJC12
|
DnaJ (Hsp40) homolog, subfamily C, member 12 |
| chr12_-_48152853 | 3.90 |
ENST00000171000.4
|
RAPGEF3
|
Rap guanine nucleotide exchange factor (GEF) 3 |
| chr11_-_133402410 | 3.85 |
ENST00000524381.1
|
OPCML
|
opioid binding protein/cell adhesion molecule-like |
| chr12_+_49212514 | 3.80 |
ENST00000301050.2
ENST00000548279.1 ENST00000547230.1 |
CACNB3
|
calcium channel, voltage-dependent, beta 3 subunit |
| chr12_+_6833237 | 3.80 |
ENST00000229251.3
ENST00000539735.1 ENST00000538410.1 |
COPS7A
|
COP9 signalosome subunit 7A |
| chr12_-_48152611 | 3.77 |
ENST00000389212.3
|
RAPGEF3
|
Rap guanine nucleotide exchange factor (GEF) 3 |
| chrX_-_73512411 | 3.77 |
ENST00000602576.1
ENST00000429124.1 |
FTX
|
FTX transcript, XIST regulator (non-protein coding) |
| chr1_+_50574585 | 3.77 |
ENST00000371824.1
ENST00000371823.4 |
ELAVL4
|
ELAV like neuron-specific RNA binding protein 4 |
| chr19_+_18208603 | 3.70 |
ENST00000262811.6
|
MAST3
|
microtubule associated serine/threonine kinase 3 |
| chr1_+_159141397 | 3.64 |
ENST00000368124.4
ENST00000368125.4 ENST00000416746.1 |
CADM3
|
cell adhesion molecule 3 |
| chr14_+_90863364 | 3.62 |
ENST00000447653.3
ENST00000553542.1 |
CALM1
|
calmodulin 1 (phosphorylase kinase, delta) |
| chr3_-_45267760 | 3.52 |
ENST00000503771.1
|
TMEM158
|
transmembrane protein 158 (gene/pseudogene) |
| chr17_+_44668035 | 3.47 |
ENST00000398238.4
ENST00000225282.8 |
NSF
|
N-ethylmaleimide-sensitive factor |
| chr6_+_30848557 | 3.45 |
ENST00000460944.2
ENST00000324771.8 |
DDR1
|
discoidin domain receptor tyrosine kinase 1 |
| chr10_-_69597915 | 3.43 |
ENST00000225171.2
|
DNAJC12
|
DnaJ (Hsp40) homolog, subfamily C, member 12 |
| chr7_-_31380502 | 3.39 |
ENST00000297142.3
|
NEUROD6
|
neuronal differentiation 6 |
| chr15_+_43809797 | 3.38 |
ENST00000399453.1
ENST00000300231.5 |
MAP1A
|
microtubule-associated protein 1A |
| chr4_-_186877806 | 3.36 |
ENST00000355634.5
|
SORBS2
|
sorbin and SH3 domain containing 2 |
| chr12_+_6833437 | 3.31 |
ENST00000534947.1
ENST00000541866.1 ENST00000534877.1 ENST00000538753.1 |
COPS7A
|
COP9 signalosome subunit 7A |
| chr12_+_41086297 | 3.30 |
ENST00000551295.2
|
CNTN1
|
contactin 1 |
| chr1_-_150669604 | 3.28 |
ENST00000427665.1
ENST00000540514.1 |
GOLPH3L
|
golgi phosphoprotein 3-like |
| chr1_+_110527308 | 3.23 |
ENST00000369799.5
|
AHCYL1
|
adenosylhomocysteinase-like 1 |
| chr4_-_153303658 | 3.18 |
ENST00000296555.5
|
FBXW7
|
F-box and WD repeat domain containing 7, E3 ubiquitin protein ligase |
| chr1_-_26233423 | 3.15 |
ENST00000357865.2
|
STMN1
|
stathmin 1 |
| chr19_+_35521572 | 3.14 |
ENST00000262631.5
|
SCN1B
|
sodium channel, voltage-gated, type I, beta subunit |
| chr10_+_18429671 | 3.09 |
ENST00000282343.8
|
CACNB2
|
calcium channel, voltage-dependent, beta 2 subunit |
| chr9_-_131644202 | 3.09 |
ENST00000320665.6
ENST00000436267.2 |
CCBL1
|
cysteine conjugate-beta lyase, cytoplasmic |
| chr22_-_38699003 | 3.01 |
ENST00000451964.1
|
CSNK1E
|
casein kinase 1, epsilon |
| chrX_+_110187513 | 2.98 |
ENST00000446737.1
ENST00000425146.1 |
PAK3
|
p21 protein (Cdc42/Rac)-activated kinase 3 |
| chr9_+_126773880 | 2.96 |
ENST00000373615.4
|
LHX2
|
LIM homeobox 2 |
| chr19_+_18794470 | 2.95 |
ENST00000321949.8
ENST00000338797.6 |
CRTC1
|
CREB regulated transcription coactivator 1 |
| chr18_-_53068911 | 2.91 |
ENST00000537856.3
|
TCF4
|
transcription factor 4 |
| chr20_+_37434329 | 2.88 |
ENST00000299824.1
ENST00000373331.2 |
PPP1R16B
|
protein phosphatase 1, regulatory subunit 16B |
| chr2_+_173600514 | 2.88 |
ENST00000264111.6
|
RAPGEF4
|
Rap guanine nucleotide exchange factor (GEF) 4 |
| chr22_-_36236265 | 2.84 |
ENST00000414461.2
ENST00000416721.2 ENST00000449924.2 ENST00000262829.7 ENST00000397305.3 |
RBFOX2
|
RNA binding protein, fox-1 homolog (C. elegans) 2 |
| chr10_+_96162242 | 2.78 |
ENST00000225235.4
|
TBC1D12
|
TBC1 domain family, member 12 |
| chr18_-_52989217 | 2.77 |
ENST00000570287.2
|
TCF4
|
transcription factor 4 |
| chr10_+_18429606 | 2.76 |
ENST00000324631.7
ENST00000352115.6 ENST00000377328.1 |
CACNB2
|
calcium channel, voltage-dependent, beta 2 subunit |
| chr15_-_78526855 | 2.75 |
ENST00000541759.1
ENST00000558130.1 |
ACSBG1
|
acyl-CoA synthetase bubblegum family member 1 |
| chr19_+_35521616 | 2.70 |
ENST00000595652.1
|
SCN1B
|
sodium channel, voltage-gated, type I, beta subunit |
| chr2_-_166930131 | 2.68 |
ENST00000303395.4
ENST00000409050.1 ENST00000423058.2 ENST00000375405.3 |
SCN1A
|
sodium channel, voltage-gated, type I, alpha subunit |
| chr1_+_22963158 | 2.62 |
ENST00000438241.1
|
C1QA
|
complement component 1, q subcomponent, A chain |
| chr16_+_29674540 | 2.59 |
ENST00000436527.1
ENST00000360121.3 ENST00000449759.1 |
SPN
QPRT
|
sialophorin quinolinate phosphoribosyltransferase |
| chr9_+_140033862 | 2.59 |
ENST00000350902.5
ENST00000371550.4 ENST00000371546.4 ENST00000371555.4 ENST00000371553.3 ENST00000371559.4 ENST00000371560.3 |
GRIN1
|
glutamate receptor, ionotropic, N-methyl D-aspartate 1 |
| chr6_-_33385902 | 2.59 |
ENST00000374500.5
|
CUTA
|
cutA divalent cation tolerance homolog (E. coli) |
| chr3_-_10547333 | 2.57 |
ENST00000383800.4
|
ATP2B2
|
ATPase, Ca++ transporting, plasma membrane 2 |
| chr1_+_17559776 | 2.52 |
ENST00000537499.1
ENST00000413717.2 ENST00000536552.1 |
PADI1
|
peptidyl arginine deiminase, type I |
| chr5_-_138210977 | 2.47 |
ENST00000274711.6
ENST00000521094.2 |
LRRTM2
|
leucine rich repeat transmembrane neuronal 2 |
| chr17_-_2996290 | 2.46 |
ENST00000331459.1
|
OR1D2
|
olfactory receptor, family 1, subfamily D, member 2 |
| chrX_-_73512177 | 2.43 |
ENST00000603672.1
ENST00000418855.1 |
FTX
|
FTX transcript, XIST regulator (non-protein coding) |
| chr4_-_186877502 | 2.41 |
ENST00000431902.1
ENST00000284776.7 ENST00000415274.1 |
SORBS2
|
sorbin and SH3 domain containing 2 |
| chr12_-_49393092 | 2.39 |
ENST00000421952.2
|
DDN
|
dendrin |
| chr9_-_14313641 | 2.34 |
ENST00000380953.1
|
NFIB
|
nuclear factor I/B |
| chrX_-_63005405 | 2.33 |
ENST00000374878.1
ENST00000437457.2 |
ARHGEF9
|
Cdc42 guanine nucleotide exchange factor (GEF) 9 |
| chr12_-_48152428 | 2.33 |
ENST00000449771.2
ENST00000395358.3 |
RAPGEF3
|
Rap guanine nucleotide exchange factor (GEF) 3 |
| chr22_+_19705928 | 2.28 |
ENST00000383045.3
ENST00000438754.2 |
SEPT5
|
septin 5 |
| chr15_-_42749711 | 2.22 |
ENST00000565611.1
ENST00000263805.4 ENST00000565948.1 |
ZNF106
|
zinc finger protein 106 |
| chr12_-_49351303 | 2.22 |
ENST00000256682.4
|
ARF3
|
ADP-ribosylation factor 3 |
| chr3_-_52002403 | 2.19 |
ENST00000490063.1
ENST00000468324.1 ENST00000497653.1 ENST00000484633.1 |
PCBP4
|
poly(rC) binding protein 4 |
| chr11_-_71639670 | 2.17 |
ENST00000533047.1
ENST00000529844.1 |
RP11-849H4.2
|
Putative short transient receptor potential channel 2-like protein |
| chr3_-_10547192 | 2.16 |
ENST00000360273.2
ENST00000343816.4 |
ATP2B2
|
ATPase, Ca++ transporting, plasma membrane 2 |
| chr18_-_53069419 | 2.16 |
ENST00000570177.2
|
TCF4
|
transcription factor 4 |
| chr10_-_72141330 | 2.16 |
ENST00000395011.1
ENST00000395010.1 |
LRRC20
|
leucine rich repeat containing 20 |
| chr19_-_4454081 | 2.15 |
ENST00000591919.1
|
UBXN6
|
UBX domain protein 6 |
| chr6_+_44184653 | 2.15 |
ENST00000573382.2
ENST00000576476.1 |
RP1-302G2.5
|
RP1-302G2.5 |
| chrX_+_54835493 | 2.13 |
ENST00000396224.1
|
MAGED2
|
melanoma antigen family D, 2 |
| chr10_-_116444371 | 2.12 |
ENST00000533213.2
ENST00000369252.4 |
ABLIM1
|
actin binding LIM protein 1 |
| chr3_+_42897512 | 2.09 |
ENST00000493193.1
|
ACKR2
|
atypical chemokine receptor 2 |
| chr12_+_120933859 | 2.08 |
ENST00000242577.6
ENST00000548214.1 ENST00000392508.2 |
DYNLL1
|
dynein, light chain, LC8-type 1 |
| chr17_-_3301704 | 2.06 |
ENST00000322608.2
|
OR1E1
|
olfactory receptor, family 1, subfamily E, member 1 |
| chr13_+_35516390 | 2.04 |
ENST00000540320.1
ENST00000400445.3 ENST00000310336.4 |
NBEA
|
neurobeachin |
| chr12_+_53491220 | 2.04 |
ENST00000548547.1
ENST00000301464.3 |
IGFBP6
|
insulin-like growth factor binding protein 6 |
| chr6_-_112194484 | 2.02 |
ENST00000518295.1
ENST00000484067.2 ENST00000229470.5 ENST00000356013.2 ENST00000368678.4 ENST00000523238.1 ENST00000354650.3 |
FYN
|
FYN oncogene related to SRC, FGR, YES |
| chr20_+_57875658 | 2.02 |
ENST00000371025.3
|
EDN3
|
endothelin 3 |
| chr19_-_4338783 | 1.98 |
ENST00000601482.1
ENST00000600324.1 |
STAP2
|
signal transducing adaptor family member 2 |
| chr6_+_29555683 | 1.96 |
ENST00000383640.2
|
OR2H2
|
olfactory receptor, family 2, subfamily H, member 2 |
| chr3_+_183892635 | 1.96 |
ENST00000427072.1
ENST00000411763.2 ENST00000292807.5 ENST00000448139.1 ENST00000455925.1 |
AP2M1
|
adaptor-related protein complex 2, mu 1 subunit |
| chr19_-_6720686 | 1.95 |
ENST00000245907.6
|
C3
|
complement component 3 |
| chr1_-_226111929 | 1.94 |
ENST00000343818.6
ENST00000432920.2 |
PYCR2
RP4-559A3.7
|
pyrroline-5-carboxylate reductase family, member 2 Uncharacterized protein |
| chr11_+_32112431 | 1.93 |
ENST00000054950.3
|
RCN1
|
reticulocalbin 1, EF-hand calcium binding domain |
| chr11_+_46299199 | 1.91 |
ENST00000529193.1
ENST00000288400.3 |
CREB3L1
|
cAMP responsive element binding protein 3-like 1 |
| chr8_-_141774467 | 1.90 |
ENST00000520151.1
ENST00000519024.1 ENST00000519465.1 |
PTK2
|
protein tyrosine kinase 2 |
| chr19_+_15852203 | 1.89 |
ENST00000305892.1
|
OR10H3
|
olfactory receptor, family 10, subfamily H, member 3 |
| chr9_+_92219919 | 1.83 |
ENST00000252506.6
ENST00000375769.1 |
GADD45G
|
growth arrest and DNA-damage-inducible, gamma |
| chr10_+_7745303 | 1.83 |
ENST00000429820.1
ENST00000379587.4 |
ITIH2
|
inter-alpha-trypsin inhibitor heavy chain 2 |
| chr19_+_15160130 | 1.82 |
ENST00000427043.3
|
CASP14
|
caspase 14, apoptosis-related cysteine peptidase |
| chr17_-_73892992 | 1.82 |
ENST00000540128.1
ENST00000269383.3 |
TRIM65
|
tripartite motif containing 65 |
| chr17_-_3195876 | 1.81 |
ENST00000323404.1
|
OR3A1
|
olfactory receptor, family 3, subfamily A, member 1 |
| chrX_+_100474711 | 1.81 |
ENST00000402866.1
|
DRP2
|
dystrophin related protein 2 |
| chr11_+_117073850 | 1.81 |
ENST00000529622.1
|
TAGLN
|
transgelin |
| chr13_+_88324870 | 1.79 |
ENST00000325089.6
|
SLITRK5
|
SLIT and NTRK-like family, member 5 |
| chr19_-_46285736 | 1.78 |
ENST00000291270.4
ENST00000447742.2 ENST00000354227.5 |
DMPK
|
dystrophia myotonica-protein kinase |
| chr13_+_38923959 | 1.77 |
ENST00000379649.1
ENST00000239878.4 ENST00000437952.1 ENST00000379641.1 |
UFM1
|
ubiquitin-fold modifier 1 |
| chr18_-_52989525 | 1.77 |
ENST00000457482.3
|
TCF4
|
transcription factor 4 |
| chr12_+_120933904 | 1.75 |
ENST00000550178.1
ENST00000550845.1 ENST00000549989.1 ENST00000552870.1 |
DYNLL1
|
dynein, light chain, LC8-type 1 |
| chr2_-_154335300 | 1.75 |
ENST00000325926.3
|
RPRM
|
reprimo, TP53 dependent G2 arrest mediator candidate |
| chr1_+_15272271 | 1.73 |
ENST00000400797.3
|
KAZN
|
kazrin, periplakin interacting protein |
| chr1_+_155051305 | 1.73 |
ENST00000368408.3
|
EFNA3
|
ephrin-A3 |
| chr14_-_75079026 | 1.72 |
ENST00000261978.4
|
LTBP2
|
latent transforming growth factor beta binding protein 2 |
| chr6_+_96463840 | 1.71 |
ENST00000302103.5
|
FUT9
|
fucosyltransferase 9 (alpha (1,3) fucosyltransferase) |
| chr1_-_36022979 | 1.68 |
ENST00000469892.1
ENST00000325722.3 |
KIAA0319L
|
KIAA0319-like |
| chr12_+_101988627 | 1.68 |
ENST00000547405.1
ENST00000452455.2 ENST00000441232.1 ENST00000360610.2 ENST00000392934.3 ENST00000547509.1 ENST00000361685.2 ENST00000549145.1 ENST00000553190.1 |
MYBPC1
|
myosin binding protein C, slow type |
| chr4_-_186733363 | 1.67 |
ENST00000393523.2
ENST00000393528.3 ENST00000449407.2 |
SORBS2
|
sorbin and SH3 domain containing 2 |
| chr20_+_42839722 | 1.67 |
ENST00000442383.1
ENST00000435163.1 |
OSER1-AS1
|
OSER1 antisense RNA 1 (head to head) |
| chr7_+_75931861 | 1.65 |
ENST00000248553.6
|
HSPB1
|
heat shock 27kDa protein 1 |
| chr2_+_11052054 | 1.64 |
ENST00000295082.1
|
KCNF1
|
potassium voltage-gated channel, subfamily F, member 1 |
| chr12_+_56473628 | 1.62 |
ENST00000549282.1
ENST00000549061.1 ENST00000267101.3 |
ERBB3
|
v-erb-b2 avian erythroblastic leukemia viral oncogene homolog 3 |
| chr17_+_11924129 | 1.62 |
ENST00000353533.5
ENST00000415385.3 |
MAP2K4
|
mitogen-activated protein kinase kinase 4 |
| chr9_-_131644306 | 1.60 |
ENST00000302586.3
|
CCBL1
|
cysteine conjugate-beta lyase, cytoplasmic |
| chrX_-_11445856 | 1.57 |
ENST00000380736.1
|
ARHGAP6
|
Rho GTPase activating protein 6 |
| chr4_-_46391805 | 1.56 |
ENST00000540012.1
|
GABRA2
|
gamma-aminobutyric acid (GABA) A receptor, alpha 2 |
| chrX_+_100474906 | 1.54 |
ENST00000541709.1
|
DRP2
|
dystrophin related protein 2 |
| chr12_-_52715179 | 1.52 |
ENST00000293670.3
|
KRT83
|
keratin 83 |
| chr3_+_118905564 | 1.50 |
ENST00000460625.1
|
UPK1B
|
uroplakin 1B |
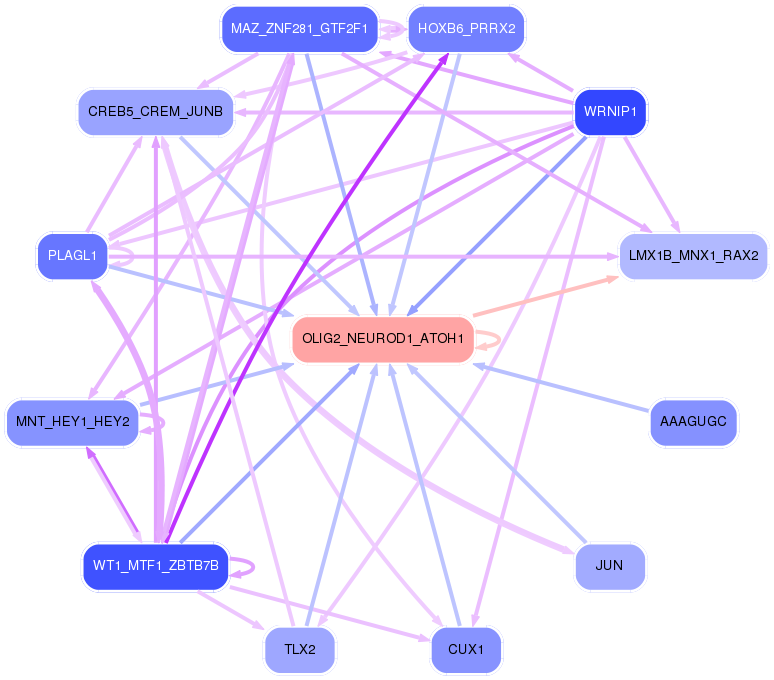
Network of associatons between targets according to the STRING database.

First level regulatory network of OLIG2_NEUROD1_ATOH1
Gene Ontology Analysis
Gene overrepresentation in biological_process category:
| Log-likelihood per target | Total log-likelihood | Term | Description |
|---|---|---|---|
| 12.6 | 50.5 | GO:0018032 | peptide amidation(GO:0001519) protein amidation(GO:0018032) peptide modification(GO:0031179) |
| 8.7 | 26.0 | GO:0036371 | protein localization to M-band(GO:0036309) protein localization to T-tubule(GO:0036371) |
| 6.6 | 19.8 | GO:0035408 | histone H3-T6 phosphorylation(GO:0035408) |
| 6.5 | 19.6 | GO:2000097 | regulation of smooth muscle cell-matrix adhesion(GO:2000097) |
| 4.2 | 12.6 | GO:0042137 | sequestering of neurotransmitter(GO:0042137) |
| 3.8 | 41.7 | GO:0030913 | paranodal junction assembly(GO:0030913) |
| 3.7 | 11.2 | GO:1904647 | response to rotenone(GO:1904647) |
| 3.6 | 21.4 | GO:0061302 | smooth muscle cell-matrix adhesion(GO:0061302) |
| 3.3 | 13.3 | GO:0072660 | positive regulation of cell communication by electrical coupling(GO:0010650) maintenance of protein location in membrane(GO:0072658) maintenance of protein location in plasma membrane(GO:0072660) positive regulation of membrane depolarization during cardiac muscle cell action potential(GO:1900827) |
| 3.2 | 9.6 | GO:0097212 | cadmium ion homeostasis(GO:0055073) lysosomal membrane organization(GO:0097212) negative regulation of hydrogen peroxide catabolic process(GO:2000296) regulation of oxygen metabolic process(GO:2000374) |
| 2.5 | 10.0 | GO:0033123 | positive regulation of cyclic nucleotide catabolic process(GO:0030807) positive regulation of cAMP catabolic process(GO:0030822) positive regulation of purine nucleotide catabolic process(GO:0033123) |
| 2.5 | 4.9 | GO:2000705 | dense core granule biogenesis(GO:0061110) regulation of dense core granule biogenesis(GO:2000705) |
| 1.9 | 5.8 | GO:0021966 | corticospinal neuron axon guidance(GO:0021966) |
| 1.9 | 5.8 | GO:0016185 | synaptic vesicle budding from presynaptic endocytic zone membrane(GO:0016185) |
| 1.6 | 16.4 | GO:0051612 | negative regulation of neurotransmitter uptake(GO:0051581) serotonin uptake(GO:0051610) regulation of serotonin uptake(GO:0051611) negative regulation of serotonin uptake(GO:0051612) |
| 1.6 | 4.7 | GO:0070213 | protein auto-ADP-ribosylation(GO:0070213) |
| 1.4 | 4.3 | GO:0048170 | positive regulation of long-term neuronal synaptic plasticity(GO:0048170) |
| 1.4 | 4.2 | GO:0043314 | negative regulation of neutrophil degranulation(GO:0043314) |
| 1.4 | 5.4 | GO:0044861 | protein transport into plasma membrane raft(GO:0044861) positive regulation of potassium ion import(GO:1903288) |
| 1.3 | 7.9 | GO:0010724 | regulation of definitive erythrocyte differentiation(GO:0010724) |
| 1.2 | 9.9 | GO:0003065 | positive regulation of heart rate by epinephrine(GO:0003065) |
| 1.1 | 24.1 | GO:0019800 | peptide cross-linking via chondroitin 4-sulfate glycosaminoglycan(GO:0019800) |
| 1.1 | 3.2 | GO:1902630 | regulation of membrane hyperpolarization(GO:1902630) |
| 1.0 | 11.2 | GO:0006554 | lysine catabolic process(GO:0006554) |
| 1.0 | 5.9 | GO:1904879 | positive regulation of calcium ion transmembrane transport via high voltage-gated calcium channel(GO:1904879) |
| 1.0 | 2.9 | GO:1902309 | negative regulation of peptidyl-serine dephosphorylation(GO:1902309) |
| 0.9 | 2.6 | GO:0043449 | olfactory learning(GO:0008355) cellular alkene metabolic process(GO:0043449) |
| 0.9 | 9.4 | GO:0006600 | creatine metabolic process(GO:0006600) |
| 0.8 | 9.5 | GO:2001224 | positive regulation of neuron migration(GO:2001224) |
| 0.8 | 3.2 | GO:0070494 | regulation of thrombin receptor signaling pathway(GO:0070494) negative regulation of thrombin receptor signaling pathway(GO:0070495) |
| 0.7 | 2.0 | GO:0001798 | positive regulation of type IIa hypersensitivity(GO:0001798) positive regulation of type II hypersensitivity(GO:0002894) |
| 0.6 | 2.6 | GO:0002884 | regulation of type IV hypersensitivity(GO:0001807) negative regulation of hypersensitivity(GO:0002884) |
| 0.6 | 3.2 | GO:2000638 | regulation of SREBP signaling pathway(GO:2000638) negative regulation of SREBP signaling pathway(GO:2000639) |
| 0.6 | 5.4 | GO:0014052 | regulation of gamma-aminobutyric acid secretion(GO:0014052) |
| 0.6 | 5.1 | GO:0006707 | cholesterol catabolic process(GO:0006707) sterol catabolic process(GO:0016127) |
| 0.6 | 15.8 | GO:0045725 | positive regulation of glycogen biosynthetic process(GO:0045725) |
| 0.5 | 3.8 | GO:0061577 | calcium ion transmembrane transport via high voltage-gated calcium channel(GO:0061577) |
| 0.5 | 4.3 | GO:0007258 | JUN phosphorylation(GO:0007258) |
| 0.5 | 5.2 | GO:2000601 | positive regulation of Arp2/3 complex-mediated actin nucleation(GO:2000601) |
| 0.5 | 4.1 | GO:0021942 | radial glia guided migration of Purkinje cell(GO:0021942) |
| 0.5 | 2.0 | GO:0010961 | cellular magnesium ion homeostasis(GO:0010961) |
| 0.5 | 2.5 | GO:0018101 | protein citrullination(GO:0018101) histone citrullination(GO:0036414) |
| 0.5 | 3.4 | GO:2000795 | trigeminal sensory nucleus development(GO:0021730) principal sensory nucleus of trigeminal nerve development(GO:0021740) negative regulation of epithelial cell proliferation involved in lung morphogenesis(GO:2000795) |
| 0.5 | 1.5 | GO:1904404 | cellular response to vitamin B1(GO:0071301) response to formaldehyde(GO:1904404) |
| 0.5 | 1.4 | GO:0019074 | viral genome packaging(GO:0019072) viral RNA genome packaging(GO:0019074) |
| 0.5 | 3.3 | GO:0033353 | S-adenosylmethionine cycle(GO:0033353) |
| 0.5 | 12.2 | GO:0042753 | positive regulation of circadian rhythm(GO:0042753) |
| 0.4 | 7.1 | GO:0000338 | protein deneddylation(GO:0000338) |
| 0.4 | 8.6 | GO:0060004 | reflex(GO:0060004) |
| 0.4 | 8.5 | GO:0016540 | protein autoprocessing(GO:0016540) |
| 0.4 | 1.7 | GO:0099640 | axo-dendritic protein transport(GO:0099640) |
| 0.4 | 1.6 | GO:2000672 | negative regulation of motor neuron apoptotic process(GO:2000672) |
| 0.4 | 1.2 | GO:0007206 | phospholipase C-activating G-protein coupled glutamate receptor signaling pathway(GO:0007206) regulation of intracellular calcium activated chloride channel activity(GO:1902938) |
| 0.4 | 2.0 | GO:0006311 | meiotic gene conversion(GO:0006311) male meiosis chromosome segregation(GO:0007060) |
| 0.4 | 1.5 | GO:0007525 | somatic muscle development(GO:0007525) |
| 0.4 | 1.1 | GO:0072275 | metanephric glomerulus morphogenesis(GO:0072275) metanephric glomerulus vasculature morphogenesis(GO:0072276) metanephric glomerular capillary formation(GO:0072277) |
| 0.4 | 2.6 | GO:0070779 | D-aspartate transport(GO:0070777) D-aspartate import(GO:0070779) |
| 0.4 | 1.1 | GO:0097498 | endothelial tube lumen extension(GO:0097498) |
| 0.4 | 12.0 | GO:0008045 | motor neuron axon guidance(GO:0008045) |
| 0.4 | 4.7 | GO:0050966 | detection of mechanical stimulus involved in sensory perception of pain(GO:0050966) |
| 0.3 | 3.8 | GO:0035721 | intraciliary retrograde transport(GO:0035721) positive regulation of microtubule motor activity(GO:2000576) regulation of ATP-dependent microtubule motor activity, plus-end-directed(GO:2000580) positive regulation of ATP-dependent microtubule motor activity, plus-end-directed(GO:2000582) |
| 0.3 | 3.5 | GO:0001921 | positive regulation of receptor recycling(GO:0001921) |
| 0.3 | 1.0 | GO:0021938 | ventral midline development(GO:0007418) smoothened signaling pathway involved in regulation of cerebellar granule cell precursor cell proliferation(GO:0021938) |
| 0.3 | 10.5 | GO:0048268 | clathrin coat assembly(GO:0048268) |
| 0.3 | 1.9 | GO:0055129 | proline biosynthetic process(GO:0006561) L-proline biosynthetic process(GO:0055129) |
| 0.3 | 0.9 | GO:0046521 | sphingoid catabolic process(GO:0046521) |
| 0.3 | 6.2 | GO:0070977 | bone maturation(GO:0070977) |
| 0.3 | 11.5 | GO:1901385 | regulation of voltage-gated calcium channel activity(GO:1901385) |
| 0.3 | 5.2 | GO:0021952 | central nervous system projection neuron axonogenesis(GO:0021952) |
| 0.3 | 2.1 | GO:0070294 | renal sodium ion absorption(GO:0070294) |
| 0.3 | 5.7 | GO:0032060 | bleb assembly(GO:0032060) |
| 0.3 | 1.2 | GO:0007538 | primary sex determination(GO:0007538) |
| 0.3 | 1.7 | GO:1905247 | positive regulation of aspartic-type endopeptidase activity involved in amyloid precursor protein catabolic process(GO:1902961) positive regulation of aspartic-type peptidase activity(GO:1905247) |
| 0.3 | 3.7 | GO:0014722 | regulation of skeletal muscle contraction by calcium ion signaling(GO:0014722) |
| 0.3 | 0.8 | GO:1990523 | negative regulation of neuromuscular junction development(GO:1904397) bone regeneration(GO:1990523) |
| 0.3 | 2.0 | GO:0032802 | low-density lipoprotein particle receptor catabolic process(GO:0032802) |
| 0.3 | 1.9 | GO:0016080 | synaptic vesicle targeting(GO:0016080) |
| 0.3 | 11.7 | GO:0043268 | positive regulation of potassium ion transport(GO:0043268) |
| 0.3 | 0.8 | GO:0032224 | positive regulation of synaptic transmission, cholinergic(GO:0032224) |
| 0.3 | 3.0 | GO:0021978 | telencephalon regionalization(GO:0021978) |
| 0.3 | 8.3 | GO:1901685 | glutathione derivative metabolic process(GO:1901685) glutathione derivative biosynthetic process(GO:1901687) |
| 0.3 | 16.4 | GO:0051489 | regulation of filopodium assembly(GO:0051489) |
| 0.3 | 1.3 | GO:2000807 | regulation of synaptic vesicle clustering(GO:2000807) |
| 0.3 | 6.3 | GO:0003301 | physiological muscle hypertrophy(GO:0003298) physiological cardiac muscle hypertrophy(GO:0003301) cell growth involved in cardiac muscle cell development(GO:0061049) |
| 0.3 | 1.8 | GO:1990564 | protein polyufmylation(GO:1990564) protein K69-linked ufmylation(GO:1990592) |
| 0.2 | 5.9 | GO:0033599 | regulation of mammary gland epithelial cell proliferation(GO:0033599) |
| 0.2 | 0.5 | GO:0044333 | Wnt signaling pathway involved in digestive tract morphogenesis(GO:0044333) |
| 0.2 | 1.9 | GO:0070278 | extracellular matrix constituent secretion(GO:0070278) |
| 0.2 | 1.9 | GO:0038007 | netrin-activated signaling pathway(GO:0038007) |
| 0.2 | 11.7 | GO:0000381 | regulation of alternative mRNA splicing, via spliceosome(GO:0000381) |
| 0.2 | 1.3 | GO:0018095 | protein polyglutamylation(GO:0018095) |
| 0.2 | 1.7 | GO:0032510 | endosome to lysosome transport via multivesicular body sorting pathway(GO:0032510) |
| 0.2 | 5.6 | GO:0048665 | neuron fate specification(GO:0048665) |
| 0.2 | 2.5 | GO:0002091 | negative regulation of receptor internalization(GO:0002091) |
| 0.2 | 2.9 | GO:0071688 | striated muscle myosin thick filament assembly(GO:0071688) |
| 0.2 | 0.8 | GO:0038018 | Wnt receptor catabolic process(GO:0038018) |
| 0.2 | 3.8 | GO:0008038 | neuron recognition(GO:0008038) |
| 0.2 | 4.6 | GO:0010719 | negative regulation of epithelial to mesenchymal transition(GO:0010719) |
| 0.2 | 0.9 | GO:0036115 | fatty-acyl-CoA catabolic process(GO:0036115) malonyl-CoA metabolic process(GO:2001293) |
| 0.2 | 1.7 | GO:0006685 | sphingomyelin catabolic process(GO:0006685) |
| 0.2 | 1.4 | GO:2000189 | positive regulation of cholesterol homeostasis(GO:2000189) |
| 0.2 | 0.7 | GO:0036269 | swimming behavior(GO:0036269) |
| 0.2 | 0.7 | GO:0097325 | melanocyte proliferation(GO:0097325) |
| 0.2 | 0.8 | GO:0061739 | protein lipidation involved in autophagosome assembly(GO:0061739) |
| 0.2 | 0.8 | GO:0009624 | response to nematode(GO:0009624) |
| 0.2 | 7.9 | GO:0050911 | detection of chemical stimulus involved in sensory perception of smell(GO:0050911) |
| 0.1 | 0.7 | GO:0051510 | regulation of unidimensional cell growth(GO:0051510) negative regulation of unidimensional cell growth(GO:0051511) establishment of cell polarity regulating cell shape(GO:0071964) regulation of establishment or maintenance of cell polarity regulating cell shape(GO:2000769) positive regulation of establishment or maintenance of cell polarity regulating cell shape(GO:2000771) regulation of establishment of cell polarity regulating cell shape(GO:2000782) positive regulation of establishment of cell polarity regulating cell shape(GO:2000784) regulation of barbed-end actin filament capping(GO:2000812) positive regulation of barbed-end actin filament capping(GO:2000814) |
| 0.1 | 2.7 | GO:2000052 | positive regulation of non-canonical Wnt signaling pathway(GO:2000052) |
| 0.1 | 3.5 | GO:0035338 | long-chain fatty-acyl-CoA biosynthetic process(GO:0035338) |
| 0.1 | 0.6 | GO:0002361 | CD4-positive, CD25-positive, alpha-beta regulatory T cell differentiation(GO:0002361) |
| 0.1 | 0.3 | GO:0071313 | cellular response to caffeine(GO:0071313) cellular response to purine-containing compound(GO:0071415) |
| 0.1 | 1.3 | GO:0019509 | L-methionine biosynthetic process from methylthioadenosine(GO:0019509) |
| 0.1 | 1.7 | GO:0019317 | fucose catabolic process(GO:0019317) L-fucose metabolic process(GO:0042354) L-fucose catabolic process(GO:0042355) |
| 0.1 | 5.2 | GO:0043278 | response to isoquinoline alkaloid(GO:0014072) response to morphine(GO:0043278) |
| 0.1 | 6.5 | GO:0048168 | regulation of neuronal synaptic plasticity(GO:0048168) |
| 0.1 | 11.7 | GO:0030516 | regulation of axon extension(GO:0030516) |
| 0.1 | 3.3 | GO:0010765 | positive regulation of sodium ion transport(GO:0010765) |
| 0.1 | 3.0 | GO:0061003 | positive regulation of dendritic spine morphogenesis(GO:0061003) |
| 0.1 | 1.6 | GO:0070886 | positive regulation of calcineurin-NFAT signaling cascade(GO:0070886) |
| 0.1 | 0.9 | GO:0035331 | negative regulation of hippo signaling(GO:0035331) |
| 0.1 | 0.4 | GO:0006420 | arginyl-tRNA aminoacylation(GO:0006420) |
| 0.1 | 1.3 | GO:0010666 | positive regulation of striated muscle cell apoptotic process(GO:0010663) positive regulation of cardiac muscle cell apoptotic process(GO:0010666) |
| 0.1 | 0.3 | GO:2000609 | thyroid-stimulating hormone secretion(GO:0070460) metanephric comma-shaped body morphogenesis(GO:0072278) regulation of thyroid hormone generation(GO:2000609) positive regulation of thyroid hormone generation(GO:2000611) regulation of thyroid-stimulating hormone secretion(GO:2000612) |
| 0.1 | 0.7 | GO:0060394 | negative regulation of pathway-restricted SMAD protein phosphorylation(GO:0060394) |
| 0.1 | 1.7 | GO:0007179 | transforming growth factor beta receptor signaling pathway(GO:0007179) |
| 0.1 | 0.3 | GO:0006072 | glycerol-3-phosphate metabolic process(GO:0006072) |
| 0.1 | 0.3 | GO:0060454 | detection of temperature stimulus involved in thermoception(GO:0050960) detection of chemical stimulus involved in sensory perception of pain(GO:0050968) positive regulation of gastric acid secretion(GO:0060454) response to capsazepine(GO:1901594) |
| 0.1 | 1.3 | GO:0048194 | Golgi vesicle budding(GO:0048194) |
| 0.1 | 1.8 | GO:0030212 | hyaluronan metabolic process(GO:0030212) |
| 0.1 | 0.6 | GO:0006287 | base-excision repair, gap-filling(GO:0006287) |
| 0.1 | 3.0 | GO:2000785 | regulation of autophagosome assembly(GO:2000785) |
| 0.1 | 0.6 | GO:0014043 | negative regulation of neuron maturation(GO:0014043) |
| 0.1 | 2.0 | GO:0007625 | grooming behavior(GO:0007625) |
| 0.1 | 3.7 | GO:0010039 | response to iron ion(GO:0010039) |
| 0.1 | 0.5 | GO:1900264 | regulation of DNA-directed DNA polymerase activity(GO:1900262) positive regulation of DNA-directed DNA polymerase activity(GO:1900264) |
| 0.1 | 2.9 | GO:0097352 | autophagosome maturation(GO:0097352) |
| 0.1 | 0.3 | GO:0035803 | egg coat formation(GO:0035803) |
| 0.1 | 1.8 | GO:0043567 | regulation of insulin-like growth factor receptor signaling pathway(GO:0043567) |
| 0.1 | 1.3 | GO:0048535 | lymph node development(GO:0048535) |
| 0.1 | 0.9 | GO:0060997 | dendritic spine morphogenesis(GO:0060997) |
| 0.1 | 6.9 | GO:0043647 | inositol phosphate metabolic process(GO:0043647) |
| 0.1 | 3.6 | GO:0007157 | heterophilic cell-cell adhesion via plasma membrane cell adhesion molecules(GO:0007157) |
| 0.1 | 1.6 | GO:0051895 | negative regulation of focal adhesion assembly(GO:0051895) |
| 0.1 | 1.1 | GO:0033622 | integrin activation(GO:0033622) |
| 0.1 | 1.9 | GO:0098780 | response to mitochondrial depolarisation(GO:0098780) |
| 0.1 | 0.3 | GO:0009137 | purine nucleoside diphosphate catabolic process(GO:0009137) purine ribonucleoside diphosphate catabolic process(GO:0009181) |
| 0.1 | 0.5 | GO:0048050 | post-embryonic eye morphogenesis(GO:0048050) |
| 0.1 | 1.4 | GO:0007216 | G-protein coupled glutamate receptor signaling pathway(GO:0007216) |
| 0.1 | 0.6 | GO:0045329 | carnitine biosynthetic process(GO:0045329) |
| 0.1 | 1.1 | GO:0033234 | negative regulation of protein sumoylation(GO:0033234) |
| 0.1 | 1.6 | GO:1902186 | regulation of viral release from host cell(GO:1902186) |
| 0.1 | 0.5 | GO:0006013 | mannose metabolic process(GO:0006013) |
| 0.1 | 0.7 | GO:0046007 | negative regulation of activated T cell proliferation(GO:0046007) |
| 0.1 | 8.3 | GO:0006261 | DNA-dependent DNA replication(GO:0006261) |
| 0.1 | 0.4 | GO:0019375 | galactosylceramide biosynthetic process(GO:0006682) galactolipid biosynthetic process(GO:0019375) |
| 0.0 | 2.9 | GO:0019933 | cAMP-mediated signaling(GO:0019933) |
| 0.0 | 1.7 | GO:0097435 | fibril organization(GO:0097435) |
| 0.0 | 4.3 | GO:1903779 | regulation of cardiac conduction(GO:1903779) |
| 0.0 | 0.5 | GO:0010886 | positive regulation of cholesterol storage(GO:0010886) |
| 0.0 | 0.6 | GO:0051764 | actin crosslink formation(GO:0051764) |
| 0.0 | 0.7 | GO:1904152 | regulation of retrograde protein transport, ER to cytosol(GO:1904152) |
| 0.0 | 1.4 | GO:0032456 | endocytic recycling(GO:0032456) |
| 0.0 | 0.8 | GO:0045662 | negative regulation of myoblast differentiation(GO:0045662) |
| 0.0 | 1.0 | GO:1903861 | regulation of dendrite extension(GO:1903859) positive regulation of dendrite extension(GO:1903861) |
| 0.0 | 4.8 | GO:0070268 | cornification(GO:0070268) |
| 0.0 | 0.2 | GO:1904588 | cellular response to glycoprotein(GO:1904588) cellular response to thyrotropin-releasing hormone(GO:1905229) |
| 0.0 | 0.8 | GO:1900153 | regulation of nuclear-transcribed mRNA catabolic process, deadenylation-dependent decay(GO:1900151) positive regulation of nuclear-transcribed mRNA catabolic process, deadenylation-dependent decay(GO:1900153) |
| 0.0 | 0.2 | GO:0010644 | cell communication by electrical coupling(GO:0010644) |
| 0.0 | 0.2 | GO:0009804 | coumarin metabolic process(GO:0009804) |
| 0.0 | 1.7 | GO:0010501 | RNA secondary structure unwinding(GO:0010501) |
| 0.0 | 0.4 | GO:0071447 | cellular response to hydroperoxide(GO:0071447) |
| 0.0 | 0.1 | GO:1902723 | negative regulation of skeletal muscle cell proliferation(GO:0014859) negative regulation of skeletal muscle satellite cell proliferation(GO:1902723) |
| 0.0 | 2.0 | GO:0042531 | positive regulation of tyrosine phosphorylation of STAT protein(GO:0042531) |
| 0.0 | 1.2 | GO:0014047 | glutamate secretion(GO:0014047) |
| 0.0 | 0.1 | GO:0005986 | sucrose biosynthetic process(GO:0005986) |
| 0.0 | 0.7 | GO:0021854 | hypothalamus development(GO:0021854) |
| 0.0 | 0.7 | GO:0021542 | dentate gyrus development(GO:0021542) |
| 0.0 | 2.2 | GO:0006977 | DNA damage response, signal transduction by p53 class mediator resulting in cell cycle arrest(GO:0006977) |
| 0.0 | 0.4 | GO:0035635 | entry of bacterium into host cell(GO:0035635) |
| 0.0 | 0.4 | GO:0071985 | multivesicular body sorting pathway(GO:0071985) |
| 0.0 | 0.9 | GO:0006309 | apoptotic DNA fragmentation(GO:0006309) |
| 0.0 | 0.8 | GO:0000470 | maturation of LSU-rRNA(GO:0000470) |
| 0.0 | 2.1 | GO:0070098 | chemokine-mediated signaling pathway(GO:0070098) |
| 0.0 | 0.2 | GO:0003417 | growth plate cartilage development(GO:0003417) |
| 0.0 | 0.9 | GO:0038096 | Fc receptor mediated stimulatory signaling pathway(GO:0002431) immune response-regulating cell surface receptor signaling pathway involved in phagocytosis(GO:0002433) Fc-gamma receptor signaling pathway involved in phagocytosis(GO:0038096) |
| 0.0 | 0.6 | GO:0014898 | muscle hypertrophy in response to stress(GO:0003299) cardiac muscle adaptation(GO:0014887) cardiac muscle hypertrophy in response to stress(GO:0014898) |
| 0.0 | 0.2 | GO:0007175 | negative regulation of epidermal growth factor-activated receptor activity(GO:0007175) |
| 0.0 | 0.5 | GO:0046688 | response to copper ion(GO:0046688) |
| 0.0 | 0.3 | GO:0043923 | positive regulation by host of viral transcription(GO:0043923) |
| 0.0 | 0.5 | GO:0000185 | activation of MAPKKK activity(GO:0000185) |
| 0.0 | 1.1 | GO:0050829 | defense response to Gram-negative bacterium(GO:0050829) |
| 0.0 | 0.8 | GO:0046928 | regulation of neurotransmitter secretion(GO:0046928) |
| 0.0 | 0.4 | GO:0010508 | positive regulation of autophagy(GO:0010508) |
| 0.0 | 0.3 | GO:0050962 | detection of light stimulus involved in visual perception(GO:0050908) detection of light stimulus involved in sensory perception(GO:0050962) |
| 0.0 | 0.2 | GO:0032264 | IMP salvage(GO:0032264) |
| 0.0 | 0.5 | GO:0043011 | myeloid dendritic cell differentiation(GO:0043011) |
| 0.0 | 0.3 | GO:0046847 | filopodium assembly(GO:0046847) |
| 0.0 | 0.7 | GO:0051693 | actin filament capping(GO:0051693) |
| 0.0 | 0.0 | GO:1902414 | protein localization to cell junction(GO:1902414) |
| 0.0 | 1.3 | GO:0021987 | cerebral cortex development(GO:0021987) |
| 0.0 | 0.1 | GO:0046903 | secretion(GO:0046903) |
| 0.0 | 0.7 | GO:0051973 | positive regulation of telomerase activity(GO:0051973) |
| 0.0 | 0.5 | GO:0045599 | negative regulation of fat cell differentiation(GO:0045599) |
| 0.0 | 0.1 | GO:0060017 | parathyroid gland development(GO:0060017) |
| 0.0 | 3.7 | GO:0006367 | transcription initiation from RNA polymerase II promoter(GO:0006367) |
| 0.0 | 0.6 | GO:0007214 | gamma-aminobutyric acid signaling pathway(GO:0007214) |
| 0.0 | 0.4 | GO:0042572 | retinol metabolic process(GO:0042572) |
| 0.0 | 0.5 | GO:0010923 | negative regulation of phosphatase activity(GO:0010923) |
| 0.0 | 0.7 | GO:0030574 | collagen catabolic process(GO:0030574) |
Gene overrepresentation in cellular_component category:
| Log-likelihood per target | Total log-likelihood | Term | Description |
|---|---|---|---|
| 2.9 | 14.3 | GO:0005899 | insulin receptor complex(GO:0005899) |
| 1.6 | 12.6 | GO:0060199 | clathrin-sculpted glutamate transport vesicle(GO:0060199) clathrin-sculpted glutamate transport vesicle membrane(GO:0060203) |
| 1.3 | 41.1 | GO:0031092 | platelet alpha granule membrane(GO:0031092) |
| 1.2 | 5.8 | GO:0098843 | postsynaptic endocytic zone(GO:0098843) |
| 1.0 | 9.6 | GO:0097449 | astrocyte projection(GO:0097449) |
| 0.9 | 16.0 | GO:0043194 | axon initial segment(GO:0043194) |
| 0.8 | 9.9 | GO:1990454 | L-type voltage-gated calcium channel complex(GO:1990454) |
| 0.7 | 3.7 | GO:0005602 | complement component C1 complex(GO:0005602) |
| 0.7 | 8.2 | GO:0030285 | integral component of synaptic vesicle membrane(GO:0030285) intrinsic component of synaptic vesicle membrane(GO:0098563) |
| 0.6 | 4.9 | GO:0042583 | chromaffin granule(GO:0042583) |
| 0.6 | 12.2 | GO:0044295 | axonal growth cone(GO:0044295) |
| 0.5 | 25.2 | GO:0043034 | costamere(GO:0043034) |
| 0.5 | 11.1 | GO:0032585 | multivesicular body membrane(GO:0032585) |
| 0.5 | 3.2 | GO:1990452 | Parkin-FBXW7-Cul1 ubiquitin ligase complex(GO:1990452) |
| 0.4 | 9.5 | GO:0097440 | apical dendrite(GO:0097440) |
| 0.4 | 8.2 | GO:0032433 | filopodium tip(GO:0032433) |
| 0.4 | 2.6 | GO:0098839 | postsynaptic density membrane(GO:0098839) |
| 0.4 | 5.8 | GO:0001518 | voltage-gated sodium channel complex(GO:0001518) |
| 0.4 | 6.9 | GO:0032059 | bleb(GO:0032059) |
| 0.4 | 2.0 | GO:0000801 | central element(GO:0000801) |
| 0.4 | 4.3 | GO:0060077 | inhibitory synapse(GO:0060077) |
| 0.4 | 57.5 | GO:0043204 | perikaryon(GO:0043204) |
| 0.4 | 1.4 | GO:1990745 | EARP complex(GO:1990745) |
| 0.3 | 3.4 | GO:0044300 | cerebellar mossy fiber(GO:0044300) |
| 0.3 | 1.3 | GO:1990604 | IRE1-TRAF2-ASK1 complex(GO:1990604) |
| 0.3 | 9.4 | GO:0043218 | compact myelin(GO:0043218) |
| 0.3 | 1.9 | GO:1990316 | ATG1/ULK1 kinase complex(GO:1990316) |
| 0.3 | 11.2 | GO:0005891 | voltage-gated calcium channel complex(GO:0005891) |
| 0.3 | 5.4 | GO:0005890 | sodium:potassium-exchanging ATPase complex(GO:0005890) |
| 0.3 | 4.3 | GO:0097431 | mitotic spindle pole(GO:0097431) |
| 0.2 | 10.8 | GO:1904115 | axon cytoplasm(GO:1904115) |
| 0.2 | 7.8 | GO:0031258 | lamellipodium membrane(GO:0031258) |
| 0.2 | 2.0 | GO:0036454 | insulin-like growth factor binding protein complex(GO:0016942) growth factor complex(GO:0036454) |
| 0.2 | 10.3 | GO:0008180 | COP9 signalosome(GO:0008180) |
| 0.2 | 8.5 | GO:0019005 | SCF ubiquitin ligase complex(GO:0019005) |
| 0.2 | 9.3 | GO:0031907 | peroxisomal matrix(GO:0005782) microbody lumen(GO:0031907) |
| 0.1 | 10.2 | GO:0005902 | microvillus(GO:0005902) |
| 0.1 | 0.8 | GO:0070545 | PeBoW complex(GO:0070545) |
| 0.1 | 2.0 | GO:0030914 | STAGA complex(GO:0030914) |
| 0.1 | 0.8 | GO:0016461 | unconventional myosin complex(GO:0016461) |
| 0.1 | 3.3 | GO:0005640 | nuclear outer membrane(GO:0005640) |
| 0.1 | 0.6 | GO:0097512 | cardiac myofibril(GO:0097512) |
| 0.1 | 2.0 | GO:0036020 | endolysosome membrane(GO:0036020) |
| 0.1 | 2.7 | GO:0032982 | myosin filament(GO:0032982) |
| 0.1 | 5.2 | GO:0005834 | heterotrimeric G-protein complex(GO:0005834) |
| 0.1 | 0.8 | GO:0031527 | filopodium membrane(GO:0031527) |
| 0.1 | 2.8 | GO:0005720 | nuclear heterochromatin(GO:0005720) |
| 0.1 | 1.8 | GO:0090665 | dystrophin-associated glycoprotein complex(GO:0016010) glycoprotein complex(GO:0090665) |
| 0.1 | 1.3 | GO:0031254 | uropod(GO:0001931) cell trailing edge(GO:0031254) |
| 0.1 | 0.7 | GO:0008091 | spectrin(GO:0008091) |
| 0.1 | 3.6 | GO:0005913 | cell-cell adherens junction(GO:0005913) |
| 0.1 | 3.5 | GO:0043198 | dendritic shaft(GO:0043198) |
| 0.1 | 0.5 | GO:0031390 | Ctf18 RFC-like complex(GO:0031390) |
| 0.1 | 1.1 | GO:0005751 | mitochondrial respiratory chain complex IV(GO:0005751) |
| 0.1 | 0.5 | GO:0045261 | mitochondrial proton-transporting ATP synthase complex, catalytic core F(1)(GO:0000275) proton-transporting ATP synthase complex, catalytic core F(1)(GO:0045261) |
| 0.1 | 21.5 | GO:0031965 | nuclear membrane(GO:0031965) |
| 0.1 | 12.0 | GO:0030027 | lamellipodium(GO:0030027) |
| 0.1 | 1.4 | GO:0031091 | platelet alpha granule(GO:0031091) platelet alpha granule lumen(GO:0031093) |
| 0.1 | 4.9 | GO:0005758 | mitochondrial intermembrane space(GO:0005758) |
| 0.1 | 0.4 | GO:0005862 | muscle thin filament tropomyosin(GO:0005862) |
| 0.1 | 10.1 | GO:0022626 | cytosolic ribosome(GO:0022626) |
| 0.1 | 5.3 | GO:0005776 | autophagosome(GO:0005776) |
| 0.1 | 7.2 | GO:0001650 | fibrillar center(GO:0001650) |
| 0.1 | 0.8 | GO:0042734 | presynaptic membrane(GO:0042734) |
| 0.0 | 1.4 | GO:0030057 | desmosome(GO:0030057) |
| 0.0 | 7.1 | GO:0031225 | anchored component of membrane(GO:0031225) |
| 0.0 | 1.6 | GO:0005884 | actin filament(GO:0005884) |
| 0.0 | 10.1 | GO:0060076 | excitatory synapse(GO:0060076) |
| 0.0 | 0.3 | GO:0032591 | dendritic spine membrane(GO:0032591) |
| 0.0 | 18.2 | GO:0005578 | proteinaceous extracellular matrix(GO:0005578) |
| 0.0 | 1.2 | GO:0048786 | presynaptic active zone(GO:0048786) |
| 0.0 | 2.3 | GO:0043195 | terminal bouton(GO:0043195) |
| 0.0 | 8.3 | GO:0005802 | trans-Golgi network(GO:0005802) |
| 0.0 | 1.6 | GO:0016328 | lateral plasma membrane(GO:0016328) |
| 0.0 | 1.9 | GO:0034705 | voltage-gated potassium channel complex(GO:0008076) potassium channel complex(GO:0034705) |
| 0.0 | 5.3 | GO:0001726 | ruffle(GO:0001726) |
| 0.0 | 8.4 | GO:0032993 | protein-DNA complex(GO:0032993) |
| 0.0 | 0.2 | GO:0017119 | Golgi transport complex(GO:0017119) |
| 0.0 | 0.4 | GO:0051233 | spindle midzone(GO:0051233) |
| 0.0 | 1.0 | GO:0097542 | ciliary tip(GO:0097542) |
| 0.0 | 12.9 | GO:0005874 | microtubule(GO:0005874) |
| 0.0 | 0.3 | GO:0033588 | Elongator holoenzyme complex(GO:0033588) |
| 0.0 | 7.2 | GO:0098857 | membrane raft(GO:0045121) membrane microdomain(GO:0098857) |
| 0.0 | 1.2 | GO:0030666 | endocytic vesicle membrane(GO:0030666) |
| 0.0 | 0.6 | GO:0005796 | Golgi lumen(GO:0005796) |
| 0.0 | 1.1 | GO:0031904 | endosome lumen(GO:0031904) |
| 0.0 | 0.5 | GO:0030673 | axolemma(GO:0030673) |
| 0.0 | 7.5 | GO:0005925 | focal adhesion(GO:0005925) |
| 0.0 | 2.8 | GO:0031901 | early endosome membrane(GO:0031901) |
| 0.0 | 1.7 | GO:0032580 | Golgi cisterna membrane(GO:0032580) |
| 0.0 | 0.5 | GO:0034362 | low-density lipoprotein particle(GO:0034362) |
| 0.0 | 2.9 | GO:0043209 | myelin sheath(GO:0043209) |
| 0.0 | 1.1 | GO:0005811 | lipid particle(GO:0005811) |
| 0.0 | 6.6 | GO:0048471 | perinuclear region of cytoplasm(GO:0048471) |
| 0.0 | 0.2 | GO:0030008 | TRAPP complex(GO:0030008) |
| 0.0 | 1.7 | GO:0035578 | azurophil granule lumen(GO:0035578) |
| 0.0 | 3.3 | GO:0016324 | apical plasma membrane(GO:0016324) |
| 0.0 | 0.0 | GO:0031466 | Cul5-RING ubiquitin ligase complex(GO:0031466) |
| 0.0 | 0.8 | GO:0000922 | spindle pole(GO:0000922) |
| 0.0 | 0.2 | GO:0031430 | M band(GO:0031430) |
Gene overrepresentation in molecular_function category:
| Log-likelihood per target | Total log-likelihood | Term | Description |
|---|---|---|---|
| 12.6 | 50.5 | GO:0004598 | peptidylglycine monooxygenase activity(GO:0004504) peptidylamidoglycolate lyase activity(GO:0004598) |
| 6.6 | 19.8 | GO:0035403 | histone kinase activity (H3-T6 specific)(GO:0035403) |
| 4.3 | 21.4 | GO:0038062 | protein tyrosine kinase collagen receptor activity(GO:0038062) |
| 3.3 | 9.8 | GO:0004157 | dihydropyrimidinase activity(GO:0004157) |
| 3.1 | 12.6 | GO:0015319 | sodium:inorganic phosphate symporter activity(GO:0015319) |
| 2.8 | 11.2 | GO:0016639 | oxidoreductase activity, acting on the CH-NH2 group of donors, NAD or NADP as acceptor(GO:0016639) |
| 1.9 | 5.8 | GO:0086062 | voltage-gated sodium channel activity involved in Purkinje myocyte action potential(GO:0086062) |
| 1.6 | 40.4 | GO:0016805 | dipeptidase activity(GO:0016805) |
| 1.4 | 12.6 | GO:0032051 | clathrin light chain binding(GO:0032051) |
| 1.1 | 6.7 | GO:0008440 | inositol-1,4,5-trisphosphate 3-kinase activity(GO:0008440) |
| 1.1 | 22.2 | GO:0008331 | high voltage-gated calcium channel activity(GO:0008331) |
| 1.1 | 4.3 | GO:0005105 | type 1 fibroblast growth factor receptor binding(GO:0005105) |
| 1.0 | 7.8 | GO:0031802 | type 5 metabotropic glutamate receptor binding(GO:0031802) |
| 1.0 | 1.9 | GO:0035497 | cAMP response element binding(GO:0035497) |
| 0.9 | 4.6 | GO:0070097 | delta-catenin binding(GO:0070097) |
| 0.9 | 8.2 | GO:0060002 | plus-end directed microfilament motor activity(GO:0060002) |
| 0.9 | 2.6 | GO:0004514 | nicotinate-nucleotide diphosphorylase (carboxylating) activity(GO:0004514) |
| 0.8 | 37.2 | GO:0030507 | spectrin binding(GO:0030507) |
| 0.8 | 10.0 | GO:0017034 | Rap guanyl-nucleotide exchange factor activity(GO:0017034) |
| 0.7 | 9.6 | GO:0001011 | transcription factor activity, sequence-specific DNA binding, RNA polymerase recruiting(GO:0001011) transcription factor activity, TFIIB-class binding(GO:0001087) |
| 0.7 | 18.3 | GO:0008191 | metalloendopeptidase inhibitor activity(GO:0008191) |
| 0.7 | 9.5 | GO:0046870 | cadmium ion binding(GO:0046870) |
| 0.6 | 6.2 | GO:0005007 | fibroblast growth factor-activated receptor activity(GO:0005007) |
| 0.6 | 3.3 | GO:0016802 | adenosylhomocysteinase activity(GO:0004013) trialkylsulfonium hydrolase activity(GO:0016802) |
| 0.6 | 1.7 | GO:0008426 | protein kinase C inhibitor activity(GO:0008426) |
| 0.5 | 4.2 | GO:0004111 | creatine kinase activity(GO:0004111) |
| 0.5 | 2.5 | GO:0004668 | protein-arginine deiminase activity(GO:0004668) |
| 0.5 | 1.5 | GO:0061663 | NEDD8 ligase activity(GO:0061663) |
| 0.5 | 1.9 | GO:0004735 | pyrroline-5-carboxylate reductase activity(GO:0004735) |
| 0.5 | 5.2 | GO:0051429 | corticotropin-releasing hormone receptor binding(GO:0051429) corticotropin-releasing hormone receptor 1 binding(GO:0051430) |
| 0.4 | 2.0 | GO:0031708 | endothelin B receptor binding(GO:0031708) |
| 0.4 | 3.2 | GO:0050816 | phosphothreonine binding(GO:0050816) |
| 0.4 | 5.4 | GO:0017017 | MAP kinase tyrosine/serine/threonine phosphatase activity(GO:0017017) |
| 0.4 | 1.1 | GO:0005017 | platelet-derived growth factor-activated receptor activity(GO:0005017) |
| 0.4 | 2.6 | GO:0015501 | glutamate:sodium symporter activity(GO:0015501) |
| 0.4 | 6.2 | GO:0008432 | JUN kinase binding(GO:0008432) |
| 0.4 | 19.6 | GO:0015485 | cholesterol binding(GO:0015485) |
| 0.3 | 5.4 | GO:0005391 | sodium:potassium-exchanging ATPase activity(GO:0005391) |
| 0.3 | 11.7 | GO:0070182 | DNA polymerase binding(GO:0070182) |
| 0.3 | 2.6 | GO:0099529 | neurotransmitter receptor activity involved in regulation of postsynaptic membrane potential(GO:0099529) transmitter-gated ion channel activity involved in regulation of postsynaptic membrane potential(GO:1904315) |
| 0.3 | 7.4 | GO:0008093 | cytoskeletal adaptor activity(GO:0008093) |
| 0.3 | 14.1 | GO:0046875 | ephrin receptor binding(GO:0046875) |
| 0.3 | 15.2 | GO:0005158 | insulin receptor binding(GO:0005158) |
| 0.3 | 2.8 | GO:0022851 | GABA-gated chloride ion channel activity(GO:0022851) |
| 0.3 | 10.1 | GO:0017091 | AU-rich element binding(GO:0017091) |
| 0.3 | 0.8 | GO:0070006 | metalloaminopeptidase activity(GO:0070006) |
| 0.3 | 0.8 | GO:0042015 | interleukin-20 binding(GO:0042015) |
| 0.3 | 1.3 | GO:0070740 | tubulin-glutamic acid ligase activity(GO:0070740) |
| 0.3 | 3.5 | GO:0031957 | very long-chain fatty acid-CoA ligase activity(GO:0031957) |
| 0.2 | 1.2 | GO:0099583 | postsynaptic neurotransmitter receptor activity(GO:0098960) neurotransmitter receptor activity involved in regulation of postsynaptic cytosolic calcium ion concentration(GO:0099583) |
| 0.2 | 3.8 | GO:0045505 | dynein intermediate chain binding(GO:0045505) |
| 0.2 | 11.2 | GO:0019894 | kinesin binding(GO:0019894) |
| 0.2 | 1.1 | GO:0004771 | sterol esterase activity(GO:0004771) |
| 0.2 | 0.9 | GO:0003680 | AT DNA binding(GO:0003680) |
| 0.2 | 3.2 | GO:0008140 | cAMP response element binding protein binding(GO:0008140) |
| 0.2 | 1.7 | GO:0046920 | alpha-(1->3)-fucosyltransferase activity(GO:0046920) |
| 0.2 | 5.3 | GO:0016769 | transferase activity, transferring nitrogenous groups(GO:0016769) |
| 0.2 | 36.5 | GO:0005178 | integrin binding(GO:0005178) |
| 0.2 | 2.7 | GO:0031432 | titin binding(GO:0031432) |
| 0.2 | 2.0 | GO:0031995 | insulin-like growth factor II binding(GO:0031995) |
| 0.2 | 1.7 | GO:0031435 | mitogen-activated protein kinase kinase kinase binding(GO:0031435) |
| 0.2 | 4.8 | GO:0032266 | phosphatidylinositol-3-phosphate binding(GO:0032266) |
| 0.2 | 2.1 | GO:0019957 | C-C chemokine binding(GO:0019957) |
| 0.2 | 1.7 | GO:0004767 | sphingomyelin phosphodiesterase activity(GO:0004767) |
| 0.2 | 7.9 | GO:0004364 | glutathione transferase activity(GO:0004364) |
| 0.2 | 1.6 | GO:0038132 | neuregulin binding(GO:0038132) |
| 0.2 | 25.3 | GO:0044325 | ion channel binding(GO:0044325) |
| 0.2 | 1.3 | GO:0070273 | phosphatidylinositol-4-phosphate binding(GO:0070273) |
| 0.2 | 7.9 | GO:0004984 | olfactory receptor activity(GO:0004984) |
| 0.2 | 0.6 | GO:0008336 | gamma-butyrobetaine dioxygenase activity(GO:0008336) |
| 0.2 | 0.9 | GO:0017050 | sphinganine kinase activity(GO:0008481) D-erythro-sphingosine kinase activity(GO:0017050) |
| 0.2 | 2.2 | GO:0042043 | neurexin family protein binding(GO:0042043) |
| 0.1 | 2.7 | GO:1905030 | voltage-gated sodium channel activity(GO:0005248) voltage-gated ion channel activity involved in regulation of postsynaptic membrane potential(GO:1905030) |
| 0.1 | 3.8 | GO:0017075 | syntaxin-1 binding(GO:0017075) |
| 0.1 | 1.4 | GO:0004075 | biotin carboxylase activity(GO:0004075) biotin binding(GO:0009374) |
| 0.1 | 0.4 | GO:0047275 | glucosaminylgalactosylglucosylceramide beta-galactosyltransferase activity(GO:0047275) |
| 0.1 | 9.0 | GO:0048365 | Rac GTPase binding(GO:0048365) |
| 0.1 | 0.7 | GO:0035256 | G-protein coupled glutamate receptor binding(GO:0035256) |
| 0.1 | 3.8 | GO:0005388 | calcium-transporting ATPase activity(GO:0005388) |
| 0.1 | 0.4 | GO:0004814 | arginine-tRNA ligase activity(GO:0004814) |
| 0.1 | 1.3 | GO:0016861 | intramolecular oxidoreductase activity, interconverting aldoses and ketoses(GO:0016861) |
| 0.1 | 0.3 | GO:0047631 | ADP-ribose diphosphatase activity(GO:0047631) |
| 0.1 | 3.7 | GO:0008395 | steroid hydroxylase activity(GO:0008395) |
| 0.1 | 15.5 | GO:0005200 | structural constituent of cytoskeleton(GO:0005200) |
| 0.1 | 2.9 | GO:0030552 | cAMP binding(GO:0030552) |
| 0.1 | 0.7 | GO:0004704 | NF-kappaB-inducing kinase activity(GO:0004704) |
| 0.1 | 0.5 | GO:0004090 | carbonyl reductase (NADPH) activity(GO:0004090) |
| 0.1 | 0.4 | GO:0050508 | glucuronosyl-N-acetylglucosaminyl-proteoglycan 4-alpha-N-acetylglucosaminyltransferase activity(GO:0050508) |
| 0.1 | 0.7 | GO:0097322 | 7SK snRNA binding(GO:0097322) |
| 0.1 | 1.1 | GO:0001871 | pattern binding(GO:0001871) polysaccharide binding(GO:0030247) |
| 0.1 | 0.3 | GO:0097603 | temperature-gated ion channel activity(GO:0097603) |
| 0.1 | 7.5 | GO:0005262 | calcium channel activity(GO:0005262) |
| 0.1 | 0.6 | GO:0030172 | troponin C binding(GO:0030172) |
| 0.1 | 0.4 | GO:0008420 | CTD phosphatase activity(GO:0008420) |
| 0.1 | 0.5 | GO:0004996 | thyroid-stimulating hormone receptor activity(GO:0004996) |
| 0.1 | 3.6 | GO:0050839 | cell adhesion molecule binding(GO:0050839) |
| 0.1 | 0.5 | GO:0003689 | DNA clamp loader activity(GO:0003689) protein-DNA loading ATPase activity(GO:0033170) |
| 0.1 | 1.8 | GO:0097200 | cysteine-type endopeptidase activity involved in execution phase of apoptosis(GO:0097200) |
| 0.1 | 1.3 | GO:0042813 | Wnt-activated receptor activity(GO:0042813) |
| 0.1 | 0.6 | GO:0051575 | 5'-deoxyribose-5-phosphate lyase activity(GO:0051575) |
| 0.0 | 0.2 | GO:0018479 | benzaldehyde dehydrogenase (NAD+) activity(GO:0018479) |
| 0.0 | 0.1 | GO:0033867 | Fas-activated serine/threonine kinase activity(GO:0033867) |
| 0.0 | 1.5 | GO:0031624 | ubiquitin conjugating enzyme binding(GO:0031624) |
| 0.0 | 11.2 | GO:0044822 | mRNA binding(GO:0003729) poly(A) RNA binding(GO:0044822) |
| 0.0 | 0.4 | GO:0008607 | phosphorylase kinase regulator activity(GO:0008607) |
| 0.0 | 0.6 | GO:0005229 | intracellular calcium activated chloride channel activity(GO:0005229) |
| 0.0 | 1.1 | GO:0005540 | hyaluronic acid binding(GO:0005540) |
| 0.0 | 10.7 | GO:0004252 | serine-type endopeptidase activity(GO:0004252) |
| 0.0 | 0.3 | GO:0032190 | acrosin binding(GO:0032190) |
| 0.0 | 0.8 | GO:0043395 | heparan sulfate proteoglycan binding(GO:0043395) |
| 0.0 | 1.1 | GO:0015002 | cytochrome-c oxidase activity(GO:0004129) heme-copper terminal oxidase activity(GO:0015002) oxidoreductase activity, acting on a heme group of donors, oxygen as acceptor(GO:0016676) |
| 0.0 | 0.1 | GO:0042132 | fructose 1,6-bisphosphate 1-phosphatase activity(GO:0042132) |
| 0.0 | 0.2 | GO:0004991 | parathyroid hormone receptor activity(GO:0004991) |
| 0.0 | 0.7 | GO:0050321 | tau-protein kinase activity(GO:0050321) |
| 0.0 | 1.1 | GO:0005547 | phosphatidylinositol-3,4,5-trisphosphate binding(GO:0005547) |
| 0.0 | 3.3 | GO:0019888 | protein phosphatase regulator activity(GO:0019888) |
| 0.0 | 2.7 | GO:0005089 | Rho guanyl-nucleotide exchange factor activity(GO:0005089) |
| 0.0 | 0.5 | GO:0004559 | alpha-mannosidase activity(GO:0004559) |
| 0.0 | 0.7 | GO:0001077 | transcriptional activator activity, RNA polymerase II core promoter proximal region sequence-specific binding(GO:0001077) |
| 0.0 | 0.4 | GO:0004745 | retinol dehydrogenase activity(GO:0004745) |
| 0.0 | 0.2 | GO:1903763 | gap junction channel activity involved in cell communication by electrical coupling(GO:1903763) |
| 0.0 | 1.0 | GO:0005544 | calcium-dependent phospholipid binding(GO:0005544) |
| 0.0 | 4.8 | GO:0061630 | ubiquitin protein ligase activity(GO:0061630) |
| 0.0 | 0.2 | GO:0047623 | AMP deaminase activity(GO:0003876) adenosine-phosphate deaminase activity(GO:0047623) |
| 0.0 | 0.5 | GO:0030169 | low-density lipoprotein particle binding(GO:0030169) |
| 0.0 | 0.8 | GO:0048020 | CCR chemokine receptor binding(GO:0048020) |
| 0.0 | 0.5 | GO:0046933 | proton-transporting ATP synthase activity, rotational mechanism(GO:0046933) |
| 0.0 | 0.7 | GO:0035035 | histone acetyltransferase binding(GO:0035035) |
| 0.0 | 0.2 | GO:0031433 | telethonin binding(GO:0031433) |
| 0.0 | 1.1 | GO:0004402 | histone acetyltransferase activity(GO:0004402) |
| 0.0 | 0.7 | GO:0050699 | WW domain binding(GO:0050699) |
| 0.0 | 1.2 | GO:0002039 | p53 binding(GO:0002039) |
| 0.0 | 0.5 | GO:0005326 | neurotransmitter transporter activity(GO:0005326) |
| 0.0 | 0.2 | GO:0016641 | oxidoreductase activity, acting on the CH-NH2 group of donors, oxygen as acceptor(GO:0016641) |
| 0.0 | 0.7 | GO:1902936 | phosphatidylinositol bisphosphate binding(GO:1902936) |
| 0.0 | 1.7 | GO:0019838 | growth factor binding(GO:0019838) |
| 0.0 | 0.7 | GO:0050840 | extracellular matrix binding(GO:0050840) |
| 0.0 | 0.2 | GO:0015467 | G-protein activated inward rectifier potassium channel activity(GO:0015467) |
| 0.0 | 0.5 | GO:0001102 | RNA polymerase II activating transcription factor binding(GO:0001102) |
| 0.0 | 0.8 | GO:0003774 | motor activity(GO:0003774) |
| 0.0 | 0.3 | GO:0003950 | NAD+ ADP-ribosyltransferase activity(GO:0003950) |
Gene overrepresentation in C2:CP category:
| Log-likelihood per target | Total log-likelihood | Term | Description |
|---|---|---|---|
| 0.8 | 18.1 | PID TCR RAS PATHWAY | Ras signaling in the CD4+ TCR pathway |
| 0.6 | 51.8 | PID A6B1 A6B4 INTEGRIN PATHWAY | a6b1 and a6b4 Integrin signaling |
| 0.4 | 24.1 | NABA PROTEOGLYCANS | Genes encoding proteoglycans |
| 0.4 | 9.7 | ST G ALPHA S PATHWAY | G alpha s Pathway |
| 0.4 | 2.2 | SA G1 AND S PHASES | Cdk2, 4, and 6 bind cyclin D in G1, while cdk2/cyclin E promotes the G1/S transition. |
| 0.3 | 5.2 | PID S1P S1P4 PATHWAY | S1P4 pathway |
| 0.3 | 12.5 | PID NETRIN PATHWAY | Netrin-mediated signaling events |
| 0.3 | 15.4 | PID INSULIN PATHWAY | Insulin Pathway |
| 0.2 | 13.6 | PID ATR PATHWAY | ATR signaling pathway |
| 0.2 | 4.2 | PID RB 1PATHWAY | Regulation of retinoblastoma protein |
| 0.2 | 5.9 | ST GRANULE CELL SURVIVAL PATHWAY | Granule Cell Survival Pathway is a specific case of more general PAC1 Receptor Pathway. |
| 0.2 | 1.4 | PID PDGFRA PATHWAY | PDGFR-alpha signaling pathway |
| 0.2 | 3.2 | PID CDC42 REG PATHWAY | Regulation of CDC42 activity |
| 0.1 | 2.4 | PID P38 GAMMA DELTA PATHWAY | Signaling mediated by p38-gamma and p38-delta |
| 0.1 | 6.0 | ST JNK MAPK PATHWAY | JNK MAPK Pathway |
| 0.1 | 3.0 | PID BETA CATENIN DEG PATHWAY | Degradation of beta catenin |
| 0.1 | 5.2 | PID ECADHERIN NASCENT AJ PATHWAY | E-cadherin signaling in the nascent adherens junction |
| 0.1 | 4.8 | SIG REGULATION OF THE ACTIN CYTOSKELETON BY RHO GTPASES | Genes related to regulation of the actin cytoskeleton |
| 0.1 | 6.2 | PID FGF PATHWAY | FGF signaling pathway |
| 0.1 | 8.4 | PID CASPASE PATHWAY | Caspase cascade in apoptosis |
| 0.1 | 7.0 | ST FAS SIGNALING PATHWAY | Fas Signaling Pathway |
| 0.1 | 1.7 | PID EPHA FWDPATHWAY | EPHA forward signaling |
| 0.1 | 5.8 | PID RHOA REG PATHWAY | Regulation of RhoA activity |
| 0.1 | 1.8 | PID ERB GENOMIC PATHWAY | Validated nuclear estrogen receptor beta network |
| 0.1 | 2.0 | PID ARF 3PATHWAY | Arf1 pathway |
| 0.1 | 1.1 | SA FAS SIGNALING | The TNF-type receptor Fas induces apoptosis on ligand binding. |
| 0.1 | 0.9 | PID S1P META PATHWAY | Sphingosine 1-phosphate (S1P) pathway |
| 0.1 | 3.3 | PID HNF3A PATHWAY | FOXA1 transcription factor network |
| 0.0 | 4.4 | PID TELOMERASE PATHWAY | Regulation of Telomerase |
| 0.0 | 3.4 | PID AR PATHWAY | Coregulation of Androgen receptor activity |
| 0.0 | 3.1 | PID DELTA NP63 PATHWAY | Validated transcriptional targets of deltaNp63 isoforms |
| 0.0 | 1.6 | PID ALPHA SYNUCLEIN PATHWAY | Alpha-synuclein signaling |
| 0.0 | 0.8 | PID WNT SIGNALING PATHWAY | Wnt signaling network |
| 0.0 | 0.8 | PID LIS1 PATHWAY | Lissencephaly gene (LIS1) in neuronal migration and development |
| 0.0 | 0.4 | PID DNA PK PATHWAY | DNA-PK pathway in nonhomologous end joining |
| 0.0 | 4.4 | NABA ECM AFFILIATED | Genes encoding proteins affiliated structurally or functionally to extracellular matrix proteins |
| 0.0 | 1.9 | PID PDGFRB PATHWAY | PDGFR-beta signaling pathway |
| 0.0 | 0.7 | PID ENDOTHELIN PATHWAY | Endothelins |
| 0.0 | 0.3 | PID PI3K PLC TRK PATHWAY | Trk receptor signaling mediated by PI3K and PLC-gamma |
| 0.0 | 0.8 | PID P73PATHWAY | p73 transcription factor network |
| 0.0 | 0.4 | PID CONE PATHWAY | Visual signal transduction: Cones |
| 0.0 | 0.7 | PID LKB1 PATHWAY | LKB1 signaling events |
Gene overrepresentation in C2:CP:REACTOME category:
| Log-likelihood per target | Total log-likelihood | Term | Description |
|---|---|---|---|
| 0.9 | 25.2 | REACTOME TRAFFICKING OF GLUR2 CONTAINING AMPA RECEPTORS | Genes involved in Trafficking of GluR2-containing AMPA receptors |
| 0.5 | 17.7 | REACTOME INTERACTION BETWEEN L1 AND ANKYRINS | Genes involved in Interaction between L1 and Ankyrins |
| 0.5 | 6.2 | REACTOME SIGNALING BY FGFR3 MUTANTS | Genes involved in Signaling by FGFR3 mutants |
| 0.5 | 12.6 | REACTOME GLUTAMATE NEUROTRANSMITTER RELEASE CYCLE | Genes involved in Glutamate Neurotransmitter Release Cycle |
| 0.5 | 29.1 | REACTOME SMOOTH MUSCLE CONTRACTION | Genes involved in Smooth Muscle Contraction |
| 0.5 | 14.9 | REACTOME INHIBITION OF INSULIN SECRETION BY ADRENALINE NORADRENALINE | Genes involved in Inhibition of Insulin Secretion by Adrenaline/Noradrenaline |
| 0.4 | 11.8 | REACTOME CRMPS IN SEMA3A SIGNALING | Genes involved in CRMPs in Sema3A signaling |
| 0.4 | 4.0 | REACTOME SYNTHESIS OF BILE ACIDS AND BILE SALTS VIA 24 HYDROXYCHOLESTEROL | Genes involved in Synthesis of bile acids and bile salts via 24-hydroxycholesterol |
| 0.3 | 4.7 | REACTOME TRYPTOPHAN CATABOLISM | Genes involved in Tryptophan catabolism |
| 0.3 | 3.7 | REACTOME CREATION OF C4 AND C2 ACTIVATORS | Genes involved in Creation of C4 and C2 activators |
| 0.3 | 12.9 | REACTOME RAP1 SIGNALLING | Genes involved in Rap1 signalling |
| 0.3 | 4.7 | REACTOME PLATELET CALCIUM HOMEOSTASIS | Genes involved in Platelet calcium homeostasis |
| 0.2 | 14.6 | REACTOME NETRIN1 SIGNALING | Genes involved in Netrin-1 signaling |
| 0.2 | 8.3 | REACTOME GLUTATHIONE CONJUGATION | Genes involved in Glutathione conjugation |
| 0.2 | 7.3 | REACTOME KERATAN SULFATE BIOSYNTHESIS | Genes involved in Keratan sulfate biosynthesis |
| 0.2 | 30.9 | REACTOME RESPONSE TO ELEVATED PLATELET CYTOSOLIC CA2 | Genes involved in Response to elevated platelet cytosolic Ca2+ |
| 0.2 | 12.2 | REACTOME NCAM1 INTERACTIONS | Genes involved in NCAM1 interactions |
| 0.2 | 3.8 | REACTOME ACTIVATION OF BH3 ONLY PROTEINS | Genes involved in Activation of BH3-only proteins |
| 0.1 | 6.9 | REACTOME NRAGE SIGNALS DEATH THROUGH JNK | Genes involved in NRAGE signals death through JNK |
| 0.1 | 4.1 | REACTOME ASSOCIATION OF TRIC CCT WITH TARGET PROTEINS DURING BIOSYNTHESIS | Genes involved in Association of TriC/CCT with target proteins during biosynthesis |
| 0.1 | 1.0 | REACTOME INITIAL TRIGGERING OF COMPLEMENT | Genes involved in Initial triggering of complement |
| 0.1 | 4.8 | REACTOME BASIGIN INTERACTIONS | Genes involved in Basigin interactions |
| 0.1 | 1.5 | REACTOME P53 DEPENDENT G1 DNA DAMAGE RESPONSE | Genes involved in p53-Dependent G1 DNA Damage Response |
| 0.1 | 0.7 | REACTOME CROSS PRESENTATION OF SOLUBLE EXOGENOUS ANTIGENS ENDOSOMES | Genes involved in Cross-presentation of soluble exogenous antigens (endosomes) |
| 0.1 | 10.8 | REACTOME ACTIVATION OF NF KAPPAB IN B CELLS | Genes involved in Activation of NF-kappaB in B Cells |
| 0.1 | 5.2 | REACTOME OLFACTORY SIGNALING PATHWAY | Genes involved in Olfactory Signaling Pathway |
| 0.1 | 3.4 | REACTOME RNA POL III TRANSCRIPTION TERMINATION | Genes involved in RNA Polymerase III Transcription Termination |
| 0.1 | 2.2 | REACTOME SYNTHESIS OF PIPS AT THE GOLGI MEMBRANE | Genes involved in Synthesis of PIPs at the Golgi membrane |
| 0.1 | 1.1 | REACTOME DOWNSTREAM SIGNAL TRANSDUCTION | Genes involved in Downstream signal transduction |
| 0.1 | 2.9 | REACTOME REGULATION OF GENE EXPRESSION IN BETA CELLS | Genes involved in Regulation of gene expression in beta cells |
| 0.1 | 1.6 | REACTOME JNK C JUN KINASES PHOSPHORYLATION AND ACTIVATION MEDIATED BY ACTIVATED HUMAN TAK1 | Genes involved in JNK (c-Jun kinases) phosphorylation and activation mediated by activated human TAK1 |
| 0.1 | 2.1 | REACTOME REGULATION OF INSULIN LIKE GROWTH FACTOR IGF ACTIVITY BY INSULIN LIKE GROWTH FACTOR BINDING PROTEINS IGFBPS | Genes involved in Regulation of Insulin-like Growth Factor (IGF) Activity by Insulin-like Growth Factor Binding Proteins (IGFBPs) |
| 0.1 | 0.4 | REACTOME GRB2 SOS PROVIDES LINKAGE TO MAPK SIGNALING FOR INTERGRINS | Genes involved in GRB2:SOS provides linkage to MAPK signaling for Intergrins |
| 0.1 | 1.7 | REACTOME DESTABILIZATION OF MRNA BY AUF1 HNRNP D0 | Genes involved in Destabilization of mRNA by AUF1 (hnRNP D0) |
| 0.1 | 2.2 | REACTOME ACTIVATED NOTCH1 TRANSMITS SIGNAL TO THE NUCLEUS | Genes involved in Activated NOTCH1 Transmits Signal to the Nucleus |
| 0.1 | 5.3 | REACTOME APOPTOTIC CLEAVAGE OF CELLULAR PROTEINS | Genes involved in Apoptotic cleavage of cellular proteins |
| 0.1 | 0.8 | REACTOME ACTIVATION OF RAC | Genes involved in Activation of Rac |
| 0.1 | 0.6 | REACTOME DIGESTION OF DIETARY CARBOHYDRATE | Genes involved in Digestion of dietary carbohydrate |
| 0.1 | 1.1 | REACTOME CELL EXTRACELLULAR MATRIX INTERACTIONS | Genes involved in Cell-extracellular matrix interactions |
| 0.1 | 1.3 | REACTOME METABOLISM OF POLYAMINES | Genes involved in Metabolism of polyamines |
| 0.1 | 2.1 | REACTOME AMINO ACID AND OLIGOPEPTIDE SLC TRANSPORTERS | Genes involved in Amino acid and oligopeptide SLC transporters |
| 0.0 | 0.9 | REACTOME SIGNALING BY HIPPO | Genes involved in Signaling by Hippo |
| 0.0 | 0.9 | REACTOME APOPTOSIS INDUCED DNA FRAGMENTATION | Genes involved in Apoptosis induced DNA fragmentation |
| 0.0 | 0.8 | REACTOME CLASS C 3 METABOTROPIC GLUTAMATE PHEROMONE RECEPTORS | Genes involved in Class C/3 (Metabotropic glutamate/pheromone receptors) |
| 0.0 | 3.0 | REACTOME CIRCADIAN CLOCK | Genes involved in Circadian Clock |
| 0.0 | 0.4 | REACTOME ROLE OF DCC IN REGULATING APOPTOSIS | Genes involved in Role of DCC in regulating apoptosis |
| 0.0 | 0.6 | REACTOME ACYL CHAIN REMODELLING OF PG | Genes involved in Acyl chain remodelling of PG |
| 0.0 | 0.9 | REACTOME SIGNALING BY NODAL | Genes involved in Signaling by NODAL |
| 0.0 | 5.3 | REACTOME METABOLISM OF AMINO ACIDS AND DERIVATIVES | Genes involved in Metabolism of amino acids and derivatives |
| 0.0 | 1.6 | REACTOME PI3K EVENTS IN ERBB2 SIGNALING | Genes involved in PI3K events in ERBB2 signaling |
| 0.0 | 0.2 | REACTOME SEMA3A PAK DEPENDENT AXON REPULSION | Genes involved in Sema3A PAK dependent Axon repulsion |
| 0.0 | 0.3 | REACTOME G ALPHA S SIGNALLING EVENTS | Genes involved in G alpha (s) signalling events |
| 0.0 | 1.0 | REACTOME GLUCONEOGENESIS | Genes involved in Gluconeogenesis |
| 0.0 | 0.5 | REACTOME FORMATION OF ATP BY CHEMIOSMOTIC COUPLING | Genes involved in Formation of ATP by chemiosmotic coupling |
| 0.0 | 0.4 | REACTOME SIGNALING BY SCF KIT | Genes involved in Signaling by SCF-KIT |
| 0.0 | 0.6 | REACTOME GABA A RECEPTOR ACTIVATION | Genes involved in GABA A receptor activation |
| 0.0 | 2.4 | REACTOME SIGNALING BY RHO GTPASES | Genes involved in Signaling by Rho GTPases |
| 0.0 | 0.4 | REACTOME ABORTIVE ELONGATION OF HIV1 TRANSCRIPT IN THE ABSENCE OF TAT | Genes involved in Abortive elongation of HIV-1 transcript in the absence of Tat |
| 0.0 | 0.2 | REACTOME XENOBIOTICS | Genes involved in Xenobiotics |
| 0.0 | 0.2 | REACTOME INHIBITION OF VOLTAGE GATED CA2 CHANNELS VIA GBETA GAMMA SUBUNITS | Genes involved in Inhibition of voltage gated Ca2+ channels via Gbeta/gamma subunits |
| 0.0 | 0.2 | REACTOME DARPP 32 EVENTS | Genes involved in DARPP-32 events |
| 0.0 | 1.0 | REACTOME CLASS B 2 SECRETIN FAMILY RECEPTORS | Genes involved in Class B/2 (Secretin family receptors) |