Project
GNF SymAtlas + NCI-60 cancer cell lines, comparison of cancers vs non-cancers, human (Su, 2004; Ross, 2000)
Navigation
Downloads
Results for OSR1_OSR2
Z-value: 1.43
Motif logo
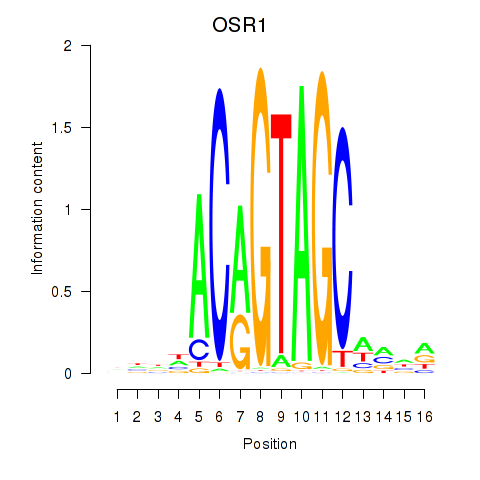
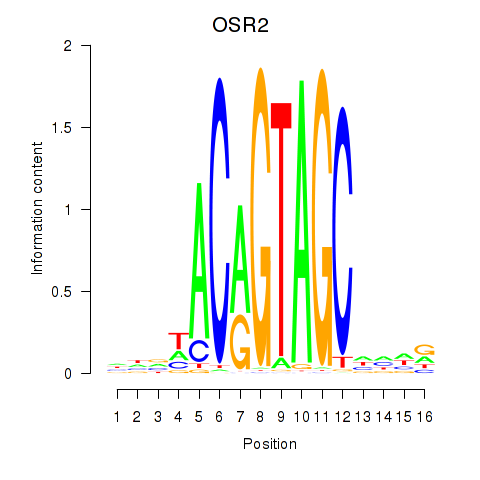
Transcription factors associated with OSR1_OSR2
| Gene Symbol | Gene ID | Gene Info |
|---|---|---|
|
OSR1
|
ENSG00000143867.5 | odd-skipped related transcription factor 1 |
|
OSR2
|
ENSG00000164920.5 | odd-skipped related transciption factor 2 |
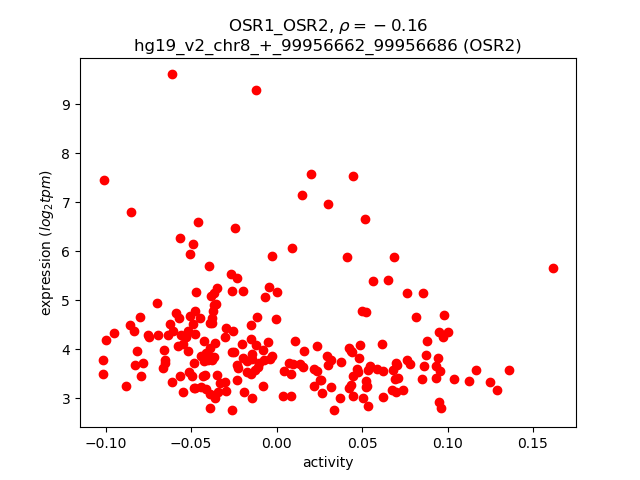
Activity-expression correlation:
| Gene | Promoter | Pearson corr. coef. | P-value | Plot |
|---|---|---|---|---|
| OSR2 | hg19_v2_chr8_+_99956662_99956686 | -0.16 | 2.0e-02 | Click! |
Activity profile of OSR1_OSR2 motif
Sorted Z-values of OSR1_OSR2 motif
| Promoter | Log-likelihood | Transcript | Gene | Gene Info |
|---|---|---|---|---|
| chr8_-_80942139 | 28.98 |
ENST00000521434.1
ENST00000519120.1 ENST00000520946.1 |
MRPS28
|
mitochondrial ribosomal protein S28 |
| chr12_-_50419177 | 27.91 |
ENST00000454520.2
ENST00000546595.1 ENST00000548824.1 ENST00000549777.1 ENST00000546723.1 ENST00000427314.2 ENST00000552157.1 ENST00000552310.1 ENST00000548644.1 ENST00000312377.5 ENST00000546786.1 ENST00000550149.1 ENST00000546764.1 ENST00000552004.1 ENST00000548320.1 ENST00000547905.1 ENST00000550651.1 ENST00000551145.1 ENST00000434422.1 ENST00000552921.1 |
RACGAP1
|
Rac GTPase activating protein 1 |
| chr5_+_68463043 | 27.73 |
ENST00000508407.1
ENST00000505500.1 |
CCNB1
|
cyclin B1 |
| chr11_+_64808675 | 27.40 |
ENST00000529996.1
|
SAC3D1
|
SAC3 domain containing 1 |
| chr14_+_56127989 | 27.15 |
ENST00000555573.1
|
KTN1
|
kinectin 1 (kinesin receptor) |
| chr5_+_68462837 | 25.13 |
ENST00000256442.5
|
CCNB1
|
cyclin B1 |
| chr5_+_68462944 | 24.64 |
ENST00000506572.1
|
CCNB1
|
cyclin B1 |
| chr9_-_95055956 | 24.16 |
ENST00000375629.3
ENST00000447699.2 ENST00000375643.3 ENST00000395554.3 |
IARS
|
isoleucyl-tRNA synthetase |
| chr8_-_80942061 | 22.22 |
ENST00000519386.1
|
MRPS28
|
mitochondrial ribosomal protein S28 |
| chr9_-_95056010 | 20.08 |
ENST00000443024.2
|
IARS
|
isoleucyl-tRNA synthetase |
| chr11_-_82997420 | 16.03 |
ENST00000455220.2
ENST00000529689.1 |
CCDC90B
|
coiled-coil domain containing 90B |
| chr5_+_145826867 | 15.90 |
ENST00000296702.5
ENST00000394421.2 |
TCERG1
|
transcription elongation regulator 1 |
| chr1_+_218458625 | 14.53 |
ENST00000366932.3
|
RRP15
|
ribosomal RNA processing 15 homolog (S. cerevisiae) |
| chr2_-_37458749 | 13.24 |
ENST00000234170.5
|
CEBPZ
|
CCAAT/enhancer binding protein (C/EBP), zeta |
| chr9_+_36572851 | 12.84 |
ENST00000298048.2
ENST00000538311.1 ENST00000536987.1 ENST00000545008.1 ENST00000536860.1 ENST00000536329.1 ENST00000541717.1 ENST00000543751.1 |
MELK
|
maternal embryonic leucine zipper kinase |
| chr7_+_73106926 | 12.33 |
ENST00000453316.1
|
WBSCR22
|
Williams Beuren syndrome chromosome region 22 |
| chr10_-_43904608 | 11.43 |
ENST00000337970.3
|
HNRNPF
|
heterogeneous nuclear ribonucleoprotein F |
| chr15_-_66649010 | 11.35 |
ENST00000367709.4
ENST00000261881.4 |
TIPIN
|
TIMELESS interacting protein |
| chr17_-_79895097 | 11.03 |
ENST00000402252.2
ENST00000583564.1 ENST00000585244.1 ENST00000337943.5 ENST00000579698.1 |
PYCR1
|
pyrroline-5-carboxylate reductase 1 |
| chr17_-_79894651 | 10.44 |
ENST00000584848.1
ENST00000577756.1 ENST00000329875.8 |
PYCR1
|
pyrroline-5-carboxylate reductase 1 |
| chr20_-_34330129 | 10.42 |
ENST00000397370.3
ENST00000528062.3 ENST00000407261.4 ENST00000374038.3 ENST00000361162.6 |
RBM39
|
RNA binding motif protein 39 |
| chr22_-_42336209 | 9.83 |
ENST00000472374.2
|
CENPM
|
centromere protein M |
| chr7_-_43769066 | 9.82 |
ENST00000223336.6
ENST00000310564.6 ENST00000431651.1 ENST00000415798.1 |
COA1
|
cytochrome c oxidase assembly factor 1 homolog (S. cerevisiae) |
| chr16_+_23690138 | 9.75 |
ENST00000300093.4
|
PLK1
|
polo-like kinase 1 |
| chr19_-_13068012 | 9.70 |
ENST00000316939.1
|
GADD45GIP1
|
growth arrest and DNA-damage-inducible, gamma interacting protein 1 |
| chr10_-_43904235 | 9.53 |
ENST00000356053.3
|
HNRNPF
|
heterogeneous nuclear ribonucleoprotein F |
| chr17_-_79895154 | 9.41 |
ENST00000405481.4
ENST00000585215.1 ENST00000577624.1 ENST00000403172.4 |
PYCR1
|
pyrroline-5-carboxylate reductase 1 |
| chr7_-_43769051 | 9.37 |
ENST00000395880.3
|
COA1
|
cytochrome c oxidase assembly factor 1 homolog (S. cerevisiae) |
| chr1_-_156722015 | 9.20 |
ENST00000368209.5
|
HDGF
|
hepatoma-derived growth factor |
| chr2_+_178257372 | 9.02 |
ENST00000264167.4
ENST00000409888.1 |
AGPS
|
alkylglycerone phosphate synthase |
| chr16_-_66968055 | 8.93 |
ENST00000568572.1
|
FAM96B
|
family with sequence similarity 96, member B |
| chr2_-_74007193 | 8.61 |
ENST00000377706.4
ENST00000443070.1 ENST00000272444.3 |
DUSP11
|
dual specificity phosphatase 11 (RNA/RNP complex 1-interacting) |
| chr3_+_149192475 | 8.61 |
ENST00000465758.1
|
TM4SF4
|
transmembrane 4 L six family member 4 |
| chr15_+_66161802 | 8.15 |
ENST00000566233.1
ENST00000565075.1 ENST00000435304.2 |
RAB11A
|
RAB11A, member RAS oncogene family |
| chr14_+_93651296 | 8.00 |
ENST00000283534.4
ENST00000557574.1 |
TMEM251
RP11-371E8.4
|
transmembrane protein 251 Uncharacterized protein |
| chr7_-_105752971 | 7.72 |
ENST00000011473.2
|
SYPL1
|
synaptophysin-like 1 |
| chr20_+_31407692 | 7.61 |
ENST00000375571.5
|
MAPRE1
|
microtubule-associated protein, RP/EB family, member 1 |
| chr9_+_112542591 | 7.27 |
ENST00000483909.1
ENST00000314527.4 ENST00000413420.1 ENST00000302798.7 ENST00000555236.1 ENST00000510514.5 |
PALM2
PALM2-AKAP2
AKAP2
|
paralemmin 2 PALM2-AKAP2 readthrough A kinase (PRKA) anchor protein 2 |
| chr5_+_169010638 | 7.20 |
ENST00000265295.4
ENST00000506574.1 ENST00000515224.1 ENST00000508247.1 ENST00000513941.1 |
SPDL1
|
spindle apparatus coiled-coil protein 1 |
| chr3_-_50360192 | 6.95 |
ENST00000442581.1
ENST00000447092.1 ENST00000357750.4 |
HYAL2
|
hyaluronoglucosaminidase 2 |
| chr8_+_125486939 | 6.68 |
ENST00000303545.3
|
RNF139
|
ring finger protein 139 |
| chr7_+_134212312 | 6.66 |
ENST00000359579.4
|
AKR1B10
|
aldo-keto reductase family 1, member B10 (aldose reductase) |
| chr5_+_36152091 | 6.45 |
ENST00000274254.5
|
SKP2
|
S-phase kinase-associated protein 2, E3 ubiquitin protein ligase |
| chr2_-_88125471 | 6.27 |
ENST00000398146.3
|
RGPD2
|
RANBP2-like and GRIP domain containing 2 |
| chr12_-_24102576 | 6.09 |
ENST00000537393.1
ENST00000309359.1 ENST00000381381.2 ENST00000451604.2 |
SOX5
|
SRY (sex determining region Y)-box 5 |
| chr16_-_8962200 | 6.05 |
ENST00000562843.1
ENST00000561530.1 ENST00000396593.2 |
CARHSP1
|
calcium regulated heat stable protein 1, 24kDa |
| chr4_-_70080449 | 5.97 |
ENST00000446444.1
|
UGT2B11
|
UDP glucuronosyltransferase 2 family, polypeptide B11 |
| chrX_-_134049262 | 5.94 |
ENST00000370783.3
|
MOSPD1
|
motile sperm domain containing 1 |
| chr4_+_169013666 | 5.93 |
ENST00000359299.3
|
ANXA10
|
annexin A10 |
| chr7_+_127228399 | 5.88 |
ENST00000000233.5
ENST00000415666.1 |
ARF5
|
ADP-ribosylation factor 5 |
| chr15_-_41694640 | 5.87 |
ENST00000558719.1
ENST00000260361.4 ENST00000560978.1 |
NDUFAF1
|
NADH dehydrogenase (ubiquinone) complex I, assembly factor 1 |
| chr5_+_70220768 | 5.83 |
ENST00000351205.4
ENST00000503079.2 ENST00000380707.4 ENST00000514951.1 ENST00000506163.1 |
SMN1
|
survival of motor neuron 1, telomeric |
| chr3_+_45927994 | 5.82 |
ENST00000357632.2
ENST00000395963.2 |
CCR9
|
chemokine (C-C motif) receptor 9 |
| chr2_-_178257401 | 5.75 |
ENST00000464747.1
|
NFE2L2
|
nuclear factor, erythroid 2-like 2 |
| chr2_-_74735707 | 5.68 |
ENST00000233630.6
|
PCGF1
|
polycomb group ring finger 1 |
| chr15_+_79603404 | 5.49 |
ENST00000299705.5
|
TMED3
|
transmembrane emp24 protein transport domain containing 3 |
| chr5_+_36152163 | 5.39 |
ENST00000274255.6
|
SKP2
|
S-phase kinase-associated protein 2, E3 ubiquitin protein ligase |
| chr5_+_69345350 | 5.27 |
ENST00000380741.4
ENST00000380743.4 ENST00000511812.1 ENST00000380742.4 |
SMN2
|
survival of motor neuron 2, centromeric |
| chr8_+_37594130 | 5.18 |
ENST00000518526.1
ENST00000523887.1 ENST00000276461.5 |
ERLIN2
|
ER lipid raft associated 2 |
| chr5_-_140053152 | 5.02 |
ENST00000542735.1
|
DND1
|
DND microRNA-mediated repression inhibitor 1 |
| chr2_-_201828356 | 5.00 |
ENST00000234296.2
|
ORC2
|
origin recognition complex, subunit 2 |
| chr15_+_66161871 | 4.78 |
ENST00000569896.1
|
RAB11A
|
RAB11A, member RAS oncogene family |
| chr8_+_26247878 | 4.55 |
ENST00000518611.1
|
BNIP3L
|
BCL2/adenovirus E1B 19kDa interacting protein 3-like |
| chr19_-_16770915 | 4.51 |
ENST00000593459.1
ENST00000358726.6 ENST00000597711.1 ENST00000487416.2 |
CTC-429P9.4
SMIM7
|
Small integral membrane protein 7; Uncharacterized protein small integral membrane protein 7 |
| chr4_+_146403912 | 4.50 |
ENST00000507367.1
ENST00000394092.2 ENST00000515385.1 |
SMAD1
|
SMAD family member 1 |
| chr3_+_193853927 | 4.39 |
ENST00000232424.3
|
HES1
|
hes family bHLH transcription factor 1 |
| chr3_+_149191723 | 4.30 |
ENST00000305354.4
|
TM4SF4
|
transmembrane 4 L six family member 4 |
| chr9_+_33025209 | 4.29 |
ENST00000330899.4
ENST00000544625.1 |
DNAJA1
|
DnaJ (Hsp40) homolog, subfamily A, member 1 |
| chr22_+_42017280 | 4.25 |
ENST00000402580.3
ENST00000428575.2 ENST00000359308.4 |
XRCC6
|
X-ray repair complementing defective repair in Chinese hamster cells 6 |
| chr22_+_31489344 | 4.20 |
ENST00000404574.1
|
SMTN
|
smoothelin |
| chr2_-_148779106 | 4.18 |
ENST00000416719.1
ENST00000264169.2 |
ORC4
|
origin recognition complex, subunit 4 |
| chr15_+_66161792 | 4.08 |
ENST00000564910.1
ENST00000261890.2 |
RAB11A
|
RAB11A, member RAS oncogene family |
| chr19_+_39989535 | 3.97 |
ENST00000356433.5
|
DLL3
|
delta-like 3 (Drosophila) |
| chr1_-_35450897 | 3.85 |
ENST00000373337.3
|
ZMYM6NB
|
ZMYM6 neighbor |
| chr1_-_231560790 | 3.80 |
ENST00000366641.3
|
EGLN1
|
egl-9 family hypoxia-inducible factor 1 |
| chr10_-_111683183 | 3.75 |
ENST00000403138.2
ENST00000369683.1 |
XPNPEP1
|
X-prolyl aminopeptidase (aminopeptidase P) 1, soluble |
| chr7_-_123197733 | 3.66 |
ENST00000470123.1
ENST00000471770.1 |
NDUFA5
|
NADH dehydrogenase (ubiquinone) 1 alpha subcomplex, 5 |
| chr12_-_58165870 | 3.65 |
ENST00000257848.7
|
METTL1
|
methyltransferase like 1 |
| chr1_+_42922173 | 3.65 |
ENST00000455780.1
ENST00000372560.3 ENST00000372561.3 ENST00000372556.3 |
PPCS
|
phosphopantothenoylcysteine synthetase |
| chr11_+_62648336 | 3.62 |
ENST00000338663.7
|
SLC3A2
|
solute carrier family 3 (amino acid transporter heavy chain), member 2 |
| chr22_+_42017459 | 3.50 |
ENST00000405878.1
|
XRCC6
|
X-ray repair complementing defective repair in Chinese hamster cells 6 |
| chr16_+_89696692 | 3.38 |
ENST00000261615.4
|
DPEP1
|
dipeptidase 1 (renal) |
| chr12_-_15114492 | 3.34 |
ENST00000541546.1
|
ARHGDIB
|
Rho GDP dissociation inhibitor (GDI) beta |
| chr19_+_19303008 | 3.30 |
ENST00000353145.1
ENST00000421262.3 ENST00000303088.4 ENST00000456252.3 ENST00000593273.1 |
RFXANK
|
regulatory factor X-associated ankyrin-containing protein |
| chr3_+_179322481 | 3.29 |
ENST00000259037.3
|
NDUFB5
|
NADH dehydrogenase (ubiquinone) 1 beta subcomplex, 5, 16kDa |
| chr19_+_7459998 | 3.27 |
ENST00000319670.9
ENST00000599752.1 |
ARHGEF18
|
Rho/Rac guanine nucleotide exchange factor (GEF) 18 |
| chr15_+_75491213 | 2.96 |
ENST00000360639.2
|
C15orf39
|
chromosome 15 open reading frame 39 |
| chr6_+_32938665 | 2.90 |
ENST00000374831.4
ENST00000395289.2 |
BRD2
|
bromodomain containing 2 |
| chr20_-_33999766 | 2.88 |
ENST00000349714.5
ENST00000438533.1 ENST00000359226.2 ENST00000374384.2 ENST00000374377.5 ENST00000407996.2 ENST00000424405.1 ENST00000542501.1 ENST00000397554.1 ENST00000540457.1 ENST00000374380.2 ENST00000374385.5 |
UQCC1
|
ubiquinol-cytochrome c reductase complex assembly factor 1 |
| chr4_+_69681710 | 2.83 |
ENST00000265403.7
ENST00000458688.2 |
UGT2B10
|
UDP glucuronosyltransferase 2 family, polypeptide B10 |
| chr1_+_201798269 | 2.76 |
ENST00000361565.4
|
IPO9
|
importin 9 |
| chr10_-_111683308 | 2.70 |
ENST00000502935.1
ENST00000322238.8 ENST00000369680.4 |
XPNPEP1
|
X-prolyl aminopeptidase (aminopeptidase P) 1, soluble |
| chr19_+_39989580 | 2.66 |
ENST00000596614.1
ENST00000205143.4 |
DLL3
|
delta-like 3 (Drosophila) |
| chr4_-_70361579 | 2.51 |
ENST00000512583.1
|
UGT2B4
|
UDP glucuronosyltransferase 2 family, polypeptide B4 |
| chr12_-_86650077 | 2.29 |
ENST00000552808.2
ENST00000547225.1 |
MGAT4C
|
mannosyl (alpha-1,3-)-glycoprotein beta-1,4-N-acetylglucosaminyltransferase, isozyme C (putative) |
| chr4_-_70361615 | 2.20 |
ENST00000305107.6
|
UGT2B4
|
UDP glucuronosyltransferase 2 family, polypeptide B4 |
| chr1_+_161736072 | 2.16 |
ENST00000367942.3
|
ATF6
|
activating transcription factor 6 |
| chr2_-_183387064 | 2.12 |
ENST00000536095.1
ENST00000331935.6 ENST00000358139.2 ENST00000456212.1 |
PDE1A
|
phosphodiesterase 1A, calmodulin-dependent |
| chr1_-_153508460 | 2.10 |
ENST00000462776.2
|
S100A6
|
S100 calcium binding protein A6 |
| chr6_+_152011628 | 2.01 |
ENST00000404742.1
ENST00000440973.1 |
ESR1
|
estrogen receptor 1 |
| chr15_+_58724184 | 1.96 |
ENST00000433326.2
|
LIPC
|
lipase, hepatic |
| chr9_-_21217310 | 1.90 |
ENST00000380216.1
|
IFNA16
|
interferon, alpha 16 |
| chr21_+_40752170 | 1.85 |
ENST00000333781.5
ENST00000541890.1 |
WRB
|
tryptophan rich basic protein |
| chr4_+_151503077 | 1.83 |
ENST00000317605.4
|
MAB21L2
|
mab-21-like 2 (C. elegans) |
| chr1_+_144220127 | 1.80 |
ENST00000369373.5
|
NBPF8
|
neuroblastoma breakpoint family, member 8 |
| chr15_+_41523335 | 1.76 |
ENST00000334660.5
|
CHP1
|
calcineurin-like EF-hand protein 1 |
| chr18_+_616672 | 1.76 |
ENST00000338387.7
|
CLUL1
|
clusterin-like 1 (retinal) |
| chr2_+_70056762 | 1.65 |
ENST00000282570.3
|
GMCL1
|
germ cell-less, spermatogenesis associated 1 |
| chr12_-_15114603 | 1.60 |
ENST00000228945.4
|
ARHGDIB
|
Rho GDP dissociation inhibitor (GDI) beta |
| chr12_+_58166431 | 1.59 |
ENST00000333012.5
|
METTL21B
|
methyltransferase like 21B |
| chr2_-_183387283 | 1.49 |
ENST00000435564.1
|
PDE1A
|
phosphodiesterase 1A, calmodulin-dependent |
| chr3_+_101504200 | 1.47 |
ENST00000422132.1
|
NXPE3
|
neurexophilin and PC-esterase domain family, member 3 |
| chr8_-_145653885 | 1.42 |
ENST00000531032.1
ENST00000292510.4 ENST00000377348.2 ENST00000530790.1 ENST00000533806.1 |
VPS28
|
vacuolar protein sorting 28 homolog (S. cerevisiae) |
| chrX_+_80457442 | 1.29 |
ENST00000373212.5
|
SH3BGRL
|
SH3 domain binding glutamic acid-rich protein like |
| chr2_-_183387430 | 1.19 |
ENST00000410103.1
|
PDE1A
|
phosphodiesterase 1A, calmodulin-dependent |
| chr15_+_41523417 | 1.07 |
ENST00000560397.1
|
CHP1
|
calcineurin-like EF-hand protein 1 |
| chr7_-_144533074 | 1.02 |
ENST00000360057.3
ENST00000378099.3 |
TPK1
|
thiamin pyrophosphokinase 1 |
| chr18_+_616711 | 0.99 |
ENST00000579494.1
|
CLUL1
|
clusterin-like 1 (retinal) |
| chr1_-_179112173 | 0.96 |
ENST00000408940.3
ENST00000504405.1 |
ABL2
|
c-abl oncogene 2, non-receptor tyrosine kinase |
| chr18_+_63417864 | 0.95 |
ENST00000536984.2
|
CDH7
|
cadherin 7, type 2 |
| chr15_-_80263506 | 0.95 |
ENST00000335661.6
|
BCL2A1
|
BCL2-related protein A1 |
| chr2_+_37458776 | 0.87 |
ENST00000002125.4
ENST00000336237.6 ENST00000431821.1 |
NDUFAF7
|
NADH dehydrogenase (ubiquinone) complex I, assembly factor 7 |
| chr17_+_40714092 | 0.81 |
ENST00000420359.1
ENST00000449624.1 ENST00000585811.1 ENST00000585909.1 ENST00000586771.1 ENST00000421097.2 ENST00000591779.1 ENST00000587858.1 ENST00000587214.1 ENST00000587157.1 ENST00000590958.1 ENST00000393818.2 |
COASY
|
CoA synthase |
| chr12_-_86650045 | 0.79 |
ENST00000604798.1
|
MGAT4C
|
mannosyl (alpha-1,3-)-glycoprotein beta-1,4-N-acetylglucosaminyltransferase, isozyme C (putative) |
| chr17_+_36284791 | 0.78 |
ENST00000505415.1
|
TBC1D3F
|
TBC1 domain family, member 3F |
| chr17_-_7145475 | 0.77 |
ENST00000571129.1
ENST00000571253.1 ENST00000573928.1 |
GABARAP
|
GABA(A) receptor-associated protein |
| chr4_-_113437328 | 0.74 |
ENST00000313341.3
|
NEUROG2
|
neurogenin 2 |
| chr22_+_32870661 | 0.72 |
ENST00000266087.7
|
FBXO7
|
F-box protein 7 |
| chr7_+_112090483 | 0.66 |
ENST00000403825.3
ENST00000429071.1 |
IFRD1
|
interferon-related developmental regulator 1 |
| chr17_-_34756219 | 0.65 |
ENST00000451448.2
ENST00000394359.3 |
TBC1D3C
TBC1D3H
|
TBC1 domain family, member 3C TBC1 domain family, member 3H |
| chr1_+_40505891 | 0.64 |
ENST00000372797.3
ENST00000372802.1 ENST00000449311.1 |
CAP1
|
CAP, adenylate cyclase-associated protein 1 (yeast) |
| chr2_+_234580525 | 0.61 |
ENST00000609637.1
|
UGT1A1
|
UDP glucuronosyltransferase 1 family, polypeptide A8 |
| chr8_+_20054878 | 0.60 |
ENST00000276390.2
ENST00000519667.1 |
ATP6V1B2
|
ATPase, H+ transporting, lysosomal 56/58kDa, V1 subunit B2 |
| chr11_+_8704748 | 0.54 |
ENST00000526562.1
ENST00000525981.1 |
RPL27A
|
ribosomal protein L27a |
| chr8_-_57906362 | 0.54 |
ENST00000262644.4
|
IMPAD1
|
inositol monophosphatase domain containing 1 |
| chr21_-_34915147 | 0.52 |
ENST00000381831.3
ENST00000381839.3 |
GART
|
phosphoribosylglycinamide formyltransferase, phosphoribosylglycinamide synthetase, phosphoribosylaminoimidazole synthetase |
| chr2_+_234580499 | 0.47 |
ENST00000354728.4
|
UGT1A9
|
UDP glucuronosyltransferase 1 family, polypeptide A9 |
| chr21_+_43919710 | 0.44 |
ENST00000398341.3
|
SLC37A1
|
solute carrier family 37 (glucose-6-phosphate transporter), member 1 |
| chr1_-_167487758 | 0.43 |
ENST00000362089.5
|
CD247
|
CD247 molecule |
| chr12_-_10251539 | 0.43 |
ENST00000420265.2
|
CLEC1A
|
C-type lectin domain family 1, member A |
| chr22_+_37309662 | 0.39 |
ENST00000403662.3
ENST00000262825.5 |
CSF2RB
|
colony stimulating factor 2 receptor, beta, low-affinity (granulocyte-macrophage) |
| chr12_-_95467356 | 0.29 |
ENST00000393101.3
ENST00000333003.5 |
NR2C1
|
nuclear receptor subfamily 2, group C, member 1 |
| chr5_+_76248538 | 0.22 |
ENST00000274368.4
|
CRHBP
|
corticotropin releasing hormone binding protein |
| chr11_-_102709441 | 0.20 |
ENST00000434103.1
|
MMP3
|
matrix metallopeptidase 3 (stromelysin 1, progelatinase) |
| chr13_-_72441315 | 0.16 |
ENST00000305425.4
ENST00000313174.7 ENST00000354591.4 |
DACH1
|
dachshund homolog 1 (Drosophila) |
| chr5_-_125930929 | 0.14 |
ENST00000553117.1
ENST00000447989.2 ENST00000409134.3 |
ALDH7A1
|
aldehyde dehydrogenase 7 family, member A1 |
| chr16_+_83841448 | 0.07 |
ENST00000433866.2
|
HSBP1
|
heat shock factor binding protein 1 |
| chr19_+_36203830 | 0.03 |
ENST00000262630.3
|
ZBTB32
|
zinc finger and BTB domain containing 32 |
| chr6_+_10585979 | 0.02 |
ENST00000265012.4
|
GCNT2
|
glucosaminyl (N-acetyl) transferase 2, I-branching enzyme (I blood group) |
| chr4_-_8430152 | 0.01 |
ENST00000514423.1
ENST00000503233.1 |
ACOX3
|
acyl-CoA oxidase 3, pristanoyl |
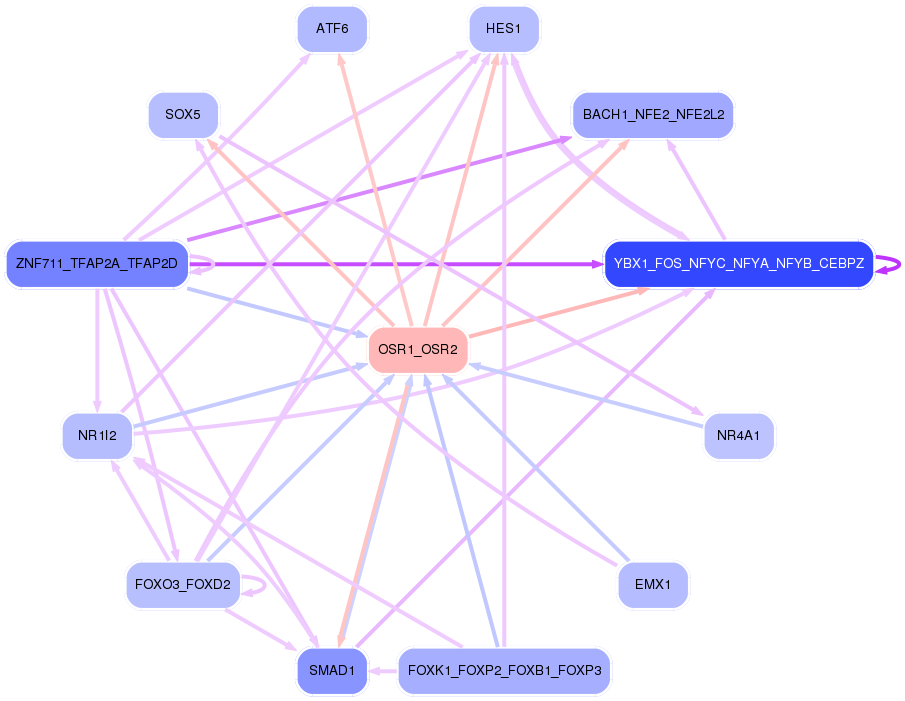
Network of associatons between targets according to the STRING database.

First level regulatory network of OSR1_OSR2
Gene Ontology Analysis
Gene overrepresentation in biological_process category:
| Log-likelihood per target | Total log-likelihood | Term | Description |
|---|---|---|---|
| 25.8 | 77.5 | GO:0031660 | regulation of cyclin-dependent protein serine/threonine kinase activity involved in G2/M transition of mitotic cell cycle(GO:0031660) positive regulation of cyclin-dependent protein serine/threonine kinase activity involved in G2/M transition of mitotic cell cycle(GO:0031662) response to DDT(GO:0046680) histone H3-S10 phosphorylation involved in chromosome condensation(GO:2000775) |
| 14.7 | 44.2 | GO:0006428 | isoleucyl-tRNA aminoacylation(GO:0006428) |
| 7.0 | 27.9 | GO:0044837 | assembly of actomyosin apparatus involved in cytokinesis(GO:0000912) actomyosin contractile ring assembly(GO:0000915) actomyosin contractile ring organization(GO:0044837) |
| 5.1 | 30.9 | GO:0055129 | proline biosynthetic process(GO:0006561) L-proline biosynthetic process(GO:0055129) |
| 4.3 | 17.0 | GO:0010796 | regulation of multivesicular body size(GO:0010796) |
| 3.0 | 9.0 | GO:0046504 | ether lipid biosynthetic process(GO:0008611) glycerol ether biosynthetic process(GO:0046504) ether biosynthetic process(GO:1901503) |
| 2.5 | 7.6 | GO:1903033 | regulation of microtubule plus-end binding(GO:1903031) positive regulation of microtubule plus-end binding(GO:1903033) |
| 2.4 | 11.8 | GO:0071460 | cellular response to cell-matrix adhesion(GO:0071460) |
| 2.3 | 11.4 | GO:0048478 | replication fork protection(GO:0048478) |
| 2.2 | 6.7 | GO:0016095 | polyprenol catabolic process(GO:0016095) |
| 2.0 | 9.8 | GO:0016321 | female meiosis chromosome segregation(GO:0016321) |
| 1.9 | 9.7 | GO:1903862 | positive regulation of oxidative phosphorylation(GO:1903862) |
| 1.7 | 7.0 | GO:0019087 | transformation of host cell by virus(GO:0019087) |
| 1.6 | 4.7 | GO:0006711 | estrogen catabolic process(GO:0006711) |
| 1.5 | 19.2 | GO:0033617 | mitochondrial respiratory chain complex IV assembly(GO:0033617) mitochondrial respiratory chain complex IV biogenesis(GO:0097034) |
| 1.5 | 4.4 | GO:0021558 | midbrain-hindbrain boundary morphogenesis(GO:0021555) trochlear nerve development(GO:0021558) regulation of timing of neuron differentiation(GO:0060164) |
| 1.4 | 5.8 | GO:0043387 | mycotoxin catabolic process(GO:0043387) aflatoxin catabolic process(GO:0046223) organic heteropentacyclic compound catabolic process(GO:1901377) regulation of glutathione biosynthetic process(GO:1903786) positive regulation of glutathione biosynthetic process(GO:1903788) |
| 1.3 | 7.8 | GO:0071475 | cellular hyperosmotic salinity response(GO:0071475) |
| 1.2 | 4.9 | GO:0071461 | cellular response to redox state(GO:0071461) |
| 1.2 | 8.6 | GO:0098501 | polynucleotide dephosphorylation(GO:0098501) |
| 1.1 | 3.4 | GO:0016999 | antibiotic metabolic process(GO:0016999) cellular amide catabolic process(GO:0043605) |
| 1.1 | 6.6 | GO:0007386 | compartment pattern specification(GO:0007386) |
| 1.0 | 5.2 | GO:0045541 | negative regulation of cholesterol biosynthetic process(GO:0045541) negative regulation of cholesterol metabolic process(GO:0090206) |
| 1.0 | 6.1 | GO:0055059 | asymmetric neuroblast division(GO:0055059) |
| 0.8 | 4.6 | GO:0035694 | mitochondrial protein catabolic process(GO:0035694) |
| 0.7 | 3.6 | GO:0060356 | leucine import(GO:0060356) |
| 0.7 | 2.9 | GO:0070131 | positive regulation of mitochondrial translation(GO:0070131) |
| 0.7 | 1.4 | GO:0043328 | protein targeting to vacuole involved in ubiquitin-dependent protein catabolic process via the multivesicular body sorting pathway(GO:0043328) |
| 0.7 | 51.2 | GO:0070125 | mitochondrial translational elongation(GO:0070125) mitochondrial translational termination(GO:0070126) |
| 0.7 | 2.1 | GO:0048146 | positive regulation of fibroblast proliferation(GO:0048146) |
| 0.7 | 7.2 | GO:0034501 | protein localization to kinetochore(GO:0034501) |
| 0.6 | 3.8 | GO:0051342 | regulation of cyclic nucleotide catabolic process(GO:0030805) regulation of cAMP catabolic process(GO:0030820) regulation of purine nucleotide catabolic process(GO:0033121) regulation of cyclic-nucleotide phosphodiesterase activity(GO:0051342) negative regulation of cyclic-nucleotide phosphodiesterase activity(GO:0051344) |
| 0.6 | 6.5 | GO:0010815 | bradykinin catabolic process(GO:0010815) |
| 0.5 | 4.3 | GO:1903748 | negative regulation of establishment of protein localization to mitochondrion(GO:1903748) |
| 0.5 | 5.8 | GO:0042492 | gamma-delta T cell differentiation(GO:0042492) |
| 0.5 | 14.5 | GO:0000470 | maturation of LSU-rRNA(GO:0000470) |
| 0.4 | 7.0 | GO:0060965 | negative regulation of gene silencing by miRNA(GO:0060965) |
| 0.4 | 2.2 | GO:0006990 | positive regulation of transcription from RNA polymerase II promoter involved in unfolded protein response(GO:0006990) |
| 0.4 | 6.7 | GO:0060628 | regulation of ER to Golgi vesicle-mediated transport(GO:0060628) |
| 0.4 | 8.9 | GO:0031163 | iron-sulfur cluster assembly(GO:0016226) metallo-sulfur cluster assembly(GO:0031163) |
| 0.4 | 2.8 | GO:0070885 | positive regulation of sodium:proton antiporter activity(GO:0032417) negative regulation of calcineurin-NFAT signaling cascade(GO:0070885) |
| 0.3 | 9.8 | GO:0034080 | CENP-A containing nucleosome assembly(GO:0034080) CENP-A containing chromatin organization(GO:0061641) |
| 0.3 | 5.7 | GO:0035518 | histone H2A monoubiquitination(GO:0035518) |
| 0.3 | 1.9 | GO:0071816 | tail-anchored membrane protein insertion into ER membrane(GO:0071816) |
| 0.3 | 2.3 | GO:0002051 | osteoblast fate commitment(GO:0002051) |
| 0.3 | 4.8 | GO:0046069 | cGMP catabolic process(GO:0046069) |
| 0.3 | 1.0 | GO:0042357 | thiamine diphosphate metabolic process(GO:0042357) |
| 0.2 | 6.3 | GO:0000042 | protein targeting to Golgi(GO:0000042) |
| 0.2 | 12.8 | GO:0008631 | intrinsic apoptotic signaling pathway in response to oxidative stress(GO:0008631) |
| 0.2 | 19.4 | GO:0035722 | interleukin-12-mediated signaling pathway(GO:0035722) cellular response to interleukin-12(GO:0071349) |
| 0.2 | 0.7 | GO:0007518 | myoblast fate determination(GO:0007518) |
| 0.2 | 0.9 | GO:0019918 | peptidyl-arginine methylation, to symmetrical-dimethyl arginine(GO:0019918) |
| 0.2 | 4.5 | GO:0015937 | coenzyme A biosynthetic process(GO:0015937) |
| 0.2 | 12.8 | GO:0006120 | mitochondrial electron transport, NADH to ubiquinone(GO:0006120) |
| 0.2 | 9.2 | GO:0006270 | DNA replication initiation(GO:0006270) |
| 0.2 | 6.6 | GO:0008210 | estrogen metabolic process(GO:0008210) |
| 0.1 | 12.9 | GO:0042246 | tissue regeneration(GO:0042246) |
| 0.1 | 2.0 | GO:0034372 | very-low-density lipoprotein particle remodeling(GO:0034372) |
| 0.1 | 0.4 | GO:0038043 | interleukin-5-mediated signaling pathway(GO:0038043) |
| 0.1 | 5.8 | GO:0000387 | spliceosomal snRNP assembly(GO:0000387) |
| 0.1 | 1.8 | GO:0010172 | embryonic body morphogenesis(GO:0010172) |
| 0.1 | 1.9 | GO:0033141 | positive regulation of peptidyl-serine phosphorylation of STAT protein(GO:0033141) |
| 0.1 | 26.2 | GO:0007018 | microtubule-based movement(GO:0007018) |
| 0.1 | 0.5 | GO:0051552 | flavone metabolic process(GO:0051552) |
| 0.1 | 9.2 | GO:0036498 | IRE1-mediated unfolded protein response(GO:0036498) |
| 0.1 | 0.5 | GO:0006021 | inositol biosynthetic process(GO:0006021) |
| 0.1 | 4.7 | GO:0006890 | retrograde vesicle-mediated transport, Golgi to ER(GO:0006890) |
| 0.1 | 0.7 | GO:1903599 | positive regulation of mitophagy(GO:1903599) |
| 0.1 | 0.5 | GO:0046654 | tetrahydrofolate biosynthetic process(GO:0046654) |
| 0.1 | 0.4 | GO:0015760 | hexose phosphate transport(GO:0015712) glucose-6-phosphate transport(GO:0015760) |
| 0.1 | 3.6 | GO:0006400 | tRNA modification(GO:0006400) |
| 0.1 | 0.2 | GO:0097210 | cellular response to cocaine(GO:0071314) response to gonadotropin-releasing hormone(GO:0097210) cellular response to gonadotropin-releasing hormone(GO:0097211) |
| 0.0 | 0.9 | GO:0008053 | mitochondrial fusion(GO:0008053) |
| 0.0 | 0.8 | GO:0043562 | cellular response to nitrogen starvation(GO:0006995) cellular response to nitrogen levels(GO:0043562) |
| 0.0 | 0.2 | GO:0010727 | negative regulation of hydrogen peroxide metabolic process(GO:0010727) |
| 0.0 | 0.3 | GO:0048386 | positive regulation of retinoic acid receptor signaling pathway(GO:0048386) |
| 0.0 | 0.9 | GO:2000249 | regulation of actin cytoskeleton reorganization(GO:2000249) |
| 0.0 | 7.4 | GO:0008360 | regulation of cell shape(GO:0008360) |
| 0.0 | 2.9 | GO:0006334 | nucleosome assembly(GO:0006334) |
| 0.0 | 6.0 | GO:0043488 | regulation of mRNA stability(GO:0043488) |
| 0.0 | 21.6 | GO:0000122 | negative regulation of transcription from RNA polymerase II promoter(GO:0000122) |
| 0.0 | 0.1 | GO:0042426 | choline catabolic process(GO:0042426) |
| 0.0 | 0.6 | GO:0090383 | phagosome acidification(GO:0090383) |
| 0.0 | 1.4 | GO:0031338 | regulation of vesicle fusion(GO:0031338) |
| 0.0 | 0.4 | GO:0050690 | regulation of defense response to virus by virus(GO:0050690) |
| 0.0 | 0.6 | GO:0034332 | adherens junction organization(GO:0034332) |
| 0.0 | 0.6 | GO:0007190 | activation of adenylate cyclase activity(GO:0007190) |
| 0.0 | 2.0 | GO:0006939 | smooth muscle contraction(GO:0006939) |
| 0.0 | 2.8 | GO:0044744 | protein import into nucleus(GO:0006606) protein targeting to nucleus(GO:0044744) |
| 0.0 | 10.9 | GO:0045944 | positive regulation of transcription from RNA polymerase II promoter(GO:0045944) |
Gene overrepresentation in cellular_component category:
| Log-likelihood per target | Total log-likelihood | Term | Description |
|---|---|---|---|
| 15.5 | 77.5 | GO:0097125 | cyclin B1-CDK1 complex(GO:0097125) |
| 5.6 | 27.9 | GO:0097149 | centralspindlin complex(GO:0097149) |
| 3.4 | 17.0 | GO:0098837 | postsynaptic recycling endosome(GO:0098837) |
| 3.3 | 9.8 | GO:0000942 | condensed nuclear chromosome outer kinetochore(GO:0000942) |
| 2.1 | 44.2 | GO:0017101 | aminoacyl-tRNA synthetase multienzyme complex(GO:0017101) |
| 1.9 | 51.2 | GO:0000314 | organellar small ribosomal subunit(GO:0000314) mitochondrial small ribosomal subunit(GO:0005763) |
| 1.7 | 5.0 | GO:0000939 | condensed chromosome inner kinetochore(GO:0000939) |
| 1.6 | 7.8 | GO:0043564 | Ku70:Ku80 complex(GO:0043564) |
| 1.5 | 8.9 | GO:0071817 | MMXD complex(GO:0071817) |
| 1.3 | 7.6 | GO:0030981 | cortical microtubule cytoskeleton(GO:0030981) |
| 1.3 | 11.4 | GO:0031298 | replication fork protection complex(GO:0031298) |
| 1.2 | 7.2 | GO:0000940 | condensed chromosome outer kinetochore(GO:0000940) |
| 0.7 | 3.6 | GO:0043527 | tRNA methyltransferase complex(GO:0043527) |
| 0.7 | 5.8 | GO:0097504 | Gemini of coiled bodies(GO:0097504) |
| 0.7 | 19.2 | GO:0031304 | intrinsic component of mitochondrial inner membrane(GO:0031304) integral component of mitochondrial inner membrane(GO:0031305) |
| 0.6 | 4.3 | GO:0098554 | cytoplasmic side of endoplasmic reticulum membrane(GO:0098554) |
| 0.6 | 6.7 | GO:0036513 | Derlin-1 retrotranslocation complex(GO:0036513) |
| 0.5 | 5.5 | GO:0030126 | COPI vesicle coat(GO:0030126) |
| 0.5 | 14.5 | GO:0030687 | preribosome, large subunit precursor(GO:0030687) |
| 0.5 | 7.7 | GO:0030285 | integral component of synaptic vesicle membrane(GO:0030285) intrinsic component of synaptic vesicle membrane(GO:0098563) |
| 0.4 | 7.0 | GO:0031362 | anchored component of external side of plasma membrane(GO:0031362) |
| 0.4 | 6.0 | GO:0045495 | P granule(GO:0043186) pole plasm(GO:0045495) germ plasm(GO:0060293) |
| 0.3 | 4.2 | GO:0005664 | origin recognition complex(GO:0000808) nuclear origin of replication recognition complex(GO:0005664) |
| 0.2 | 9.7 | GO:0000313 | organellar ribosome(GO:0000313) mitochondrial ribosome(GO:0005761) |
| 0.2 | 12.6 | GO:0019005 | SCF ubiquitin ligase complex(GO:0019005) |
| 0.2 | 11.9 | GO:0045171 | intercellular bridge(GO:0045171) |
| 0.2 | 1.4 | GO:0000813 | ESCRT I complex(GO:0000813) |
| 0.2 | 12.8 | GO:0045271 | mitochondrial respiratory chain complex I(GO:0005747) NADH dehydrogenase complex(GO:0030964) respiratory chain complex I(GO:0045271) |
| 0.2 | 2.0 | GO:0097550 | transcriptional preinitiation complex(GO:0097550) |
| 0.2 | 19.8 | GO:0071013 | catalytic step 2 spliceosome(GO:0071013) |
| 0.1 | 0.6 | GO:0034663 | endoplasmic reticulum chaperone complex(GO:0034663) |
| 0.1 | 3.4 | GO:0031528 | microvillus membrane(GO:0031528) |
| 0.1 | 2.3 | GO:0071141 | SMAD protein complex(GO:0071141) |
| 0.1 | 9.8 | GO:0000777 | condensed chromosome kinetochore(GO:0000777) |
| 0.1 | 9.2 | GO:0017053 | transcriptional repressor complex(GO:0017053) |
| 0.1 | 5.7 | GO:0031519 | PcG protein complex(GO:0031519) |
| 0.1 | 4.5 | GO:0005782 | peroxisomal matrix(GO:0005782) microbody lumen(GO:0031907) |
| 0.0 | 17.5 | GO:0005788 | endoplasmic reticulum lumen(GO:0005788) |
| 0.0 | 0.6 | GO:0033180 | proton-transporting V-type ATPase, V1 domain(GO:0033180) |
| 0.0 | 0.8 | GO:0097225 | sperm midpiece(GO:0097225) |
| 0.0 | 18.0 | GO:0005759 | mitochondrial matrix(GO:0005759) |
| 0.0 | 0.4 | GO:0042105 | alpha-beta T cell receptor complex(GO:0042105) |
| 0.0 | 18.4 | GO:0031966 | mitochondrial membrane(GO:0031966) |
| 0.0 | 11.7 | GO:0005938 | cell cortex(GO:0005938) |
| 0.0 | 10.6 | GO:0005819 | spindle(GO:0005819) |
| 0.0 | 4.8 | GO:0032993 | protein-DNA complex(GO:0032993) |
| 0.0 | 0.2 | GO:0043196 | varicosity(GO:0043196) |
| 0.0 | 2.8 | GO:0005793 | endoplasmic reticulum-Golgi intermediate compartment(GO:0005793) |
| 0.0 | 3.6 | GO:0042470 | melanosome(GO:0042470) pigment granule(GO:0048770) |
| 0.0 | 2.6 | GO:0030176 | integral component of endoplasmic reticulum membrane(GO:0030176) |
| 0.0 | 13.6 | GO:0005789 | endoplasmic reticulum membrane(GO:0005789) |
| 0.0 | 1.6 | GO:0016363 | nuclear matrix(GO:0016363) |
| 0.0 | 0.4 | GO:0098802 | plasma membrane receptor complex(GO:0098802) |
Gene overrepresentation in molecular_function category:
| Log-likelihood per target | Total log-likelihood | Term | Description |
|---|---|---|---|
| 14.7 | 44.2 | GO:0004822 | isoleucine-tRNA ligase activity(GO:0004822) |
| 11.1 | 77.5 | GO:0061575 | cyclin-dependent protein serine/threonine kinase activator activity(GO:0061575) |
| 7.7 | 30.9 | GO:0004735 | pyrroline-5-carboxylate reductase activity(GO:0004735) |
| 2.9 | 8.6 | GO:0098519 | nucleotide phosphatase activity, acting on free nucleotides(GO:0098519) |
| 1.8 | 7.2 | GO:0043515 | kinetochore binding(GO:0043515) |
| 1.7 | 7.0 | GO:0033906 | protein tyrosine kinase inhibitor activity(GO:0030292) hyaluronoglucuronidase activity(GO:0033906) |
| 1.7 | 6.7 | GO:0047718 | indanol dehydrogenase activity(GO:0047718) |
| 1.6 | 9.8 | GO:0010997 | anaphase-promoting complex binding(GO:0010997) |
| 0.9 | 27.9 | GO:0043015 | gamma-tubulin binding(GO:0043015) |
| 0.8 | 7.8 | GO:0051575 | 5'-deoxyribose-5-phosphate lyase activity(GO:0051575) |
| 0.7 | 4.8 | GO:0048101 | calcium- and calmodulin-regulated 3',5'-cyclic-GMP phosphodiesterase activity(GO:0048101) |
| 0.7 | 17.0 | GO:0031489 | myosin V binding(GO:0031489) |
| 0.6 | 25.1 | GO:0001106 | RNA polymerase II transcription corepressor activity(GO:0001106) |
| 0.6 | 23.0 | GO:0017025 | TBP-class protein binding(GO:0017025) |
| 0.6 | 6.7 | GO:1904264 | ubiquitin protein ligase activity involved in ERAD pathway(GO:1904264) |
| 0.5 | 9.2 | GO:0003688 | DNA replication origin binding(GO:0003688) |
| 0.5 | 4.9 | GO:0005094 | Rho GDP-dissociation inhibitor activity(GO:0005094) |
| 0.5 | 3.4 | GO:0070573 | metallodipeptidase activity(GO:0070573) |
| 0.4 | 3.1 | GO:0008454 | alpha-1,3-mannosylglycoprotein 4-beta-N-acetylglucosaminyltransferase activity(GO:0008454) |
| 0.4 | 4.3 | GO:0055131 | C3HC4-type RING finger domain binding(GO:0055131) |
| 0.4 | 23.3 | GO:0019894 | kinesin binding(GO:0019894) |
| 0.4 | 14.6 | GO:0015020 | glucuronosyltransferase activity(GO:0015020) |
| 0.4 | 3.6 | GO:0005432 | calcium:sodium antiporter activity(GO:0005432) |
| 0.3 | 5.8 | GO:0016493 | C-C chemokine receptor activity(GO:0016493) |
| 0.3 | 3.8 | GO:0031545 | peptidyl-proline 4-dioxygenase activity(GO:0031545) |
| 0.3 | 6.6 | GO:0005112 | Notch binding(GO:0005112) |
| 0.3 | 7.6 | GO:0051010 | microtubule plus-end binding(GO:0051010) |
| 0.3 | 3.6 | GO:0016423 | tRNA (guanine) methyltransferase activity(GO:0016423) |
| 0.3 | 6.5 | GO:0070006 | metalloaminopeptidase activity(GO:0070006) |
| 0.3 | 4.5 | GO:0070411 | I-SMAD binding(GO:0070411) |
| 0.2 | 5.0 | GO:0035198 | miRNA binding(GO:0035198) |
| 0.2 | 0.9 | GO:0035243 | protein-arginine omega-N symmetric methyltransferase activity(GO:0035243) |
| 0.2 | 0.8 | GO:0004140 | dephospho-CoA kinase activity(GO:0004140) |
| 0.2 | 4.6 | GO:0005521 | lamin binding(GO:0005521) |
| 0.2 | 4.5 | GO:0071949 | FAD binding(GO:0071949) |
| 0.2 | 3.6 | GO:0016881 | acid-amino acid ligase activity(GO:0016881) |
| 0.2 | 13.8 | GO:0004715 | non-membrane spanning protein tyrosine kinase activity(GO:0004715) |
| 0.1 | 0.4 | GO:0061513 | hexose phosphate transmembrane transporter activity(GO:0015119) organophosphate:inorganic phosphate antiporter activity(GO:0015315) hexose-phosphate:inorganic phosphate antiporter activity(GO:0015526) glucose 6-phosphate:inorganic phosphate antiporter activity(GO:0061513) |
| 0.1 | 1.9 | GO:0005132 | type I interferon receptor binding(GO:0005132) |
| 0.1 | 6.9 | GO:0050136 | NADH dehydrogenase (ubiquinone) activity(GO:0008137) NADH dehydrogenase (quinone) activity(GO:0050136) |
| 0.1 | 0.4 | GO:0004914 | interleukin-5 receptor activity(GO:0004914) |
| 0.1 | 1.0 | GO:0016778 | diphosphotransferase activity(GO:0016778) |
| 0.1 | 2.2 | GO:0035497 | cAMP response element binding(GO:0035497) |
| 0.1 | 5.8 | GO:0001205 | transcriptional activator activity, RNA polymerase II distal enhancer sequence-specific binding(GO:0001205) |
| 0.1 | 2.1 | GO:0044548 | S100 protein binding(GO:0044548) |
| 0.1 | 5.9 | GO:0005544 | calcium-dependent phospholipid binding(GO:0005544) |
| 0.1 | 0.5 | GO:0052833 | inositol monophosphate 1-phosphatase activity(GO:0008934) inositol monophosphate 3-phosphatase activity(GO:0052832) inositol monophosphate 4-phosphatase activity(GO:0052833) inositol monophosphate phosphatase activity(GO:0052834) |
| 0.1 | 0.5 | GO:0016882 | cyclo-ligase activity(GO:0016882) |
| 0.1 | 2.0 | GO:0034185 | apolipoprotein binding(GO:0034185) |
| 0.1 | 2.9 | GO:0070577 | lysine-acetylated histone binding(GO:0070577) |
| 0.1 | 5.2 | GO:0015485 | cholesterol binding(GO:0015485) |
| 0.1 | 18.0 | GO:0003735 | structural constituent of ribosome(GO:0003735) |
| 0.1 | 6.0 | GO:0003730 | mRNA 3'-UTR binding(GO:0003730) |
| 0.1 | 8.0 | GO:0042826 | histone deacetylase binding(GO:0042826) |
| 0.1 | 2.8 | GO:0008536 | Ran GTPase binding(GO:0008536) |
| 0.1 | 11.8 | GO:0061630 | ubiquitin protein ligase activity(GO:0061630) |
| 0.0 | 4.2 | GO:0008307 | structural constituent of muscle(GO:0008307) |
| 0.0 | 5.9 | GO:0051082 | unfolded protein binding(GO:0051082) |
| 0.0 | 2.8 | GO:0048306 | calcium-dependent protein binding(GO:0048306) |
| 0.0 | 0.6 | GO:0008179 | adenylate cyclase binding(GO:0008179) |
| 0.0 | 0.8 | GO:0050811 | GABA receptor binding(GO:0050811) |
| 0.0 | 57.6 | GO:0003723 | RNA binding(GO:0003723) |
| 0.0 | 2.1 | GO:0043130 | ubiquitin binding(GO:0043130) |
| 0.0 | 0.6 | GO:0046961 | proton-transporting ATPase activity, rotational mechanism(GO:0046961) |
| 0.0 | 0.3 | GO:0051400 | BH domain binding(GO:0051400) |
| 0.0 | 0.7 | GO:0070888 | E-box binding(GO:0070888) |
| 0.0 | 0.2 | GO:0001075 | transcription factor activity, RNA polymerase II core promoter sequence-specific binding involved in preinitiation complex assembly(GO:0001075) |
| 0.0 | 1.3 | GO:0005070 | SH3/SH2 adaptor activity(GO:0005070) |
| 0.0 | 2.4 | GO:0008022 | protein C-terminus binding(GO:0008022) |
Gene overrepresentation in C2:CP category:
| Log-likelihood per target | Total log-likelihood | Term | Description |
|---|---|---|---|
| 1.3 | 101.1 | PID FOXM1 PATHWAY | FOXM1 transcription factor network |
| 1.0 | 44.2 | ST INTERLEUKIN 4 PATHWAY | Interleukin 4 (IL-4) Pathway |
| 0.6 | 17.0 | PID ARF6 DOWNSTREAM PATHWAY | Arf6 downstream pathway |
| 0.5 | 27.9 | PID CDC42 REG PATHWAY | Regulation of CDC42 activity |
| 0.2 | 7.8 | PID HDAC CLASSIII PATHWAY | Signaling events mediated by HDAC Class III |
| 0.2 | 10.4 | PID ATR PATHWAY | ATR signaling pathway |
| 0.2 | 7.6 | PID NCADHERIN PATHWAY | N-cadherin signaling events |
| 0.1 | 4.4 | PID FANCONI PATHWAY | Fanconi anemia pathway |
| 0.1 | 2.3 | PID ALK2 PATHWAY | ALK2 signaling events |
| 0.1 | 6.6 | PID NOTCH PATHWAY | Notch signaling pathway |
| 0.1 | 3.3 | PID HDAC CLASSII PATHWAY | Signaling events mediated by HDAC Class II |
| 0.1 | 4.6 | PID AR TF PATHWAY | Regulation of Androgen receptor activity |
| 0.1 | 4.9 | PID CASPASE PATHWAY | Caspase cascade in apoptosis |
| 0.1 | 3.7 | PID PI3KCI PATHWAY | Class I PI3K signaling events |
| 0.1 | 0.4 | PID IL5 PATHWAY | IL5-mediated signaling events |
| 0.1 | 3.6 | PID NFAT TFPATHWAY | Calcineurin-regulated NFAT-dependent transcription in lymphocytes |
| 0.1 | 10.7 | PID P53 DOWNSTREAM PATHWAY | Direct p53 effectors |
| 0.1 | 1.3 | PID HIF1A PATHWAY | Hypoxic and oxygen homeostasis regulation of HIF-1-alpha |
| 0.0 | 2.3 | PID CD8 TCR DOWNSTREAM PATHWAY | Downstream signaling in naïve CD8+ T cells |
| 0.0 | 2.2 | PID P38 ALPHA BETA DOWNSTREAM PATHWAY | Signaling mediated by p38-alpha and p38-beta |
| 0.0 | 0.6 | SIG INSULIN RECEPTOR PATHWAY IN CARDIAC MYOCYTES | Genes related to the insulin receptor pathway |
Gene overrepresentation in C2:CP:REACTOME category:
| Log-likelihood per target | Total log-likelihood | Term | Description |
|---|---|---|---|
| 5.8 | 86.7 | REACTOME E2F ENABLED INHIBITION OF PRE REPLICATION COMPLEX FORMATION | Genes involved in E2F-enabled inhibition of pre-replication complex formation |
| 1.2 | 44.2 | REACTOME CYTOSOLIC TRNA AMINOACYLATION | Genes involved in Cytosolic tRNA aminoacylation |
| 1.1 | 30.9 | REACTOME AMINO ACID SYNTHESIS AND INTERCONVERSION TRANSAMINATION | Genes involved in Amino acid synthesis and interconversion (transamination) |
| 1.1 | 27.9 | REACTOME KINESINS | Genes involved in Kinesins |
| 0.6 | 14.6 | REACTOME GLUCURONIDATION | Genes involved in Glucuronidation |
| 0.5 | 9.8 | REACTOME CYCLIN A B1 ASSOCIATED EVENTS DURING G2 M TRANSITION | Genes involved in Cyclin A/B1 associated events during G2/M transition |
| 0.4 | 7.0 | REACTOME HYALURONAN UPTAKE AND DEGRADATION | Genes involved in Hyaluronan uptake and degradation |
| 0.3 | 4.5 | REACTOME VITAMIN B5 PANTOTHENATE METABOLISM | Genes involved in Vitamin B5 (pantothenate) metabolism |
| 0.3 | 5.5 | REACTOME INTEGRATION OF PROVIRUS | Genes involved in Integration of provirus |
| 0.3 | 9.0 | REACTOME PEROXISOMAL LIPID METABOLISM | Genes involved in Peroxisomal lipid metabolism |
| 0.3 | 17.0 | REACTOME REGULATION OF WATER BALANCE BY RENAL AQUAPORINS | Genes involved in Regulation of Water Balance by Renal Aquaporins |
| 0.2 | 1.4 | REACTOME MEMBRANE BINDING AND TARGETTING OF GAG PROTEINS | Genes involved in Membrane binding and targetting of GAG proteins |
| 0.2 | 11.1 | REACTOME METABOLISM OF NON CODING RNA | Genes involved in Metabolism of non-coding RNA |
| 0.2 | 17.4 | REACTOME MITOTIC PROMETAPHASE | Genes involved in Mitotic Prometaphase |
| 0.2 | 11.8 | REACTOME G1 PHASE | Genes involved in G1 Phase |
| 0.2 | 4.8 | REACTOME CA DEPENDENT EVENTS | Genes involved in Ca-dependent events |
| 0.2 | 3.3 | REACTOME TGF BETA RECEPTOR SIGNALING IN EMT EPITHELIAL TO MESENCHYMAL TRANSITION | Genes involved in TGF-beta receptor signaling in EMT (epithelial to mesenchymal transition) |
| 0.2 | 2.2 | REACTOME ACTIVATION OF CHAPERONE GENES BY ATF6 ALPHA | Genes involved in Activation of Chaperone Genes by ATF6-alpha |
| 0.1 | 21.0 | REACTOME MRNA SPLICING | Genes involved in mRNA Splicing |
| 0.1 | 3.1 | REACTOME N GLYCAN ANTENNAE ELONGATION | Genes involved in N-Glycan antennae elongation |
| 0.1 | 9.2 | REACTOME ACTIVATION OF CHAPERONE GENES BY XBP1S | Genes involved in Activation of Chaperone Genes by XBP1(S) |
| 0.1 | 4.4 | REACTOME REGULATION OF BETA CELL DEVELOPMENT | Genes involved in Regulation of beta-cell development |
| 0.1 | 2.0 | REACTOME CHYLOMICRON MEDIATED LIPID TRANSPORT | Genes involved in Chylomicron-mediated lipid transport |
| 0.1 | 3.6 | REACTOME BASIGIN INTERACTIONS | Genes involved in Basigin interactions |
| 0.1 | 6.9 | REACTOME RESPIRATORY ELECTRON TRANSPORT | Genes involved in Respiratory electron transport |
| 0.1 | 1.3 | REACTOME OXYGEN DEPENDENT PROLINE HYDROXYLATION OF HYPOXIA INDUCIBLE FACTOR ALPHA | Genes involved in Oxygen-dependent Proline Hydroxylation of Hypoxia-inducible Factor Alpha |
| 0.1 | 2.3 | REACTOME SIGNALING BY BMP | Genes involved in Signaling by BMP |
| 0.1 | 1.9 | REACTOME REGULATION OF IFNA SIGNALING | Genes involved in Regulation of IFNA signaling |
| 0.0 | 2.0 | REACTOME NUCLEAR SIGNALING BY ERBB4 | Genes involved in Nuclear signaling by ERBB4 |
| 0.0 | 1.6 | REACTOME SIGNALING BY ROBO RECEPTOR | Genes involved in Signaling by Robo receptor |
| 0.0 | 0.5 | REACTOME PURINE RIBONUCLEOSIDE MONOPHOSPHATE BIOSYNTHESIS | Genes involved in Purine ribonucleoside monophosphate biosynthesis |
| 0.0 | 4.9 | REACTOME SIGNALING BY RHO GTPASES | Genes involved in Signaling by Rho GTPases |
| 0.0 | 0.6 | REACTOME INSULIN RECEPTOR RECYCLING | Genes involved in Insulin receptor recycling |
| 0.0 | 1.3 | REACTOME CHEMOKINE RECEPTORS BIND CHEMOKINES | Genes involved in Chemokine receptors bind chemokines |
| 0.0 | 0.4 | REACTOME TRANSLOCATION OF ZAP 70 TO IMMUNOLOGICAL SYNAPSE | Genes involved in Translocation of ZAP-70 to Immunological synapse |
| 0.0 | 0.6 | REACTOME ADHERENS JUNCTIONS INTERACTIONS | Genes involved in Adherens junctions interactions |
| 0.0 | 0.4 | REACTOME IL RECEPTOR SHC SIGNALING | Genes involved in Interleukin receptor SHC signaling |