Project
GNF SymAtlas + NCI-60 cancer cell lines, comparison of cancers vs non-cancers, human (Su, 2004; Ross, 2000)
Navigation
Downloads
Results for PAX1_PAX9
Z-value: 0.10
Motif logo
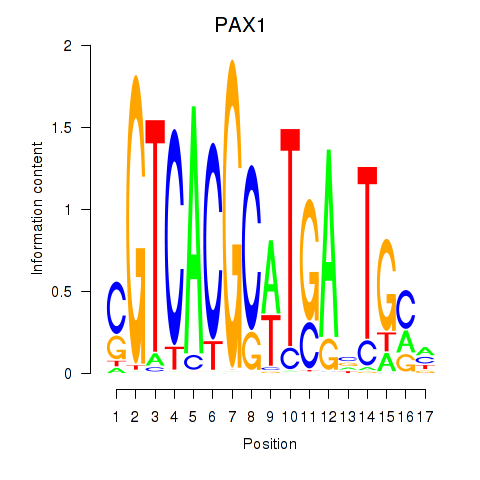
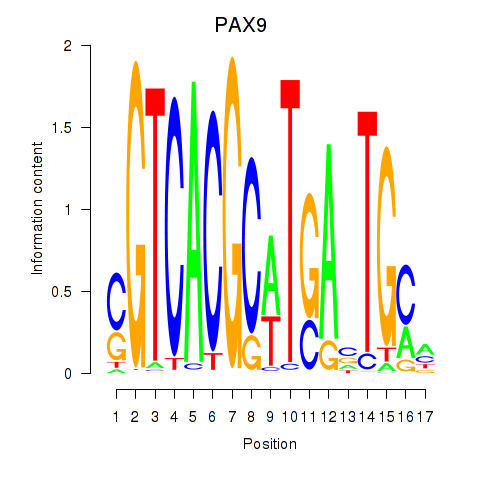
Transcription factors associated with PAX1_PAX9
| Gene Symbol | Gene ID | Gene Info |
|---|---|---|
|
PAX1
|
ENSG00000125813.9 | paired box 1 |
|
PAX9
|
ENSG00000198807.8 | paired box 9 |
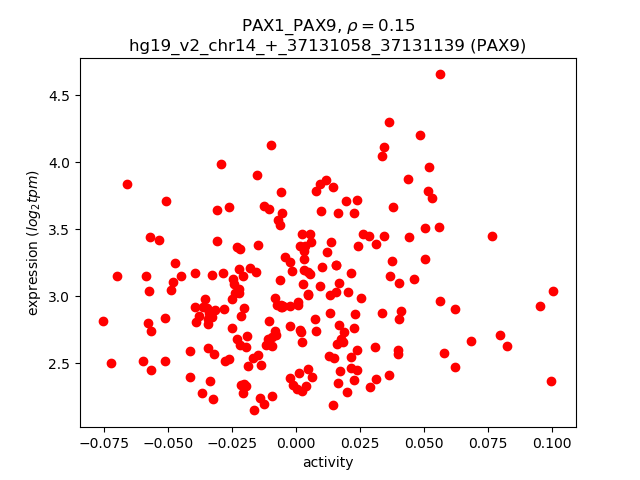
Activity-expression correlation:
| Gene | Promoter | Pearson corr. coef. | P-value | Plot |
|---|---|---|---|---|
| PAX9 | hg19_v2_chr14_+_37131058_37131139, hg19_v2_chr14_+_37126765_37126799 | 0.15 | 3.1e-02 | Click! |
| PAX1 | hg19_v2_chr20_+_21686290_21686311 | -0.03 | 6.2e-01 | Click! |
Activity profile of PAX1_PAX9 motif
Sorted Z-values of PAX1_PAX9 motif
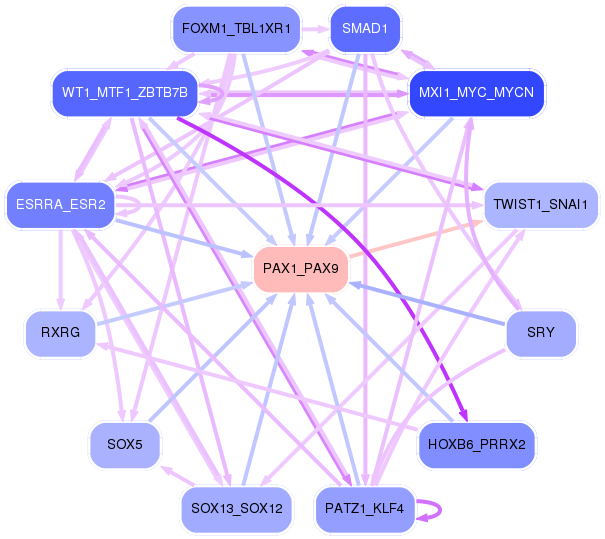
Network of associatons between targets according to the STRING database.

First level regulatory network of PAX1_PAX9
Gene Ontology Analysis
Gene overrepresentation in biological_process category:
| Log-likelihood per target | Total log-likelihood | Term | Description |
|---|---|---|---|
| 2.0 | 6.0 | GO:0042700 | luteinizing hormone signaling pathway(GO:0042700) |
| 1.5 | 10.7 | GO:1904849 | positive regulation of cell chemotaxis to fibroblast growth factor(GO:1904849) positive regulation of endothelial cell chemotaxis to fibroblast growth factor(GO:2000546) |
| 0.9 | 3.6 | GO:0002880 | chronic inflammatory response to non-antigenic stimulus(GO:0002545) regulation of chronic inflammatory response to non-antigenic stimulus(GO:0002880) |
| 0.8 | 19.7 | GO:0009235 | cobalamin metabolic process(GO:0009235) |
| 0.7 | 2.0 | GO:2000276 | negative regulation of peroxisome proliferator activated receptor signaling pathway(GO:0035359) negative regulation of oxidative phosphorylation uncoupler activity(GO:2000276) |
| 0.5 | 1.4 | GO:0000412 | histone peptidyl-prolyl isomerization(GO:0000412) |
| 0.4 | 1.2 | GO:0014022 | neural plate elongation(GO:0014022) convergent extension involved in neural plate elongation(GO:0022007) |
| 0.4 | 6.1 | GO:0090168 | Golgi reassembly(GO:0090168) |
| 0.4 | 1.8 | GO:0033686 | positive regulation of luteinizing hormone secretion(GO:0033686) |
| 0.3 | 1.3 | GO:0061668 | mitochondrial ribosome assembly(GO:0061668) mitochondrial large ribosomal subunit assembly(GO:1902775) |
| 0.2 | 1.3 | GO:0010746 | regulation of plasma membrane long-chain fatty acid transport(GO:0010746) negative regulation of plasma membrane long-chain fatty acid transport(GO:0010748) |
| 0.2 | 1.4 | GO:0042636 | negative regulation of hair cycle(GO:0042636) |
| 0.2 | 5.2 | GO:0032332 | positive regulation of chondrocyte differentiation(GO:0032332) |
| 0.1 | 0.5 | GO:0036343 | psychomotor behavior(GO:0036343) |
| 0.1 | 1.1 | GO:0021853 | cerebral cortex GABAergic interneuron migration(GO:0021853) interneuron migration(GO:1904936) |
| 0.1 | 1.9 | GO:0033141 | positive regulation of peptidyl-serine phosphorylation of STAT protein(GO:0033141) |
| 0.1 | 2.5 | GO:0008045 | motor neuron axon guidance(GO:0008045) |
| 0.1 | 0.7 | GO:0032286 | central nervous system myelin maintenance(GO:0032286) |
| 0.1 | 0.8 | GO:0019317 | fucose catabolic process(GO:0019317) L-fucose metabolic process(GO:0042354) L-fucose catabolic process(GO:0042355) |
| 0.1 | 1.3 | GO:0048012 | hepatocyte growth factor receptor signaling pathway(GO:0048012) |
| 0.0 | 0.5 | GO:0015886 | heme transport(GO:0015886) |
| 0.0 | 2.1 | GO:0045124 | regulation of bone resorption(GO:0045124) |
| 0.0 | 1.4 | GO:2000785 | regulation of autophagosome assembly(GO:2000785) |
| 0.0 | 0.3 | GO:0031584 | activation of phospholipase D activity(GO:0031584) |
| 0.0 | 0.8 | GO:1903861 | positive regulation of dendrite extension(GO:1903861) |
| 0.0 | 0.6 | GO:0022400 | regulation of rhodopsin mediated signaling pathway(GO:0022400) |
| 0.0 | 0.7 | GO:0010501 | RNA secondary structure unwinding(GO:0010501) |
| 0.0 | 0.1 | GO:0045198 | establishment of epithelial cell apical/basal polarity(GO:0045198) |
Gene overrepresentation in cellular_component category:
| Log-likelihood per target | Total log-likelihood | Term | Description |
|---|---|---|---|
| 0.2 | 17.1 | GO:1904724 | tertiary granule lumen(GO:1904724) |
| 0.1 | 0.5 | GO:0046581 | intercellular canaliculus(GO:0046581) |
| 0.1 | 1.4 | GO:0030992 | intraciliary transport particle B(GO:0030992) |
| 0.1 | 1.8 | GO:0090665 | dystrophin-associated glycoprotein complex(GO:0016010) glycoprotein complex(GO:0090665) |
| 0.0 | 1.3 | GO:0031528 | microvillus membrane(GO:0031528) |
| 0.0 | 5.2 | GO:0005604 | basement membrane(GO:0005604) |
| 0.0 | 8.7 | GO:0072562 | blood microparticle(GO:0072562) |
| 0.0 | 1.3 | GO:0009295 | nucleoid(GO:0009295) mitochondrial nucleoid(GO:0042645) |
| 0.0 | 2.0 | GO:0045334 | clathrin-coated endocytic vesicle(GO:0045334) |
| 0.0 | 0.6 | GO:0097381 | photoreceptor disc membrane(GO:0097381) |
| 0.0 | 20.9 | GO:0005615 | extracellular space(GO:0005615) |
Gene overrepresentation in molecular_function category:
| Log-likelihood per target | Total log-likelihood | Term | Description |
|---|---|---|---|
| 0.7 | 2.1 | GO:0042015 | interleukin-20 binding(GO:0042015) |
| 0.5 | 3.6 | GO:0001609 | G-protein coupled adenosine receptor activity(GO:0001609) |
| 0.5 | 5.2 | GO:0070492 | oligosaccharide binding(GO:0070492) |
| 0.4 | 10.7 | GO:0005104 | fibroblast growth factor receptor binding(GO:0005104) |
| 0.3 | 1.3 | GO:0001594 | trace-amine receptor activity(GO:0001594) |
| 0.2 | 0.8 | GO:0017060 | 3-galactosyl-N-acetylglucosaminide 4-alpha-L-fucosyltransferase activity(GO:0017060) |
| 0.1 | 1.9 | GO:0005132 | type I interferon receptor binding(GO:0005132) |
| 0.1 | 6.0 | GO:0005154 | epidermal growth factor receptor binding(GO:0005154) |
| 0.1 | 20.2 | GO:0004252 | serine-type endopeptidase activity(GO:0004252) |
| 0.0 | 1.4 | GO:0005527 | macrolide binding(GO:0005527) FK506 binding(GO:0005528) |
| 0.0 | 0.5 | GO:0015232 | heme transporter activity(GO:0015232) |
| 0.0 | 1.8 | GO:0071855 | neuropeptide receptor binding(GO:0071855) |
| 0.0 | 2.0 | GO:0043425 | bHLH transcription factor binding(GO:0043425) |
| 0.0 | 1.2 | GO:0005109 | frizzled binding(GO:0005109) |
| 0.0 | 6.1 | GO:0044325 | ion channel binding(GO:0044325) |
| 0.0 | 0.4 | GO:0017034 | Rap guanyl-nucleotide exchange factor activity(GO:0017034) |
| 0.0 | 2.5 | GO:0005070 | SH3/SH2 adaptor activity(GO:0005070) |
| 0.0 | 0.6 | GO:0047555 | 3',5'-cyclic-GMP phosphodiesterase activity(GO:0047555) |
| 0.0 | 1.8 | GO:0030165 | PDZ domain binding(GO:0030165) |
| 0.0 | 0.8 | GO:0001786 | phosphatidylserine binding(GO:0001786) |
| 0.0 | 1.4 | GO:0005262 | calcium channel activity(GO:0005262) |
Gene overrepresentation in C2:CP category:
| Log-likelihood per target | Total log-likelihood | Term | Description |
|---|---|---|---|
| 0.2 | 6.0 | PID ERBB NETWORK PATHWAY | ErbB receptor signaling network |
| 0.2 | 10.7 | PID GLYPICAN 1PATHWAY | Glypican 1 network |
| 0.2 | 7.3 | PID INSULIN GLUCOSE PATHWAY | Insulin-mediated glucose transport |
| 0.1 | 22.6 | NABA ECM REGULATORS | Genes encoding enzymes and their regulators involved in the remodeling of the extracellular matrix |
| 0.0 | 2.0 | PID HIF2PATHWAY | HIF-2-alpha transcription factor network |
| 0.0 | 1.2 | PID BETA CATENIN DEG PATHWAY | Degradation of beta catenin |
| 0.0 | 2.5 | PID RAC1 REG PATHWAY | Regulation of RAC1 activity |
| 0.0 | 3.6 | PID CMYB PATHWAY | C-MYB transcription factor network |
| 0.0 | 1.4 | PID HEDGEHOG GLI PATHWAY | Hedgehog signaling events mediated by Gli proteins |
| 0.0 | 0.6 | PID RHODOPSIN PATHWAY | Visual signal transduction: Rods |
| 0.0 | 1.3 | PID MET PATHWAY | Signaling events mediated by Hepatocyte Growth Factor Receptor (c-Met) |
Gene overrepresentation in C2:CP:REACTOME category:
| Log-likelihood per target | Total log-likelihood | Term | Description |
|---|---|---|---|
| 0.8 | 10.7 | REACTOME SIGNALING BY FGFR3 MUTANTS | Genes involved in Signaling by FGFR3 mutants |
| 0.2 | 6.1 | REACTOME DESTABILIZATION OF MRNA BY KSRP | Genes involved in Destabilization of mRNA by KSRP |
| 0.2 | 1.3 | REACTOME NEGATIVE REGULATION OF THE PI3K AKT NETWORK | Genes involved in Negative regulation of the PI3K/AKT network |
| 0.2 | 6.0 | REACTOME SHC1 EVENTS IN ERBB4 SIGNALING | Genes involved in SHC1 events in ERBB4 signaling |
| 0.1 | 3.6 | REACTOME NUCLEOTIDE LIKE PURINERGIC RECEPTORS | Genes involved in Nucleotide-like (purinergic) receptors |
| 0.1 | 2.6 | REACTOME DEGRADATION OF THE EXTRACELLULAR MATRIX | Genes involved in Degradation of the extracellular matrix |
| 0.0 | 1.2 | REACTOME SIGNALING BY HIPPO | Genes involved in Signaling by Hippo |
| 0.0 | 0.4 | REACTOME GLYCOPROTEIN HORMONES | Genes involved in Glycoprotein hormones |
| 0.0 | 1.3 | REACTOME AMINE LIGAND BINDING RECEPTORS | Genes involved in Amine ligand-binding receptors |
| 0.0 | 0.5 | REACTOME SYNTHESIS SECRETION AND INACTIVATION OF GIP | Genes involved in Synthesis, Secretion, and Inactivation of Glucose-dependent Insulinotropic Polypeptide (GIP) |
| 0.0 | 0.6 | REACTOME CGMP EFFECTS | Genes involved in cGMP effects |
| 0.0 | 0.5 | REACTOME IRON UPTAKE AND TRANSPORT | Genes involved in Iron uptake and transport |