Project
GNF SymAtlas + NCI-60 cancer cell lines, comparison of cancers vs non-cancers, human (Su, 2004; Ross, 2000)
Navigation
Downloads
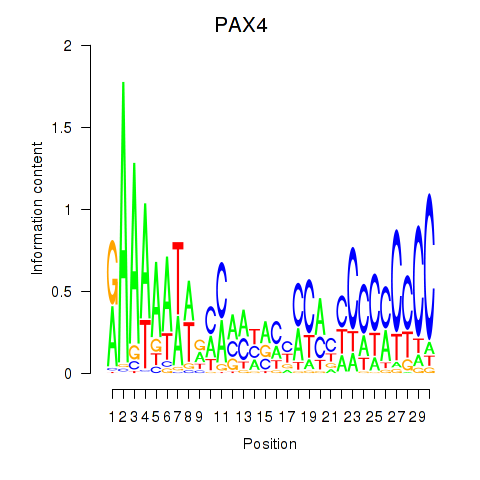
Results for PAX4
Z-value: 0.55
Motif logo
Transcription factors associated with PAX4
| Gene Symbol | Gene ID | Gene Info |
|---|---|---|
|
PAX4
|
ENSG00000106331.10 | paired box 4 |
Activity-expression correlation:
| Gene | Promoter | Pearson corr. coef. | P-value | Plot |
|---|---|---|---|---|
| PAX4 | hg19_v2_chr7_-_127255724_127255780 | -0.10 | 1.3e-01 | Click! |
Activity profile of PAX4 motif
Sorted Z-values of PAX4 motif
| Promoter | Log-likelihood | Transcript | Gene | Gene Info |
|---|---|---|---|---|
| chr6_+_32407619 | 30.34 |
ENST00000395388.2
ENST00000374982.5 |
HLA-DRA
|
major histocompatibility complex, class II, DR alpha |
| chr4_-_84030996 | 27.88 |
ENST00000411416.2
|
PLAC8
|
placenta-specific 8 |
| chr1_+_26644441 | 22.52 |
ENST00000374213.2
|
CD52
|
CD52 molecule |
| chr2_-_136875712 | 21.54 |
ENST00000241393.3
|
CXCR4
|
chemokine (C-X-C motif) receptor 4 |
| chr6_+_32605195 | 21.53 |
ENST00000374949.2
|
HLA-DQA1
|
major histocompatibility complex, class II, DQ alpha 1 |
| chr7_+_80267973 | 19.17 |
ENST00000394788.3
ENST00000447544.2 |
CD36
|
CD36 molecule (thrombospondin receptor) |
| chr2_-_136873735 | 18.65 |
ENST00000409817.1
|
CXCR4
|
chemokine (C-X-C motif) receptor 4 |
| chr6_+_31553901 | 16.02 |
ENST00000418507.2
ENST00000438075.2 ENST00000376100.3 ENST00000376111.4 |
LST1
|
leukocyte specific transcript 1 |
| chr22_+_23229960 | 15.40 |
ENST00000526893.1
ENST00000532223.2 ENST00000531372.1 |
IGLL5
|
immunoglobulin lambda-like polypeptide 5 |
| chr6_+_31553978 | 15.23 |
ENST00000376096.1
ENST00000376099.1 ENST00000376110.3 |
LST1
|
leukocyte specific transcript 1 |
| chr6_+_32605134 | 13.54 |
ENST00000343139.5
ENST00000395363.1 ENST00000496318.1 |
HLA-DQA1
|
major histocompatibility complex, class II, DQ alpha 1 |
| chr1_-_153348067 | 13.07 |
ENST00000368737.3
|
S100A12
|
S100 calcium binding protein A12 |
| chr11_+_1874200 | 12.24 |
ENST00000311604.3
|
LSP1
|
lymphocyte-specific protein 1 |
| chr1_-_151032040 | 11.13 |
ENST00000540998.1
ENST00000357235.5 |
CDC42SE1
|
CDC42 small effector 1 |
| chr18_-_53089723 | 10.72 |
ENST00000561992.1
ENST00000562512.2 |
TCF4
|
transcription factor 4 |
| chr6_-_25042231 | 10.54 |
ENST00000510784.2
|
FAM65B
|
family with sequence similarity 65, member B |
| chr9_+_134103496 | 10.54 |
ENST00000498010.1
ENST00000476004.1 ENST00000528406.1 |
NUP214
|
nucleoporin 214kDa |
| chr1_-_25291475 | 9.82 |
ENST00000338888.3
ENST00000399916.1 |
RUNX3
|
runt-related transcription factor 3 |
| chr19_+_55141861 | 9.28 |
ENST00000396327.3
ENST00000324602.7 ENST00000434867.2 |
LILRB1
|
leukocyte immunoglobulin-like receptor, subfamily B (with TM and ITIM domains), member 1 |
| chr7_-_139763521 | 9.00 |
ENST00000263549.3
|
PARP12
|
poly (ADP-ribose) polymerase family, member 12 |
| chr16_-_28621312 | 8.77 |
ENST00000314752.7
|
SULT1A1
|
sulfotransferase family, cytosolic, 1A, phenol-preferring, member 1 |
| chr19_+_55141948 | 8.68 |
ENST00000396332.4
ENST00000427581.2 |
LILRB1
|
leukocyte immunoglobulin-like receptor, subfamily B (with TM and ITIM domains), member 1 |
| chr17_+_47448102 | 8.36 |
ENST00000576461.1
|
RP11-81K2.1
|
Uncharacterized protein |
| chr6_+_31554456 | 8.23 |
ENST00000339530.4
|
LST1
|
leukocyte specific transcript 1 |
| chr18_-_53255766 | 8.07 |
ENST00000566286.1
ENST00000564999.1 ENST00000566279.1 ENST00000354452.3 ENST00000356073.4 |
TCF4
|
transcription factor 4 |
| chr22_-_39151463 | 7.48 |
ENST00000405510.1
ENST00000433561.1 |
SUN2
|
Sad1 and UNC84 domain containing 2 |
| chr8_+_41347915 | 7.38 |
ENST00000518270.1
ENST00000520817.1 |
GOLGA7
|
golgin A7 |
| chr6_+_31554612 | 7.37 |
ENST00000211921.7
|
LST1
|
leukocyte specific transcript 1 |
| chr19_-_54784937 | 7.26 |
ENST00000434421.1
ENST00000314446.5 ENST00000391749.4 |
LILRB2
|
leukocyte immunoglobulin-like receptor, subfamily B (with TM and ITIM domains), member 2 |
| chr6_-_90062543 | 7.24 |
ENST00000435041.2
|
UBE2J1
|
ubiquitin-conjugating enzyme E2, J1 |
| chr16_+_69958887 | 7.02 |
ENST00000568684.1
|
WWP2
|
WW domain containing E3 ubiquitin protein ligase 2 |
| chr17_+_43299241 | 6.98 |
ENST00000328118.3
|
FMNL1
|
formin-like 1 |
| chr7_+_69064300 | 6.67 |
ENST00000342771.4
|
AUTS2
|
autism susceptibility candidate 2 |
| chr16_-_28621298 | 6.67 |
ENST00000566189.1
|
SULT1A1
|
sulfotransferase family, cytosolic, 1A, phenol-preferring, member 1 |
| chr6_+_15246501 | 6.56 |
ENST00000341776.2
|
JARID2
|
jumonji, AT rich interactive domain 2 |
| chr16_-_28621353 | 6.50 |
ENST00000567512.1
|
SULT1A1
|
sulfotransferase family, cytosolic, 1A, phenol-preferring, member 1 |
| chr11_-_93276582 | 6.41 |
ENST00000298966.2
|
SMCO4
|
single-pass membrane protein with coiled-coil domains 4 |
| chr8_+_41348072 | 6.41 |
ENST00000405786.2
|
GOLGA7
|
golgin A7 |
| chr1_-_1624083 | 6.41 |
ENST00000378662.1
ENST00000234800.6 |
SLC35E2B
|
solute carrier family 35, member E2B |
| chr1_+_101702417 | 6.33 |
ENST00000305352.6
|
S1PR1
|
sphingosine-1-phosphate receptor 1 |
| chr9_-_20622478 | 6.00 |
ENST00000355930.6
ENST00000380338.4 |
MLLT3
|
myeloid/lymphoid or mixed-lineage leukemia (trithorax homolog, Drosophila); translocated to, 3 |
| chr7_-_137686791 | 5.87 |
ENST00000452463.1
ENST00000330387.6 ENST00000456390.1 |
CREB3L2
|
cAMP responsive element binding protein 3-like 2 |
| chr8_-_145653885 | 5.49 |
ENST00000531032.1
ENST00000292510.4 ENST00000377348.2 ENST00000530790.1 ENST00000533806.1 |
VPS28
|
vacuolar protein sorting 28 homolog (S. cerevisiae) |
| chr7_-_37488834 | 5.49 |
ENST00000310758.4
|
ELMO1
|
engulfment and cell motility 1 |
| chrX_+_47004599 | 5.44 |
ENST00000329236.7
|
RBM10
|
RNA binding motif protein 10 |
| chrX_+_47004639 | 5.10 |
ENST00000345781.6
|
RBM10
|
RNA binding motif protein 10 |
| chr8_-_21771182 | 4.99 |
ENST00000523932.1
ENST00000544659.1 |
DOK2
|
docking protein 2, 56kDa |
| chr7_+_66386204 | 4.96 |
ENST00000341567.4
ENST00000607045.1 |
TMEM248
|
transmembrane protein 248 |
| chr3_+_69134124 | 4.92 |
ENST00000478935.1
|
ARL6IP5
|
ADP-ribosylation-like factor 6 interacting protein 5 |
| chr1_+_231376941 | 4.76 |
ENST00000436239.1
ENST00000366647.4 ENST00000366646.3 ENST00000416000.1 |
GNPAT
|
glyceronephosphate O-acyltransferase |
| chr8_-_21771214 | 4.74 |
ENST00000276420.4
|
DOK2
|
docking protein 2, 56kDa |
| chr3_-_197476560 | 4.69 |
ENST00000273582.5
|
KIAA0226
|
KIAA0226 |
| chr4_+_47487285 | 4.62 |
ENST00000273859.3
ENST00000504445.1 |
ATP10D
|
ATPase, class V, type 10D |
| chr14_-_50053081 | 4.59 |
ENST00000396020.3
ENST00000245458.6 |
RPS29
|
ribosomal protein S29 |
| chr19_+_14544099 | 4.02 |
ENST00000242783.6
ENST00000586557.1 ENST00000590097.1 |
PKN1
|
protein kinase N1 |
| chr6_+_133135580 | 3.86 |
ENST00000230050.3
|
RPS12
|
ribosomal protein S12 |
| chr22_-_31688431 | 3.68 |
ENST00000402249.3
ENST00000443175.1 ENST00000215912.5 ENST00000441972.1 |
PIK3IP1
|
phosphoinositide-3-kinase interacting protein 1 |
| chr10_+_114135004 | 3.39 |
ENST00000393081.1
|
ACSL5
|
acyl-CoA synthetase long-chain family member 5 |
| chr6_+_31554636 | 3.23 |
ENST00000433492.1
|
LST1
|
leukocyte specific transcript 1 |
| chr7_+_26331541 | 3.20 |
ENST00000416246.1
ENST00000338523.4 ENST00000412416.1 |
SNX10
|
sorting nexin 10 |
| chr20_-_52210368 | 3.06 |
ENST00000371471.2
|
ZNF217
|
zinc finger protein 217 |
| chr11_-_65374430 | 2.99 |
ENST00000532507.1
|
MAP3K11
|
mitogen-activated protein kinase kinase kinase 11 |
| chr19_+_55105085 | 2.99 |
ENST00000251372.3
ENST00000453777.1 |
LILRA1
|
leukocyte immunoglobulin-like receptor, subfamily A (with TM domain), member 1 |
| chr16_-_28608364 | 2.91 |
ENST00000533150.1
|
SULT1A2
|
sulfotransferase family, cytosolic, 1A, phenol-preferring, member 2 |
| chr1_-_182360918 | 2.88 |
ENST00000339526.4
|
GLUL
|
glutamate-ammonia ligase |
| chr1_+_244816371 | 2.86 |
ENST00000263831.7
|
DESI2
|
desumoylating isopeptidase 2 |
| chrX_+_135067576 | 2.80 |
ENST00000370701.1
ENST00000370698.3 ENST00000370695.4 |
SLC9A6
|
solute carrier family 9, subfamily A (NHE6, cation proton antiporter 6), member 6 |
| chr2_-_85839146 | 2.68 |
ENST00000306336.5
ENST00000409734.3 |
C2orf68
|
chromosome 2 open reading frame 68 |
| chr11_-_67211263 | 2.62 |
ENST00000393893.1
|
CORO1B
|
coronin, actin binding protein, 1B |
| chr4_+_140586922 | 2.61 |
ENST00000265498.1
ENST00000506797.1 |
MGST2
|
microsomal glutathione S-transferase 2 |
| chr1_-_182360498 | 2.37 |
ENST00000417584.2
|
GLUL
|
glutamate-ammonia ligase |
| chr7_+_100482595 | 2.33 |
ENST00000448764.1
|
SRRT
|
serrate RNA effector molecule homolog (Arabidopsis) |
| chr1_+_41157361 | 2.29 |
ENST00000427410.2
ENST00000447388.3 ENST00000425457.2 ENST00000453631.1 ENST00000456393.2 |
NFYC
|
nuclear transcription factor Y, gamma |
| chr8_+_21946681 | 2.22 |
ENST00000289921.7
|
FAM160B2
|
family with sequence similarity 160, member B2 |
| chr17_+_33895090 | 2.17 |
ENST00000592381.1
|
RP11-1094M14.11
|
RP11-1094M14.11 |
| chr1_+_12123414 | 2.10 |
ENST00000263932.2
|
TNFRSF8
|
tumor necrosis factor receptor superfamily, member 8 |
| chr5_-_133304473 | 2.03 |
ENST00000231512.3
|
C5orf15
|
chromosome 5 open reading frame 15 |
| chr17_+_16284104 | 1.93 |
ENST00000577958.1
ENST00000302182.3 ENST00000577640.1 |
UBB
|
ubiquitin B |
| chr16_+_50730910 | 1.92 |
ENST00000300589.2
|
NOD2
|
nucleotide-binding oligomerization domain containing 2 |
| chr17_+_16284399 | 1.85 |
ENST00000535788.1
|
UBB
|
ubiquitin B |
| chr2_-_20251744 | 1.85 |
ENST00000175091.4
|
LAPTM4A
|
lysosomal protein transmembrane 4 alpha |
| chr2_-_85555385 | 1.74 |
ENST00000377386.3
|
TGOLN2
|
trans-golgi network protein 2 |
| chr9_-_123676827 | 1.63 |
ENST00000546084.1
|
TRAF1
|
TNF receptor-associated factor 1 |
| chr4_+_492985 | 1.62 |
ENST00000296306.7
ENST00000536264.1 ENST00000310340.5 ENST00000453061.2 ENST00000504346.1 ENST00000503111.1 ENST00000383028.4 ENST00000509768.1 |
PIGG
|
phosphatidylinositol glycan anchor biosynthesis, class G |
| chr22_-_31688381 | 1.56 |
ENST00000487265.2
|
PIK3IP1
|
phosphoinositide-3-kinase interacting protein 1 |
| chr6_-_31697977 | 1.56 |
ENST00000375787.2
|
DDAH2
|
dimethylarginine dimethylaminohydrolase 2 |
| chr2_-_208489707 | 1.50 |
ENST00000448007.2
ENST00000432416.1 ENST00000411432.1 |
METTL21A
|
methyltransferase like 21A |
| chr3_+_39424828 | 1.49 |
ENST00000273158.4
ENST00000431510.1 |
SLC25A38
|
solute carrier family 25, member 38 |
| chrX_-_131623874 | 1.46 |
ENST00000436215.1
|
MBNL3
|
muscleblind-like splicing regulator 3 |
| chr1_-_208084729 | 1.45 |
ENST00000310833.7
ENST00000356522.4 |
CD34
|
CD34 molecule |
| chr2_-_191878162 | 1.40 |
ENST00000540176.1
|
STAT1
|
signal transducer and activator of transcription 1, 91kDa |
| chr19_-_49622348 | 1.36 |
ENST00000408991.2
|
C19orf73
|
chromosome 19 open reading frame 73 |
| chr1_+_21880560 | 1.35 |
ENST00000425315.2
|
ALPL
|
alkaline phosphatase, liver/bone/kidney |
| chrX_+_65384182 | 1.35 |
ENST00000441993.2
ENST00000419594.1 |
HEPH
|
hephaestin |
| chr2_+_99797542 | 1.35 |
ENST00000338148.3
ENST00000512183.2 |
MRPL30
C2orf15
|
mitochondrial ribosomal protein L30 chromosome 2 open reading frame 15 |
| chr5_-_130500922 | 1.34 |
ENST00000513012.1
ENST00000508488.1 ENST00000506908.1 ENST00000304043.5 |
HINT1
|
histidine triad nucleotide binding protein 1 |
| chr2_+_12857043 | 1.31 |
ENST00000381465.2
|
TRIB2
|
tribbles pseudokinase 2 |
| chr18_-_60987220 | 1.31 |
ENST00000398117.1
|
BCL2
|
B-cell CLL/lymphoma 2 |
| chr20_-_44993012 | 1.29 |
ENST00000372229.1
ENST00000372230.5 ENST00000543605.1 ENST00000243896.2 ENST00000317734.8 |
SLC35C2
|
solute carrier family 35 (GDP-fucose transporter), member C2 |
| chr8_+_11666649 | 1.28 |
ENST00000528643.1
ENST00000525777.1 |
FDFT1
|
farnesyl-diphosphate farnesyltransferase 1 |
| chr2_-_87088995 | 1.28 |
ENST00000393759.2
ENST00000349455.3 ENST00000331469.2 ENST00000431506.2 ENST00000393761.2 ENST00000390655.6 |
CD8B
|
CD8b molecule |
| chr12_-_110888103 | 1.22 |
ENST00000426440.1
ENST00000228825.7 |
ARPC3
|
actin related protein 2/3 complex, subunit 3, 21kDa |
| chr5_-_142782862 | 1.19 |
ENST00000415690.2
|
NR3C1
|
nuclear receptor subfamily 3, group C, member 1 (glucocorticoid receptor) |
| chr13_-_46543805 | 1.19 |
ENST00000378921.2
|
ZC3H13
|
zinc finger CCCH-type containing 13 |
| chr17_-_77005801 | 1.16 |
ENST00000392446.5
|
CANT1
|
calcium activated nucleotidase 1 |
| chr11_+_72975559 | 1.14 |
ENST00000349767.2
|
P2RY6
|
pyrimidinergic receptor P2Y, G-protein coupled, 6 |
| chr11_+_20385327 | 1.11 |
ENST00000451739.2
ENST00000532505.1 |
HTATIP2
|
HIV-1 Tat interactive protein 2, 30kDa |
| chrX_-_131623982 | 1.07 |
ENST00000370844.1
|
MBNL3
|
muscleblind-like splicing regulator 3 |
| chr2_+_190526111 | 1.06 |
ENST00000607062.1
ENST00000260952.4 ENST00000425590.1 ENST00000607535.1 ENST00000420250.1 ENST00000606910.1 ENST00000607690.1 ENST00000607829.1 |
ASNSD1
|
asparagine synthetase domain containing 1 |
| chr16_+_14980632 | 1.03 |
ENST00000565655.1
|
NOMO1
|
NODAL modulator 1 |
| chr17_-_77005860 | 0.99 |
ENST00000591773.1
ENST00000588611.1 ENST00000586916.2 ENST00000592033.1 ENST00000588075.1 ENST00000302345.2 ENST00000591811.1 |
CANT1
|
calcium activated nucleotidase 1 |
| chr16_-_28608424 | 0.98 |
ENST00000335715.4
|
SULT1A2
|
sulfotransferase family, cytosolic, 1A, phenol-preferring, member 2 |
| chr10_+_6186847 | 0.96 |
ENST00000536985.1
ENST00000379789.4 |
PFKFB3
|
6-phosphofructo-2-kinase/fructose-2,6-biphosphatase 3 |
| chr11_-_59578202 | 0.95 |
ENST00000300151.4
|
MRPL16
|
mitochondrial ribosomal protein L16 |
| chr11_+_72975524 | 0.95 |
ENST00000540342.1
ENST00000542092.1 |
P2RY6
|
pyrimidinergic receptor P2Y, G-protein coupled, 6 |
| chr8_-_101963677 | 0.93 |
ENST00000395956.3
ENST00000395953.2 |
YWHAZ
|
tyrosine 3-monooxygenase/tryptophan 5-monooxygenase activation protein, zeta |
| chr11_+_72975578 | 0.90 |
ENST00000393592.2
|
P2RY6
|
pyrimidinergic receptor P2Y, G-protein coupled, 6 |
| chr1_+_41157421 | 0.89 |
ENST00000372654.1
|
NFYC
|
nuclear transcription factor Y, gamma |
| chr19_-_49955050 | 0.89 |
ENST00000262265.5
|
PIH1D1
|
PIH1 domain containing 1 |
| chr9_-_100000957 | 0.86 |
ENST00000366109.2
ENST00000607322.1 |
RP11-498P14.5
|
RP11-498P14.5 |
| chr18_+_29769978 | 0.80 |
ENST00000269202.6
ENST00000581447.1 |
MEP1B
|
meprin A, beta |
| chr9_+_130565487 | 0.78 |
ENST00000373225.3
ENST00000431857.1 |
FPGS
|
folylpolyglutamate synthase |
| chr5_-_93447333 | 0.77 |
ENST00000395965.3
ENST00000505869.1 ENST00000509163.1 |
FAM172A
|
family with sequence similarity 172, member A |
| chr8_-_101963482 | 0.77 |
ENST00000419477.2
|
YWHAZ
|
tyrosine 3-monooxygenase/tryptophan 5-monooxygenase activation protein, zeta |
| chrX_+_65384052 | 0.73 |
ENST00000336279.5
ENST00000458621.1 |
HEPH
|
hephaestin |
| chr12_+_100897130 | 0.71 |
ENST00000551379.1
ENST00000188403.7 ENST00000551184.1 |
NR1H4
|
nuclear receptor subfamily 1, group H, member 4 |
| chr1_+_33439268 | 0.67 |
ENST00000594612.1
|
FKSG48
|
FKSG48 |
| chr19_-_52551814 | 0.66 |
ENST00000594154.1
ENST00000598745.1 ENST00000597273.1 |
ZNF432
|
zinc finger protein 432 |
| chr9_+_123970052 | 0.65 |
ENST00000373823.3
|
GSN
|
gelsolin |
| chr21_+_43933946 | 0.64 |
ENST00000352133.2
|
SLC37A1
|
solute carrier family 37 (glucose-6-phosphate transporter), member 1 |
| chr17_+_66521936 | 0.61 |
ENST00000592800.1
|
PRKAR1A
|
protein kinase, cAMP-dependent, regulatory, type I, alpha |
| chr5_-_58882219 | 0.59 |
ENST00000505453.1
ENST00000360047.5 |
PDE4D
|
phosphodiesterase 4D, cAMP-specific |
| chr16_+_53088885 | 0.57 |
ENST00000566029.1
ENST00000447540.1 |
CHD9
|
chromodomain helicase DNA binding protein 9 |
| chr6_-_32806506 | 0.57 |
ENST00000374897.2
ENST00000452392.2 |
TAP2
TAP2
|
transporter 2, ATP-binding cassette, sub-family B (MDR/TAP) Uncharacterized protein |
| chr1_+_21877753 | 0.54 |
ENST00000374832.1
|
ALPL
|
alkaline phosphatase, liver/bone/kidney |
| chr3_-_123339343 | 0.50 |
ENST00000578202.1
|
MYLK
|
myosin light chain kinase |
| chr9_+_70971815 | 0.45 |
ENST00000396392.1
ENST00000396396.1 |
PGM5
|
phosphoglucomutase 5 |
| chr17_-_42295870 | 0.45 |
ENST00000526094.1
ENST00000529383.1 ENST00000530828.1 |
UBTF
|
upstream binding transcription factor, RNA polymerase I |
| chr18_-_5396271 | 0.43 |
ENST00000579951.1
|
EPB41L3
|
erythrocyte membrane protein band 4.1-like 3 |
| chr3_+_9975497 | 0.42 |
ENST00000397170.3
ENST00000383811.3 ENST00000452070.1 ENST00000326434.5 |
CRELD1
|
cysteine-rich with EGF-like domains 1 |
| chr1_-_151319283 | 0.42 |
ENST00000392746.3
|
RFX5
|
regulatory factor X, 5 (influences HLA class II expression) |
| chr6_+_134274322 | 0.41 |
ENST00000367871.1
ENST00000237264.4 |
TBPL1
|
TBP-like 1 |
| chr12_-_13248732 | 0.40 |
ENST00000396302.3
|
GSG1
|
germ cell associated 1 |
| chr19_-_10420459 | 0.38 |
ENST00000403352.1
ENST00000403903.3 |
ZGLP1
|
zinc finger, GATA-like protein 1 |
| chr19_-_4457776 | 0.37 |
ENST00000301281.6
|
UBXN6
|
UBX domain protein 6 |
| chr12_-_113573495 | 0.35 |
ENST00000446861.3
|
RASAL1
|
RAS protein activator like 1 (GAP1 like) |
| chr12_-_13248705 | 0.29 |
ENST00000396310.2
|
GSG1
|
germ cell associated 1 |
| chr11_+_118443098 | 0.29 |
ENST00000392859.3
ENST00000359415.4 ENST00000534182.2 ENST00000264028.4 |
ARCN1
|
archain 1 |
| chr5_-_142783175 | 0.27 |
ENST00000231509.3
ENST00000394464.2 |
NR3C1
|
nuclear receptor subfamily 3, group C, member 1 (glucocorticoid receptor) |
| chr10_+_102295616 | 0.27 |
ENST00000299163.6
|
HIF1AN
|
hypoxia inducible factor 1, alpha subunit inhibitor |
| chr7_-_22259845 | 0.26 |
ENST00000420196.1
|
RAPGEF5
|
Rap guanine nucleotide exchange factor (GEF) 5 |
| chr7_+_72848092 | 0.23 |
ENST00000344575.3
|
FZD9
|
frizzled family receptor 9 |
| chr17_-_26697304 | 0.21 |
ENST00000536498.1
|
VTN
|
vitronectin |
| chr18_+_29027696 | 0.20 |
ENST00000257189.4
|
DSG3
|
desmoglein 3 |
| chr2_+_102972363 | 0.16 |
ENST00000409599.1
|
IL18R1
|
interleukin 18 receptor 1 |
| chr4_-_169931393 | 0.16 |
ENST00000504480.1
ENST00000306193.3 |
CBR4
|
carbonyl reductase 4 |
| chr10_-_71332994 | 0.13 |
ENST00000242462.4
|
NEUROG3
|
neurogenin 3 |
| chr4_+_170541835 | 0.11 |
ENST00000504131.2
|
CLCN3
|
chloride channel, voltage-sensitive 3 |
| chr5_-_32444828 | 0.09 |
ENST00000265069.8
|
ZFR
|
zinc finger RNA binding protein |
| chr7_-_96654133 | 0.07 |
ENST00000486603.2
ENST00000222598.4 |
DLX5
|
distal-less homeobox 5 |
| chr2_+_203879568 | 0.05 |
ENST00000449802.1
|
NBEAL1
|
neurobeachin-like 1 |
| chr8_-_134309335 | 0.03 |
ENST00000522890.1
ENST00000323851.7 ENST00000518176.1 ENST00000354944.5 ENST00000537882.1 ENST00000522476.1 ENST00000518066.1 ENST00000521544.1 ENST00000518480.1 ENST00000523892.1 |
NDRG1
|
N-myc downstream regulated 1 |
Network of associatons between targets according to the STRING database.

First level regulatory network of PAX4
Gene Ontology Analysis
Gene overrepresentation in biological_process category:
| Log-likelihood per target | Total log-likelihood | Term | Description |
|---|---|---|---|
| 7.6 | 30.3 | GO:0002503 | peptide antigen assembly with MHC class II protein complex(GO:0002503) |
| 5.7 | 40.2 | GO:0039663 | fusion of virus membrane with host plasma membrane(GO:0019064) membrane fusion involved in viral entry into host cell(GO:0039663) multi-organism membrane fusion(GO:0044800) |
| 4.5 | 18.0 | GO:2001191 | gamma-delta T cell activation involved in immune response(GO:0002290) negative regulation of interferon-beta secretion(GO:0035548) regulation of gamma-delta T cell activation involved in immune response(GO:2001191) positive regulation of gamma-delta T cell activation involved in immune response(GO:2001193) |
| 2.8 | 13.8 | GO:0018230 | peptidyl-L-cysteine S-palmitoylation(GO:0018230) peptidyl-S-diacylglycerol-L-cysteine biosynthetic process from peptidyl-cysteine(GO:0018231) |
| 2.7 | 19.2 | GO:2000334 | lipoprotein particle mediated signaling(GO:0055095) low-density lipoprotein particle mediated signaling(GO:0055096) blood microparticle formation(GO:0072564) regulation of blood microparticle formation(GO:2000332) positive regulation of blood microparticle formation(GO:2000334) |
| 2.1 | 6.3 | GO:0003241 | growth involved in heart morphogenesis(GO:0003241) |
| 1.8 | 5.5 | GO:0070086 | protein targeting to vacuole involved in ubiquitin-dependent protein catabolic process via the multivesicular body sorting pathway(GO:0043328) ubiquitin-dependent endocytosis(GO:0070086) regulation of ubiquitin-dependent endocytosis(GO:2000395) positive regulation of ubiquitin-dependent endocytosis(GO:2000397) |
| 1.8 | 7.3 | GO:0002774 | Fc receptor mediated inhibitory signaling pathway(GO:0002774) |
| 1.7 | 5.2 | GO:0090219 | negative regulation of lipid kinase activity(GO:0090219) |
| 1.7 | 6.7 | GO:2000620 | positive regulation of histone H4-K16 acetylation(GO:2000620) |
| 1.6 | 4.8 | GO:1901503 | ether lipid biosynthetic process(GO:0008611) glycerol ether biosynthetic process(GO:0046504) ether biosynthetic process(GO:1901503) |
| 1.5 | 27.9 | GO:0040015 | negative regulation of multicellular organism growth(GO:0040015) |
| 1.3 | 5.2 | GO:0006542 | glutamine biosynthetic process(GO:0006542) |
| 1.2 | 7.5 | GO:0031022 | nuclear migration along microfilament(GO:0031022) |
| 1.0 | 7.2 | GO:1904153 | negative regulation of protein exit from endoplasmic reticulum(GO:0070862) negative regulation of retrograde protein transport, ER to cytosol(GO:1904153) |
| 1.0 | 25.8 | GO:0006068 | ethanol catabolic process(GO:0006068) |
| 0.9 | 2.6 | GO:1902463 | protein localization to cell leading edge(GO:1902463) |
| 0.7 | 2.1 | GO:0032759 | TRAIL production(GO:0032639) regulation of TRAIL production(GO:0032679) positive regulation of TRAIL production(GO:0032759) |
| 0.7 | 4.0 | GO:0035407 | histone H3-T11 phosphorylation(GO:0035407) |
| 0.6 | 1.9 | GO:0060584 | detection of peptidoglycan(GO:0032499) activation of MAPK activity involved in innate immune response(GO:0035419) regulation of prostaglandin-endoperoxide synthase activity(GO:0060584) positive regulation of prostaglandin-endoperoxide synthase activity(GO:0060585) positive regulation of protein K63-linked ubiquitination(GO:1902523) |
| 0.6 | 1.9 | GO:0071529 | cementum mineralization(GO:0071529) |
| 0.6 | 3.8 | GO:1902527 | fat pad development(GO:0060613) positive regulation of protein monoubiquitination(GO:1902527) |
| 0.6 | 4.9 | GO:0002036 | regulation of L-glutamate transport(GO:0002036) |
| 0.6 | 22.5 | GO:0045730 | respiratory burst(GO:0045730) |
| 0.6 | 6.6 | GO:0051574 | positive regulation of histone H3-K9 methylation(GO:0051574) |
| 0.6 | 2.8 | GO:0031547 | brain-derived neurotrophic factor receptor signaling pathway(GO:0031547) |
| 0.5 | 6.0 | GO:0007379 | segment specification(GO:0007379) positive regulation of Wnt signaling pathway, planar cell polarity pathway(GO:2000096) |
| 0.5 | 48.0 | GO:0050672 | negative regulation of mononuclear cell proliferation(GO:0032945) negative regulation of lymphocyte proliferation(GO:0050672) |
| 0.4 | 3.0 | GO:0007256 | activation of JNKK activity(GO:0007256) |
| 0.4 | 7.6 | GO:0051014 | actin filament severing(GO:0051014) |
| 0.4 | 9.8 | GO:0048935 | peripheral nervous system neuron differentiation(GO:0048934) peripheral nervous system neuron development(GO:0048935) |
| 0.4 | 1.4 | GO:0044467 | glial cell-derived neurotrophic factor secretion(GO:0044467) regulation of glial cell-derived neurotrophic factor secretion(GO:1900166) positive regulation of glial cell-derived neurotrophic factor secretion(GO:1900168) |
| 0.3 | 1.4 | GO:0046725 | negative regulation by virus of viral protein levels in host cell(GO:0046725) negative regulation of nephron tubule epithelial cell differentiation(GO:0072183) negative regulation of metanephric nephron tubule epithelial cell differentiation(GO:0072308) negative regulation of epithelial cell differentiation involved in kidney development(GO:2000697) |
| 0.3 | 11.9 | GO:0050832 | defense response to fungus(GO:0050832) |
| 0.3 | 33.1 | GO:0031295 | T cell costimulation(GO:0031295) |
| 0.3 | 0.9 | GO:1903939 | regulation of histone H3-K9 dimethylation(GO:1900109) negative regulation of histone H3-K9 dimethylation(GO:1900110) regulation of TORC2 signaling(GO:1903939) |
| 0.3 | 1.3 | GO:0045074 | interleukin-10 biosynthetic process(GO:0042091) regulation of interleukin-10 biosynthetic process(GO:0045074) |
| 0.3 | 0.8 | GO:0046900 | tetrahydrofolylpolyglutamate metabolic process(GO:0046900) |
| 0.3 | 1.3 | GO:0097384 | cellular lipid biosynthetic process(GO:0097384) |
| 0.2 | 15.4 | GO:0006910 | phagocytosis, recognition(GO:0006910) |
| 0.2 | 0.7 | GO:0090294 | nitrogen catabolite regulation of transcription from RNA polymerase II promoter(GO:0001079) nitrogen catabolite activation of transcription from RNA polymerase II promoter(GO:0001080) regulation of urea metabolic process(GO:0034255) intracellular bile acid receptor signaling pathway(GO:0038185) interleukin-17 secretion(GO:0072615) nitrogen catabolite regulation of transcription(GO:0090293) nitrogen catabolite activation of transcription(GO:0090294) regulation of nitrogen cycle metabolic process(GO:1903314) positive regulation of glutamate metabolic process(GO:2000213) regulation of ammonia assimilation cycle(GO:2001248) positive regulation of ammonia assimilation cycle(GO:2001250) |
| 0.2 | 3.0 | GO:0030321 | transepithelial chloride transport(GO:0030321) |
| 0.2 | 10.5 | GO:0071431 | tRNA export from nucleus(GO:0006409) tRNA-containing ribonucleoprotein complex export from nucleus(GO:0071431) |
| 0.2 | 1.1 | GO:0006529 | asparagine biosynthetic process(GO:0006529) |
| 0.2 | 11.1 | GO:0034260 | negative regulation of GTPase activity(GO:0034260) |
| 0.2 | 6.8 | GO:0050690 | regulation of defense response to virus by virus(GO:0050690) |
| 0.2 | 1.5 | GO:0015816 | glycine transport(GO:0015816) |
| 0.2 | 1.5 | GO:0043402 | glucocorticoid mediated signaling pathway(GO:0043402) |
| 0.2 | 10.5 | GO:0000381 | regulation of alternative mRNA splicing, via spliceosome(GO:0000381) |
| 0.2 | 1.0 | GO:0006003 | fructose 2,6-bisphosphate metabolic process(GO:0006003) |
| 0.2 | 7.0 | GO:0070534 | protein K63-linked ubiquitination(GO:0070534) |
| 0.2 | 3.2 | GO:0071539 | protein localization to centrosome(GO:0071539) |
| 0.1 | 3.4 | GO:0035338 | long-chain fatty-acyl-CoA biosynthetic process(GO:0035338) |
| 0.1 | 2.3 | GO:0031053 | primary miRNA processing(GO:0031053) |
| 0.1 | 1.3 | GO:0015781 | pyrimidine nucleotide-sugar transport(GO:0015781) protein O-linked fucosylation(GO:0036066) |
| 0.1 | 2.6 | GO:0006750 | glutathione biosynthetic process(GO:0006750) |
| 0.1 | 1.7 | GO:0090168 | Golgi reassembly(GO:0090168) |
| 0.1 | 3.2 | GO:0045332 | lipid translocation(GO:0034204) phospholipid translocation(GO:0045332) |
| 0.1 | 0.4 | GO:0046671 | negative regulation of cellular pH reduction(GO:0032848) CD8-positive, alpha-beta T cell lineage commitment(GO:0043375) negative regulation of retinal cell programmed cell death(GO:0046671) |
| 0.1 | 0.4 | GO:0009212 | dTTP biosynthetic process(GO:0006235) pyrimidine deoxyribonucleoside triphosphate biosynthetic process(GO:0009212) |
| 0.1 | 0.6 | GO:0015760 | hexose phosphate transport(GO:0015712) glucose-6-phosphate transport(GO:0015760) |
| 0.1 | 0.3 | GO:0042264 | peptidyl-aspartic acid hydroxylation(GO:0042264) |
| 0.1 | 1.6 | GO:0016254 | preassembly of GPI anchor in ER membrane(GO:0016254) |
| 0.1 | 2.1 | GO:0006825 | copper ion transport(GO:0006825) |
| 0.1 | 0.2 | GO:0051902 | negative regulation of mitochondrial depolarization(GO:0051902) negative regulation of neuromuscular junction development(GO:1904397) bone regeneration(GO:1990523) |
| 0.1 | 1.6 | GO:0000052 | citrulline metabolic process(GO:0000052) |
| 0.1 | 1.7 | GO:0006895 | Golgi to endosome transport(GO:0006895) |
| 0.1 | 0.6 | GO:0086024 | adrenergic receptor signaling pathway involved in positive regulation of heart rate(GO:0086024) |
| 0.1 | 0.4 | GO:0002175 | protein localization to paranode region of axon(GO:0002175) |
| 0.1 | 3.7 | GO:0006968 | cellular defense response(GO:0006968) |
| 0.1 | 3.2 | GO:0045540 | regulation of cholesterol biosynthetic process(GO:0045540) |
| 0.1 | 0.5 | GO:1902659 | regulation of glucose mediated signaling pathway(GO:1902659) |
| 0.0 | 13.4 | GO:0006367 | transcription initiation from RNA polymerase II promoter(GO:0006367) |
| 0.0 | 0.4 | GO:0032510 | endosome to lysosome transport via multivesicular body sorting pathway(GO:0032510) |
| 0.0 | 6.6 | GO:0006614 | SRP-dependent cotranslational protein targeting to membrane(GO:0006614) |
| 0.0 | 0.3 | GO:0060414 | aorta smooth muscle tissue morphogenesis(GO:0060414) |
| 0.0 | 0.5 | GO:0019388 | galactose catabolic process(GO:0019388) |
| 0.0 | 1.2 | GO:0034314 | Arp2/3 complex-mediated actin nucleation(GO:0034314) |
| 0.0 | 3.7 | GO:0002062 | chondrocyte differentiation(GO:0002062) |
| 0.0 | 2.3 | GO:0070125 | mitochondrial translational elongation(GO:0070125) |
| 0.0 | 2.1 | GO:0030166 | proteoglycan biosynthetic process(GO:0030166) |
| 0.0 | 1.3 | GO:0050850 | positive regulation of calcium-mediated signaling(GO:0050850) |
| 0.0 | 0.1 | GO:0021691 | cerebellar Purkinje cell layer maturation(GO:0021691) |
| 0.0 | 0.2 | GO:1903861 | positive regulation of dendrite extension(GO:1903861) |
| 0.0 | 0.1 | GO:0060166 | olfactory pit development(GO:0060166) |
| 0.0 | 0.2 | GO:0061302 | smooth muscle cell-matrix adhesion(GO:0061302) |
| 0.0 | 1.6 | GO:0010803 | regulation of tumor necrosis factor-mediated signaling pathway(GO:0010803) |
| 0.0 | 0.1 | GO:0060290 | transdifferentiation(GO:0060290) |
| 0.0 | 5.6 | GO:0007411 | axon guidance(GO:0007411) |
| 0.0 | 0.8 | GO:1901998 | toxin transport(GO:1901998) |
| 0.0 | 0.4 | GO:0003197 | endocardial cushion development(GO:0003197) |
| 0.0 | 0.2 | GO:0035655 | interleukin-18-mediated signaling pathway(GO:0035655) |
| 0.0 | 0.2 | GO:0046949 | fatty-acyl-CoA biosynthetic process(GO:0046949) |
| 0.0 | 1.5 | GO:0018022 | peptidyl-lysine methylation(GO:0018022) |
Gene overrepresentation in cellular_component category:
| Log-likelihood per target | Total log-likelihood | Term | Description |
|---|---|---|---|
| 3.5 | 10.5 | GO:1990876 | cytoplasmic side of nuclear pore(GO:1990876) |
| 3.1 | 65.4 | GO:0042613 | MHC class II protein complex(GO:0042613) |
| 2.0 | 13.8 | GO:0002178 | palmitoyltransferase complex(GO:0002178) |
| 0.8 | 5.5 | GO:0000813 | ESCRT I complex(GO:0000813) |
| 0.7 | 10.8 | GO:0015629 | actin cytoskeleton(GO:0015629) |
| 0.6 | 18.8 | GO:0031092 | platelet alpha granule membrane(GO:0031092) |
| 0.6 | 7.5 | GO:0034993 | microtubule organizing center attachment site(GO:0034992) LINC complex(GO:0034993) |
| 0.6 | 2.8 | GO:0044308 | axonal spine(GO:0044308) |
| 0.5 | 3.2 | GO:0031313 | extrinsic component of endosome membrane(GO:0031313) |
| 0.5 | 5.5 | GO:0032045 | guanyl-nucleotide exchange factor complex(GO:0032045) |
| 0.3 | 1.9 | GO:0065010 | extracellular membrane-bounded organelle(GO:0065010) |
| 0.3 | 15.4 | GO:0042571 | immunoglobulin complex, circulating(GO:0042571) |
| 0.3 | 3.2 | GO:0016602 | CCAAT-binding factor complex(GO:0016602) |
| 0.3 | 5.2 | GO:0097386 | glial cell projection(GO:0097386) |
| 0.3 | 6.6 | GO:0035098 | ESC/E(Z) complex(GO:0035098) |
| 0.2 | 23.6 | GO:0035578 | azurophil granule lumen(GO:0035578) |
| 0.1 | 38.7 | GO:0005770 | late endosome(GO:0005770) |
| 0.1 | 20.9 | GO:0031225 | anchored component of membrane(GO:0031225) |
| 0.1 | 3.8 | GO:0044322 | endoplasmic reticulum quality control compartment(GO:0044322) |
| 0.1 | 8.4 | GO:0022627 | cytosolic small ribosomal subunit(GO:0022627) |
| 0.1 | 0.9 | GO:0070761 | pre-snoRNP complex(GO:0070761) |
| 0.1 | 0.2 | GO:0071062 | alphav-beta3 integrin-vitronectin complex(GO:0071062) |
| 0.1 | 5.9 | GO:0008023 | transcription elongation factor complex(GO:0008023) |
| 0.1 | 7.3 | GO:0101003 | ficolin-1-rich granule membrane(GO:0101003) |
| 0.1 | 23.1 | GO:0009897 | external side of plasma membrane(GO:0009897) |
| 0.1 | 4.8 | GO:0005782 | peroxisomal matrix(GO:0005782) microbody lumen(GO:0031907) |
| 0.1 | 1.2 | GO:0005885 | Arp2/3 protein complex(GO:0005885) |
| 0.1 | 12.9 | GO:0032993 | protein-DNA complex(GO:0032993) |
| 0.1 | 4.3 | GO:0032154 | cleavage furrow(GO:0032154) cell surface furrow(GO:0097610) |
| 0.1 | 1.7 | GO:0030140 | trans-Golgi network transport vesicle(GO:0030140) |
| 0.1 | 0.4 | GO:0005672 | transcription factor TFIIA complex(GO:0005672) |
| 0.1 | 1.3 | GO:0033116 | endoplasmic reticulum-Golgi intermediate compartment membrane(GO:0033116) |
| 0.1 | 4.0 | GO:0000118 | histone deacetylase complex(GO:0000118) |
| 0.1 | 0.7 | GO:0030478 | actin cap(GO:0030478) |
| 0.0 | 4.6 | GO:0045335 | phagocytic vesicle(GO:0045335) |
| 0.0 | 34.7 | GO:0000139 | Golgi membrane(GO:0000139) |
| 0.0 | 1.7 | GO:0005762 | organellar large ribosomal subunit(GO:0000315) mitochondrial large ribosomal subunit(GO:0005762) |
| 0.0 | 1.9 | GO:0008180 | COP9 signalosome(GO:0008180) |
| 0.0 | 26.5 | GO:0005789 | endoplasmic reticulum membrane(GO:0005789) |
| 0.0 | 0.4 | GO:0033270 | paranode region of axon(GO:0033270) |
| 0.0 | 0.6 | GO:0031588 | cAMP-dependent protein kinase complex(GO:0005952) nucleotide-activated protein kinase complex(GO:0031588) |
| 0.0 | 0.7 | GO:0005719 | nuclear euchromatin(GO:0005719) |
| 0.0 | 8.4 | GO:0016607 | nuclear speck(GO:0016607) |
| 0.0 | 5.9 | GO:0000790 | nuclear chromatin(GO:0000790) |
| 0.0 | 6.2 | GO:0034774 | secretory granule lumen(GO:0034774) |
| 0.0 | 5.5 | GO:0000151 | ubiquitin ligase complex(GO:0000151) |
| 0.0 | 0.6 | GO:0005891 | voltage-gated calcium channel complex(GO:0005891) |
| 0.0 | 0.2 | GO:0030057 | desmosome(GO:0030057) |
Gene overrepresentation in molecular_function category:
| Log-likelihood per target | Total log-likelihood | Term | Description |
|---|---|---|---|
| 4.7 | 65.4 | GO:0032395 | MHC class II receptor activity(GO:0032395) |
| 4.5 | 18.0 | GO:0030107 | HLA-A specific inhibitory MHC class I receptor activity(GO:0030107) |
| 3.7 | 25.8 | GO:0047894 | flavonol 3-sulfotransferase activity(GO:0047894) |
| 3.7 | 40.2 | GO:0016494 | C-X-C chemokine receptor activity(GO:0016494) |
| 3.2 | 19.2 | GO:0070892 | lipoteichoic acid receptor activity(GO:0070892) |
| 1.8 | 7.3 | GO:0032396 | inhibitory MHC class I receptor activity(GO:0032396) |
| 1.4 | 18.8 | GO:0001087 | transcription factor activity, sequence-specific DNA binding, RNA polymerase recruiting(GO:0001011) transcription factor activity, TFIIB-class binding(GO:0001087) |
| 1.3 | 5.2 | GO:0016880 | glutamate-ammonia ligase activity(GO:0004356) ammonia ligase activity(GO:0016211) acid-ammonia (or amide) ligase activity(GO:0016880) |
| 1.0 | 10.5 | GO:0005049 | nuclear export signal receptor activity(GO:0005049) |
| 0.9 | 13.8 | GO:0019707 | protein-cysteine S-palmitoyltransferase activity(GO:0019706) protein-cysteine S-acyltransferase activity(GO:0019707) |
| 0.9 | 2.6 | GO:0004464 | leukotriene-C4 synthase activity(GO:0004464) |
| 0.7 | 3.0 | GO:0004706 | JUN kinase kinase kinase activity(GO:0004706) |
| 0.7 | 2.1 | GO:0004382 | guanosine-diphosphatase activity(GO:0004382) |
| 0.7 | 4.0 | GO:0035402 | histone kinase activity (H3-T11 specific)(GO:0035402) |
| 0.7 | 13.1 | GO:0050786 | RAGE receptor binding(GO:0050786) |
| 0.5 | 1.6 | GO:0051377 | mannose-ethanolamine phosphotransferase activity(GO:0051377) |
| 0.5 | 6.3 | GO:0038036 | sphingosine-1-phosphate receptor activity(GO:0038036) sphingolipid binding(GO:0046625) |
| 0.5 | 9.7 | GO:0005068 | transmembrane receptor protein tyrosine kinase adaptor activity(GO:0005068) |
| 0.5 | 11.1 | GO:0005095 | GTPase inhibitor activity(GO:0005095) |
| 0.5 | 3.0 | GO:0045029 | UDP-activated nucleotide receptor activity(GO:0045029) |
| 0.4 | 2.6 | GO:0071933 | Arp2/3 complex binding(GO:0071933) |
| 0.4 | 4.8 | GO:0016413 | palmitoyl-CoA hydrolase activity(GO:0016290) O-acetyltransferase activity(GO:0016413) |
| 0.4 | 7.0 | GO:0005522 | profilin binding(GO:0005522) |
| 0.4 | 7.5 | GO:0043495 | protein anchor(GO:0043495) |
| 0.3 | 1.3 | GO:0051996 | farnesyl-diphosphate farnesyltransferase activity(GO:0004310) squalene synthase activity(GO:0051996) |
| 0.3 | 1.6 | GO:0016403 | dimethylargininase activity(GO:0016403) |
| 0.3 | 1.5 | GO:0038051 | glucocorticoid receptor activity(GO:0004883) glucocorticoid-activated RNA polymerase II transcription factor binding transcription factor activity(GO:0038051) |
| 0.3 | 9.0 | GO:0003950 | NAD+ ADP-ribosyltransferase activity(GO:0003950) |
| 0.3 | 15.4 | GO:0034987 | immunoglobulin receptor binding(GO:0034987) |
| 0.3 | 2.8 | GO:0015386 | sodium:proton antiporter activity(GO:0015385) potassium:proton antiporter activity(GO:0015386) |
| 0.3 | 5.7 | GO:0035497 | cAMP response element binding(GO:0035497) |
| 0.3 | 1.9 | GO:0004035 | alkaline phosphatase activity(GO:0004035) |
| 0.2 | 1.5 | GO:0015187 | glycine transmembrane transporter activity(GO:0015187) |
| 0.2 | 0.7 | GO:1902122 | chenodeoxycholic acid binding(GO:1902122) |
| 0.2 | 2.1 | GO:0004322 | ferroxidase activity(GO:0004322) oxidoreductase activity, oxidizing metal ions, oxygen as acceptor(GO:0016724) |
| 0.2 | 1.1 | GO:0004066 | asparagine synthase (glutamine-hydrolyzing) activity(GO:0004066) |
| 0.2 | 0.6 | GO:0015526 | hexose phosphate transmembrane transporter activity(GO:0015119) organophosphate:inorganic phosphate antiporter activity(GO:0015315) hexose-phosphate:inorganic phosphate antiporter activity(GO:0015526) glucose 6-phosphate:inorganic phosphate antiporter activity(GO:0061513) |
| 0.2 | 2.1 | GO:0048406 | nerve growth factor binding(GO:0048406) |
| 0.2 | 6.6 | GO:0032452 | histone demethylase activity(GO:0032452) |
| 0.2 | 1.3 | GO:0001165 | RNA polymerase I upstream control element sequence-specific DNA binding(GO:0001165) |
| 0.2 | 3.4 | GO:0102391 | decanoate--CoA ligase activity(GO:0102391) |
| 0.2 | 4.6 | GO:0004012 | phospholipid-translocating ATPase activity(GO:0004012) |
| 0.2 | 5.2 | GO:0043548 | phosphatidylinositol 3-kinase binding(GO:0043548) |
| 0.2 | 1.9 | GO:0042834 | peptidoglycan binding(GO:0042834) |
| 0.2 | 1.0 | GO:0004331 | 6-phosphofructo-2-kinase activity(GO:0003873) fructose-2,6-bisphosphate 2-phosphatase activity(GO:0004331) |
| 0.2 | 7.2 | GO:0061631 | ubiquitin conjugating enzyme activity(GO:0061631) |
| 0.1 | 3.2 | GO:0005545 | 1-phosphatidylinositol binding(GO:0005545) |
| 0.1 | 1.4 | GO:0043199 | sulfate binding(GO:0043199) |
| 0.1 | 1.6 | GO:0031996 | thioesterase binding(GO:0031996) |
| 0.1 | 1.3 | GO:0055106 | ubiquitin-protein transferase regulator activity(GO:0055106) |
| 0.1 | 3.2 | GO:0000980 | RNA polymerase II distal enhancer sequence-specific DNA binding(GO:0000980) |
| 0.1 | 0.5 | GO:0004614 | phosphoglucomutase activity(GO:0004614) |
| 0.1 | 4.8 | GO:0098811 | transcriptional activator activity, RNA polymerase II transcription factor binding(GO:0001190) transcriptional repressor activity, RNA polymerase II activating transcription factor binding(GO:0098811) |
| 0.1 | 0.3 | GO:0004687 | myosin light chain kinase activity(GO:0004687) |
| 0.1 | 0.7 | GO:0045159 | myosin II binding(GO:0045159) |
| 0.1 | 0.3 | GO:0071532 | ankyrin repeat binding(GO:0071532) |
| 0.0 | 1.4 | GO:0000983 | transcription factor activity, RNA polymerase II core promoter sequence-specific(GO:0000983) |
| 0.0 | 29.1 | GO:0003682 | chromatin binding(GO:0003682) |
| 0.0 | 5.5 | GO:0043130 | ubiquitin binding(GO:0043130) |
| 0.0 | 1.3 | GO:0042288 | MHC class I protein binding(GO:0042288) |
| 0.0 | 1.5 | GO:0030544 | Hsp70 protein binding(GO:0030544) |
| 0.0 | 0.4 | GO:0051434 | BH3 domain binding(GO:0051434) |
| 0.0 | 8.9 | GO:0003735 | structural constituent of ribosome(GO:0003735) |
| 0.0 | 0.6 | GO:0031698 | beta-2 adrenergic receptor binding(GO:0031698) |
| 0.0 | 0.8 | GO:0016881 | acid-amino acid ligase activity(GO:0016881) |
| 0.0 | 0.6 | GO:0008603 | cAMP-dependent protein kinase inhibitor activity(GO:0004862) cAMP-dependent protein kinase regulator activity(GO:0008603) |
| 0.0 | 1.3 | GO:0005080 | protein kinase C binding(GO:0005080) |
| 0.0 | 3.5 | GO:0017124 | SH3 domain binding(GO:0017124) |
| 0.0 | 3.0 | GO:0003823 | antigen binding(GO:0003823) |
| 0.0 | 0.2 | GO:0030247 | pattern binding(GO:0001871) polysaccharide binding(GO:0030247) |
| 0.0 | 0.2 | GO:0042813 | Wnt-activated receptor activity(GO:0042813) |
| 0.0 | 0.2 | GO:0004908 | interleukin-1 receptor activity(GO:0004908) |
Gene overrepresentation in C2:CP category:
| Log-likelihood per target | Total log-likelihood | Term | Description |
|---|---|---|---|
| 1.0 | 46.5 | PID S1P S1P3 PATHWAY | S1P3 pathway |
| 0.6 | 30.5 | PID IL12 STAT4 PATHWAY | IL12 signaling mediated by STAT4 |
| 0.4 | 10.5 | PID SMAD2 3PATHWAY | Regulation of cytoplasmic and nuclear SMAD2/3 signaling |
| 0.3 | 13.9 | PID P38 MK2 PATHWAY | p38 signaling mediated by MAPKAP kinases |
| 0.2 | 4.0 | PID P38 GAMMA DELTA PATHWAY | Signaling mediated by p38-gamma and p38-delta |
| 0.2 | 11.6 | PID IL2 1PATHWAY | IL2-mediated signaling events |
| 0.1 | 15.0 | PID AR PATHWAY | Coregulation of Androgen receptor activity |
| 0.1 | 5.5 | PID NETRIN PATHWAY | Netrin-mediated signaling events |
| 0.1 | 3.0 | PID IFNG PATHWAY | IFN-gamma pathway |
| 0.1 | 8.6 | PID SMAD2 3NUCLEAR PATHWAY | Regulation of nuclear SMAD2/3 signaling |
| 0.1 | 2.1 | SA MMP CYTOKINE CONNECTION | Cytokines can induce activation of matrix metalloproteinases, which degrade extracellular matrix. |
| 0.0 | 1.6 | PID CD40 PATHWAY | CD40/CD40L signaling |
| 0.0 | 17.4 | NABA SECRETED FACTORS | Genes encoding secreted soluble factors |
| 0.0 | 1.3 | PID CD8 TCR DOWNSTREAM PATHWAY | Downstream signaling in naïve CD8+ T cells |
| 0.0 | 3.2 | PID MYC REPRESS PATHWAY | Validated targets of C-MYC transcriptional repression |
| 0.0 | 0.7 | PID RXR VDR PATHWAY | RXR and RAR heterodimerization with other nuclear receptor |
| 0.0 | 1.2 | PID RAC1 PATHWAY | RAC1 signaling pathway |
| 0.0 | 1.4 | PID CMYB PATHWAY | C-MYB transcription factor network |
| 0.0 | 0.5 | PID NFKAPPAB CANONICAL PATHWAY | Canonical NF-kappaB pathway |
| 0.0 | 0.6 | PID INTEGRIN A4B1 PATHWAY | Alpha4 beta1 integrin signaling events |
| 0.0 | 1.0 | PID HIF1 TFPATHWAY | HIF-1-alpha transcription factor network |
| 0.0 | 0.2 | PID WNT SIGNALING PATHWAY | Wnt signaling network |
Gene overrepresentation in C2:CP:REACTOME category:
| Log-likelihood per target | Total log-likelihood | Term | Description |
|---|---|---|---|
| 8.0 | 40.2 | REACTOME BINDING AND ENTRY OF HIV VIRION | Genes involved in Binding and entry of HIV virion |
| 1.6 | 35.1 | REACTOME TRANSLOCATION OF ZAP 70 TO IMMUNOLOGICAL SYNAPSE | Genes involved in Translocation of ZAP-70 to Immunological synapse |
| 0.9 | 25.8 | REACTOME CYTOSOLIC SULFONATION OF SMALL MOLECULES | Genes involved in Cytosolic sulfonation of small molecules |
| 0.5 | 5.5 | REACTOME MEMBRANE BINDING AND TARGETTING OF GAG PROTEINS | Genes involved in Membrane binding and targetting of GAG proteins |
| 0.4 | 13.1 | REACTOME RIP MEDIATED NFKB ACTIVATION VIA DAI | Genes involved in RIP-mediated NFkB activation via DAI |
| 0.4 | 30.9 | REACTOME IMMUNOREGULATORY INTERACTIONS BETWEEN A LYMPHOID AND A NON LYMPHOID CELL | Genes involved in Immunoregulatory interactions between a Lymphoid and a non-Lymphoid cell |
| 0.3 | 18.8 | REACTOME MYOGENESIS | Genes involved in Myogenesis |
| 0.3 | 10.5 | REACTOME NEP NS2 INTERACTS WITH THE CELLULAR EXPORT MACHINERY | Genes involved in NEP/NS2 Interacts with the Cellular Export Machinery |
| 0.2 | 18.5 | REACTOME TRANSCRIPTIONAL REGULATION OF WHITE ADIPOCYTE DIFFERENTIATION | Genes involved in Transcriptional Regulation of White Adipocyte Differentiation |
| 0.2 | 5.2 | REACTOME AMINO ACID SYNTHESIS AND INTERCONVERSION TRANSAMINATION | Genes involved in Amino acid synthesis and interconversion (transamination) |
| 0.2 | 6.2 | REACTOME TIE2 SIGNALING | Genes involved in Tie2 Signaling |
| 0.2 | 3.4 | REACTOME SYNTHESIS OF VERY LONG CHAIN FATTY ACYL COAS | Genes involved in Synthesis of very long-chain fatty acyl-CoAs |
| 0.2 | 1.9 | REACTOME TAK1 ACTIVATES NFKB BY PHOSPHORYLATION AND ACTIVATION OF IKKS COMPLEX | Genes involved in TAK1 activates NFkB by phosphorylation and activation of IKKs complex |
| 0.2 | 3.0 | REACTOME P2Y RECEPTORS | Genes involved in P2Y receptors |
| 0.2 | 4.7 | REACTOME SYNTHESIS OF PA | Genes involved in Synthesis of PA |
| 0.1 | 5.5 | REACTOME THE ROLE OF NEF IN HIV1 REPLICATION AND DISEASE PATHOGENESIS | Genes involved in The role of Nef in HIV-1 replication and disease pathogenesis |
| 0.1 | 8.4 | REACTOME FORMATION OF THE TERNARY COMPLEX AND SUBSEQUENTLY THE 43S COMPLEX | Genes involved in Formation of the ternary complex, and subsequently, the 43S complex |
| 0.1 | 2.1 | REACTOME METAL ION SLC TRANSPORTERS | Genes involved in Metal ion SLC transporters |
| 0.1 | 7.5 | REACTOME MEIOTIC SYNAPSIS | Genes involved in Meiotic Synapsis |
| 0.1 | 1.7 | REACTOME DESTABILIZATION OF MRNA BY KSRP | Genes involved in Destabilization of mRNA by KSRP |
| 0.1 | 1.4 | REACTOME IL 6 SIGNALING | Genes involved in Interleukin-6 signaling |
| 0.1 | 2.6 | REACTOME GLUTATHIONE CONJUGATION | Genes involved in Glutathione conjugation |
| 0.1 | 1.6 | REACTOME SYNTHESIS OF GLYCOSYLPHOSPHATIDYLINOSITOL GPI | Genes involved in Synthesis of glycosylphosphatidylinositol (GPI) |
| 0.0 | 1.5 | REACTOME BMAL1 CLOCK NPAS2 ACTIVATES CIRCADIAN EXPRESSION | Genes involved in BMAL1:CLOCK/NPAS2 Activates Circadian Expression |
| 0.0 | 1.3 | REACTOME CHOLESTEROL BIOSYNTHESIS | Genes involved in Cholesterol biosynthesis |
| 0.0 | 0.3 | REACTOME COPI MEDIATED TRANSPORT | Genes involved in COPI Mediated Transport |
| 0.0 | 1.8 | REACTOME ION TRANSPORT BY P TYPE ATPASES | Genes involved in Ion transport by P-type ATPases |
| 0.0 | 1.7 | REACTOME GOLGI ASSOCIATED VESICLE BIOGENESIS | Genes involved in Golgi Associated Vesicle Biogenesis |
| 0.0 | 6.2 | REACTOME ANTIGEN PROCESSING UBIQUITINATION PROTEASOME DEGRADATION | Genes involved in Antigen processing: Ubiquitination & Proteasome degradation |
| 0.0 | 0.5 | REACTOME RNA POL I PROMOTER OPENING | Genes involved in RNA Polymerase I Promoter Opening |
| 0.0 | 1.2 | REACTOME DARPP 32 EVENTS | Genes involved in DARPP-32 events |
| 0.0 | 0.4 | REACTOME ACTIVATION OF BH3 ONLY PROTEINS | Genes involved in Activation of BH3-only proteins |
| 0.0 | 0.7 | REACTOME AMYLOIDS | Genes involved in Amyloids |
| 0.0 | 0.3 | REACTOME REGULATION OF HYPOXIA INDUCIBLE FACTOR HIF BY OXYGEN | Genes involved in Regulation of Hypoxia-inducible Factor (HIF) by Oxygen |
| 0.0 | 0.2 | REACTOME APOPTOTIC CLEAVAGE OF CELL ADHESION PROTEINS | Genes involved in Apoptotic cleavage of cell adhesion proteins |
| 0.0 | 0.8 | REACTOME METABOLISM OF VITAMINS AND COFACTORS | Genes involved in Metabolism of vitamins and cofactors |