Project
GNF SymAtlas + NCI-60 cancer cell lines, comparison of cancers vs non-cancers, human (Su, 2004; Ross, 2000)
Navigation
Downloads
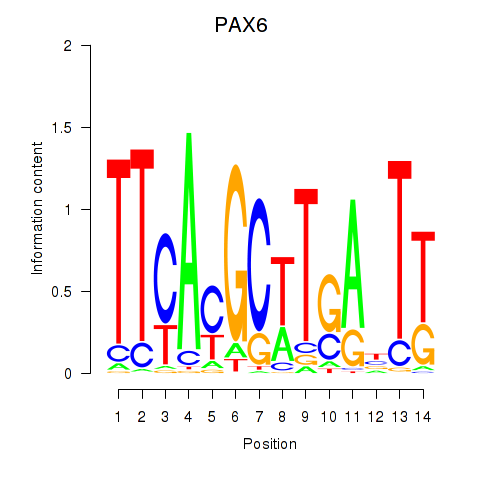
Results for PAX6
Z-value: 0.43
Motif logo
Transcription factors associated with PAX6
| Gene Symbol | Gene ID | Gene Info |
|---|---|---|
|
PAX6
|
ENSG00000007372.16 | paired box 6 |
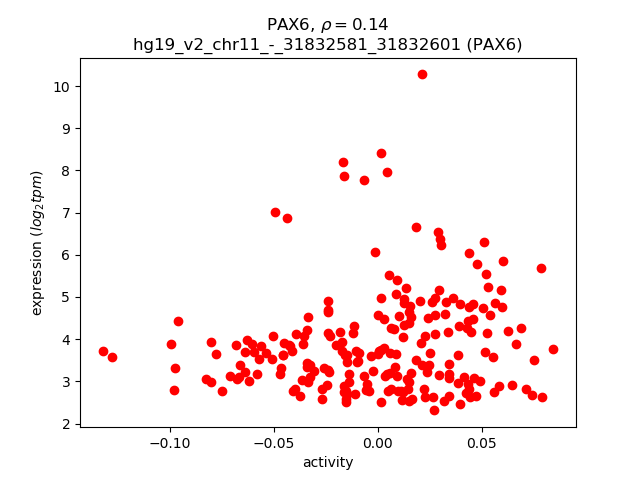
Activity-expression correlation:
| Gene | Promoter | Pearson corr. coef. | P-value | Plot |
|---|---|---|---|---|
| PAX6 | hg19_v2_chr11_-_31832581_31832601, hg19_v2_chr11_-_31832862_31832884, hg19_v2_chr11_-_31832785_31832823, hg19_v2_chr11_-_31832207_31832226 | 0.14 | 4.6e-02 | Click! |
Activity profile of PAX6 motif
Sorted Z-values of PAX6 motif
| Promoter | Log-likelihood | Transcript | Gene | Gene Info |
|---|---|---|---|---|
| chr7_-_97501706 | 10.52 |
ENST00000455086.1
ENST00000453600.1 |
ASNS
|
asparagine synthetase (glutamine-hydrolyzing) |
| chr2_-_175870085 | 9.35 |
ENST00000409156.3
|
CHN1
|
chimerin 1 |
| chr7_-_97501733 | 8.64 |
ENST00000444334.1
ENST00000422745.1 ENST00000394308.3 ENST00000451771.1 ENST00000175506.4 |
ASNS
|
asparagine synthetase (glutamine-hydrolyzing) |
| chr12_-_45269430 | 8.13 |
ENST00000395487.2
|
NELL2
|
NEL-like 2 (chicken) |
| chr10_-_118765081 | 8.00 |
ENST00000392903.2
ENST00000355371.4 |
KIAA1598
|
KIAA1598 |
| chr12_-_45270151 | 7.74 |
ENST00000429094.2
|
NELL2
|
NEL-like 2 (chicken) |
| chr12_-_45270077 | 7.61 |
ENST00000551601.1
ENST00000549027.1 ENST00000452445.2 |
NELL2
|
NEL-like 2 (chicken) |
| chr10_-_118764862 | 7.28 |
ENST00000260777.10
|
KIAA1598
|
KIAA1598 |
| chr11_-_58343319 | 7.21 |
ENST00000395074.2
|
LPXN
|
leupaxin |
| chr8_-_121457332 | 6.72 |
ENST00000518918.1
|
MRPL13
|
mitochondrial ribosomal protein L13 |
| chr10_-_75226166 | 6.28 |
ENST00000544628.1
|
PPP3CB
|
protein phosphatase 3, catalytic subunit, beta isozyme |
| chr1_-_89458287 | 6.21 |
ENST00000370485.2
|
CCBL2
|
cysteine conjugate-beta lyase 2 |
| chr11_-_11374904 | 6.03 |
ENST00000528848.2
|
CSNK2A3
|
casein kinase 2, alpha 3 polypeptide |
| chr7_-_150754935 | 5.97 |
ENST00000297518.4
|
CDK5
|
cyclin-dependent kinase 5 |
| chr9_+_42704004 | 5.92 |
ENST00000457288.1
|
CBWD7
|
COBW domain containing 7 |
| chrX_-_13835147 | 5.76 |
ENST00000493677.1
ENST00000355135.2 |
GPM6B
|
glycoprotein M6B |
| chr1_+_84609944 | 5.75 |
ENST00000370685.3
|
PRKACB
|
protein kinase, cAMP-dependent, catalytic, beta |
| chr1_-_86174065 | 5.61 |
ENST00000370574.3
ENST00000431532.2 |
ZNHIT6
|
zinc finger, HIT-type containing 6 |
| chr2_-_175869936 | 5.39 |
ENST00000409900.3
|
CHN1
|
chimerin 1 |
| chr6_+_125474795 | 5.12 |
ENST00000304877.13
ENST00000534000.1 ENST00000368402.5 ENST00000368388.2 |
TPD52L1
|
tumor protein D52-like 1 |
| chr13_-_24007815 | 5.05 |
ENST00000382298.3
|
SACS
|
spastic ataxia of Charlevoix-Saguenay (sacsin) |
| chr1_-_89458415 | 4.87 |
ENST00000321792.5
ENST00000370491.3 |
RBMXL1
CCBL2
|
RNA binding motif protein, X-linked-like 1 cysteine conjugate-beta lyase 2 |
| chr8_-_121457608 | 4.87 |
ENST00000306185.3
|
MRPL13
|
mitochondrial ribosomal protein L13 |
| chr13_+_25875785 | 4.76 |
ENST00000381747.3
|
NUPL1
|
nucleoporin like 1 |
| chr1_+_73771844 | 4.73 |
ENST00000440762.1
ENST00000444827.1 ENST00000415686.1 ENST00000411903.1 |
RP4-598G3.1
|
RP4-598G3.1 |
| chr2_-_29093132 | 4.70 |
ENST00000306108.5
|
TRMT61B
|
tRNA methyltransferase 61 homolog B (S. cerevisiae) |
| chr12_-_47473425 | 4.58 |
ENST00000550413.1
|
AMIGO2
|
adhesion molecule with Ig-like domain 2 |
| chr5_-_98262240 | 4.54 |
ENST00000284049.3
|
CHD1
|
chromodomain helicase DNA binding protein 1 |
| chr12_-_2986107 | 4.45 |
ENST00000359843.3
ENST00000342628.2 ENST00000361953.3 |
FOXM1
|
forkhead box M1 |
| chr12_+_69080734 | 4.42 |
ENST00000378905.2
|
NUP107
|
nucleoporin 107kDa |
| chr2_+_114195268 | 4.37 |
ENST00000259199.4
ENST00000416503.2 ENST00000433343.2 |
CBWD2
|
COBW domain containing 2 |
| chr2_+_172778952 | 4.36 |
ENST00000392584.1
ENST00000264108.4 |
HAT1
|
histone acetyltransferase 1 |
| chr20_+_62887081 | 4.34 |
ENST00000369758.4
ENST00000299468.7 ENST00000609372.1 ENST00000610196.1 ENST00000308824.6 |
PCMTD2
|
protein-L-isoaspartate (D-aspartate) O-methyltransferase domain containing 2 |
| chrX_-_124097620 | 4.28 |
ENST00000371130.3
ENST00000422452.2 |
TENM1
|
teneurin transmembrane protein 1 |
| chr4_-_69215467 | 4.22 |
ENST00000579690.1
|
YTHDC1
|
YTH domain containing 1 |
| chr1_+_39491984 | 4.22 |
ENST00000372969.3
ENST00000372967.3 |
NDUFS5
|
NADH dehydrogenase (ubiquinone) Fe-S protein 5, 15kDa (NADH-coenzyme Q reductase) |
| chr16_+_84801852 | 4.12 |
ENST00000569925.1
ENST00000567526.1 |
USP10
|
ubiquitin specific peptidase 10 |
| chr9_-_128412696 | 4.04 |
ENST00000420643.1
|
MAPKAP1
|
mitogen-activated protein kinase associated protein 1 |
| chr6_-_79944336 | 4.02 |
ENST00000344726.5
ENST00000275036.7 |
HMGN3
|
high mobility group nucleosomal binding domain 3 |
| chrX_+_77154935 | 3.90 |
ENST00000481445.1
|
COX7B
|
cytochrome c oxidase subunit VIIb |
| chr1_-_87380002 | 3.87 |
ENST00000331835.5
|
SEP15
|
Homo sapiens 15 kDa selenoprotein (SEP15), transcript variant 2, mRNA. |
| chrX_-_92928557 | 3.77 |
ENST00000373079.3
ENST00000475430.2 |
NAP1L3
|
nucleosome assembly protein 1-like 3 |
| chr4_+_113970772 | 3.73 |
ENST00000504454.1
ENST00000394537.3 ENST00000357077.4 ENST00000264366.6 |
ANK2
|
ankyrin 2, neuronal |
| chr8_+_41347915 | 3.55 |
ENST00000518270.1
ENST00000520817.1 |
GOLGA7
|
golgin A7 |
| chr2_+_109204909 | 3.52 |
ENST00000393310.1
|
LIMS1
|
LIM and senescent cell antigen-like domains 1 |
| chr10_+_118350468 | 3.46 |
ENST00000358834.4
ENST00000528052.1 ENST00000442761.1 |
PNLIPRP1
|
pancreatic lipase-related protein 1 |
| chr19_-_14945933 | 3.46 |
ENST00000322301.3
|
OR7A5
|
olfactory receptor, family 7, subfamily A, member 5 |
| chr12_-_47473707 | 3.41 |
ENST00000429635.1
|
AMIGO2
|
adhesion molecule with Ig-like domain 2 |
| chr6_+_125474939 | 3.38 |
ENST00000527711.1
|
TPD52L1
|
tumor protein D52-like 1 |
| chr6_+_125474992 | 3.38 |
ENST00000528193.1
|
TPD52L1
|
tumor protein D52-like 1 |
| chr6_+_125475335 | 3.31 |
ENST00000532429.1
ENST00000534199.1 |
TPD52L1
|
tumor protein D52-like 1 |
| chrX_-_53461288 | 3.24 |
ENST00000375298.4
ENST00000375304.5 |
HSD17B10
|
hydroxysteroid (17-beta) dehydrogenase 10 |
| chr10_+_118350522 | 3.21 |
ENST00000530319.1
ENST00000527980.1 ENST00000471549.1 ENST00000534537.1 |
PNLIPRP1
|
pancreatic lipase-related protein 1 |
| chr6_-_41039567 | 3.12 |
ENST00000468811.1
|
OARD1
|
O-acyl-ADP-ribose deacylase 1 |
| chr1_-_229644034 | 3.12 |
ENST00000366678.3
ENST00000261396.3 ENST00000537506.1 |
NUP133
|
nucleoporin 133kDa |
| chr2_+_228189941 | 3.07 |
ENST00000353339.3
ENST00000354503.6 ENST00000530359.1 ENST00000531278.1 ENST00000409565.1 ENST00000452930.1 ENST00000409616.1 ENST00000337110.7 ENST00000525195.1 ENST00000534203.1 ENST00000524634.1 ENST00000349901.7 |
MFF
|
mitochondrial fission factor |
| chr21_-_35014027 | 2.88 |
ENST00000399442.1
ENST00000413017.2 ENST00000445393.1 ENST00000417979.1 ENST00000426935.1 ENST00000381540.3 ENST00000361534.2 ENST00000381554.3 |
CRYZL1
|
crystallin, zeta (quinone reductase)-like 1 |
| chr1_-_165738072 | 2.84 |
ENST00000481278.1
|
TMCO1
|
transmembrane and coiled-coil domains 1 |
| chr10_+_13628921 | 2.83 |
ENST00000378572.3
|
PRPF18
|
pre-mRNA processing factor 18 |
| chr15_+_51973680 | 2.82 |
ENST00000542355.2
|
SCG3
|
secretogranin III |
| chr11_-_57298187 | 2.76 |
ENST00000525158.1
ENST00000257245.4 ENST00000525587.1 |
TIMM10
|
translocase of inner mitochondrial membrane 10 homolog (yeast) |
| chr1_+_87380299 | 2.75 |
ENST00000370551.4
ENST00000370550.5 |
HS2ST1
|
heparan sulfate 2-O-sulfotransferase 1 |
| chr15_+_51973550 | 2.74 |
ENST00000220478.3
|
SCG3
|
secretogranin III |
| chr2_+_228189867 | 2.74 |
ENST00000423098.1
ENST00000304593.9 |
MFF
|
mitochondrial fission factor |
| chr16_-_3767551 | 2.73 |
ENST00000246957.5
|
TRAP1
|
TNF receptor-associated protein 1 |
| chr1_+_79115503 | 2.70 |
ENST00000370747.4
ENST00000438486.1 ENST00000545124.1 |
IFI44
|
interferon-induced protein 44 |
| chr4_+_115519577 | 2.64 |
ENST00000310836.6
|
UGT8
|
UDP glycosyltransferase 8 |
| chr17_-_73389737 | 2.52 |
ENST00000392563.1
|
GRB2
|
growth factor receptor-bound protein 2 |
| chr8_-_95487331 | 2.50 |
ENST00000336148.5
|
RAD54B
|
RAD54 homolog B (S. cerevisiae) |
| chr1_-_87379785 | 2.49 |
ENST00000401030.3
ENST00000370554.1 |
SEP15
|
Homo sapiens 15 kDa selenoprotein (SEP15), transcript variant 2, mRNA. |
| chr11_-_102401469 | 2.48 |
ENST00000260227.4
|
MMP7
|
matrix metallopeptidase 7 (matrilysin, uterine) |
| chr2_-_85645545 | 2.47 |
ENST00000409275.1
|
CAPG
|
capping protein (actin filament), gelsolin-like |
| chr3_-_142297668 | 2.45 |
ENST00000350721.4
ENST00000383101.3 |
ATR
|
ataxia telangiectasia and Rad3 related |
| chrX_-_6146876 | 2.41 |
ENST00000381095.3
|
NLGN4X
|
neuroligin 4, X-linked |
| chr16_-_3767506 | 2.39 |
ENST00000538171.1
|
TRAP1
|
TNF receptor-associated protein 1 |
| chr5_+_96212185 | 2.32 |
ENST00000379904.4
|
ERAP2
|
endoplasmic reticulum aminopeptidase 2 |
| chr11_-_10828892 | 2.30 |
ENST00000525681.1
|
EIF4G2
|
eukaryotic translation initiation factor 4 gamma, 2 |
| chr6_+_88299833 | 2.29 |
ENST00000392844.3
ENST00000257789.4 ENST00000546266.1 ENST00000417380.2 |
ORC3
|
origin recognition complex, subunit 3 |
| chr1_-_184006829 | 2.27 |
ENST00000361927.4
|
COLGALT2
|
collagen beta(1-O)galactosyltransferase 2 |
| chr5_+_85913721 | 2.26 |
ENST00000247655.3
ENST00000509578.1 ENST00000515763.1 |
COX7C
|
cytochrome c oxidase subunit VIIc |
| chr2_-_153573965 | 2.26 |
ENST00000448428.1
|
PRPF40A
|
PRP40 pre-mRNA processing factor 40 homolog A (S. cerevisiae) |
| chr11_+_60223225 | 2.14 |
ENST00000524807.1
ENST00000345732.4 |
MS4A1
|
membrane-spanning 4-domains, subfamily A, member 1 |
| chr1_-_156722015 | 2.10 |
ENST00000368209.5
|
HDGF
|
hepatoma-derived growth factor |
| chr14_+_88471468 | 2.09 |
ENST00000267549.3
|
GPR65
|
G protein-coupled receptor 65 |
| chr12_+_27175476 | 2.07 |
ENST00000546323.1
ENST00000282892.3 |
MED21
|
mediator complex subunit 21 |
| chrX_-_53461305 | 2.03 |
ENST00000168216.6
|
HSD17B10
|
hydroxysteroid (17-beta) dehydrogenase 10 |
| chr2_-_136743169 | 2.02 |
ENST00000264161.4
|
DARS
|
aspartyl-tRNA synthetase |
| chr16_-_1401799 | 2.01 |
ENST00000007390.2
|
TSR3
|
TSR3, 20S rRNA accumulation, homolog (S. cerevisiae) |
| chr7_+_65552756 | 1.99 |
ENST00000450043.1
|
AC068533.7
|
AC068533.7 |
| chr11_-_3078838 | 1.99 |
ENST00000397111.5
|
CARS
|
cysteinyl-tRNA synthetase |
| chr15_+_68924327 | 1.97 |
ENST00000543950.1
|
CORO2B
|
coronin, actin binding protein, 2B |
| chr6_-_43027105 | 1.91 |
ENST00000230413.5
ENST00000487429.1 ENST00000489623.1 ENST00000468957.1 |
MRPL2
|
mitochondrial ribosomal protein L2 |
| chr11_+_60223312 | 1.88 |
ENST00000532491.1
ENST00000532073.1 ENST00000534668.1 ENST00000528313.1 ENST00000533306.1 |
MS4A1
|
membrane-spanning 4-domains, subfamily A, member 1 |
| chr2_-_163008903 | 1.87 |
ENST00000418842.2
ENST00000375497.3 |
GCG
|
glucagon |
| chr2_-_154335300 | 1.81 |
ENST00000325926.3
|
RPRM
|
reprimo, TP53 dependent G2 arrest mediator candidate |
| chr11_-_117748138 | 1.80 |
ENST00000527717.1
|
FXYD6
|
FXYD domain containing ion transport regulator 6 |
| chr6_-_131321863 | 1.77 |
ENST00000528282.1
|
EPB41L2
|
erythrocyte membrane protein band 4.1-like 2 |
| chr1_+_167298281 | 1.73 |
ENST00000367862.5
|
POU2F1
|
POU class 2 homeobox 1 |
| chr2_+_109204743 | 1.70 |
ENST00000332345.6
|
LIMS1
|
LIM and senescent cell antigen-like domains 1 |
| chr2_+_192109911 | 1.69 |
ENST00000418908.1
ENST00000339514.4 ENST00000392318.3 |
MYO1B
|
myosin IB |
| chr22_-_30968813 | 1.63 |
ENST00000443111.2
ENST00000443136.1 ENST00000426220.1 |
GAL3ST1
|
galactose-3-O-sulfotransferase 1 |
| chr2_+_220363579 | 1.58 |
ENST00000313597.5
ENST00000373917.3 ENST00000358215.3 ENST00000373908.1 ENST00000455657.1 ENST00000435316.1 ENST00000341142.3 |
GMPPA
|
GDP-mannose pyrophosphorylase A |
| chr7_-_87342564 | 1.56 |
ENST00000265724.3
ENST00000416177.1 |
ABCB1
|
ATP-binding cassette, sub-family B (MDR/TAP), member 1 |
| chr3_-_119379719 | 1.52 |
ENST00000493094.1
|
POPDC2
|
popeye domain containing 2 |
| chr2_+_192110199 | 1.50 |
ENST00000304164.4
|
MYO1B
|
myosin IB |
| chr3_+_51663407 | 1.48 |
ENST00000432863.1
ENST00000296477.3 |
RAD54L2
|
RAD54-like 2 (S. cerevisiae) |
| chr15_-_65282274 | 1.46 |
ENST00000204566.2
|
SPG21
|
spastic paraplegia 21 (autosomal recessive, Mast syndrome) |
| chr8_+_59323823 | 1.46 |
ENST00000399598.2
|
UBXN2B
|
UBX domain protein 2B |
| chr12_+_113354341 | 1.45 |
ENST00000553152.1
|
OAS1
|
2'-5'-oligoadenylate synthetase 1, 40/46kDa |
| chr2_+_202098166 | 1.45 |
ENST00000392263.2
ENST00000264274.9 ENST00000392259.2 ENST00000392266.3 ENST00000432109.2 ENST00000264275.5 |
CASP8
|
caspase 8, apoptosis-related cysteine peptidase |
| chr11_+_33563821 | 1.44 |
ENST00000321505.4
ENST00000265654.5 ENST00000389726.3 |
KIAA1549L
|
KIAA1549-like |
| chr7_-_76255444 | 1.40 |
ENST00000454397.1
|
POMZP3
|
POM121 and ZP3 fusion |
| chr19_-_50370509 | 1.40 |
ENST00000596014.1
|
PNKP
|
polynucleotide kinase 3'-phosphatase |
| chr10_+_18629628 | 1.38 |
ENST00000377329.4
|
CACNB2
|
calcium channel, voltage-dependent, beta 2 subunit |
| chr2_+_191334212 | 1.37 |
ENST00000444317.1
ENST00000535751.1 |
MFSD6
|
major facilitator superfamily domain containing 6 |
| chr19_+_35820064 | 1.34 |
ENST00000341773.6
ENST00000600131.1 ENST00000270311.6 ENST00000595780.1 ENST00000597916.1 ENST00000593867.1 ENST00000600424.1 ENST00000599811.1 ENST00000536635.2 ENST00000085219.5 ENST00000544992.2 ENST00000419549.2 |
CD22
|
CD22 molecule |
| chr11_-_117747327 | 1.33 |
ENST00000584230.1
ENST00000527429.1 ENST00000584394.1 ENST00000532984.1 |
FXYD6
FXYD6-FXYD2
|
FXYD domain containing ion transport regulator 6 FXYD6-FXYD2 readthrough |
| chr19_+_35939154 | 1.31 |
ENST00000599180.2
|
FFAR2
|
free fatty acid receptor 2 |
| chr7_+_90338712 | 1.30 |
ENST00000265741.3
ENST00000406263.1 |
CDK14
|
cyclin-dependent kinase 14 |
| chr10_+_91092241 | 1.30 |
ENST00000371811.4
|
IFIT3
|
interferon-induced protein with tetratricopeptide repeats 3 |
| chr22_-_36220420 | 1.22 |
ENST00000473487.2
|
RBFOX2
|
RNA binding protein, fox-1 homolog (C. elegans) 2 |
| chr12_-_121476959 | 1.21 |
ENST00000339275.5
|
OASL
|
2'-5'-oligoadenylate synthetase-like |
| chr8_+_21916680 | 1.18 |
ENST00000358242.3
ENST00000415253.1 |
DMTN
|
dematin actin binding protein |
| chr12_-_85306594 | 1.15 |
ENST00000266682.5
|
SLC6A15
|
solute carrier family 6 (neutral amino acid transporter), member 15 |
| chr4_-_87281224 | 1.11 |
ENST00000395169.3
ENST00000395161.2 |
MAPK10
|
mitogen-activated protein kinase 10 |
| chr12_+_10460549 | 1.11 |
ENST00000543420.1
ENST00000543777.1 |
KLRD1
|
killer cell lectin-like receptor subfamily D, member 1 |
| chr8_+_21916710 | 1.11 |
ENST00000523266.1
ENST00000519907.1 |
DMTN
|
dematin actin binding protein |
| chr13_+_25875662 | 1.09 |
ENST00000381736.3
ENST00000463407.1 ENST00000381718.3 |
NUPL1
|
nucleoporin like 1 |
| chr11_-_117747607 | 1.07 |
ENST00000540359.1
ENST00000539526.1 |
FXYD6
|
FXYD domain containing ion transport regulator 6 |
| chr19_-_41903161 | 1.06 |
ENST00000602129.1
ENST00000593771.1 ENST00000596905.1 ENST00000221233.4 |
EXOSC5
|
exosome component 5 |
| chr10_-_13523073 | 1.02 |
ENST00000440282.1
|
BEND7
|
BEN domain containing 7 |
| chr6_+_167704798 | 1.00 |
ENST00000230256.3
|
UNC93A
|
unc-93 homolog A (C. elegans) |
| chr3_-_196910721 | 0.97 |
ENST00000443183.1
|
DLG1
|
discs, large homolog 1 (Drosophila) |
| chr16_-_18911366 | 0.97 |
ENST00000565224.1
|
SMG1
|
SMG1 phosphatidylinositol 3-kinase-related kinase |
| chr17_-_79633590 | 0.91 |
ENST00000374741.3
ENST00000571503.1 |
OXLD1
|
oxidoreductase-like domain containing 1 |
| chr14_+_22320634 | 0.91 |
ENST00000390435.1
|
TRAV8-3
|
T cell receptor alpha variable 8-3 |
| chr2_-_86116093 | 0.89 |
ENST00000377332.3
|
ST3GAL5
|
ST3 beta-galactoside alpha-2,3-sialyltransferase 5 |
| chr1_+_77333117 | 0.88 |
ENST00000477717.1
|
ST6GALNAC5
|
ST6 (alpha-N-acetyl-neuraminyl-2,3-beta-galactosyl-1,3)-N-acetylgalactosaminide alpha-2,6-sialyltransferase 5 |
| chr11_-_102576537 | 0.84 |
ENST00000260229.4
|
MMP27
|
matrix metallopeptidase 27 |
| chr7_-_150864635 | 0.84 |
ENST00000297537.4
|
GBX1
|
gastrulation brain homeobox 1 |
| chr11_-_117747434 | 0.84 |
ENST00000529335.2
ENST00000530956.1 ENST00000260282.4 |
FXYD6
|
FXYD domain containing ion transport regulator 6 |
| chr17_-_39041479 | 0.80 |
ENST00000167588.3
|
KRT20
|
keratin 20 |
| chr5_+_140254884 | 0.77 |
ENST00000398631.2
|
PCDHA12
|
protocadherin alpha 12 |
| chr11_-_28129656 | 0.76 |
ENST00000263181.6
|
KIF18A
|
kinesin family member 18A |
| chr5_+_140602904 | 0.74 |
ENST00000515856.2
ENST00000239449.4 |
PCDHB14
|
protocadherin beta 14 |
| chr6_+_25652501 | 0.72 |
ENST00000334979.6
|
SCGN
|
secretagogin, EF-hand calcium binding protein |
| chr4_-_174320687 | 0.72 |
ENST00000296506.3
|
SCRG1
|
stimulator of chondrogenesis 1 |
| chr15_+_52155001 | 0.71 |
ENST00000544199.1
|
TMOD3
|
tropomodulin 3 (ubiquitous) |
| chr8_+_18067602 | 0.69 |
ENST00000307719.4
ENST00000545197.1 ENST00000539092.1 ENST00000541942.1 ENST00000518029.1 |
NAT1
|
N-acetyltransferase 1 (arylamine N-acetyltransferase) |
| chr19_-_51920835 | 0.69 |
ENST00000442846.3
ENST00000530476.1 |
SIGLEC10
|
sialic acid binding Ig-like lectin 10 |
| chr17_+_7239821 | 0.68 |
ENST00000158762.3
ENST00000570457.2 |
ACAP1
|
ArfGAP with coiled-coil, ankyrin repeat and PH domains 1 |
| chr6_+_25652432 | 0.66 |
ENST00000377961.2
|
SCGN
|
secretagogin, EF-hand calcium binding protein |
| chr5_+_152870734 | 0.65 |
ENST00000521843.2
|
GRIA1
|
glutamate receptor, ionotropic, AMPA 1 |
| chr15_-_23034322 | 0.64 |
ENST00000539711.2
ENST00000560039.1 ENST00000398013.3 ENST00000337451.3 ENST00000359727.4 ENST00000398014.2 |
NIPA2
|
non imprinted in Prader-Willi/Angelman syndrome 2 |
| chr2_-_70520539 | 0.59 |
ENST00000482975.2
ENST00000438261.1 |
SNRPG
|
small nuclear ribonucleoprotein polypeptide G |
| chr17_-_39023462 | 0.57 |
ENST00000251643.4
|
KRT12
|
keratin 12 |
| chr1_+_26758790 | 0.56 |
ENST00000427245.2
ENST00000525682.2 ENST00000236342.7 ENST00000526219.1 ENST00000374185.3 ENST00000360009.2 |
DHDDS
|
dehydrodolichyl diphosphate synthase |
| chr7_+_66461798 | 0.56 |
ENST00000359626.5
ENST00000442959.1 |
TYW1
|
tRNA-yW synthesizing protein 1 homolog (S. cerevisiae) |
| chr5_+_143191726 | 0.56 |
ENST00000289448.2
|
HMHB1
|
histocompatibility (minor) HB-1 |
| chr17_+_36283971 | 0.55 |
ENST00000327454.6
ENST00000378174.5 |
TBC1D3F
|
TBC1 domain family, member 3F |
| chr2_+_145780739 | 0.54 |
ENST00000597173.1
ENST00000602108.1 ENST00000420472.1 |
TEX41
|
testis expressed 41 (non-protein coding) |
| chr7_+_76109827 | 0.51 |
ENST00000446820.2
|
DTX2
|
deltex homolog 2 (Drosophila) |
| chr9_-_128246769 | 0.49 |
ENST00000444226.1
|
MAPKAP1
|
mitogen-activated protein kinase associated protein 1 |
| chr4_+_70894130 | 0.46 |
ENST00000526767.1
ENST00000530128.1 ENST00000381057.3 |
HTN3
|
histatin 3 |
| chr5_-_135231516 | 0.45 |
ENST00000274520.1
|
IL9
|
interleukin 9 |
| chrX_-_130423386 | 0.43 |
ENST00000370903.3
|
IGSF1
|
immunoglobulin superfamily, member 1 |
| chr8_-_33370607 | 0.42 |
ENST00000360742.5
ENST00000523305.1 |
TTI2
|
TELO2 interacting protein 2 |
| chr1_+_2005425 | 0.40 |
ENST00000461106.2
|
PRKCZ
|
protein kinase C, zeta |
| chr3_-_15540055 | 0.37 |
ENST00000605797.1
ENST00000435459.2 |
COLQ
|
collagen-like tail subunit (single strand of homotrimer) of asymmetric acetylcholinesterase |
| chr12_-_10007448 | 0.37 |
ENST00000538152.1
|
CLEC2B
|
C-type lectin domain family 2, member B |
| chrX_-_80457385 | 0.36 |
ENST00000451455.1
ENST00000436386.1 ENST00000358130.2 |
HMGN5
|
high mobility group nucleosome binding domain 5 |
| chr10_+_13628933 | 0.36 |
ENST00000417658.1
ENST00000320054.4 |
PRPF18
|
pre-mRNA processing factor 18 |
| chr16_-_71264558 | 0.35 |
ENST00000448089.2
ENST00000393550.2 ENST00000448691.1 ENST00000393567.2 ENST00000321489.5 ENST00000539973.1 ENST00000288168.10 ENST00000545267.1 ENST00000541601.1 ENST00000538248.1 |
HYDIN
|
HYDIN, axonemal central pair apparatus protein |
| chr17_+_43224684 | 0.33 |
ENST00000332499.2
|
HEXIM1
|
hexamethylene bis-acetamide inducible 1 |
| chr4_-_16077741 | 0.33 |
ENST00000447510.2
ENST00000540805.1 ENST00000539194.1 |
PROM1
|
prominin 1 |
| chr11_-_87908600 | 0.32 |
ENST00000531138.1
ENST00000526372.1 ENST00000243662.6 |
RAB38
|
RAB38, member RAS oncogene family |
| chr11_+_57105991 | 0.29 |
ENST00000263314.2
|
P2RX3
|
purinergic receptor P2X, ligand-gated ion channel, 3 |
| chr14_+_24099318 | 0.27 |
ENST00000432832.2
|
DHRS2
|
dehydrogenase/reductase (SDR family) member 2 |
| chr5_+_119799927 | 0.27 |
ENST00000407149.2
ENST00000379551.2 |
PRR16
|
proline rich 16 |
| chr1_-_201368707 | 0.25 |
ENST00000391967.2
|
LAD1
|
ladinin 1 |
| chr2_-_70475730 | 0.25 |
ENST00000445587.1
ENST00000433529.2 ENST00000415783.2 |
TIA1
|
TIA1 cytotoxic granule-associated RNA binding protein |
| chr2_+_232135245 | 0.25 |
ENST00000446447.1
|
ARMC9
|
armadillo repeat containing 9 |
| chr1_-_165738085 | 0.25 |
ENST00000464650.1
ENST00000392129.6 |
TMCO1
|
transmembrane and coiled-coil domains 1 |
| chr5_-_169725231 | 0.24 |
ENST00000046794.5
|
LCP2
|
lymphocyte cytosolic protein 2 (SH2 domain containing leukocyte protein of 76kDa) |
| chr11_+_118175132 | 0.23 |
ENST00000361763.4
|
CD3E
|
CD3e molecule, epsilon (CD3-TCR complex) |
| chr19_-_51920873 | 0.21 |
ENST00000441969.3
ENST00000525998.1 ENST00000436984.2 |
SIGLEC10
|
sialic acid binding Ig-like lectin 10 |
| chr16_-_51185172 | 0.20 |
ENST00000251020.4
|
SALL1
|
spalt-like transcription factor 1 |
| chr18_+_32173276 | 0.20 |
ENST00000591816.1
ENST00000588125.1 ENST00000598334.1 ENST00000588684.1 ENST00000554864.3 ENST00000399121.5 ENST00000595022.1 ENST00000269190.7 ENST00000399097.3 |
DTNA
|
dystrobrevin, alpha |
| chr6_-_26033796 | 0.18 |
ENST00000259791.2
|
HIST1H2AB
|
histone cluster 1, H2ab |
| chr2_-_162931052 | 0.18 |
ENST00000360534.3
|
DPP4
|
dipeptidyl-peptidase 4 |
| chr12_-_56352368 | 0.16 |
ENST00000549404.1
|
PMEL
|
premelanosome protein |
| chr13_+_53602894 | 0.14 |
ENST00000219022.2
|
OLFM4
|
olfactomedin 4 |
| chr11_+_4788500 | 0.13 |
ENST00000380390.1
|
MMP26
|
matrix metallopeptidase 26 |
| chr19_+_50936142 | 0.09 |
ENST00000357701.5
|
MYBPC2
|
myosin binding protein C, fast type |
| chr1_-_8585945 | 0.09 |
ENST00000377464.1
|
RERE
|
arginine-glutamic acid dipeptide (RE) repeats |
| chr4_+_71063641 | 0.09 |
ENST00000514097.1
|
ODAM
|
odontogenic, ameloblast asssociated |
| chrX_-_64196376 | 0.07 |
ENST00000447788.2
|
ZC4H2
|
zinc finger, C4H2 domain containing |
| chr8_-_62602327 | 0.07 |
ENST00000445642.3
ENST00000517847.2 ENST00000389204.4 ENST00000517661.1 ENST00000517903.1 ENST00000522603.1 ENST00000522349.1 ENST00000522835.1 ENST00000541428.1 ENST00000518306.1 |
ASPH
|
aspartate beta-hydroxylase |
| chr1_-_201368653 | 0.06 |
ENST00000367313.3
|
LAD1
|
ladinin 1 |
| chrX_-_130423240 | 0.06 |
ENST00000370910.1
ENST00000370901.4 |
IGSF1
|
immunoglobulin superfamily, member 1 |
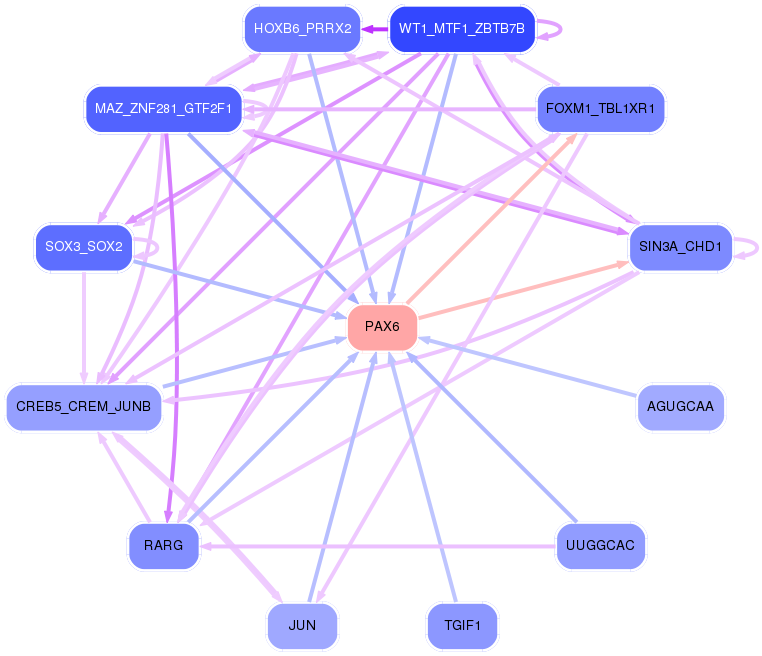
Network of associatons between targets according to the STRING database.

First level regulatory network of PAX6
Gene Ontology Analysis
Gene overrepresentation in biological_process category:
| Log-likelihood per target | Total log-likelihood | Term | Description |
|---|---|---|---|
| 4.8 | 19.2 | GO:0070982 | L-asparagine biosynthetic process(GO:0070981) L-asparagine metabolic process(GO:0070982) |
| 3.3 | 10.0 | GO:0070901 | mitochondrial tRNA methylation(GO:0070901) |
| 1.7 | 23.5 | GO:0070050 | neuron cellular homeostasis(GO:0070050) |
| 1.3 | 5.1 | GO:0009386 | translational attenuation(GO:0009386) |
| 1.2 | 3.7 | GO:0036309 | protein localization to M-band(GO:0036309) protein localization to T-tubule(GO:0036371) |
| 1.2 | 5.8 | GO:1900063 | regulation of peroxisome organization(GO:1900063) |
| 1.2 | 5.8 | GO:0097338 | response to clozapine(GO:0097338) |
| 1.1 | 3.2 | GO:0071030 | nuclear mRNA surveillance of spliceosomal pre-mRNA splicing(GO:0071030) nuclear retention of unspliced pre-mRNA at the site of transcription(GO:0071048) |
| 1.0 | 6.0 | GO:0031914 | negative regulation of synaptic plasticity(GO:0031914) |
| 0.9 | 5.6 | GO:0048254 | snoRNA localization(GO:0048254) |
| 0.9 | 7.2 | GO:0050859 | negative regulation of B cell receptor signaling pathway(GO:0050859) |
| 0.9 | 4.4 | GO:0000973 | posttranscriptional tethering of RNA polymerase II gene DNA at nuclear periphery(GO:0000973) |
| 0.8 | 0.8 | GO:0097374 | sensory neuron axon guidance(GO:0097374) |
| 0.8 | 2.4 | GO:1904868 | telomerase catalytic core complex assembly(GO:1904868) regulation of telomerase catalytic core complex assembly(GO:1904882) positive regulation of telomerase catalytic core complex assembly(GO:1904884) |
| 0.8 | 3.1 | GO:0051664 | nuclear pore distribution(GO:0031081) nuclear pore localization(GO:0051664) |
| 0.8 | 2.3 | GO:1902299 | pre-replicative complex assembly involved in nuclear cell cycle DNA replication(GO:0006267) pre-replicative complex assembly(GO:0036388) pre-replicative complex assembly involved in cell cycle DNA replication(GO:1902299) |
| 0.8 | 4.5 | GO:0030950 | establishment or maintenance of actin cytoskeleton polarity(GO:0030950) |
| 0.7 | 4.4 | GO:0006348 | chromatin silencing at telomere(GO:0006348) |
| 0.7 | 3.6 | GO:0018230 | peptidyl-L-cysteine S-palmitoylation(GO:0018230) peptidyl-S-diacylglycerol-L-cysteine biosynthetic process from peptidyl-cysteine(GO:0018231) |
| 0.7 | 2.0 | GO:0006422 | aspartyl-tRNA aminoacylation(GO:0006422) |
| 0.7 | 2.0 | GO:0006423 | cysteinyl-tRNA aminoacylation(GO:0006423) |
| 0.6 | 1.9 | GO:0035948 | positive regulation of gluconeogenesis by positive regulation of transcription from RNA polymerase II promoter(GO:0035948) |
| 0.6 | 5.8 | GO:0051611 | negative regulation of neurotransmitter uptake(GO:0051581) serotonin uptake(GO:0051610) regulation of serotonin uptake(GO:0051611) negative regulation of serotonin uptake(GO:0051612) |
| 0.5 | 6.3 | GO:0001915 | negative regulation of T cell mediated cytotoxicity(GO:0001915) |
| 0.5 | 1.4 | GO:0052056 | modulation by virus of host molecular function(GO:0039506) suppression by virus of host molecular function(GO:0039507) suppression by virus of host catalytic activity(GO:0039513) modulation by virus of host catalytic activity(GO:0039516) suppression by virus of host cysteine-type endopeptidase activity involved in apoptotic process(GO:0039650) negative regulation by symbiont of host catalytic activity(GO:0052053) negative regulation by symbiont of host molecular function(GO:0052056) modulation by symbiont of host catalytic activity(GO:0052148) |
| 0.5 | 4.3 | GO:0006682 | galactosylceramide biosynthetic process(GO:0006682) galactolipid biosynthetic process(GO:0019375) |
| 0.4 | 4.5 | GO:2000781 | positive regulation of double-strand break repair(GO:2000781) |
| 0.4 | 1.3 | GO:0002232 | leukocyte chemotaxis involved in inflammatory response(GO:0002232) cell surface pattern recognition receptor signaling pathway(GO:0002752) |
| 0.4 | 14.7 | GO:0008045 | motor neuron axon guidance(GO:0008045) |
| 0.4 | 2.3 | GO:0070560 | protein secretion by platelet(GO:0070560) |
| 0.4 | 1.1 | GO:0071051 | polyadenylation-dependent snoRNA 3'-end processing(GO:0071051) |
| 0.3 | 5.1 | GO:0090084 | negative regulation of inclusion body assembly(GO:0090084) |
| 0.3 | 2.8 | GO:0045039 | protein import into mitochondrial inner membrane(GO:0045039) |
| 0.3 | 2.4 | GO:0090394 | negative regulation of excitatory postsynaptic potential(GO:0090394) |
| 0.3 | 6.2 | GO:0006123 | mitochondrial electron transport, cytochrome c to oxygen(GO:0006123) |
| 0.3 | 3.1 | GO:0006983 | ER overload response(GO:0006983) |
| 0.3 | 1.4 | GO:0098502 | DNA dephosphorylation(GO:0098502) |
| 0.2 | 1.4 | GO:0035803 | egg coat formation(GO:0035803) |
| 0.2 | 1.2 | GO:0035524 | proline transmembrane transport(GO:0035524) |
| 0.2 | 1.4 | GO:1904879 | positive regulation of calcium ion transmembrane transport via high voltage-gated calcium channel(GO:1904879) |
| 0.2 | 1.6 | GO:1901529 | positive regulation of anion channel activity(GO:1901529) |
| 0.2 | 12.3 | GO:0007157 | heterophilic cell-cell adhesion via plasma membrane cell adhesion molecules(GO:0007157) |
| 0.2 | 4.5 | GO:0043923 | positive regulation by host of viral transcription(GO:0043923) |
| 0.2 | 1.2 | GO:0010724 | regulation of definitive erythrocyte differentiation(GO:0010724) |
| 0.2 | 13.5 | GO:0070125 | mitochondrial translational elongation(GO:0070125) mitochondrial translational termination(GO:0070126) |
| 0.2 | 2.3 | GO:0019885 | antigen processing and presentation of endogenous peptide antigen via MHC class I(GO:0019885) |
| 0.1 | 0.3 | GO:1904058 | positive regulation of sensory perception of pain(GO:1904058) |
| 0.1 | 2.5 | GO:0060670 | branching involved in labyrinthine layer morphogenesis(GO:0060670) |
| 0.1 | 1.1 | GO:0007258 | JUN phosphorylation(GO:0007258) |
| 0.1 | 1.0 | GO:1903760 | regulation of voltage-gated potassium channel activity involved in ventricular cardiac muscle cell action potential repolarization(GO:1903760) |
| 0.1 | 5.2 | GO:0051894 | positive regulation of focal adhesion assembly(GO:0051894) |
| 0.1 | 1.6 | GO:1904778 | regulation of protein localization to cell cortex(GO:1904776) positive regulation of protein localization to cell cortex(GO:1904778) |
| 0.1 | 0.9 | GO:0001574 | ganglioside biosynthetic process(GO:0001574) |
| 0.1 | 4.2 | GO:0006376 | mRNA splice site selection(GO:0006376) |
| 0.1 | 0.3 | GO:2000768 | positive regulation of nephron tubule epithelial cell differentiation(GO:2000768) |
| 0.1 | 2.2 | GO:0071803 | positive regulation of podosome assembly(GO:0071803) |
| 0.1 | 1.3 | GO:0035457 | cellular response to interferon-alpha(GO:0035457) |
| 0.1 | 2.5 | GO:0044849 | estrous cycle(GO:0044849) |
| 0.1 | 0.2 | GO:0072092 | ureteric bud invasion(GO:0072092) |
| 0.1 | 14.1 | GO:0046330 | positive regulation of JNK cascade(GO:0046330) |
| 0.1 | 4.1 | GO:0019985 | translesion synthesis(GO:0019985) |
| 0.1 | 0.7 | GO:0099566 | regulation of postsynaptic cytosolic calcium ion concentration(GO:0099566) |
| 0.1 | 0.6 | GO:0006489 | dolichyl diphosphate biosynthetic process(GO:0006489) dolichyl diphosphate metabolic process(GO:0046465) |
| 0.1 | 0.9 | GO:0006688 | glycosphingolipid biosynthetic process(GO:0006688) |
| 0.1 | 0.6 | GO:0015693 | magnesium ion transport(GO:0015693) |
| 0.1 | 2.9 | GO:1901661 | quinone metabolic process(GO:1901661) |
| 0.1 | 5.0 | GO:2000649 | regulation of sodium ion transmembrane transporter activity(GO:2000649) |
| 0.1 | 2.1 | GO:0010447 | response to acidic pH(GO:0010447) |
| 0.1 | 4.2 | GO:0006120 | mitochondrial electron transport, NADH to ubiquinone(GO:0006120) |
| 0.1 | 0.8 | GO:0072520 | seminiferous tubule development(GO:0072520) |
| 0.1 | 0.4 | GO:2000664 | positive regulation of interleukin-5 secretion(GO:2000664) |
| 0.1 | 0.4 | GO:1902715 | positive regulation of interferon-gamma secretion(GO:1902715) |
| 0.1 | 4.0 | GO:0061178 | regulation of insulin secretion involved in cellular response to glucose stimulus(GO:0061178) |
| 0.1 | 0.7 | GO:0009410 | xenobiotic metabolic process(GO:0006805) response to xenobiotic stimulus(GO:0009410) cellular response to xenobiotic stimulus(GO:0071466) |
| 0.1 | 0.3 | GO:0006581 | acetylcholine catabolic process in synaptic cleft(GO:0001507) acetylcholine catabolic process(GO:0006581) |
| 0.0 | 1.4 | GO:0051480 | regulation of cytosolic calcium ion concentration(GO:0051480) |
| 0.0 | 1.5 | GO:0031468 | nuclear envelope reassembly(GO:0031468) |
| 0.0 | 0.2 | GO:0002669 | positive regulation of T cell anergy(GO:0002669) positive regulation of lymphocyte anergy(GO:0002913) |
| 0.0 | 0.2 | GO:0036343 | psychomotor behavior(GO:0036343) |
| 0.0 | 0.3 | GO:1903232 | melanosome assembly(GO:1903232) |
| 0.0 | 0.1 | GO:0060054 | positive regulation of epithelial cell proliferation involved in wound healing(GO:0060054) |
| 0.0 | 4.0 | GO:0042100 | B cell proliferation(GO:0042100) |
| 0.0 | 8.4 | GO:0030307 | positive regulation of cell growth(GO:0030307) |
| 0.0 | 0.8 | GO:0045109 | intermediate filament organization(GO:0045109) |
| 0.0 | 2.0 | GO:0030490 | maturation of SSU-rRNA(GO:0030490) |
| 0.0 | 2.1 | GO:0001824 | blastocyst development(GO:0001824) |
| 0.0 | 2.7 | GO:0045071 | negative regulation of viral genome replication(GO:0045071) |
| 0.0 | 2.3 | GO:0032465 | regulation of cytokinesis(GO:0032465) |
| 0.0 | 0.7 | GO:0048821 | erythrocyte development(GO:0048821) |
| 0.0 | 3.2 | GO:0006892 | post-Golgi vesicle-mediated transport(GO:0006892) |
| 0.0 | 5.1 | GO:0002576 | platelet degranulation(GO:0002576) |
| 0.0 | 0.2 | GO:1903608 | protein localization to cytoplasmic stress granule(GO:1903608) |
| 0.0 | 2.1 | GO:0036498 | IRE1-mediated unfolded protein response(GO:0036498) |
| 0.0 | 1.7 | GO:0009301 | snRNA transcription(GO:0009301) snRNA transcription from RNA polymerase II promoter(GO:0042795) |
| 0.0 | 0.1 | GO:0021691 | cerebellar Purkinje cell layer maturation(GO:0021691) |
| 0.0 | 0.1 | GO:0042264 | peptidyl-aspartic acid hydroxylation(GO:0042264) |
| 0.0 | 0.6 | GO:0008334 | histone mRNA metabolic process(GO:0008334) |
| 0.0 | 1.4 | GO:0032508 | DNA duplex unwinding(GO:0032508) |
| 0.0 | 0.1 | GO:2000389 | regulation of neutrophil extravasation(GO:2000389) |
| 0.0 | 1.1 | GO:0002228 | natural killer cell mediated immunity(GO:0002228) |
| 0.0 | 0.3 | GO:0045793 | positive regulation of cell size(GO:0045793) |
| 0.0 | 2.4 | GO:0006024 | aminoglycan biosynthetic process(GO:0006023) glycosaminoglycan biosynthetic process(GO:0006024) |
| 0.0 | 0.9 | GO:0050911 | detection of chemical stimulus involved in sensory perception of smell(GO:0050911) |
| 0.0 | 0.3 | GO:1901798 | positive regulation of signal transduction by p53 class mediator(GO:1901798) |
| 0.0 | 0.4 | GO:0071157 | negative regulation of cell cycle arrest(GO:0071157) |
| 0.0 | 0.4 | GO:0021591 | ventricular system development(GO:0021591) trachea development(GO:0060438) |
| 0.0 | 0.4 | GO:0050832 | defense response to fungus(GO:0050832) |
| 0.0 | 0.3 | GO:0043011 | myeloid dendritic cell differentiation(GO:0043011) |
| 0.0 | 2.4 | GO:0008213 | protein methylation(GO:0006479) protein alkylation(GO:0008213) |
| 0.0 | 1.0 | GO:0030574 | collagen catabolic process(GO:0030574) |
| 0.0 | 1.1 | GO:0002027 | regulation of heart rate(GO:0002027) |
| 0.0 | 0.2 | GO:0032438 | melanosome organization(GO:0032438) pigment granule organization(GO:0048753) |
Gene overrepresentation in cellular_component category:
| Log-likelihood per target | Total log-likelihood | Term | Description |
|---|---|---|---|
| 1.6 | 4.7 | GO:0031515 | tRNA (m1A) methyltransferase complex(GO:0031515) |
| 1.5 | 6.0 | GO:0016533 | cyclin-dependent protein kinase 5 holoenzyme complex(GO:0016533) |
| 1.1 | 3.2 | GO:0071020 | post-spliceosomal complex(GO:0071020) |
| 1.1 | 5.3 | GO:0030678 | mitochondrial ribonuclease P complex(GO:0030678) |
| 0.8 | 2.3 | GO:0036387 | nuclear pre-replicative complex(GO:0005656) pre-replicative complex(GO:0036387) |
| 0.7 | 5.1 | GO:0070852 | cell body fiber(GO:0070852) |
| 0.7 | 5.6 | GO:0070761 | pre-snoRNP complex(GO:0070761) |
| 0.7 | 6.3 | GO:0005955 | calcineurin complex(GO:0005955) |
| 0.5 | 3.6 | GO:0002178 | palmitoyltransferase complex(GO:0002178) |
| 0.5 | 7.5 | GO:0031080 | nuclear pore outer ring(GO:0031080) |
| 0.4 | 1.3 | GO:0000308 | cytoplasmic cyclin-dependent protein kinase holoenzyme complex(GO:0000308) |
| 0.4 | 2.5 | GO:0070436 | Grb2-EGFR complex(GO:0070436) |
| 0.4 | 6.2 | GO:0045277 | respiratory chain complex IV(GO:0045277) |
| 0.3 | 2.8 | GO:0042719 | mitochondrial intermembrane space protein transporter complex(GO:0042719) |
| 0.3 | 13.5 | GO:0000315 | organellar large ribosomal subunit(GO:0000315) mitochondrial large ribosomal subunit(GO:0005762) |
| 0.3 | 5.8 | GO:0005952 | cAMP-dependent protein kinase complex(GO:0005952) |
| 0.3 | 4.5 | GO:0031932 | TORC2 complex(GO:0031932) |
| 0.2 | 2.3 | GO:0031095 | platelet dense tubular network membrane(GO:0031095) |
| 0.1 | 2.2 | GO:0008290 | F-actin capping protein complex(GO:0008290) Flemming body(GO:0090543) |
| 0.1 | 0.8 | GO:0042406 | extrinsic component of endoplasmic reticulum membrane(GO:0042406) |
| 0.1 | 0.7 | GO:0044308 | axonal spine(GO:0044308) |
| 0.1 | 7.2 | GO:0002102 | podosome(GO:0002102) |
| 0.1 | 2.9 | GO:0071004 | U2-type prespliceosome(GO:0071004) |
| 0.1 | 1.6 | GO:0008091 | spectrin(GO:0008091) |
| 0.1 | 9.3 | GO:0005758 | mitochondrial intermembrane space(GO:0005758) |
| 0.1 | 1.4 | GO:1990454 | L-type voltage-gated calcium channel complex(GO:1990454) |
| 0.1 | 2.3 | GO:0016281 | eukaryotic translation initiation factor 4F complex(GO:0016281) |
| 0.1 | 1.1 | GO:0000176 | nuclear exosome (RNase complex)(GO:0000176) |
| 0.1 | 2.0 | GO:0017101 | aminoacyl-tRNA synthetase multienzyme complex(GO:0017101) |
| 0.1 | 5.8 | GO:0032592 | integral component of mitochondrial membrane(GO:0032592) |
| 0.1 | 1.0 | GO:0097025 | lateral loop(GO:0043219) MPP7-DLG1-LIN7 complex(GO:0097025) |
| 0.1 | 3.7 | GO:0043034 | costamere(GO:0043034) |
| 0.1 | 1.4 | GO:0097342 | ripoptosome(GO:0097342) |
| 0.1 | 0.8 | GO:1990023 | mitotic spindle midzone(GO:1990023) |
| 0.1 | 0.3 | GO:0031905 | early endosome lumen(GO:0031905) |
| 0.1 | 2.1 | GO:0016592 | mediator complex(GO:0016592) |
| 0.1 | 0.4 | GO:0045179 | apical cortex(GO:0045179) |
| 0.0 | 0.2 | GO:0036398 | TCR signalosome(GO:0036398) |
| 0.0 | 6.6 | GO:0000784 | nuclear chromosome, telomeric region(GO:0000784) |
| 0.0 | 1.5 | GO:0030140 | trans-Golgi network transport vesicle(GO:0030140) |
| 0.0 | 0.2 | GO:0097165 | nuclear stress granule(GO:0097165) |
| 0.0 | 3.3 | GO:0016459 | myosin complex(GO:0016459) |
| 0.0 | 0.3 | GO:0043083 | synaptic cleft(GO:0043083) |
| 0.0 | 0.2 | GO:0046581 | intercellular canaliculus(GO:0046581) |
| 0.0 | 9.5 | GO:0005788 | endoplasmic reticulum lumen(GO:0005788) |
| 0.0 | 1.7 | GO:0042383 | sarcolemma(GO:0042383) |
| 0.0 | 0.2 | GO:0010369 | chromocenter(GO:0010369) |
| 0.0 | 3.8 | GO:0016607 | nuclear speck(GO:0016607) |
| 0.0 | 18.5 | GO:0048471 | perinuclear region of cytoplasm(GO:0048471) |
| 0.0 | 0.2 | GO:0042105 | alpha-beta T cell receptor complex(GO:0042105) |
| 0.0 | 0.4 | GO:0044447 | axoneme part(GO:0044447) |
| 0.0 | 2.4 | GO:0001650 | fibrillar center(GO:0001650) |
| 0.0 | 0.3 | GO:0031528 | microvillus membrane(GO:0031528) |
| 0.0 | 0.2 | GO:0032585 | multivesicular body membrane(GO:0032585) |
| 0.0 | 0.7 | GO:0055038 | recycling endosome membrane(GO:0055038) |
| 0.0 | 1.4 | GO:0017053 | transcriptional repressor complex(GO:0017053) |
| 0.0 | 0.7 | GO:0044306 | neuron projection terminus(GO:0044306) |
| 0.0 | 1.9 | GO:0031965 | nuclear membrane(GO:0031965) |
| 0.0 | 1.5 | GO:0045121 | membrane raft(GO:0045121) |
| 0.0 | 0.1 | GO:0032541 | cortical endoplasmic reticulum(GO:0032541) |
Gene overrepresentation in molecular_function category:
| Log-likelihood per target | Total log-likelihood | Term | Description |
|---|---|---|---|
| 3.8 | 19.2 | GO:0004066 | asparagine synthase (glutamine-hydrolyzing) activity(GO:0004066) |
| 1.6 | 4.7 | GO:0016426 | tRNA (adenine) methyltransferase activity(GO:0016426) tRNA (adenine-N1-)-methyltransferase activity(GO:0016429) |
| 1.4 | 4.3 | GO:0004719 | protein-L-isoaspartate (D-aspartate) O-methyltransferase activity(GO:0004719) |
| 1.1 | 3.2 | GO:0000386 | second spliceosomal transesterification activity(GO:0000386) |
| 1.0 | 6.0 | GO:0030548 | acetylcholine receptor regulator activity(GO:0030548) neurotransmitter receptor regulator activity(GO:0099602) |
| 0.8 | 2.3 | GO:0050211 | procollagen galactosyltransferase activity(GO:0050211) |
| 0.7 | 2.1 | GO:0015616 | DNA translocase activity(GO:0015616) |
| 0.7 | 2.0 | GO:0004817 | cysteine-tRNA ligase activity(GO:0004817) |
| 0.6 | 6.3 | GO:0033192 | calmodulin-dependent protein phosphatase activity(GO:0033192) |
| 0.5 | 2.9 | GO:0003960 | NADPH:quinone reductase activity(GO:0003960) |
| 0.4 | 2.0 | GO:0004815 | aspartate-tRNA ligase activity(GO:0004815) |
| 0.4 | 5.6 | GO:0001094 | TFIID-class transcription factor binding(GO:0001094) |
| 0.4 | 5.8 | GO:0004691 | cAMP-dependent protein kinase activity(GO:0004691) |
| 0.4 | 17.3 | GO:0046875 | ephrin receptor binding(GO:0046875) |
| 0.3 | 1.4 | GO:0051733 | ATP-dependent polydeoxyribonucleotide 5'-hydroxyl-kinase activity(GO:0046404) polydeoxyribonucleotide kinase activity(GO:0051733) ATP-dependent polynucleotide kinase activity(GO:0051734) polynucleotide phosphatase activity(GO:0098518) |
| 0.3 | 4.2 | GO:1990247 | N6-methyladenosine-containing RNA binding(GO:1990247) |
| 0.3 | 1.6 | GO:0090554 | phosphatidylcholine-translocating ATPase activity(GO:0090554) |
| 0.3 | 0.9 | GO:0001665 | alpha-N-acetylgalactosaminide alpha-2,6-sialyltransferase activity(GO:0001665) |
| 0.3 | 1.4 | GO:0097199 | cysteine-type endopeptidase activity involved in apoptotic signaling pathway(GO:0097199) |
| 0.3 | 5.3 | GO:0003857 | 3-hydroxyacyl-CoA dehydrogenase activity(GO:0003857) |
| 0.3 | 2.7 | GO:0001730 | 2'-5'-oligoadenylate synthetase activity(GO:0001730) |
| 0.2 | 5.1 | GO:0070628 | proteasome binding(GO:0070628) |
| 0.2 | 3.6 | GO:0019707 | protein-cysteine S-palmitoyltransferase activity(GO:0019706) protein-cysteine S-acyltransferase activity(GO:0019707) |
| 0.2 | 1.6 | GO:0050694 | galactosylceramide sulfotransferase activity(GO:0001733) galactose 3-O-sulfotransferase activity(GO:0050694) |
| 0.2 | 6.0 | GO:0004806 | triglyceride lipase activity(GO:0004806) |
| 0.2 | 1.2 | GO:0015193 | L-proline transmembrane transporter activity(GO:0015193) |
| 0.2 | 1.1 | GO:0023024 | MHC class I protein complex binding(GO:0023024) |
| 0.2 | 6.2 | GO:0016676 | cytochrome-c oxidase activity(GO:0004129) heme-copper terminal oxidase activity(GO:0015002) oxidoreductase activity, acting on a heme group of donors, oxygen as acceptor(GO:0016676) |
| 0.2 | 4.5 | GO:0070300 | phosphatidic acid binding(GO:0070300) |
| 0.2 | 2.4 | GO:0032407 | MutSalpha complex binding(GO:0032407) |
| 0.2 | 5.6 | GO:0017056 | structural constituent of nuclear pore(GO:0017056) |
| 0.2 | 1.1 | GO:0004705 | JUN kinase activity(GO:0004705) SAP kinase activity(GO:0016909) |
| 0.2 | 2.7 | GO:0034483 | heparan sulfate sulfotransferase activity(GO:0034483) |
| 0.2 | 1.6 | GO:0042731 | PH domain binding(GO:0042731) |
| 0.2 | 0.7 | GO:0004060 | arylamine N-acetyltransferase activity(GO:0004060) |
| 0.2 | 1.4 | GO:0086056 | voltage-gated calcium channel activity involved in AV node cell action potential(GO:0086056) |
| 0.2 | 2.4 | GO:0042043 | neurexin family protein binding(GO:0042043) |
| 0.2 | 1.4 | GO:0032190 | acrosin binding(GO:0032190) |
| 0.1 | 5.6 | GO:0030507 | spectrin binding(GO:0030507) |
| 0.1 | 3.2 | GO:0030898 | actin-dependent ATPase activity(GO:0030898) |
| 0.1 | 2.3 | GO:0003688 | DNA replication origin binding(GO:0003688) |
| 0.1 | 2.1 | GO:0001222 | transcription corepressor binding(GO:0001222) |
| 0.1 | 4.0 | GO:0023026 | MHC class II protein complex binding(GO:0023026) |
| 0.1 | 5.1 | GO:0005164 | tumor necrosis factor receptor binding(GO:0005164) |
| 0.1 | 2.3 | GO:0010485 | H4 histone acetyltransferase activity(GO:0010485) |
| 0.1 | 2.3 | GO:0070006 | metalloaminopeptidase activity(GO:0070006) |
| 0.1 | 4.0 | GO:0046966 | thyroid hormone receptor binding(GO:0046966) |
| 0.1 | 3.9 | GO:0004003 | ATP-dependent DNA helicase activity(GO:0004003) |
| 0.1 | 2.6 | GO:0035250 | UDP-galactosyltransferase activity(GO:0035250) |
| 0.1 | 1.0 | GO:0097016 | L27 domain binding(GO:0097016) |
| 0.1 | 0.7 | GO:0099583 | neurotransmitter receptor activity involved in regulation of postsynaptic membrane potential(GO:0099529) neurotransmitter receptor activity involved in regulation of postsynaptic cytosolic calcium ion concentration(GO:0099583) transmitter-gated ion channel activity involved in regulation of postsynaptic membrane potential(GO:1904315) |
| 0.1 | 1.5 | GO:0042609 | CD4 receptor binding(GO:0042609) |
| 0.1 | 4.2 | GO:0050136 | NADH dehydrogenase (ubiquinone) activity(GO:0008137) NADH dehydrogenase (quinone) activity(GO:0050136) |
| 0.1 | 0.3 | GO:0035651 | AP-1 adaptor complex binding(GO:0035650) AP-3 adaptor complex binding(GO:0035651) |
| 0.1 | 2.3 | GO:0070064 | proline-rich region binding(GO:0070064) |
| 0.1 | 0.9 | GO:0003836 | beta-galactoside (CMP) alpha-2,3-sialyltransferase activity(GO:0003836) |
| 0.1 | 13.5 | GO:0003735 | structural constituent of ribosome(GO:0003735) |
| 0.1 | 4.1 | GO:0004843 | thiol-dependent ubiquitin-specific protease activity(GO:0004843) |
| 0.1 | 0.3 | GO:0004090 | carbonyl reductase (NADPH) activity(GO:0004090) |
| 0.1 | 0.6 | GO:0015095 | magnesium ion transmembrane transporter activity(GO:0015095) |
| 0.1 | 3.3 | GO:0019213 | deacetylase activity(GO:0019213) |
| 0.0 | 1.7 | GO:0000983 | transcription factor activity, RNA polymerase II core promoter sequence-specific(GO:0000983) |
| 0.0 | 0.3 | GO:0097322 | 7SK snRNA binding(GO:0097322) |
| 0.0 | 2.1 | GO:0003899 | DNA-directed RNA polymerase activity(GO:0003899) |
| 0.0 | 0.6 | GO:0010181 | FMN binding(GO:0010181) |
| 0.0 | 0.2 | GO:0042608 | T cell receptor binding(GO:0042608) |
| 0.0 | 1.3 | GO:0030332 | cyclin binding(GO:0030332) |
| 0.0 | 2.3 | GO:0003743 | translation initiation factor activity(GO:0003743) |
| 0.0 | 0.4 | GO:0043560 | insulin receptor substrate binding(GO:0043560) |
| 0.0 | 3.5 | GO:0004222 | metalloendopeptidase activity(GO:0004222) |
| 0.0 | 1.1 | GO:0000175 | 3'-5'-exoribonuclease activity(GO:0000175) |
| 0.0 | 0.6 | GO:0004659 | prenyltransferase activity(GO:0004659) |
| 0.0 | 0.1 | GO:0008267 | poly-glutamine tract binding(GO:0008267) |
| 0.0 | 0.8 | GO:0051010 | microtubule plus-end binding(GO:0051010) |
| 0.0 | 2.7 | GO:0005262 | calcium channel activity(GO:0005262) |
| 0.0 | 0.7 | GO:0098641 | cadherin binding involved in cell-cell adhesion(GO:0098641) |
| 0.0 | 2.8 | GO:0051087 | chaperone binding(GO:0051087) |
| 0.0 | 15.1 | GO:0046982 | protein heterodimerization activity(GO:0046982) |
| 0.0 | 1.2 | GO:0017080 | sodium channel regulator activity(GO:0017080) |
| 0.0 | 19.2 | GO:0005509 | calcium ion binding(GO:0005509) |
| 0.0 | 3.8 | GO:0051015 | actin filament binding(GO:0051015) |
| 0.0 | 0.9 | GO:0004984 | olfactory receptor activity(GO:0004984) |
| 0.0 | 1.5 | GO:0043130 | ubiquitin binding(GO:0043130) |
| 0.0 | 0.4 | GO:0031492 | nucleosomal DNA binding(GO:0031492) |
| 0.0 | 0.3 | GO:0042805 | actinin binding(GO:0042805) |
| 0.0 | 1.2 | GO:0016779 | nucleotidyltransferase activity(GO:0016779) |
| 0.0 | 0.0 | GO:0034711 | inhibin binding(GO:0034711) |
| 0.0 | 3.8 | GO:0003712 | transcription cofactor activity(GO:0003712) |
| 0.0 | 6.5 | GO:0019901 | protein kinase binding(GO:0019901) |
| 0.0 | 1.5 | GO:0004386 | helicase activity(GO:0004386) |
Gene overrepresentation in C2:CP category:
| Log-likelihood per target | Total log-likelihood | Term | Description |
|---|---|---|---|
| 0.2 | 14.7 | PID RAC1 REG PATHWAY | Regulation of RAC1 activity |
| 0.1 | 8.0 | PID TCR CALCIUM PATHWAY | Calcium signaling in the CD4+ TCR pathway |
| 0.1 | 6.0 | PID LIS1 PATHWAY | Lissencephaly gene (LIS1) in neuronal migration and development |
| 0.1 | 7.1 | PID GMCSF PATHWAY | GMCSF-mediated signaling events |
| 0.1 | 25.1 | NABA ECM GLYCOPROTEINS | Genes encoding structural ECM glycoproteins |
| 0.1 | 2.4 | PID CIRCADIAN PATHWAY | Circadian rhythm pathway |
| 0.1 | 4.5 | PID PI3KCI AKT PATHWAY | Class I PI3K signaling events mediated by Akt |
| 0.1 | 5.2 | PID ILK PATHWAY | Integrin-linked kinase signaling |
| 0.1 | 4.5 | PID FOXM1 PATHWAY | FOXM1 transcription factor network |
| 0.1 | 1.4 | PID DNA PK PATHWAY | DNA-PK pathway in nonhomologous end joining |
| 0.1 | 1.4 | SA CASPASE CASCADE | Apoptosis is mediated by caspases, cysteine proteases arranged in a proteolytic cascade. |
| 0.0 | 4.0 | PID P75 NTR PATHWAY | p75(NTR)-mediated signaling |
| 0.0 | 1.0 | PID ECADHERIN NASCENT AJ PATHWAY | E-cadherin signaling in the nascent adherens junction |
| 0.0 | 0.9 | SIG BCR SIGNALING PATHWAY | Members of the BCR signaling pathway |
| 0.0 | 0.7 | PID EPHB FWD PATHWAY | EPHB forward signaling |
| 0.0 | 1.6 | PID HIF1 TFPATHWAY | HIF-1-alpha transcription factor network |
| 0.0 | 0.2 | PID TCR JNK PATHWAY | JNK signaling in the CD4+ TCR pathway |
| 0.0 | 0.7 | PID ARF6 TRAFFICKING PATHWAY | Arf6 trafficking events |
Gene overrepresentation in C2:CP:REACTOME category:
| Log-likelihood per target | Total log-likelihood | Term | Description |
|---|---|---|---|
| 0.8 | 11.1 | REACTOME TRYPTOPHAN CATABOLISM | Genes involved in Tryptophan catabolism |
| 0.7 | 19.2 | REACTOME AMINO ACID SYNTHESIS AND INTERCONVERSION TRANSAMINATION | Genes involved in Amino acid synthesis and interconversion (transamination) |
| 0.3 | 15.3 | REACTOME RECYCLING PATHWAY OF L1 | Genes involved in Recycling pathway of L1 |
| 0.3 | 18.0 | REACTOME DARPP 32 EVENTS | Genes involved in DARPP-32 events |
| 0.3 | 12.0 | REACTOME NEP NS2 INTERACTS WITH THE CELLULAR EXPORT MACHINERY | Genes involved in NEP/NS2 Interacts with the Cellular Export Machinery |
| 0.2 | 2.5 | REACTOME SPRY REGULATION OF FGF SIGNALING | Genes involved in Spry regulation of FGF signaling |
| 0.2 | 15.2 | REACTOME GOLGI ASSOCIATED VESICLE BIOGENESIS | Genes involved in Golgi Associated Vesicle Biogenesis |
| 0.2 | 5.3 | REACTOME BRANCHED CHAIN AMINO ACID CATABOLISM | Genes involved in Branched-chain amino acid catabolism |
| 0.2 | 2.3 | REACTOME CDC6 ASSOCIATION WITH THE ORC ORIGIN COMPLEX | Genes involved in CDC6 association with the ORC:origin complex |
| 0.2 | 2.4 | REACTOME REGULATION OF THE FANCONI ANEMIA PATHWAY | Genes involved in Regulation of the Fanconi anemia pathway |
| 0.2 | 5.2 | REACTOME CELL EXTRACELLULAR MATRIX INTERACTIONS | Genes involved in Cell-extracellular matrix interactions |
| 0.1 | 10.4 | REACTOME RESPIRATORY ELECTRON TRANSPORT | Genes involved in Respiratory electron transport |
| 0.1 | 1.6 | REACTOME ABACAVIR TRANSPORT AND METABOLISM | Genes involved in Abacavir transport and metabolism |
| 0.1 | 1.1 | REACTOME MRNA DECAY BY 3 TO 5 EXORIBONUCLEASE | Genes involved in mRNA Decay by 3' to 5' Exoribonuclease |
| 0.1 | 4.0 | REACTOME CYTOSOLIC TRNA AMINOACYLATION | Genes involved in Cytosolic tRNA aminoacylation |
| 0.1 | 4.5 | REACTOME CD28 DEPENDENT PI3K AKT SIGNALING | Genes involved in CD28 dependent PI3K/Akt signaling |
| 0.1 | 1.9 | REACTOME SYNTHESIS SECRETION AND DEACYLATION OF GHRELIN | Genes involved in Synthesis, Secretion, and Deacylation of Ghrelin |
| 0.1 | 1.6 | REACTOME SYNTHESIS OF SUBSTRATES IN N GLYCAN BIOSYTHESIS | Genes involved in Synthesis of substrates in N-glycan biosythesis |
| 0.1 | 1.4 | REACTOME NFKB ACTIVATION THROUGH FADD RIP1 PATHWAY MEDIATED BY CASPASE 8 AND10 | Genes involved in NF-kB activation through FADD/RIP-1 pathway mediated by caspase-8 and -10 |
| 0.1 | 13.9 | REACTOME SIGNALING BY RHO GTPASES | Genes involved in Signaling by Rho GTPases |
| 0.1 | 2.7 | REACTOME HS GAG BIOSYNTHESIS | Genes involved in HS-GAG biosynthesis |
| 0.1 | 1.1 | REACTOME ACTIVATION OF THE AP1 FAMILY OF TRANSCRIPTION FACTORS | Genes involved in Activation of the AP-1 family of transcription factors |
| 0.1 | 2.3 | REACTOME DEGRADATION OF THE EXTRACELLULAR MATRIX | Genes involved in Degradation of the extracellular matrix |
| 0.1 | 1.2 | REACTOME NA CL DEPENDENT NEUROTRANSMITTER TRANSPORTERS | Genes involved in Na+/Cl- dependent neurotransmitter transporters |
| 0.1 | 1.0 | REACTOME IONOTROPIC ACTIVITY OF KAINATE RECEPTORS | Genes involved in Ionotropic activity of Kainate Receptors |
| 0.1 | 2.3 | REACTOME ANTIVIRAL MECHANISM BY IFN STIMULATED GENES | Genes involved in Antiviral mechanism by IFN-stimulated genes |
| 0.0 | 1.7 | REACTOME RNA POL III TRANSCRIPTION INITIATION FROM TYPE 3 PROMOTER | Genes involved in RNA Polymerase III Transcription Initiation From Type 3 Promoter |
| 0.0 | 2.8 | REACTOME MITOCHONDRIAL PROTEIN IMPORT | Genes involved in Mitochondrial Protein Import |
| 0.0 | 4.0 | REACTOME INTERFERON ALPHA BETA SIGNALING | Genes involved in Interferon alpha/beta signaling |
| 0.0 | 0.7 | REACTOME TRAFFICKING OF GLUR2 CONTAINING AMPA RECEPTORS | Genes involved in Trafficking of GluR2-containing AMPA receptors |
| 0.0 | 5.6 | REACTOME RESPONSE TO ELEVATED PLATELET CYTOSOLIC CA2 | Genes involved in Response to elevated platelet cytosolic Ca2+ |
| 0.0 | 0.6 | REACTOME SLBP DEPENDENT PROCESSING OF REPLICATION DEPENDENT HISTONE PRE MRNAS | Genes involved in SLBP Dependent Processing of Replication-Dependent Histone Pre-mRNAs |
| 0.0 | 1.6 | REACTOME GLYCOSPHINGOLIPID METABOLISM | Genes involved in Glycosphingolipid metabolism |
| 0.0 | 0.8 | REACTOME KINESINS | Genes involved in Kinesins |
| 0.0 | 0.9 | REACTOME INHIBITION OF INSULIN SECRETION BY ADRENALINE NORADRENALINE | Genes involved in Inhibition of Insulin Secretion by Adrenaline/Noradrenaline |
| 0.0 | 2.1 | REACTOME ACTIVATION OF CHAPERONE GENES BY XBP1S | Genes involved in Activation of Chaperone Genes by XBP1(S) |
| 0.0 | 0.4 | REACTOME TGF BETA RECEPTOR SIGNALING IN EMT EPITHELIAL TO MESENCHYMAL TRANSITION | Genes involved in TGF-beta receptor signaling in EMT (epithelial to mesenchymal transition) |
| 0.0 | 0.5 | REACTOME ACTIVATED NOTCH1 TRANSMITS SIGNAL TO THE NUCLEUS | Genes involved in Activated NOTCH1 Transmits Signal to the Nucleus |
| 0.0 | 0.9 | REACTOME OLFACTORY SIGNALING PATHWAY | Genes involved in Olfactory Signaling Pathway |
| 0.0 | 0.2 | REACTOME SYNTHESIS SECRETION AND INACTIVATION OF GIP | Genes involved in Synthesis, Secretion, and Inactivation of Glucose-dependent Insulinotropic Polypeptide (GIP) |
| 0.0 | 2.1 | REACTOME PPARA ACTIVATES GENE EXPRESSION | Genes involved in PPARA Activates Gene Expression |
| 0.0 | 2.8 | REACTOME G ALPHA Q SIGNALLING EVENTS | Genes involved in G alpha (q) signalling events |
| 0.0 | 0.9 | REACTOME IMMUNOREGULATORY INTERACTIONS BETWEEN A LYMPHOID AND A NON LYMPHOID CELL | Genes involved in Immunoregulatory interactions between a Lymphoid and a non-Lymphoid cell |