Project
GNF SymAtlas + NCI-60 cancer cell lines, comparison of cancers vs non-cancers, human (Su, 2004; Ross, 2000)
Navigation
Downloads
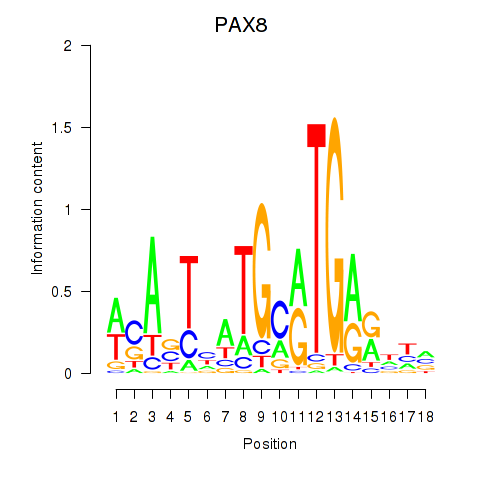
Results for PAX8
Z-value: 0.18
Motif logo
Transcription factors associated with PAX8
| Gene Symbol | Gene ID | Gene Info |
|---|---|---|
|
PAX8
|
ENSG00000125618.12 | paired box 8 |
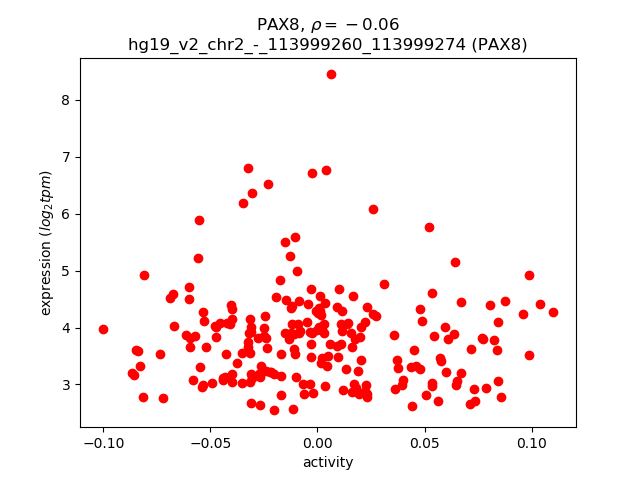
Activity-expression correlation:
| Gene | Promoter | Pearson corr. coef. | P-value | Plot |
|---|---|---|---|---|
| PAX8 | hg19_v2_chr2_-_113999260_113999274 | -0.06 | 4.0e-01 | Click! |
Activity profile of PAX8 motif
Sorted Z-values of PAX8 motif
| Promoter | Log-likelihood | Transcript | Gene | Gene Info |
|---|---|---|---|---|
| chrX_-_151938171 | 11.08 |
ENST00000393902.3
ENST00000417212.1 ENST00000370278.3 |
MAGEA3
|
melanoma antigen family A, 3 |
| chr1_-_27952741 | 10.05 |
ENST00000399173.1
|
FGR
|
feline Gardner-Rasheed sarcoma viral oncogene homolog |
| chr14_-_106054659 | 7.63 |
ENST00000390539.2
|
IGHA2
|
immunoglobulin heavy constant alpha 2 (A2m marker) |
| chrX_+_151867214 | 7.33 |
ENST00000329342.5
ENST00000412733.1 ENST00000457643.1 |
MAGEA6
|
melanoma antigen family A, 6 |
| chr6_-_27858570 | 7.30 |
ENST00000359303.2
|
HIST1H3J
|
histone cluster 1, H3j |
| chr2_+_90248739 | 6.52 |
ENST00000468879.1
|
IGKV1D-43
|
immunoglobulin kappa variable 1D-43 |
| chr11_-_58343319 | 6.12 |
ENST00000395074.2
|
LPXN
|
leupaxin |
| chr2_+_90198535 | 5.31 |
ENST00000390276.2
|
IGKV1D-12
|
immunoglobulin kappa variable 1D-12 |
| chr2_-_211179883 | 5.19 |
ENST00000352451.3
|
MYL1
|
myosin, light chain 1, alkali; skeletal, fast |
| chr22_+_22707260 | 5.11 |
ENST00000390293.1
|
IGLV5-48
|
immunoglobulin lambda variable 5-48 (non-functional) |
| chr11_+_117857063 | 4.99 |
ENST00000227752.3
ENST00000541785.1 ENST00000545409.1 |
IL10RA
|
interleukin 10 receptor, alpha |
| chr14_-_23288930 | 4.96 |
ENST00000554517.1
ENST00000285850.7 ENST00000397529.2 ENST00000555702.1 |
SLC7A7
|
solute carrier family 7 (amino acid transporter light chain, y+L system), member 7 |
| chrX_+_151903207 | 4.95 |
ENST00000370287.3
|
CSAG1
|
chondrosarcoma associated gene 1 |
| chr19_+_42301079 | 4.86 |
ENST00000596544.1
|
CEACAM3
|
carcinoembryonic antigen-related cell adhesion molecule 3 |
| chr2_-_179672142 | 4.60 |
ENST00000342992.6
ENST00000360870.5 ENST00000460472.2 ENST00000589042.1 ENST00000591111.1 ENST00000342175.6 ENST00000359218.5 |
TTN
|
titin |
| chr1_-_25256368 | 4.49 |
ENST00000308873.6
|
RUNX3
|
runt-related transcription factor 3 |
| chr19_-_37701386 | 4.42 |
ENST00000527838.1
ENST00000591492.1 ENST00000532828.2 |
ZNF585B
|
zinc finger protein 585B |
| chr6_-_44233361 | 4.34 |
ENST00000275015.5
|
NFKBIE
|
nuclear factor of kappa light polypeptide gene enhancer in B-cells inhibitor, epsilon |
| chr6_+_160542870 | 4.04 |
ENST00000324965.4
ENST00000457470.2 |
SLC22A1
|
solute carrier family 22 (organic cation transporter), member 1 |
| chr14_-_107114267 | 4.02 |
ENST00000454421.2
|
IGHV3-64
|
immunoglobulin heavy variable 3-64 |
| chr6_-_134639180 | 3.95 |
ENST00000367858.5
|
SGK1
|
serum/glucocorticoid regulated kinase 1 |
| chrX_-_151903184 | 3.84 |
ENST00000357916.4
ENST00000393869.3 |
MAGEA12
|
melanoma antigen family A, 12 |
| chr1_-_161600990 | 3.66 |
ENST00000531221.1
|
FCGR3B
|
Fc fragment of IgG, low affinity IIIb, receptor (CD16b) |
| chr22_+_21133469 | 3.55 |
ENST00000406799.1
|
SERPIND1
|
serpin peptidase inhibitor, clade D (heparin cofactor), member 1 |
| chr1_-_161600942 | 3.53 |
ENST00000421702.2
|
FCGR3B
|
Fc fragment of IgG, low affinity IIIb, receptor (CD16b) |
| chr2_+_90259593 | 3.51 |
ENST00000471857.1
|
IGKV1D-8
|
immunoglobulin kappa variable 1D-8 |
| chr10_+_135340859 | 3.50 |
ENST00000252945.3
ENST00000421586.1 ENST00000418356.1 |
CYP2E1
|
cytochrome P450, family 2, subfamily E, polypeptide 1 |
| chr17_+_1665345 | 3.48 |
ENST00000576406.1
ENST00000571149.1 |
SERPINF1
|
serpin peptidase inhibitor, clade F (alpha-2 antiplasmin, pigment epithelium derived factor), member 1 |
| chr12_-_123201337 | 3.45 |
ENST00000528880.2
|
HCAR3
|
hydroxycarboxylic acid receptor 3 |
| chr1_+_161494036 | 3.41 |
ENST00000309758.4
|
HSPA6
|
heat shock 70kDa protein 6 (HSP70B') |
| chr10_+_70847852 | 3.36 |
ENST00000242465.3
|
SRGN
|
serglycin |
| chr18_-_21017817 | 3.35 |
ENST00000542162.1
ENST00000383233.3 ENST00000582336.1 ENST00000450466.2 ENST00000578520.1 ENST00000399707.1 |
TMEM241
|
transmembrane protein 241 |
| chr19_-_51538118 | 3.33 |
ENST00000529888.1
|
KLK12
|
kallikrein-related peptidase 12 |
| chr2_-_79313973 | 3.29 |
ENST00000454188.1
|
REG1B
|
regenerating islet-derived 1 beta |
| chr12_-_123187890 | 3.28 |
ENST00000328880.5
|
HCAR2
|
hydroxycarboxylic acid receptor 2 |
| chr1_-_161600822 | 3.25 |
ENST00000534776.1
ENST00000540048.1 |
FCGR3B
FCGR3A
|
Fc fragment of IgG, low affinity IIIb, receptor (CD16b) Fc fragment of IgG, low affinity IIIa, receptor (CD16a) |
| chr19_-_52133588 | 3.21 |
ENST00000570106.2
|
SIGLEC5
|
sialic acid binding Ig-like lectin 5 |
| chr6_+_160542821 | 3.11 |
ENST00000366963.4
|
SLC22A1
|
solute carrier family 22 (organic cation transporter), member 1 |
| chr11_+_60223312 | 3.11 |
ENST00000532491.1
ENST00000532073.1 ENST00000534668.1 ENST00000528313.1 ENST00000533306.1 |
MS4A1
|
membrane-spanning 4-domains, subfamily A, member 1 |
| chr6_+_14117872 | 3.08 |
ENST00000379153.3
|
CD83
|
CD83 molecule |
| chr1_-_153013588 | 3.04 |
ENST00000360379.3
|
SPRR2D
|
small proline-rich protein 2D |
| chr11_+_60223225 | 2.99 |
ENST00000524807.1
ENST00000345732.4 |
MS4A1
|
membrane-spanning 4-domains, subfamily A, member 1 |
| chr11_-_47870091 | 2.97 |
ENST00000526870.1
|
NUP160
|
nucleoporin 160kDa |
| chr2_+_79252834 | 2.93 |
ENST00000409471.1
|
REG3G
|
regenerating islet-derived 3 gamma |
| chr22_+_21128167 | 2.93 |
ENST00000215727.5
|
SERPIND1
|
serpin peptidase inhibitor, clade D (heparin cofactor), member 1 |
| chr17_+_7462103 | 2.90 |
ENST00000396545.4
|
TNFSF13
|
tumor necrosis factor (ligand) superfamily, member 13 |
| chr13_+_31309645 | 2.89 |
ENST00000380490.3
|
ALOX5AP
|
arachidonate 5-lipoxygenase-activating protein |
| chrX_+_151883090 | 2.87 |
ENST00000370293.2
ENST00000423993.1 ENST00000447530.1 ENST00000458057.1 ENST00000331220.2 ENST00000422085.1 ENST00000453150.1 ENST00000409560.1 |
MAGEA2B
|
melanoma antigen family A, 2B |
| chr19_-_51537982 | 2.86 |
ENST00000525263.1
|
KLK12
|
kallikrein-related peptidase 12 |
| chr17_+_7461849 | 2.82 |
ENST00000338784.4
|
TNFSF13
|
tumor necrosis factor (ligand) superfamily, member 13 |
| chr2_+_90192768 | 2.81 |
ENST00000390275.2
|
IGKV1D-13
|
immunoglobulin kappa variable 1D-13 |
| chr15_+_89631647 | 2.81 |
ENST00000569550.1
ENST00000565066.1 ENST00000565973.1 |
ABHD2
|
abhydrolase domain containing 2 |
| chr19_+_52901094 | 2.81 |
ENST00000391788.2
ENST00000436397.1 ENST00000391787.2 ENST00000360465.3 ENST00000494167.2 ENST00000493272.1 |
ZNF528
|
zinc finger protein 528 |
| chr19_-_51538148 | 2.78 |
ENST00000319590.4
ENST00000250351.4 |
KLK12
|
kallikrein-related peptidase 12 |
| chr3_+_121796697 | 2.76 |
ENST00000482356.1
ENST00000393627.2 |
CD86
|
CD86 molecule |
| chr9_-_116837249 | 2.73 |
ENST00000466610.2
|
AMBP
|
alpha-1-microglobulin/bikunin precursor |
| chr17_+_7461781 | 2.72 |
ENST00000349228.4
|
TNFSF13
|
tumor necrosis factor (ligand) superfamily, member 13 |
| chr2_+_79252822 | 2.70 |
ENST00000272324.5
|
REG3G
|
regenerating islet-derived 3 gamma |
| chr2_-_152590946 | 2.63 |
ENST00000172853.10
|
NEB
|
nebulin |
| chr2_-_79386786 | 2.60 |
ENST00000393878.1
ENST00000305165.2 ENST00000409839.3 |
REG3A
|
regenerating islet-derived 3 alpha |
| chr2_+_79252804 | 2.58 |
ENST00000393897.2
|
REG3G
|
regenerating islet-derived 3 gamma |
| chr2_-_152590982 | 2.52 |
ENST00000409198.1
ENST00000397345.3 ENST00000427231.2 |
NEB
|
nebulin |
| chr17_+_7462031 | 2.52 |
ENST00000380535.4
|
TNFSF13
|
tumor necrosis factor (ligand) superfamily, member 13 |
| chr8_-_21771182 | 2.46 |
ENST00000523932.1
ENST00000544659.1 |
DOK2
|
docking protein 2, 56kDa |
| chr11_-_62457371 | 2.41 |
ENST00000317449.4
|
LRRN4CL
|
LRRN4 C-terminal like |
| chr1_-_119683251 | 2.36 |
ENST00000369426.5
ENST00000235521.4 |
WARS2
|
tryptophanyl tRNA synthetase 2, mitochondrial |
| chr13_-_95131923 | 2.34 |
ENST00000377028.5
ENST00000446125.1 |
DCT
|
dopachrome tautomerase |
| chr17_-_44657017 | 2.33 |
ENST00000573185.1
ENST00000570550.1 ENST00000445552.2 ENST00000336125.5 ENST00000329240.4 ENST00000337845.7 |
ARL17A
|
ADP-ribosylation factor-like 17A |
| chr9_+_124048864 | 2.28 |
ENST00000545652.1
|
GSN
|
gelsolin |
| chr19_-_40228657 | 2.24 |
ENST00000221804.4
|
CLC
|
Charcot-Leyden crystal galectin |
| chr3_-_49158218 | 2.20 |
ENST00000417901.1
ENST00000306026.5 ENST00000434032.2 |
USP19
|
ubiquitin specific peptidase 19 |
| chr3_+_125694347 | 2.19 |
ENST00000505382.1
ENST00000511082.1 |
ROPN1B
|
rhophilin associated tail protein 1B |
| chr1_-_119682812 | 2.13 |
ENST00000537870.1
|
WARS2
|
tryptophanyl tRNA synthetase 2, mitochondrial |
| chr19_+_17337473 | 2.13 |
ENST00000598068.1
|
OCEL1
|
occludin/ELL domain containing 1 |
| chr1_+_171227069 | 2.07 |
ENST00000354841.4
|
FMO1
|
flavin containing monooxygenase 1 |
| chr11_+_9482551 | 2.02 |
ENST00000438144.2
ENST00000526657.1 ENST00000299606.2 ENST00000534265.1 ENST00000412390.2 |
ZNF143
|
zinc finger protein 143 |
| chr17_+_7461613 | 2.01 |
ENST00000438470.1
ENST00000436057.1 |
TNFSF13
|
tumor necrosis factor (ligand) superfamily, member 13 |
| chr6_-_32784687 | 1.98 |
ENST00000447394.1
ENST00000438763.2 |
HLA-DOB
|
major histocompatibility complex, class II, DO beta |
| chr1_+_13359819 | 1.94 |
ENST00000376168.1
|
PRAMEF5
|
PRAME family member 5 |
| chr14_+_22458631 | 1.94 |
ENST00000390444.1
|
TRAV16
|
T cell receptor alpha variable 16 |
| chr19_-_7766991 | 1.93 |
ENST00000597921.1
ENST00000346664.5 |
FCER2
|
Fc fragment of IgE, low affinity II, receptor for (CD23) |
| chr3_-_49158312 | 1.92 |
ENST00000398892.3
ENST00000453664.1 ENST00000398888.2 |
USP19
|
ubiquitin specific peptidase 19 |
| chr3_+_186435065 | 1.90 |
ENST00000287611.2
ENST00000265023.4 |
KNG1
|
kininogen 1 |
| chr2_-_37193606 | 1.86 |
ENST00000379213.2
ENST00000263918.4 |
STRN
|
striatin, calmodulin binding protein |
| chr17_+_67410832 | 1.83 |
ENST00000590474.1
|
MAP2K6
|
mitogen-activated protein kinase kinase 6 |
| chrX_-_71458802 | 1.81 |
ENST00000373657.1
ENST00000334463.3 |
ERCC6L
|
excision repair cross-complementing rodent repair deficiency, complementation group 6-like |
| chr4_+_69681710 | 1.80 |
ENST00000265403.7
ENST00000458688.2 |
UGT2B10
|
UDP glucuronosyltransferase 2 family, polypeptide B10 |
| chr17_-_44439084 | 1.79 |
ENST00000575960.1
ENST00000575698.1 ENST00000571246.1 ENST00000434041.2 ENST00000570618.1 ENST00000450673.3 |
ARL17B
|
ADP-ribosylation factor-like 17B |
| chr11_+_9482512 | 1.78 |
ENST00000396602.2
ENST00000530463.1 ENST00000533542.1 ENST00000532577.1 ENST00000396597.3 |
ZNF143
|
zinc finger protein 143 |
| chr13_+_51483814 | 1.77 |
ENST00000336617.3
ENST00000422660.1 |
RNASEH2B
|
ribonuclease H2, subunit B |
| chr12_+_133757995 | 1.75 |
ENST00000536435.2
ENST00000228289.5 ENST00000541211.2 ENST00000500625.3 ENST00000539248.2 ENST00000542711.2 ENST00000536899.2 ENST00000542986.2 ENST00000537565.1 ENST00000541975.2 |
ZNF268
|
zinc finger protein 268 |
| chr4_-_80329356 | 1.75 |
ENST00000358842.3
|
GK2
|
glycerol kinase 2 |
| chr3_+_190105909 | 1.73 |
ENST00000456423.1
|
CLDN16
|
claudin 16 |
| chr1_+_15943995 | 1.72 |
ENST00000480945.1
|
DDI2
|
DNA-damage inducible 1 homolog 2 (S. cerevisiae) |
| chr17_+_7461580 | 1.72 |
ENST00000483039.1
ENST00000396542.1 |
TNFSF13
|
tumor necrosis factor (ligand) superfamily, member 13 |
| chr15_+_89631381 | 1.70 |
ENST00000352732.5
|
ABHD2
|
abhydrolase domain containing 2 |
| chr16_-_20367584 | 1.70 |
ENST00000570689.1
|
UMOD
|
uromodulin |
| chr6_+_135502408 | 1.70 |
ENST00000341911.5
ENST00000442647.2 ENST00000316528.8 |
MYB
|
v-myb avian myeloblastosis viral oncogene homolog |
| chr15_-_38519066 | 1.69 |
ENST00000561320.1
ENST00000561161.1 |
RP11-346D14.1
|
RP11-346D14.1 |
| chr12_-_9360966 | 1.64 |
ENST00000261336.2
|
PZP
|
pregnancy-zone protein |
| chr6_-_82462425 | 1.63 |
ENST00000369754.3
ENST00000320172.6 ENST00000369756.3 |
FAM46A
|
family with sequence similarity 46, member A |
| chr9_+_27109392 | 1.59 |
ENST00000406359.4
|
TEK
|
TEK tyrosine kinase, endothelial |
| chr1_+_100818156 | 1.57 |
ENST00000336454.3
|
CDC14A
|
cell division cycle 14A |
| chr11_+_7626950 | 1.55 |
ENST00000530181.1
|
PPFIBP2
|
PTPRF interacting protein, binding protein 2 (liprin beta 2) |
| chr11_-_104905840 | 1.52 |
ENST00000526568.1
ENST00000393136.4 ENST00000531166.1 ENST00000534497.1 ENST00000527979.1 ENST00000446369.1 ENST00000353247.5 ENST00000528974.1 ENST00000533400.1 ENST00000525825.1 ENST00000436863.3 |
CASP1
|
caspase 1, apoptosis-related cysteine peptidase |
| chr12_+_57828521 | 1.52 |
ENST00000309668.2
|
INHBC
|
inhibin, beta C |
| chr6_+_135502501 | 1.51 |
ENST00000527615.1
ENST00000420123.2 ENST00000525369.1 ENST00000528774.1 ENST00000534121.1 ENST00000534044.1 ENST00000533624.1 |
MYB
|
v-myb avian myeloblastosis viral oncogene homolog |
| chr1_+_160709029 | 1.48 |
ENST00000444090.2
ENST00000441662.2 |
SLAMF7
|
SLAM family member 7 |
| chr8_-_20040638 | 1.47 |
ENST00000519026.1
ENST00000276373.5 ENST00000440926.1 ENST00000437980.1 |
SLC18A1
|
solute carrier family 18 (vesicular monoamine transporter), member 1 |
| chr6_+_135502466 | 1.47 |
ENST00000367814.4
|
MYB
|
v-myb avian myeloblastosis viral oncogene homolog |
| chr4_+_118955500 | 1.47 |
ENST00000296499.5
|
NDST3
|
N-deacetylase/N-sulfotransferase (heparan glucosaminyl) 3 |
| chr4_-_70361579 | 1.46 |
ENST00000512583.1
|
UGT2B4
|
UDP glucuronosyltransferase 2 family, polypeptide B4 |
| chr12_-_110883346 | 1.45 |
ENST00000547365.1
|
ARPC3
|
actin related protein 2/3 complex, subunit 3, 21kDa |
| chr17_-_33760269 | 1.41 |
ENST00000452764.3
|
SLFN12
|
schlafen family member 12 |
| chr10_+_35484793 | 1.41 |
ENST00000488741.1
ENST00000474931.1 ENST00000468236.1 ENST00000344351.5 ENST00000490511.1 |
CREM
|
cAMP responsive element modulator |
| chr1_+_40915725 | 1.41 |
ENST00000484445.1
ENST00000411995.2 ENST00000361584.3 |
ZFP69B
|
ZFP69 zinc finger protein B |
| chr19_+_54704610 | 1.40 |
ENST00000302907.4
|
RPS9
|
ribosomal protein S9 |
| chr15_-_35088340 | 1.39 |
ENST00000290378.4
|
ACTC1
|
actin, alpha, cardiac muscle 1 |
| chr4_-_70361615 | 1.37 |
ENST00000305107.6
|
UGT2B4
|
UDP glucuronosyltransferase 2 family, polypeptide B4 |
| chr7_+_95115210 | 1.37 |
ENST00000428113.1
ENST00000325885.5 |
ASB4
|
ankyrin repeat and SOCS box containing 4 |
| chr16_+_2083265 | 1.35 |
ENST00000565855.1
ENST00000566198.1 |
SLC9A3R2
|
solute carrier family 9, subfamily A (NHE3, cation proton antiporter 3), member 3 regulator 2 |
| chr10_+_96443378 | 1.34 |
ENST00000285979.6
|
CYP2C18
|
cytochrome P450, family 2, subfamily C, polypeptide 18 |
| chr7_+_107384142 | 1.27 |
ENST00000440859.3
|
CBLL1
|
Cbl proto-oncogene-like 1, E3 ubiquitin protein ligase |
| chr19_-_51487282 | 1.27 |
ENST00000595820.1
ENST00000597707.1 ENST00000336317.4 |
KLK7
|
kallikrein-related peptidase 7 |
| chr19_-_44860820 | 1.27 |
ENST00000354340.4
ENST00000337401.4 ENST00000587909.1 |
ZNF112
|
zinc finger protein 112 |
| chr19_+_54704718 | 1.26 |
ENST00000391752.1
ENST00000402367.1 ENST00000391751.3 |
RPS9
|
ribosomal protein S9 |
| chr12_-_53074182 | 1.23 |
ENST00000252244.3
|
KRT1
|
keratin 1 |
| chr16_+_33006369 | 1.21 |
ENST00000425181.3
|
IGHV3OR16-10
|
immunoglobulin heavy variable 3/OR16-10 (non-functional) |
| chr4_-_46911223 | 1.21 |
ENST00000396533.1
|
COX7B2
|
cytochrome c oxidase subunit VIIb2 |
| chr10_-_104597286 | 1.20 |
ENST00000369887.3
|
CYP17A1
|
cytochrome P450, family 17, subfamily A, polypeptide 1 |
| chr6_+_161123270 | 1.20 |
ENST00000366924.2
ENST00000308192.9 ENST00000418964.1 |
PLG
|
plasminogen |
| chr11_+_64323156 | 1.19 |
ENST00000377585.3
|
SLC22A11
|
solute carrier family 22 (organic anion/urate transporter), member 11 |
| chr6_+_43266063 | 1.16 |
ENST00000372574.3
|
SLC22A7
|
solute carrier family 22 (organic anion transporter), member 7 |
| chr3_-_150264272 | 1.16 |
ENST00000491660.1
ENST00000487153.1 ENST00000239944.2 |
SERP1
|
stress-associated endoplasmic reticulum protein 1 |
| chr3_+_186435137 | 1.13 |
ENST00000447445.1
|
KNG1
|
kininogen 1 |
| chr6_+_72922505 | 1.12 |
ENST00000401910.3
|
RIMS1
|
regulating synaptic membrane exocytosis 1 |
| chr21_-_35883541 | 1.11 |
ENST00000399284.1
|
KCNE1
|
potassium voltage-gated channel, Isk-related family, member 1 |
| chr1_-_186649543 | 1.11 |
ENST00000367468.5
|
PTGS2
|
prostaglandin-endoperoxide synthase 2 (prostaglandin G/H synthase and cyclooxygenase) |
| chr22_+_38082330 | 1.11 |
ENST00000359114.4
|
NOL12
|
nucleolar protein 12 |
| chr5_+_43603229 | 1.11 |
ENST00000344920.4
ENST00000512996.2 |
NNT
|
nicotinamide nucleotide transhydrogenase |
| chr6_+_72926145 | 1.10 |
ENST00000425662.2
ENST00000453976.2 |
RIMS1
|
regulating synaptic membrane exocytosis 1 |
| chr8_+_31496809 | 1.09 |
ENST00000518104.1
ENST00000519301.1 |
NRG1
|
neuregulin 1 |
| chr8_-_13372253 | 1.08 |
ENST00000316609.5
|
DLC1
|
deleted in liver cancer 1 |
| chr1_+_182419261 | 1.07 |
ENST00000294854.8
ENST00000542961.1 |
RGSL1
|
regulator of G-protein signaling like 1 |
| chr11_-_47870019 | 1.07 |
ENST00000378460.2
|
NUP160
|
nucleoporin 160kDa |
| chr11_-_47869865 | 1.07 |
ENST00000530326.1
ENST00000532747.1 |
NUP160
|
nucleoporin 160kDa |
| chr20_-_3762087 | 1.07 |
ENST00000379756.3
|
SPEF1
|
sperm flagellar 1 |
| chr11_+_113185292 | 1.05 |
ENST00000429951.1
ENST00000442859.1 ENST00000531164.1 ENST00000529850.1 ENST00000314756.3 ENST00000525965.1 |
TTC12
|
tetratricopeptide repeat domain 12 |
| chr19_-_54804173 | 1.04 |
ENST00000391744.3
ENST00000251390.3 |
LILRA3
|
leukocyte immunoglobulin-like receptor, subfamily A (without TM domain), member 3 |
| chr8_+_27168988 | 1.02 |
ENST00000397501.1
ENST00000338238.4 ENST00000544172.1 |
PTK2B
|
protein tyrosine kinase 2 beta |
| chr6_+_43739697 | 0.98 |
ENST00000230480.6
|
VEGFA
|
vascular endothelial growth factor A |
| chr19_+_18794470 | 0.98 |
ENST00000321949.8
ENST00000338797.6 |
CRTC1
|
CREB regulated transcription coactivator 1 |
| chr6_+_72922590 | 0.95 |
ENST00000523963.1
|
RIMS1
|
regulating synaptic membrane exocytosis 1 |
| chr17_-_73505961 | 0.93 |
ENST00000433559.2
|
CASKIN2
|
CASK interacting protein 2 |
| chr2_-_128615681 | 0.93 |
ENST00000409955.1
ENST00000272645.4 |
POLR2D
|
polymerase (RNA) II (DNA directed) polypeptide D |
| chr14_+_22446680 | 0.93 |
ENST00000390443.3
|
TRAV8-6
|
T cell receptor alpha variable 8-6 |
| chr12_-_89919965 | 0.92 |
ENST00000548729.1
|
POC1B-GALNT4
|
POC1B-GALNT4 readthrough |
| chr7_+_7606497 | 0.91 |
ENST00000340080.4
ENST00000405785.1 ENST00000433635.1 |
MIOS
|
missing oocyte, meiosis regulator, homolog (Drosophila) |
| chr1_-_173176452 | 0.91 |
ENST00000281834.3
|
TNFSF4
|
tumor necrosis factor (ligand) superfamily, member 4 |
| chr2_+_191334212 | 0.91 |
ENST00000444317.1
ENST00000535751.1 |
MFSD6
|
major facilitator superfamily domain containing 6 |
| chr1_-_153514241 | 0.89 |
ENST00000368718.1
ENST00000359215.1 |
S100A5
|
S100 calcium binding protein A5 |
| chr22_+_22730353 | 0.87 |
ENST00000390296.2
|
IGLV5-45
|
immunoglobulin lambda variable 5-45 |
| chr7_+_149535455 | 0.86 |
ENST00000223210.4
ENST00000460379.1 |
ZNF862
|
zinc finger protein 862 |
| chr15_+_67420441 | 0.86 |
ENST00000558894.1
|
SMAD3
|
SMAD family member 3 |
| chr17_-_27278304 | 0.85 |
ENST00000577226.1
|
PHF12
|
PHD finger protein 12 |
| chr4_-_75695366 | 0.83 |
ENST00000512743.1
|
BTC
|
betacellulin |
| chr18_-_29264467 | 0.82 |
ENST00000383131.3
ENST00000237019.7 |
B4GALT6
|
UDP-Gal:betaGlcNAc beta 1,4- galactosyltransferase, polypeptide 6 |
| chr12_+_26348582 | 0.82 |
ENST00000535504.1
|
SSPN
|
sarcospan |
| chr12_-_86650077 | 0.79 |
ENST00000552808.2
ENST00000547225.1 |
MGAT4C
|
mannosyl (alpha-1,3-)-glycoprotein beta-1,4-N-acetylglucosaminyltransferase, isozyme C (putative) |
| chr1_+_171283331 | 0.78 |
ENST00000367749.3
|
FMO4
|
flavin containing monooxygenase 4 |
| chr9_+_27109133 | 0.77 |
ENST00000519097.1
ENST00000380036.4 |
TEK
|
TEK tyrosine kinase, endothelial |
| chr4_+_75230853 | 0.75 |
ENST00000244869.2
|
EREG
|
epiregulin |
| chr12_-_86650045 | 0.75 |
ENST00000604798.1
|
MGAT4C
|
mannosyl (alpha-1,3-)-glycoprotein beta-1,4-N-acetylglucosaminyltransferase, isozyme C (putative) |
| chr17_-_3499125 | 0.73 |
ENST00000399759.3
|
TRPV1
|
transient receptor potential cation channel, subfamily V, member 1 |
| chr12_+_122516626 | 0.73 |
ENST00000319080.7
|
MLXIP
|
MLX interacting protein |
| chr9_+_111624577 | 0.72 |
ENST00000333999.3
|
ACTL7A
|
actin-like 7A |
| chr7_+_143657027 | 0.72 |
ENST00000392899.1
|
OR2F1
|
olfactory receptor, family 2, subfamily F, member 1 (gene/pseudogene) |
| chr1_-_169703203 | 0.72 |
ENST00000333360.7
ENST00000367781.4 ENST00000367782.4 ENST00000367780.4 ENST00000367779.4 |
SELE
|
selectin E |
| chr4_-_168155169 | 0.70 |
ENST00000534949.1
ENST00000535728.1 |
SPOCK3
|
sparc/osteonectin, cwcv and kazal-like domains proteoglycan (testican) 3 |
| chr11_+_113185251 | 0.69 |
ENST00000529221.1
|
TTC12
|
tetratricopeptide repeat domain 12 |
| chr12_+_7167980 | 0.69 |
ENST00000360817.5
ENST00000402681.3 |
C1S
|
complement component 1, s subcomponent |
| chr2_+_185463093 | 0.68 |
ENST00000302277.6
|
ZNF804A
|
zinc finger protein 804A |
| chr19_-_7812397 | 0.66 |
ENST00000593660.1
ENST00000354397.6 ENST00000593821.1 ENST00000602261.1 ENST00000315591.8 ENST00000394161.5 ENST00000204801.8 ENST00000601256.1 ENST00000601951.1 ENST00000315599.7 |
CD209
|
CD209 molecule |
| chr7_-_99277610 | 0.65 |
ENST00000343703.5
ENST00000222982.4 ENST00000439761.1 ENST00000339843.2 |
CYP3A5
|
cytochrome P450, family 3, subfamily A, polypeptide 5 |
| chr1_-_222763240 | 0.65 |
ENST00000352967.4
ENST00000391882.1 ENST00000543857.1 |
TAF1A
|
TATA box binding protein (TBP)-associated factor, RNA polymerase I, A, 48kDa |
| chr18_-_29264669 | 0.62 |
ENST00000306851.5
|
B4GALT6
|
UDP-Gal:betaGlcNAc beta 1,4- galactosyltransferase, polypeptide 6 |
| chr4_-_16077741 | 0.62 |
ENST00000447510.2
ENST00000540805.1 ENST00000539194.1 |
PROM1
|
prominin 1 |
| chrX_+_99839799 | 0.61 |
ENST00000373031.4
|
TNMD
|
tenomodulin |
| chr17_-_34257731 | 0.59 |
ENST00000431884.2
ENST00000425909.3 ENST00000394528.3 ENST00000430160.2 |
RDM1
|
RAD52 motif 1 |
| chr3_-_178969403 | 0.58 |
ENST00000314235.5
ENST00000392685.2 |
KCNMB3
|
potassium large conductance calcium-activated channel, subfamily M beta member 3 |
| chr6_+_167704838 | 0.57 |
ENST00000366829.2
|
UNC93A
|
unc-93 homolog A (C. elegans) |
| chr12_-_10251576 | 0.56 |
ENST00000315330.4
|
CLEC1A
|
C-type lectin domain family 1, member A |
| chr17_-_39646116 | 0.53 |
ENST00000328119.6
|
KRT36
|
keratin 36 |
| chr2_-_87248975 | 0.53 |
ENST00000409310.2
ENST00000355705.3 |
PLGLB1
|
plasminogen-like B1 |
| chr7_-_137686791 | 0.51 |
ENST00000452463.1
ENST00000330387.6 ENST00000456390.1 |
CREB3L2
|
cAMP responsive element binding protein 3-like 2 |
| chr12_-_10251603 | 0.50 |
ENST00000457018.2
|
CLEC1A
|
C-type lectin domain family 1, member A |
| chr3_-_8811288 | 0.49 |
ENST00000316793.3
ENST00000431493.1 |
OXTR
|
oxytocin receptor |
| chr4_-_69536346 | 0.48 |
ENST00000338206.5
|
UGT2B15
|
UDP glucuronosyltransferase 2 family, polypeptide B15 |
| chr13_+_49684445 | 0.48 |
ENST00000398316.3
|
FNDC3A
|
fibronectin type III domain containing 3A |
| chr7_-_112430647 | 0.47 |
ENST00000312814.6
|
TMEM168
|
transmembrane protein 168 |
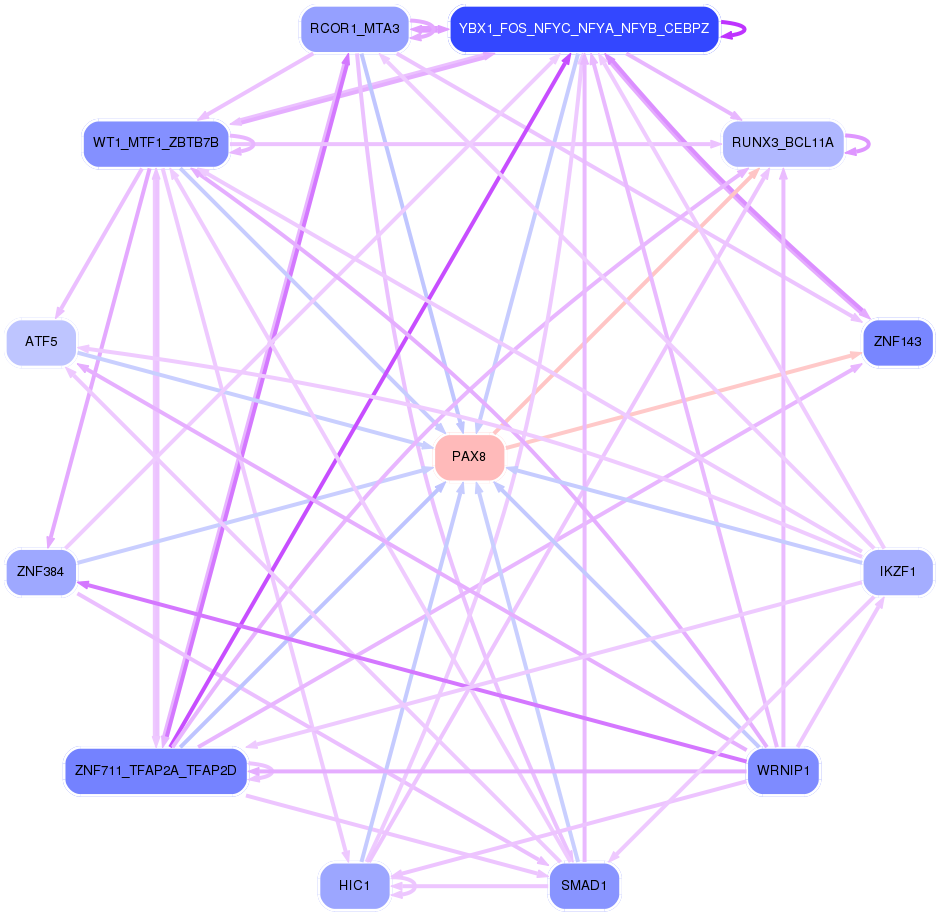
Network of associatons between targets according to the STRING database.

First level regulatory network of PAX8
Gene Ontology Analysis
Gene overrepresentation in biological_process category:
| Log-likelihood per target | Total log-likelihood | Term | Description |
|---|---|---|---|
| 2.7 | 8.2 | GO:0044278 | cell wall disruption in other organism(GO:0044278) |
| 1.6 | 4.7 | GO:1990922 | regulation of hepatic stellate cell proliferation(GO:1904897) positive regulation of hepatic stellate cell proliferation(GO:1904899) hepatic stellate cell proliferation(GO:1990922) |
| 1.5 | 4.6 | GO:0030241 | skeletal muscle myosin thick filament assembly(GO:0030241) |
| 1.3 | 5.2 | GO:0007525 | somatic muscle development(GO:0007525) |
| 1.2 | 14.7 | GO:0048298 | positive regulation of isotype switching to IgA isotypes(GO:0048298) |
| 1.1 | 3.4 | GO:0033364 | mast cell secretory granule organization(GO:0033364) |
| 1.1 | 3.4 | GO:0015783 | GDP-fucose transport(GO:0015783) purine nucleotide-sugar transport(GO:0036079) |
| 1.0 | 7.1 | GO:0048241 | epinephrine transport(GO:0048241) |
| 0.9 | 2.8 | GO:0006711 | estrogen catabolic process(GO:0006711) |
| 0.9 | 6.5 | GO:0008218 | bioluminescence(GO:0008218) |
| 0.9 | 2.8 | GO:0032641 | negative regulation of tolerance induction(GO:0002644) lymphotoxin A production(GO:0032641) interleukin-4 biosynthetic process(GO:0042097) lymphotoxin A biosynthetic process(GO:0042109) regulation of interleukin-4 biosynthetic process(GO:0045402) positive regulation of interleukin-4 biosynthetic process(GO:0045404) |
| 0.9 | 4.5 | GO:0006436 | tryptophanyl-tRNA aminoacylation(GO:0006436) |
| 0.8 | 5.0 | GO:0000821 | regulation of arginine metabolic process(GO:0000821) basic amino acid transmembrane transport(GO:1990822) |
| 0.8 | 7.7 | GO:0060267 | positive regulation of respiratory burst(GO:0060267) |
| 0.8 | 6.1 | GO:0050859 | negative regulation of B cell receptor signaling pathway(GO:0050859) |
| 0.7 | 3.5 | GO:0071279 | cellular response to cobalt ion(GO:0071279) |
| 0.7 | 3.4 | GO:0070370 | heat acclimation(GO:0010286) cellular heat acclimation(GO:0070370) |
| 0.7 | 2.0 | GO:0002581 | negative regulation of antigen processing and presentation of peptide or polysaccharide antigen via MHC class II(GO:0002581) |
| 0.7 | 3.3 | GO:0033031 | positive regulation of neutrophil apoptotic process(GO:0033031) |
| 0.6 | 1.8 | GO:0072709 | cellular response to sorbitol(GO:0072709) |
| 0.6 | 1.8 | GO:0045897 | positive regulation of transcription during mitosis(GO:0045897) |
| 0.6 | 3.5 | GO:0010193 | response to ozone(GO:0010193) |
| 0.6 | 3.9 | GO:0070294 | renal sodium ion absorption(GO:0070294) |
| 0.5 | 10.1 | GO:0033008 | positive regulation of mast cell activation involved in immune response(GO:0033008) positive regulation of mast cell degranulation(GO:0043306) |
| 0.5 | 11.1 | GO:1902236 | negative regulation of endoplasmic reticulum stress-induced intrinsic apoptotic signaling pathway(GO:1902236) |
| 0.5 | 2.3 | GO:0044856 | plasma membrane raft distribution(GO:0044855) plasma membrane raft localization(GO:0044856) plasma membrane raft polarization(GO:0044858) regulation of plasma membrane raft polarization(GO:1903906) |
| 0.4 | 2.7 | GO:0045903 | positive regulation of translational fidelity(GO:0045903) |
| 0.4 | 1.7 | GO:0006072 | glycerol-3-phosphate metabolic process(GO:0006072) |
| 0.4 | 4.3 | GO:0042940 | D-amino acid transport(GO:0042940) |
| 0.4 | 1.2 | GO:2000048 | interaction with other organism via secreted substance involved in symbiotic interaction(GO:0052047) negative regulation of cell-cell adhesion mediated by cadherin(GO:2000048) |
| 0.4 | 1.9 | GO:0002925 | positive regulation of humoral immune response mediated by circulating immunoglobulin(GO:0002925) |
| 0.4 | 3.1 | GO:0032713 | negative regulation of interleukin-4 production(GO:0032713) |
| 0.4 | 1.5 | GO:0050717 | positive regulation of interleukin-1 alpha secretion(GO:0050717) |
| 0.4 | 2.2 | GO:0002870 | lymphocyte anergy(GO:0002249) regulation of T cell anergy(GO:0002667) T cell anergy(GO:0002870) regulation of lymphocyte anergy(GO:0002911) |
| 0.4 | 1.1 | GO:0031394 | positive regulation of prostaglandin biosynthetic process(GO:0031394) positive regulation of unsaturated fatty acid biosynthetic process(GO:2001280) |
| 0.3 | 1.7 | GO:0072023 | thick ascending limb development(GO:0072023) metanephric thick ascending limb development(GO:0072233) |
| 0.3 | 1.0 | GO:0010752 | regulation of cGMP-mediated signaling(GO:0010752) |
| 0.3 | 2.4 | GO:0048014 | Tie signaling pathway(GO:0048014) |
| 0.3 | 2.3 | GO:0021847 | ventricular zone neuroblast division(GO:0021847) |
| 0.3 | 1.0 | GO:1903570 | regulation of protein kinase D signaling(GO:1903570) positive regulation of protein kinase D signaling(GO:1903572) |
| 0.3 | 1.0 | GO:1902630 | regulation of membrane hyperpolarization(GO:1902630) |
| 0.3 | 2.9 | GO:2001300 | lipoxin metabolic process(GO:2001300) |
| 0.3 | 4.1 | GO:1900037 | regulation of cellular response to hypoxia(GO:1900037) |
| 0.3 | 0.9 | GO:2000523 | regulation of T cell costimulation(GO:2000523) positive regulation of T cell costimulation(GO:2000525) |
| 0.3 | 2.6 | GO:0045617 | negative regulation of keratinocyte differentiation(GO:0045617) |
| 0.3 | 1.4 | GO:0030240 | skeletal muscle thin filament assembly(GO:0030240) |
| 0.3 | 2.1 | GO:0070995 | NADPH oxidation(GO:0070995) |
| 0.3 | 0.8 | GO:0042700 | luteinizing hormone signaling pathway(GO:0042700) |
| 0.2 | 1.5 | GO:0015842 | aminergic neurotransmitter loading into synaptic vesicle(GO:0015842) |
| 0.2 | 0.7 | GO:1901594 | detection of temperature stimulus involved in thermoception(GO:0050960) response to capsazepine(GO:1901594) |
| 0.2 | 1.1 | GO:0006740 | NADPH regeneration(GO:0006740) |
| 0.2 | 1.3 | GO:0002760 | positive regulation of antimicrobial peptide production(GO:0002225) positive regulation of antimicrobial humoral response(GO:0002760) positive regulation of antibacterial peptide production(GO:0002803) |
| 0.2 | 1.0 | GO:0060455 | negative regulation of gastric acid secretion(GO:0060455) |
| 0.2 | 3.2 | GO:0098828 | positive regulation of inhibitory postsynaptic potential(GO:0097151) modulation of inhibitory postsynaptic potential(GO:0098828) |
| 0.2 | 0.9 | GO:0046968 | peptide antigen transport(GO:0046968) |
| 0.2 | 2.7 | GO:0018298 | porphyrin-containing compound catabolic process(GO:0006787) protein-chromophore linkage(GO:0018298) tetrapyrrole catabolic process(GO:0033015) heme catabolic process(GO:0042167) pigment catabolic process(GO:0046149) |
| 0.2 | 0.9 | GO:0010616 | negative regulation of cardiac muscle adaptation(GO:0010616) negative regulation of lung blood pressure(GO:0061767) negative regulation of cardiac muscle hypertrophy in response to stress(GO:1903243) |
| 0.2 | 4.5 | GO:0048935 | peripheral nervous system neuron differentiation(GO:0048934) peripheral nervous system neuron development(GO:0048935) |
| 0.2 | 0.7 | GO:0009822 | alkaloid catabolic process(GO:0009822) |
| 0.2 | 2.0 | GO:0001867 | complement activation, lectin pathway(GO:0001867) |
| 0.2 | 1.1 | GO:0021840 | directional guidance of interneurons involved in migration from the subpallium to the cortex(GO:0021840) chemorepulsion involved in interneuron migration from the subpallium to the cortex(GO:0021842) |
| 0.2 | 0.6 | GO:2000768 | glomerular parietal epithelial cell differentiation(GO:0072139) positive regulation of nephron tubule epithelial cell differentiation(GO:2000768) |
| 0.2 | 0.6 | GO:0035992 | tendon cell differentiation(GO:0035990) tendon formation(GO:0035992) |
| 0.1 | 5.0 | GO:0007340 | acrosome reaction(GO:0007340) |
| 0.1 | 1.5 | GO:0015014 | heparan sulfate proteoglycan biosynthetic process, polysaccharide chain biosynthetic process(GO:0015014) |
| 0.1 | 10.4 | GO:0006501 | C-terminal protein lipidation(GO:0006501) |
| 0.1 | 3.0 | GO:0007597 | blood coagulation, intrinsic pathway(GO:0007597) |
| 0.1 | 1.2 | GO:0015747 | urate transport(GO:0015747) |
| 0.1 | 1.7 | GO:1903830 | magnesium ion transmembrane transport(GO:1903830) |
| 0.1 | 3.8 | GO:0006359 | regulation of transcription from RNA polymerase III promoter(GO:0006359) |
| 0.1 | 18.4 | GO:0002377 | immunoglobulin production(GO:0002377) |
| 0.1 | 1.4 | GO:2001214 | positive regulation of vasculogenesis(GO:2001214) |
| 0.1 | 12.9 | GO:0070268 | cornification(GO:0070268) |
| 0.1 | 1.6 | GO:0051256 | mitotic spindle midzone assembly(GO:0051256) |
| 0.1 | 5.1 | GO:0006409 | tRNA export from nucleus(GO:0006409) tRNA-containing ribonucleoprotein complex export from nucleus(GO:0071431) |
| 0.1 | 1.8 | GO:2000001 | regulation of DNA damage checkpoint(GO:2000001) |
| 0.1 | 1.3 | GO:0019373 | epoxygenase P450 pathway(GO:0019373) |
| 0.1 | 1.2 | GO:0060124 | positive regulation of growth hormone secretion(GO:0060124) |
| 0.1 | 10.8 | GO:0006958 | complement activation, classical pathway(GO:0006958) |
| 0.1 | 0.5 | GO:2000252 | negative regulation of feeding behavior(GO:2000252) |
| 0.1 | 1.1 | GO:1900119 | positive regulation of execution phase of apoptosis(GO:1900119) |
| 0.1 | 1.2 | GO:0006702 | androgen biosynthetic process(GO:0006702) |
| 0.1 | 1.1 | GO:1902260 | negative regulation of delayed rectifier potassium channel activity(GO:1902260) |
| 0.1 | 5.2 | GO:0033275 | muscle filament sliding(GO:0030049) actin-myosin filament sliding(GO:0033275) |
| 0.1 | 5.1 | GO:0042100 | B cell proliferation(GO:0042100) |
| 0.1 | 0.3 | GO:1904849 | positive regulation of cell chemotaxis to fibroblast growth factor(GO:1904849) positive regulation of endothelial cell chemotaxis to fibroblast growth factor(GO:2000546) |
| 0.1 | 0.8 | GO:0042737 | drug catabolic process(GO:0042737) |
| 0.1 | 1.4 | GO:0006688 | glycosphingolipid biosynthetic process(GO:0006688) |
| 0.0 | 0.3 | GO:0002943 | tRNA dihydrouridine synthesis(GO:0002943) |
| 0.0 | 0.1 | GO:0010157 | response to chlorate(GO:0010157) |
| 0.0 | 0.8 | GO:0035810 | positive regulation of urine volume(GO:0035810) |
| 0.0 | 0.2 | GO:0030950 | establishment or maintenance of actin cytoskeleton polarity(GO:0030950) |
| 0.0 | 0.2 | GO:0010731 | protein glutathionylation(GO:0010731) regulation of protein glutathionylation(GO:0010732) negative regulation of protein glutathionylation(GO:0010734) |
| 0.0 | 0.1 | GO:0042357 | thiamine diphosphate metabolic process(GO:0042357) |
| 0.0 | 1.3 | GO:0035635 | entry of bacterium into host cell(GO:0035635) |
| 0.0 | 1.2 | GO:0043252 | sodium-independent organic anion transport(GO:0043252) |
| 0.0 | 0.7 | GO:0019800 | peptide cross-linking via chondroitin 4-sulfate glycosaminoglycan(GO:0019800) |
| 0.0 | 0.3 | GO:0060371 | regulation of atrial cardiac muscle cell membrane depolarization(GO:0060371) |
| 0.0 | 0.5 | GO:0052695 | cellular glucuronidation(GO:0052695) |
| 0.0 | 1.4 | GO:0034314 | Arp2/3 complex-mediated actin nucleation(GO:0034314) |
| 0.0 | 0.6 | GO:0005513 | detection of calcium ion(GO:0005513) |
| 0.0 | 4.2 | GO:0050807 | regulation of synapse organization(GO:0050807) |
| 0.0 | 0.9 | GO:0045948 | positive regulation of translational initiation(GO:0045948) |
| 0.0 | 1.9 | GO:0070830 | bicellular tight junction assembly(GO:0070830) |
| 0.0 | 0.9 | GO:0032008 | positive regulation of TOR signaling(GO:0032008) |
| 0.0 | 0.5 | GO:0060009 | Sertoli cell development(GO:0060009) |
| 0.0 | 0.7 | GO:0050901 | leukocyte tethering or rolling(GO:0050901) |
| 0.0 | 1.5 | GO:0010862 | positive regulation of pathway-restricted SMAD protein phosphorylation(GO:0010862) |
| 0.0 | 1.5 | GO:0042267 | natural killer cell mediated cytotoxicity(GO:0042267) |
| 0.0 | 0.2 | GO:0032962 | regulation of inositol trisphosphate biosynthetic process(GO:0032960) positive regulation of inositol trisphosphate biosynthetic process(GO:0032962) |
| 0.0 | 0.2 | GO:0038028 | insulin receptor signaling pathway via phosphatidylinositol 3-kinase(GO:0038028) |
| 0.0 | 1.4 | GO:0006687 | glycosphingolipid metabolic process(GO:0006687) |
| 0.0 | 0.1 | GO:2001206 | positive regulation of osteoclast development(GO:2001206) |
| 0.0 | 0.3 | GO:0006883 | cellular sodium ion homeostasis(GO:0006883) |
| 0.0 | 0.7 | GO:0050911 | detection of chemical stimulus involved in sensory perception of smell(GO:0050911) |
| 0.0 | 0.6 | GO:0006363 | transcription elongation from RNA polymerase I promoter(GO:0006362) termination of RNA polymerase I transcription(GO:0006363) |
| 0.0 | 5.6 | GO:0050900 | leukocyte migration(GO:0050900) |
| 0.0 | 1.8 | GO:0007062 | sister chromatid cohesion(GO:0007062) |
| 0.0 | 0.4 | GO:0000462 | maturation of SSU-rRNA from tricistronic rRNA transcript (SSU-rRNA, 5.8S rRNA, LSU-rRNA)(GO:0000462) |
| 0.0 | 0.4 | GO:0010738 | regulation of protein kinase A signaling(GO:0010738) |
Gene overrepresentation in cellular_component category:
| Log-likelihood per target | Total log-likelihood | Term | Description |
|---|---|---|---|
| 2.5 | 7.6 | GO:0071745 | IgA immunoglobulin complex(GO:0071745) IgA immunoglobulin complex, circulating(GO:0071746) monomeric IgA immunoglobulin complex(GO:0071748) polymeric IgA immunoglobulin complex(GO:0071749) secretory IgA immunoglobulin complex(GO:0071751) |
| 0.3 | 4.5 | GO:0097524 | sperm plasma membrane(GO:0097524) |
| 0.3 | 5.1 | GO:0031080 | nuclear pore outer ring(GO:0031080) |
| 0.3 | 1.5 | GO:0097179 | protease inhibitor complex(GO:0097179) |
| 0.3 | 3.5 | GO:0043203 | axon hillock(GO:0043203) |
| 0.3 | 1.4 | GO:0042643 | actomyosin, actin portion(GO:0042643) |
| 0.3 | 9.8 | GO:0005859 | muscle myosin complex(GO:0005859) |
| 0.2 | 1.4 | GO:0031466 | Cul5-RING ubiquitin ligase complex(GO:0031466) |
| 0.2 | 0.9 | GO:0061700 | GATOR2 complex(GO:0061700) |
| 0.2 | 1.6 | GO:0060091 | kinocilium(GO:0060091) |
| 0.2 | 1.2 | GO:0031232 | extrinsic component of external side of plasma membrane(GO:0031232) |
| 0.2 | 1.3 | GO:0097209 | epidermal lamellar body(GO:0097209) |
| 0.2 | 3.4 | GO:0042588 | zymogen granule(GO:0042588) |
| 0.2 | 1.5 | GO:0070081 | clathrin-sculpted monoamine transport vesicle(GO:0070081) clathrin-sculpted monoamine transport vesicle membrane(GO:0070083) |
| 0.2 | 8.4 | GO:0002102 | podosome(GO:0002102) |
| 0.1 | 2.3 | GO:0033162 | melanosome membrane(GO:0033162) chitosome(GO:0045009) |
| 0.1 | 5.2 | GO:0042571 | immunoglobulin complex, circulating(GO:0042571) |
| 0.1 | 0.9 | GO:0071144 | SMAD2-SMAD3 protein complex(GO:0071144) |
| 0.1 | 10.1 | GO:0005758 | mitochondrial intermembrane space(GO:0005758) |
| 0.1 | 18.4 | GO:0072562 | blood microparticle(GO:0072562) |
| 0.1 | 2.0 | GO:0042613 | MHC class II protein complex(GO:0042613) |
| 0.1 | 0.6 | GO:0000120 | RNA polymerase I transcription factor complex(GO:0000120) |
| 0.1 | 3.2 | GO:0070821 | tertiary granule membrane(GO:0070821) |
| 0.1 | 1.0 | GO:0017146 | NMDA selective glutamate receptor complex(GO:0017146) |
| 0.1 | 1.4 | GO:0005885 | Arp2/3 protein complex(GO:0005885) |
| 0.1 | 12.1 | GO:0031225 | anchored component of membrane(GO:0031225) |
| 0.1 | 17.8 | GO:0009897 | external side of plasma membrane(GO:0009897) |
| 0.1 | 3.5 | GO:0001533 | cornified envelope(GO:0001533) |
| 0.1 | 3.2 | GO:0048786 | presynaptic active zone(GO:0048786) |
| 0.1 | 6.3 | GO:0035579 | specific granule membrane(GO:0035579) |
| 0.1 | 2.4 | GO:0009925 | basal plasma membrane(GO:0009925) |
| 0.1 | 1.9 | GO:0000159 | protein phosphatase type 2A complex(GO:0000159) |
| 0.1 | 0.7 | GO:0001673 | male germ cell nucleus(GO:0001673) |
| 0.0 | 13.4 | GO:0016323 | basolateral plasma membrane(GO:0016323) |
| 0.0 | 0.6 | GO:0031528 | microvillus membrane(GO:0031528) |
| 0.0 | 3.2 | GO:0005901 | caveola(GO:0005901) |
| 0.0 | 2.7 | GO:0022627 | cytosolic small ribosomal subunit(GO:0022627) |
| 0.0 | 0.3 | GO:0071439 | clathrin complex(GO:0071439) |
| 0.0 | 0.8 | GO:0016580 | Sin3 complex(GO:0016580) |
| 0.0 | 4.8 | GO:0016363 | nuclear matrix(GO:0016363) |
| 0.0 | 0.5 | GO:0045277 | respiratory chain complex IV(GO:0045277) |
| 0.0 | 0.8 | GO:0016010 | dystrophin-associated glycoprotein complex(GO:0016010) glycoprotein complex(GO:0090665) |
| 0.0 | 0.1 | GO:0071148 | TEAD-1-YAP complex(GO:0071148) |
| 0.0 | 2.9 | GO:0030018 | Z disc(GO:0030018) |
| 0.0 | 3.5 | GO:0031227 | intrinsic component of endoplasmic reticulum membrane(GO:0031227) |
| 0.0 | 31.1 | GO:0005615 | extracellular space(GO:0005615) |
| 0.0 | 1.4 | GO:0032580 | Golgi cisterna membrane(GO:0032580) |
| 0.0 | 1.7 | GO:0034705 | voltage-gated potassium channel complex(GO:0008076) potassium channel complex(GO:0034705) |
| 0.0 | 1.2 | GO:0005881 | cytoplasmic microtubule(GO:0005881) |
| 0.0 | 15.7 | GO:0005789 | endoplasmic reticulum membrane(GO:0005789) |
| 0.0 | 1.7 | GO:0005923 | bicellular tight junction(GO:0005923) occluding junction(GO:0070160) |
| 0.0 | 2.5 | GO:0005741 | mitochondrial outer membrane(GO:0005741) |
| 0.0 | 0.2 | GO:0031932 | TORC2 complex(GO:0031932) |
| 0.0 | 0.4 | GO:0032040 | small-subunit processome(GO:0032040) |
| 0.0 | 0.3 | GO:0035577 | azurophil granule membrane(GO:0035577) |
| 0.0 | 1.6 | GO:0043025 | neuronal cell body(GO:0043025) |
Gene overrepresentation in molecular_function category:
| Log-likelihood per target | Total log-likelihood | Term | Description |
|---|---|---|---|
| 2.5 | 10.1 | GO:0034988 | Fc-gamma receptor I complex binding(GO:0034988) |
| 1.8 | 7.1 | GO:0005277 | acetylcholine transmembrane transporter activity(GO:0005277) secondary active organic cation transmembrane transporter activity(GO:0008513) acetate ester transmembrane transporter activity(GO:1901375) |
| 1.1 | 3.4 | GO:0036080 | GDP-fucose transmembrane transporter activity(GO:0005457) purine nucleotide-sugar transmembrane transporter activity(GO:0036080) |
| 1.0 | 2.9 | GO:0004464 | leukotriene-C4 synthase activity(GO:0004464) |
| 0.9 | 11.1 | GO:0089720 | caspase binding(GO:0089720) |
| 0.9 | 4.5 | GO:0004830 | tryptophan-tRNA ligase activity(GO:0004830) |
| 0.8 | 8.9 | GO:0070492 | oligosaccharide binding(GO:0070492) |
| 0.7 | 5.0 | GO:0004920 | interleukin-10 receptor activity(GO:0004920) |
| 0.7 | 2.7 | GO:0019862 | IgA binding(GO:0019862) |
| 0.7 | 12.1 | GO:0019864 | IgG binding(GO:0019864) |
| 0.6 | 5.7 | GO:0031433 | telethonin binding(GO:0031433) |
| 0.5 | 1.5 | GO:0015222 | serotonin transmembrane transporter activity(GO:0015222) |
| 0.5 | 5.0 | GO:0015174 | basic amino acid transmembrane transporter activity(GO:0015174) |
| 0.4 | 4.7 | GO:0001135 | transcription factor activity, RNA polymerase II transcription factor recruiting(GO:0001135) |
| 0.4 | 4.1 | GO:1990380 | Lys48-specific deubiquitinase activity(GO:1990380) |
| 0.4 | 2.3 | GO:0004167 | dopachrome isomerase activity(GO:0004167) |
| 0.3 | 4.5 | GO:0047372 | acylglycerol lipase activity(GO:0047372) |
| 0.3 | 1.0 | GO:0043423 | 3-phosphoinositide-dependent protein kinase binding(GO:0043423) |
| 0.3 | 2.7 | GO:1990932 | 5.8S rRNA binding(GO:1990932) |
| 0.3 | 15.6 | GO:0005164 | tumor necrosis factor receptor binding(GO:0005164) |
| 0.3 | 2.8 | GO:0004499 | N,N-dimethylaniline monooxygenase activity(GO:0004499) |
| 0.3 | 1.1 | GO:0050473 | prostaglandin-endoperoxide synthase activity(GO:0004666) arachidonate 15-lipoxygenase activity(GO:0050473) |
| 0.3 | 1.9 | GO:0019863 | IgE binding(GO:0019863) |
| 0.3 | 4.8 | GO:0008392 | arachidonic acid monooxygenase activity(GO:0008391) arachidonic acid epoxygenase activity(GO:0008392) |
| 0.3 | 12.8 | GO:0034987 | immunoglobulin receptor binding(GO:0034987) |
| 0.2 | 1.5 | GO:0015016 | [heparan sulfate]-glucosamine N-sulfotransferase activity(GO:0015016) |
| 0.2 | 1.5 | GO:0008454 | alpha-1,3-mannosylglycoprotein 4-beta-N-acetylglucosaminyltransferase activity(GO:0008454) |
| 0.2 | 4.7 | GO:0017081 | chloride channel regulator activity(GO:0017081) |
| 0.2 | 2.3 | GO:0045159 | myosin II binding(GO:0045159) |
| 0.2 | 0.9 | GO:0031962 | mineralocorticoid receptor binding(GO:0031962) |
| 0.2 | 1.0 | GO:0043183 | vascular endothelial growth factor receptor 1 binding(GO:0043183) |
| 0.2 | 2.4 | GO:0008140 | cAMP response element binding protein binding(GO:0008140) |
| 0.1 | 1.2 | GO:1990405 | protein antigen binding(GO:1990405) |
| 0.1 | 25.9 | GO:0003823 | antigen binding(GO:0003823) |
| 0.1 | 1.5 | GO:0050700 | CARD domain binding(GO:0050700) |
| 0.1 | 5.1 | GO:0015020 | glucuronosyltransferase activity(GO:0015020) |
| 0.1 | 5.1 | GO:0005487 | nucleocytoplasmic transporter activity(GO:0005487) |
| 0.1 | 1.4 | GO:0003831 | beta-N-acetylglucosaminylglycopeptide beta-1,4-galactosyltransferase activity(GO:0003831) |
| 0.1 | 2.5 | GO:0005068 | transmembrane receptor protein tyrosine kinase adaptor activity(GO:0005068) |
| 0.1 | 1.8 | GO:0030280 | structural constituent of epidermis(GO:0030280) |
| 0.1 | 1.7 | GO:0015095 | magnesium ion transmembrane transporter activity(GO:0015095) |
| 0.1 | 1.2 | GO:0015143 | urate transmembrane transporter activity(GO:0015143) salt transmembrane transporter activity(GO:1901702) |
| 0.1 | 0.5 | GO:0004980 | melanocyte-stimulating hormone receptor activity(GO:0004980) |
| 0.1 | 1.1 | GO:0005176 | ErbB-2 class receptor binding(GO:0005176) |
| 0.1 | 10.4 | GO:0008307 | structural constituent of muscle(GO:0008307) |
| 0.1 | 11.1 | GO:0004867 | serine-type endopeptidase inhibitor activity(GO:0004867) |
| 0.1 | 2.2 | GO:0004622 | lysophospholipase activity(GO:0004622) |
| 0.1 | 1.9 | GO:0070016 | armadillo repeat domain binding(GO:0070016) |
| 0.1 | 1.2 | GO:0008395 | steroid hydroxylase activity(GO:0008395) |
| 0.1 | 2.2 | GO:0030159 | receptor signaling complex scaffold activity(GO:0030159) |
| 0.1 | 1.8 | GO:0004708 | MAP kinase kinase activity(GO:0004708) |
| 0.1 | 0.7 | GO:0070330 | aromatase activity(GO:0070330) |
| 0.1 | 0.5 | GO:0004957 | prostaglandin E receptor activity(GO:0004957) |
| 0.1 | 0.8 | GO:0001222 | transcription corepressor binding(GO:0001222) |
| 0.1 | 0.5 | GO:0005000 | vasopressin receptor activity(GO:0005000) |
| 0.1 | 2.8 | GO:0015026 | coreceptor activity(GO:0015026) |
| 0.0 | 1.3 | GO:0005452 | inorganic anion exchanger activity(GO:0005452) |
| 0.0 | 10.1 | GO:0004252 | serine-type endopeptidase activity(GO:0004252) |
| 0.0 | 0.3 | GO:0017150 | tRNA dihydrouridine synthase activity(GO:0017150) |
| 0.0 | 3.0 | GO:0004869 | cysteine-type endopeptidase inhibitor activity(GO:0004869) |
| 0.0 | 3.4 | GO:0005518 | collagen binding(GO:0005518) |
| 0.0 | 10.9 | GO:0030246 | carbohydrate binding(GO:0030246) |
| 0.0 | 0.7 | GO:0008191 | metalloendopeptidase inhibitor activity(GO:0008191) |
| 0.0 | 1.6 | GO:0008138 | protein tyrosine/serine/threonine phosphatase activity(GO:0008138) |
| 0.0 | 0.4 | GO:0019215 | intermediate filament binding(GO:0019215) |
| 0.0 | 2.4 | GO:0004714 | transmembrane receptor protein tyrosine kinase activity(GO:0004714) |
| 0.0 | 1.6 | GO:0005154 | epidermal growth factor receptor binding(GO:0005154) |
| 0.0 | 1.4 | GO:0042169 | SH2 domain binding(GO:0042169) |
| 0.0 | 0.1 | GO:0097108 | hedgehog family protein binding(GO:0097108) |
| 0.0 | 1.4 | GO:0032947 | protein complex scaffold(GO:0032947) |
| 0.0 | 0.5 | GO:0035497 | cAMP response element binding(GO:0035497) |
| 0.0 | 3.4 | GO:0031072 | heat shock protein binding(GO:0031072) |
| 0.0 | 0.3 | GO:0001087 | transcription factor activity, sequence-specific DNA binding, RNA polymerase recruiting(GO:0001011) transcription factor activity, TFIIB-class binding(GO:0001087) |
| 0.0 | 0.1 | GO:0016778 | diphosphotransferase activity(GO:0016778) |
| 0.0 | 0.6 | GO:0015269 | calcium-activated potassium channel activity(GO:0015269) |
| 0.0 | 0.9 | GO:0031369 | translation initiation factor binding(GO:0031369) |
| 0.0 | 0.4 | GO:0034237 | protein kinase A regulatory subunit binding(GO:0034237) |
| 0.0 | 0.2 | GO:0004969 | histamine receptor activity(GO:0004969) |
| 0.0 | 1.4 | GO:0017022 | myosin binding(GO:0017022) |
| 0.0 | 1.1 | GO:0019843 | rRNA binding(GO:0019843) |
| 0.0 | 0.5 | GO:0015002 | cytochrome-c oxidase activity(GO:0004129) heme-copper terminal oxidase activity(GO:0015002) oxidoreductase activity, acting on a heme group of donors, oxygen as acceptor(GO:0016676) |
| 0.0 | 0.6 | GO:0042805 | actinin binding(GO:0042805) |
| 0.0 | 7.3 | GO:0004930 | G-protein coupled receptor activity(GO:0004930) |
| 0.0 | 1.1 | GO:0050661 | NADP binding(GO:0050661) |
| 0.0 | 0.1 | GO:0043141 | ATP-dependent 5'-3' DNA helicase activity(GO:0043141) |
| 0.0 | 2.2 | GO:0005200 | structural constituent of cytoskeleton(GO:0005200) |
| 0.0 | 0.1 | GO:0001134 | transcription factor activity, transcription factor recruiting(GO:0001134) |
| 0.0 | 0.9 | GO:0005507 | copper ion binding(GO:0005507) |
| 0.0 | 0.3 | GO:0005248 | voltage-gated sodium channel activity(GO:0005248) voltage-gated ion channel activity involved in regulation of postsynaptic membrane potential(GO:1905030) |
| 0.0 | 1.7 | GO:0005179 | hormone activity(GO:0005179) |
| 0.0 | 0.3 | GO:0042056 | chemoattractant activity(GO:0042056) |
| 0.0 | 0.2 | GO:0070300 | phosphatidic acid binding(GO:0070300) |
| 0.0 | 16.2 | GO:0001071 | nucleic acid binding transcription factor activity(GO:0001071) transcription factor activity, sequence-specific DNA binding(GO:0003700) |
Gene overrepresentation in C2:CP category:
| Log-likelihood per target | Total log-likelihood | Term | Description |
|---|---|---|---|
| 0.2 | 10.1 | PID IL8 CXCR1 PATHWAY | IL8- and CXCR1-mediated signaling events |
| 0.1 | 3.3 | PID ANTHRAX PATHWAY | Cellular roles of Anthrax toxin |
| 0.1 | 18.5 | NABA ECM AFFILIATED | Genes encoding proteins affiliated structurally or functionally to extracellular matrix proteins |
| 0.1 | 4.3 | ST GAQ PATHWAY | G alpha q Pathway |
| 0.1 | 3.2 | SA MMP CYTOKINE CONNECTION | Cytokines can induce activation of matrix metalloproteinases, which degrade extracellular matrix. |
| 0.1 | 2.1 | PID S1P S1P1 PATHWAY | S1P1 pathway |
| 0.1 | 3.3 | PID AVB3 OPN PATHWAY | Osteopontin-mediated events |
| 0.1 | 9.1 | PID IL4 2PATHWAY | IL4-mediated signaling events |
| 0.1 | 2.7 | PID ERBB NETWORK PATHWAY | ErbB receptor signaling network |
| 0.1 | 1.9 | PID ER NONGENOMIC PATHWAY | Plasma membrane estrogen receptor signaling |
| 0.1 | 4.1 | NABA PROTEOGLYCANS | Genes encoding proteoglycans |
| 0.1 | 3.0 | PID SYNDECAN 2 PATHWAY | Syndecan-2-mediated signaling events |
| 0.1 | 3.8 | PID ANGIOPOIETIN RECEPTOR PATHWAY | Angiopoietin receptor Tie2-mediated signaling |
| 0.1 | 3.9 | PID PI3KCI PATHWAY | Class I PI3K signaling events |
| 0.1 | 2.8 | PID IL12 STAT4 PATHWAY | IL12 signaling mediated by STAT4 |
| 0.0 | 17.1 | NABA SECRETED FACTORS | Genes encoding secreted soluble factors |
| 0.0 | 12.2 | NABA MATRISOME ASSOCIATED | Ensemble of genes encoding ECM-associated proteins including ECM-affilaited proteins, ECM regulators and secreted factors |
| 0.0 | 5.3 | PID SMAD2 3NUCLEAR PATHWAY | Regulation of nuclear SMAD2/3 signaling |
| 0.0 | 1.4 | PID LYSOPHOSPHOLIPID PATHWAY | LPA receptor mediated events |
| 0.0 | 1.3 | PID AJDISS 2PATHWAY | Posttranslational regulation of adherens junction stability and dissassembly |
| 0.0 | 1.8 | PID PLK1 PATHWAY | PLK1 signaling events |
| 0.0 | 0.5 | PID SYNDECAN 3 PATHWAY | Syndecan-3-mediated signaling events |
| 0.0 | 0.7 | PID TXA2PATHWAY | Thromboxane A2 receptor signaling |
| 0.0 | 1.4 | PID RAC1 PATHWAY | RAC1 signaling pathway |
| 0.0 | 1.4 | PID NFAT TFPATHWAY | Calcineurin-regulated NFAT-dependent transcription in lymphocytes |
| 0.0 | 0.7 | PID MAPK TRK PATHWAY | Trk receptor signaling mediated by the MAPK pathway |
| 0.0 | 1.3 | PID HNF3A PATHWAY | FOXA1 transcription factor network |
| 0.0 | 1.0 | PID AP1 PATHWAY | AP-1 transcription factor network |
| 0.0 | 0.2 | PID CXCR3 PATHWAY | CXCR3-mediated signaling events |
Gene overrepresentation in C2:CP:REACTOME category:
| Log-likelihood per target | Total log-likelihood | Term | Description |
|---|---|---|---|
| 0.5 | 7.1 | REACTOME ABACAVIR TRANSPORT AND METABOLISM | Genes involved in Abacavir transport and metabolism |
| 0.4 | 10.1 | REACTOME PLATELET SENSITIZATION BY LDL | Genes involved in Platelet sensitization by LDL |
| 0.3 | 5.5 | REACTOME XENOBIOTICS | Genes involved in Xenobiotics |
| 0.2 | 4.5 | REACTOME MITOCHONDRIAL TRNA AMINOACYLATION | Genes involved in Mitochondrial tRNA aminoacylation |
| 0.2 | 3.2 | REACTOME NOREPINEPHRINE NEUROTRANSMITTER RELEASE CYCLE | Genes involved in Norepinephrine Neurotransmitter Release Cycle |
| 0.2 | 4.6 | REACTOME GLUCURONIDATION | Genes involved in Glucuronidation |
| 0.2 | 3.0 | REACTOME INTRINSIC PATHWAY | Genes involved in Intrinsic Pathway |
| 0.1 | 10.4 | REACTOME STRIATED MUSCLE CONTRACTION | Genes involved in Striated Muscle Contraction |
| 0.1 | 2.3 | REACTOME ORGANIC CATION ANION ZWITTERION TRANSPORT | Genes involved in Organic cation/anion/zwitterion transport |
| 0.1 | 4.8 | REACTOME TIE2 SIGNALING | Genes involved in Tie2 Signaling |
| 0.1 | 2.8 | REACTOME CD28 DEPENDENT VAV1 PATHWAY | Genes involved in CD28 dependent Vav1 pathway |
| 0.1 | 3.0 | REACTOME N GLYCAN ANTENNAE ELONGATION | Genes involved in N-Glycan antennae elongation |
| 0.1 | 1.5 | REACTOME NA CL DEPENDENT NEUROTRANSMITTER TRANSPORTERS | Genes involved in Na+/Cl- dependent neurotransmitter transporters |
| 0.1 | 5.0 | REACTOME AMINO ACID TRANSPORT ACROSS THE PLASMA MEMBRANE | Genes involved in Amino acid transport across the plasma membrane |
| 0.1 | 1.5 | REACTOME GLYCOPROTEIN HORMONES | Genes involved in Glycoprotein hormones |
| 0.1 | 2.7 | REACTOME SHC1 EVENTS IN ERBB4 SIGNALING | Genes involved in SHC1 events in ERBB4 signaling |
| 0.1 | 14.7 | REACTOME REGULATION OF MRNA STABILITY BY PROTEINS THAT BIND AU RICH ELEMENTS | Genes involved in Regulation of mRNA Stability by Proteins that Bind AU-rich Elements |
| 0.1 | 3.8 | REACTOME RNA POL III TRANSCRIPTION INITIATION FROM TYPE 3 PROMOTER | Genes involved in RNA Polymerase III Transcription Initiation From Type 3 Promoter |
| 0.1 | 1.2 | REACTOME ANDROGEN BIOSYNTHESIS | Genes involved in Androgen biosynthesis |
| 0.1 | 5.7 | REACTOME RNA POL I PROMOTER OPENING | Genes involved in RNA Polymerase I Promoter Opening |
| 0.1 | 1.8 | REACTOME ACTIVATED TAK1 MEDIATES P38 MAPK ACTIVATION | Genes involved in activated TAK1 mediates p38 MAPK activation |
| 0.1 | 2.3 | REACTOME CASPASE MEDIATED CLEAVAGE OF CYTOSKELETAL PROTEINS | Genes involved in Caspase-mediated cleavage of cytoskeletal proteins |
| 0.1 | 0.7 | REACTOME CREATION OF C4 AND C2 ACTIVATORS | Genes involved in Creation of C4 and C2 activators |
| 0.1 | 1.5 | REACTOME NOD1 2 SIGNALING PATHWAY | Genes involved in NOD1/2 Signaling Pathway |
| 0.1 | 1.6 | REACTOME CONVERSION FROM APC C CDC20 TO APC C CDH1 IN LATE ANAPHASE | Genes involved in Conversion from APC/C:Cdc20 to APC/C:Cdh1 in late anaphase |
| 0.1 | 1.0 | REACTOME VEGF LIGAND RECEPTOR INTERACTIONS | Genes involved in VEGF ligand-receptor interactions |
| 0.0 | 1.7 | REACTOME TIGHT JUNCTION INTERACTIONS | Genes involved in Tight junction interactions |
| 0.0 | 1.5 | REACTOME HS GAG BIOSYNTHESIS | Genes involved in HS-GAG biosynthesis |
| 0.0 | 0.5 | REACTOME PROSTANOID LIGAND RECEPTORS | Genes involved in Prostanoid ligand receptors |
| 0.0 | 1.0 | REACTOME SIGNAL REGULATORY PROTEIN SIRP FAMILY INTERACTIONS | Genes involved in Signal regulatory protein (SIRP) family interactions |
| 0.0 | 2.2 | REACTOME PHASE1 FUNCTIONALIZATION OF COMPOUNDS | Genes involved in Phase 1 - Functionalization of compounds |
| 0.0 | 2.7 | REACTOME FORMATION OF THE TERNARY COMPLEX AND SUBSEQUENTLY THE 43S COMPLEX | Genes involved in Formation of the ternary complex, and subsequently, the 43S complex |
| 0.0 | 1.3 | REACTOME DEGRADATION OF THE EXTRACELLULAR MATRIX | Genes involved in Degradation of the extracellular matrix |
| 0.0 | 3.2 | REACTOME IMMUNOREGULATORY INTERACTIONS BETWEEN A LYMPHOID AND A NON LYMPHOID CELL | Genes involved in Immunoregulatory interactions between a Lymphoid and a non-Lymphoid cell |
| 0.0 | 0.9 | REACTOME SIGNALING BY NODAL | Genes involved in Signaling by NODAL |
| 0.0 | 0.6 | REACTOME RNA POL I TRANSCRIPTION TERMINATION | Genes involved in RNA Polymerase I Transcription Termination |
| 0.0 | 6.2 | REACTOME G ALPHA I SIGNALLING EVENTS | Genes involved in G alpha (i) signalling events |
| 0.0 | 3.4 | REACTOME RESPONSE TO ELEVATED PLATELET CYTOSOLIC CA2 | Genes involved in Response to elevated platelet cytosolic Ca2+ |
| 0.0 | 0.3 | REACTOME VIRAL MESSENGER RNA SYNTHESIS | Genes involved in Viral Messenger RNA Synthesis |
| 0.0 | 1.8 | REACTOME MITOTIC PROMETAPHASE | Genes involved in Mitotic Prometaphase |
| 0.0 | 0.3 | REACTOME SIGNALING BY FGFR3 MUTANTS | Genes involved in Signaling by FGFR3 mutants |
| 0.0 | 7.1 | REACTOME GENERIC TRANSCRIPTION PATHWAY | Genes involved in Generic Transcription Pathway |
| 0.0 | 1.2 | REACTOME ACTIVATION OF CHAPERONE GENES BY XBP1S | Genes involved in Activation of Chaperone Genes by XBP1(S) |
| 0.0 | 2.0 | REACTOME MHC CLASS II ANTIGEN PRESENTATION | Genes involved in MHC class II antigen presentation |
| 0.0 | 0.6 | REACTOME CGMP EFFECTS | Genes involved in cGMP effects |
| 0.0 | 0.6 | REACTOME OLFACTORY SIGNALING PATHWAY | Genes involved in Olfactory Signaling Pathway |
| 0.0 | 0.2 | REACTOME CD28 DEPENDENT PI3K AKT SIGNALING | Genes involved in CD28 dependent PI3K/Akt signaling |