Project
GNF SymAtlas + NCI-60 cancer cell lines, comparison of cancers vs non-cancers, human (Su, 2004; Ross, 2000)
Navigation
Downloads
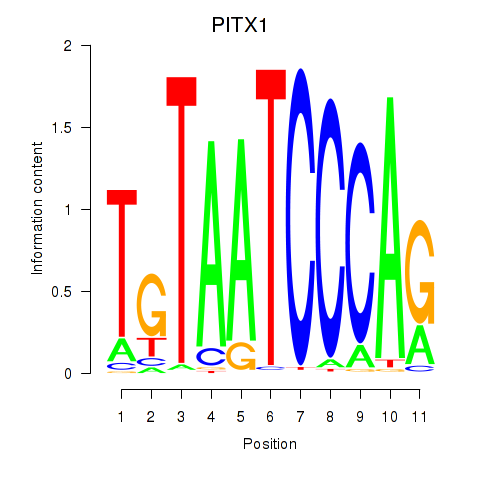
Results for PITX1
Z-value: 0.12
Motif logo
Transcription factors associated with PITX1
| Gene Symbol | Gene ID | Gene Info |
|---|---|---|
|
PITX1
|
ENSG00000069011.11 | paired like homeodomain 1 |
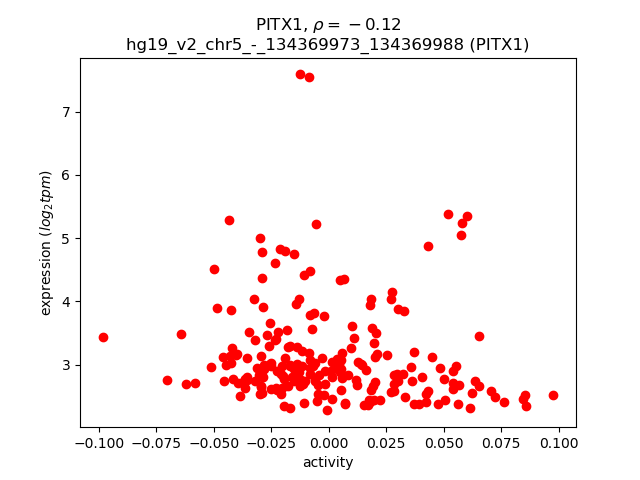
Activity-expression correlation:
| Gene | Promoter | Pearson corr. coef. | P-value | Plot |
|---|---|---|---|---|
| PITX1 | hg19_v2_chr5_-_134369973_134369988 | -0.12 | 8.7e-02 | Click! |
Activity profile of PITX1 motif
Sorted Z-values of PITX1 motif
| Promoter | Log-likelihood | Transcript | Gene | Gene Info |
|---|---|---|---|---|
| chr19_+_1077393 | 28.02 |
ENST00000590577.1
|
HMHA1
|
histocompatibility (minor) HA-1 |
| chr7_+_73623717 | 22.67 |
ENST00000344995.5
ENST00000460943.1 |
LAT2
|
linker for activation of T cells family, member 2 |
| chr22_-_17680472 | 19.98 |
ENST00000330232.4
|
CECR1
|
cat eye syndrome chromosome region, candidate 1 |
| chr22_-_43036607 | 18.82 |
ENST00000505920.1
|
ATP5L2
|
ATP synthase, H+ transporting, mitochondrial Fo complex, subunit G2 |
| chr14_+_35747825 | 16.93 |
ENST00000540871.1
|
PSMA6
|
proteasome (prosome, macropain) subunit, alpha type, 6 |
| chr12_-_54691668 | 16.92 |
ENST00000553198.1
|
NFE2
|
nuclear factor, erythroid 2 |
| chr7_+_73624327 | 16.00 |
ENST00000361082.3
ENST00000275635.7 ENST00000470709.1 |
LAT2
|
linker for activation of T cells family, member 2 |
| chr13_+_43597269 | 15.92 |
ENST00000379221.2
|
DNAJC15
|
DnaJ (Hsp40) homolog, subfamily C, member 15 |
| chr19_-_39826639 | 15.88 |
ENST00000602185.1
ENST00000598034.1 ENST00000601387.1 ENST00000595636.1 ENST00000253054.8 ENST00000594700.1 ENST00000597595.1 |
GMFG
|
glia maturation factor, gamma |
| chr2_+_234104079 | 15.60 |
ENST00000417661.1
|
INPP5D
|
inositol polyphosphate-5-phosphatase, 145kDa |
| chr3_-_64009658 | 15.44 |
ENST00000394431.2
|
PSMD6
|
proteasome (prosome, macropain) 26S subunit, non-ATPase, 6 |
| chr12_+_53836339 | 15.36 |
ENST00000549135.1
|
PRR13
|
proline rich 13 |
| chr20_+_55926274 | 15.03 |
ENST00000371242.2
ENST00000527947.1 |
RAE1
|
ribonucleic acid export 1 |
| chr16_+_30087288 | 14.94 |
ENST00000279387.7
ENST00000562664.1 ENST00000562222.1 |
PPP4C
|
protein phosphatase 4, catalytic subunit |
| chr4_+_57843876 | 14.74 |
ENST00000450656.1
ENST00000381227.1 |
POLR2B
|
polymerase (RNA) II (DNA directed) polypeptide B, 140kDa |
| chr2_-_62115725 | 13.82 |
ENST00000538252.1
ENST00000544079.1 ENST00000394440.3 |
CCT4
|
chaperonin containing TCP1, subunit 4 (delta) |
| chr11_-_73693875 | 13.62 |
ENST00000536983.1
|
UCP2
|
uncoupling protein 2 (mitochondrial, proton carrier) |
| chr11_-_118213455 | 13.50 |
ENST00000300692.4
|
CD3D
|
CD3d molecule, delta (CD3-TCR complex) |
| chr20_+_35807449 | 12.94 |
ENST00000237530.6
|
RPN2
|
ribophorin II |
| chr12_+_54892550 | 12.86 |
ENST00000545638.2
|
NCKAP1L
|
NCK-associated protein 1-like |
| chr3_-_49142504 | 12.72 |
ENST00000306125.6
ENST00000420147.2 |
QARS
|
glutaminyl-tRNA synthetase |
| chr3_-_141719195 | 12.67 |
ENST00000397991.4
|
TFDP2
|
transcription factor Dp-2 (E2F dimerization partner 2) |
| chr16_+_30212050 | 12.48 |
ENST00000563322.1
|
SULT1A3
|
sulfotransferase family, cytosolic, 1A, phenol-preferring, member 3 |
| chr11_-_118213360 | 12.43 |
ENST00000529594.1
|
CD3D
|
CD3d molecule, delta (CD3-TCR complex) |
| chr17_-_61920280 | 12.31 |
ENST00000448276.2
ENST00000577990.1 |
SMARCD2
|
SWI/SNF related, matrix associated, actin dependent regulator of chromatin, subfamily d, member 2 |
| chr7_-_5998714 | 12.18 |
ENST00000539903.1
|
RSPH10B
|
radial spoke head 10 homolog B (Chlamydomonas) |
| chr8_-_101718991 | 12.13 |
ENST00000517990.1
|
PABPC1
|
poly(A) binding protein, cytoplasmic 1 |
| chr20_+_35807512 | 11.99 |
ENST00000373622.5
|
RPN2
|
ribophorin II |
| chr14_-_23285069 | 11.87 |
ENST00000554758.1
ENST00000397528.4 |
SLC7A7
|
solute carrier family 7 (amino acid transporter light chain, y+L system), member 7 |
| chr19_+_17865011 | 11.84 |
ENST00000596462.1
ENST00000596865.1 ENST00000598960.1 ENST00000539407.1 |
FCHO1
|
FCH domain only 1 |
| chr20_+_57556263 | 11.75 |
ENST00000602795.1
ENST00000344018.3 |
NELFCD
|
negative elongation factor complex member C/D |
| chr6_+_31802364 | 11.68 |
ENST00000375640.3
ENST00000375641.2 |
C6orf48
|
chromosome 6 open reading frame 48 |
| chr17_+_73230799 | 11.45 |
ENST00000579838.1
|
NUP85
|
nucleoporin 85kDa |
| chr19_+_48824711 | 11.43 |
ENST00000599704.1
|
EMP3
|
epithelial membrane protein 3 |
| chr16_+_29472707 | 11.19 |
ENST00000565290.1
|
SULT1A4
|
sulfotransferase family, cytosolic, 1A, phenol-preferring, member 4 |
| chr19_+_41768401 | 11.19 |
ENST00000352456.3
ENST00000595018.1 ENST00000597725.1 |
HNRNPUL1
|
heterogeneous nuclear ribonucleoprotein U-like 1 |
| chr14_+_73563735 | 11.00 |
ENST00000532192.1
|
RBM25
|
RNA binding motif protein 25 |
| chr19_+_1071203 | 10.83 |
ENST00000543365.1
|
HMHA1
|
histocompatibility (minor) HA-1 |
| chr19_+_24009879 | 10.65 |
ENST00000354585.4
|
RPSAP58
|
ribosomal protein SA pseudogene 58 |
| chr19_+_22469236 | 10.63 |
ENST00000357491.6
|
ZNF729
|
zinc finger protein 729 |
| chr11_-_118213331 | 10.47 |
ENST00000392884.2
|
CD3D
|
CD3d molecule, delta (CD3-TCR complex) |
| chr17_-_3599696 | 10.44 |
ENST00000225328.5
|
P2RX5
|
purinergic receptor P2X, ligand-gated ion channel, 5 |
| chrX_-_70329118 | 10.34 |
ENST00000374188.3
|
IL2RG
|
interleukin 2 receptor, gamma |
| chr19_+_22469210 | 10.31 |
ENST00000601693.1
|
ZNF729
|
zinc finger protein 729 |
| chr8_-_102218292 | 10.30 |
ENST00000518336.1
ENST00000520454.1 |
ZNF706
|
zinc finger protein 706 |
| chr1_+_158815588 | 10.24 |
ENST00000438394.1
|
MNDA
|
myeloid cell nuclear differentiation antigen |
| chr16_+_30483962 | 10.22 |
ENST00000356798.6
|
ITGAL
|
integrin, alpha L (antigen CD11A (p180), lymphocyte function-associated antigen 1; alpha polypeptide) |
| chr12_-_31945172 | 10.14 |
ENST00000340398.3
|
H3F3C
|
H3 histone, family 3C |
| chr19_+_54609230 | 10.11 |
ENST00000420296.1
|
NDUFA3
|
NADH dehydrogenase (ubiquinone) 1 alpha subcomplex, 3, 9kDa |
| chr12_+_123949053 | 10.05 |
ENST00000350887.5
|
SNRNP35
|
small nuclear ribonucleoprotein 35kDa (U11/U12) |
| chr16_+_30210552 | 10.03 |
ENST00000338971.5
|
SULT1A3
|
sulfotransferase family, cytosolic, 1A, phenol-preferring, member 3 |
| chr16_+_29471210 | 10.03 |
ENST00000360423.7
|
SULT1A4
|
sulfotransferase family, cytosolic, 1A, phenol-preferring, member 4 |
| chr2_-_112642267 | 10.02 |
ENST00000341068.3
|
ANAPC1
|
anaphase promoting complex subunit 1 |
| chr16_+_30484021 | 10.01 |
ENST00000358164.5
|
ITGAL
|
integrin, alpha L (antigen CD11A (p180), lymphocyte function-associated antigen 1; alpha polypeptide) |
| chr6_-_42016385 | 9.99 |
ENST00000502771.1
ENST00000508143.1 ENST00000514588.1 ENST00000510503.1 ENST00000415497.2 ENST00000372988.4 |
CCND3
|
cyclin D3 |
| chr5_-_180666570 | 9.97 |
ENST00000509535.1
|
GNB2L1
|
guanine nucleotide binding protein (G protein), beta polypeptide 2-like 1 |
| chr19_-_17932314 | 9.84 |
ENST00000598577.1
ENST00000317306.7 ENST00000379695.5 |
INSL3
|
insulin-like 3 (Leydig cell) |
| chrX_+_9431324 | 9.80 |
ENST00000407597.2
ENST00000424279.1 ENST00000536365.1 ENST00000441088.1 ENST00000380961.1 ENST00000415293.1 |
TBL1X
|
transducin (beta)-like 1X-linked |
| chr9_+_134065506 | 9.78 |
ENST00000483497.2
|
NUP214
|
nucleoporin 214kDa |
| chr1_+_203830703 | 9.71 |
ENST00000414487.2
|
SNRPE
|
small nuclear ribonucleoprotein polypeptide E |
| chr16_-_68034470 | 9.65 |
ENST00000412757.2
|
DPEP2
|
dipeptidase 2 |
| chr20_+_1093891 | 9.40 |
ENST00000333082.3
ENST00000381898.4 ENST00000381899.4 |
PSMF1
|
proteasome (prosome, macropain) inhibitor subunit 1 (PI31) |
| chr19_-_50529193 | 9.39 |
ENST00000596445.1
ENST00000599538.1 |
VRK3
|
vaccinia related kinase 3 |
| chr2_-_26251481 | 9.13 |
ENST00000599234.1
|
AC013449.1
|
Uncharacterized protein |
| chr7_-_99699538 | 9.10 |
ENST00000343023.6
ENST00000303887.5 |
MCM7
|
minichromosome maintenance complex component 7 |
| chr2_-_197664366 | 8.99 |
ENST00000409364.3
ENST00000263956.3 |
GTF3C3
|
general transcription factor IIIC, polypeptide 3, 102kDa |
| chr12_+_123942188 | 8.91 |
ENST00000526639.2
|
SNRNP35
|
small nuclear ribonucleoprotein 35kDa (U11/U12) |
| chr12_-_8043736 | 8.88 |
ENST00000539924.1
|
SLC2A14
|
solute carrier family 2 (facilitated glucose transporter), member 14 |
| chr6_-_31763721 | 8.80 |
ENST00000375663.3
|
VARS
|
valyl-tRNA synthetase |
| chr3_+_127317066 | 8.80 |
ENST00000265056.7
|
MCM2
|
minichromosome maintenance complex component 2 |
| chr20_+_55926583 | 8.76 |
ENST00000395840.2
|
RAE1
|
ribonucleic acid export 1 |
| chr17_-_34524157 | 8.75 |
ENST00000378354.4
ENST00000394484.1 |
CCL3L3
|
chemokine (C-C motif) ligand 3-like 3 |
| chr17_-_56358287 | 8.60 |
ENST00000225275.3
ENST00000340482.3 |
MPO
|
myeloperoxidase |
| chr22_-_42336209 | 8.59 |
ENST00000472374.2
|
CENPM
|
centromere protein M |
| chr8_-_145652336 | 8.54 |
ENST00000529182.1
ENST00000526054.1 |
VPS28
|
vacuolar protein sorting 28 homolog (S. cerevisiae) |
| chr1_+_45212074 | 8.53 |
ENST00000372217.1
|
KIF2C
|
kinesin family member 2C |
| chr1_-_153348067 | 8.51 |
ENST00000368737.3
|
S100A12
|
S100 calcium binding protein A12 |
| chr13_+_37574678 | 8.47 |
ENST00000389704.3
|
EXOSC8
|
exosome component 8 |
| chr7_+_117864815 | 8.47 |
ENST00000433239.1
|
ANKRD7
|
ankyrin repeat domain 7 |
| chr13_+_50070077 | 8.42 |
ENST00000378319.3
ENST00000426879.1 |
PHF11
|
PHD finger protein 11 |
| chr1_-_27952741 | 8.40 |
ENST00000399173.1
|
FGR
|
feline Gardner-Rasheed sarcoma viral oncogene homolog |
| chr17_-_34625719 | 8.30 |
ENST00000422211.2
ENST00000542124.1 |
CCL3L1
|
chemokine (C-C motif) ligand 3-like 1 |
| chr3_-_50375657 | 8.05 |
ENST00000395126.3
|
RASSF1
|
Ras association (RalGDS/AF-6) domain family member 1 |
| chr3_-_52029958 | 8.03 |
ENST00000294189.6
|
RPL29
|
ribosomal protein L29 |
| chr12_-_54689532 | 8.00 |
ENST00000540264.2
ENST00000312156.4 |
NFE2
|
nuclear factor, erythroid 2 |
| chr1_-_153518270 | 8.00 |
ENST00000354332.4
ENST00000368716.4 |
S100A4
|
S100 calcium binding protein A4 |
| chr6_-_31508304 | 7.99 |
ENST00000376177.2
|
DDX39B
|
DEAD (Asp-Glu-Ala-Asp) box polypeptide 39B |
| chr16_-_18801643 | 7.97 |
ENST00000322989.4
ENST00000563390.1 |
RPS15A
|
ribosomal protein S15a |
| chr1_-_150738261 | 7.90 |
ENST00000448301.2
ENST00000368985.3 |
CTSS
|
cathepsin S |
| chr1_-_36937075 | 7.81 |
ENST00000464465.2
|
CSF3R
|
colony stimulating factor 3 receptor (granulocyte) |
| chr16_-_2314222 | 7.79 |
ENST00000566397.1
|
RNPS1
|
RNA binding protein S1, serine-rich domain |
| chr5_-_176433582 | 7.77 |
ENST00000506128.1
|
UIMC1
|
ubiquitin interaction motif containing 1 |
| chr12_+_56324756 | 7.76 |
ENST00000331886.5
ENST00000555090.1 |
DGKA
|
diacylglycerol kinase, alpha 80kDa |
| chr19_-_8642289 | 7.75 |
ENST00000596675.1
ENST00000338257.8 |
MYO1F
|
myosin IF |
| chr12_-_51718436 | 7.66 |
ENST00000544402.1
|
BIN2
|
bridging integrator 2 |
| chr5_-_176433693 | 7.59 |
ENST00000507513.1
ENST00000511320.1 |
UIMC1
|
ubiquitin interaction motif containing 1 |
| chr17_-_3599492 | 7.58 |
ENST00000435558.1
ENST00000345901.3 |
P2RX5
|
purinergic receptor P2X, ligand-gated ion channel, 5 |
| chr16_-_9030515 | 7.56 |
ENST00000535863.1
ENST00000381886.4 |
USP7
|
ubiquitin specific peptidase 7 (herpes virus-associated) |
| chr1_+_161185032 | 7.54 |
ENST00000367992.3
ENST00000289902.1 |
FCER1G
|
Fc fragment of IgE, high affinity I, receptor for; gamma polypeptide |
| chr3_-_48647470 | 7.49 |
ENST00000203407.5
|
UQCRC1
|
ubiquinol-cytochrome c reductase core protein I |
| chr22_+_32870661 | 7.43 |
ENST00000266087.7
|
FBXO7
|
F-box protein 7 |
| chr8_-_54935001 | 7.43 |
ENST00000396401.3
ENST00000521604.2 |
TCEA1
|
transcription elongation factor A (SII), 1 |
| chr2_+_208423840 | 7.39 |
ENST00000539789.1
|
CREB1
|
cAMP responsive element binding protein 1 |
| chr16_+_30211181 | 7.36 |
ENST00000395138.2
|
SULT1A3
|
sulfotransferase family, cytosolic, 1A, phenol-preferring, member 3 |
| chr7_-_99063769 | 7.15 |
ENST00000394186.3
ENST00000359832.4 ENST00000449683.1 ENST00000488775.1 ENST00000523680.1 ENST00000292475.3 ENST00000430982.1 ENST00000555673.1 ENST00000413834.1 |
ATP5J2
PTCD1
ATP5J2-PTCD1
|
ATP synthase, H+ transporting, mitochondrial Fo complex, subunit F2 pentatricopeptide repeat domain 1 ATP5J2-PTCD1 readthrough |
| chr19_+_17622415 | 7.14 |
ENST00000252603.2
ENST00000600923.1 |
PGLS
|
6-phosphogluconolactonase |
| chr17_+_60536002 | 7.11 |
ENST00000582809.1
|
TLK2
|
tousled-like kinase 2 |
| chr2_+_86426478 | 7.04 |
ENST00000254644.8
ENST00000605125.1 ENST00000337109.4 ENST00000409180.1 |
MRPL35
|
mitochondrial ribosomal protein L35 |
| chr9_+_131217459 | 7.02 |
ENST00000497812.2
ENST00000393533.2 |
ODF2
|
outer dense fiber of sperm tails 2 |
| chr16_-_25026641 | 7.00 |
ENST00000289968.6
ENST00000303665.5 ENST00000455311.2 ENST00000441763.2 |
ARHGAP17
|
Rho GTPase activating protein 17 |
| chr2_+_39005336 | 6.89 |
ENST00000409566.1
|
GEMIN6
|
gem (nuclear organelle) associated protein 6 |
| chrX_+_49294472 | 6.84 |
ENST00000361446.5
|
GAGE12B
|
G antigen 12B |
| chr6_-_32160622 | 6.79 |
ENST00000487761.1
ENST00000375040.3 |
GPSM3
|
G-protein signaling modulator 3 |
| chr7_+_99070464 | 6.77 |
ENST00000331410.5
ENST00000483089.1 ENST00000448667.1 ENST00000493485.1 |
ZNF789
|
zinc finger protein 789 |
| chr3_+_38029462 | 6.72 |
ENST00000283713.6
|
VILL
|
villin-like |
| chr22_-_24096562 | 6.64 |
ENST00000398465.3
|
VPREB3
|
pre-B lymphocyte 3 |
| chr1_-_9148495 | 6.64 |
ENST00000464985.1
ENST00000487835.1 ENST00000486632.1 |
SLC2A5
|
solute carrier family 2 (facilitated glucose/fructose transporter), member 5 |
| chr6_-_30640811 | 6.64 |
ENST00000376442.3
|
DHX16
|
DEAH (Asp-Glu-Ala-His) box polypeptide 16 |
| chr1_+_144146808 | 6.61 |
ENST00000369190.5
ENST00000412624.2 ENST00000369365.3 |
NBPF8
|
neuroblastoma breakpoint family, member 8 |
| chr9_+_42671887 | 6.57 |
ENST00000456520.1
ENST00000377391.3 |
CBWD7
|
COBW domain containing 7 |
| chr5_+_172386419 | 6.54 |
ENST00000265100.2
ENST00000519239.1 |
RPL26L1
|
ribosomal protein L26-like 1 |
| chr7_-_102184083 | 6.45 |
ENST00000379357.5
|
POLR2J3
|
polymerase (RNA) II (DNA directed) polypeptide J3 |
| chr19_+_6361440 | 6.44 |
ENST00000245816.4
|
CLPP
|
caseinolytic mitochondrial matrix peptidase proteolytic subunit |
| chr17_+_8191815 | 6.42 |
ENST00000226105.6
ENST00000407006.4 ENST00000580434.1 ENST00000439238.3 |
RANGRF
|
RAN guanine nucleotide release factor |
| chr19_+_48828582 | 6.39 |
ENST00000270221.6
ENST00000596315.1 |
EMP3
|
epithelial membrane protein 3 |
| chr19_+_23299777 | 6.36 |
ENST00000597761.2
|
ZNF730
|
zinc finger protein 730 |
| chr1_+_28562617 | 6.36 |
ENST00000497986.1
ENST00000335514.5 ENST00000468425.2 ENST00000465645.1 |
ATPIF1
|
ATPase inhibitory factor 1 |
| chr11_+_64863587 | 6.34 |
ENST00000530773.1
ENST00000279281.3 ENST00000529180.1 |
VPS51
|
vacuolar protein sorting 51 homolog (S. cerevisiae) |
| chr12_-_109027643 | 6.34 |
ENST00000388962.3
ENST00000550948.1 |
SELPLG
|
selectin P ligand |
| chr1_+_45212051 | 6.33 |
ENST00000372222.3
|
KIF2C
|
kinesin family member 2C |
| chr22_+_40742497 | 6.33 |
ENST00000216194.7
|
ADSL
|
adenylosuccinate lyase |
| chr7_-_72722783 | 6.33 |
ENST00000428206.1
ENST00000252594.6 ENST00000310326.8 ENST00000438747.2 |
NSUN5
|
NOP2/Sun domain family, member 5 |
| chr6_+_16129308 | 6.27 |
ENST00000356840.3
ENST00000349606.4 |
MYLIP
|
myosin regulatory light chain interacting protein |
| chr14_-_23285011 | 6.22 |
ENST00000397532.3
|
SLC7A7
|
solute carrier family 7 (amino acid transporter light chain, y+L system), member 7 |
| chr16_+_29690358 | 6.22 |
ENST00000395384.4
ENST00000562473.1 |
QPRT
|
quinolinate phosphoribosyltransferase |
| chr20_+_361261 | 6.18 |
ENST00000217233.3
|
TRIB3
|
tribbles pseudokinase 3 |
| chr7_-_102283238 | 6.18 |
ENST00000340457.8
|
UPK3BL
|
uroplakin 3B-like |
| chr11_+_10772534 | 6.18 |
ENST00000361367.2
|
CTR9
|
CTR9, Paf1/RNA polymerase II complex component |
| chr16_+_29467127 | 6.15 |
ENST00000344620.6
|
SULT1A4
|
sulfotransferase family, cytosolic, 1A, phenol-preferring, member 4 |
| chr1_-_154580616 | 6.11 |
ENST00000368474.4
|
ADAR
|
adenosine deaminase, RNA-specific |
| chr16_-_28634874 | 6.11 |
ENST00000395609.1
ENST00000350842.4 |
SULT1A1
|
sulfotransferase family, cytosolic, 1A, phenol-preferring, member 1 |
| chr11_+_65647280 | 6.09 |
ENST00000307886.3
ENST00000528419.1 ENST00000526034.1 |
CTSW
|
cathepsin W |
| chr12_-_8025623 | 6.07 |
ENST00000542782.1
ENST00000396589.2 ENST00000535266.1 ENST00000542505.1 |
SLC2A14
|
solute carrier family 2 (facilitated glucose transporter), member 14 |
| chr2_-_62115659 | 6.02 |
ENST00000544185.1
|
CCT4
|
chaperonin containing TCP1, subunit 4 (delta) |
| chr17_-_8113886 | 6.01 |
ENST00000577833.1
ENST00000534871.1 ENST00000583915.1 ENST00000316199.6 ENST00000581511.1 ENST00000585124.1 |
AURKB
|
aurora kinase B |
| chr16_-_68033356 | 6.01 |
ENST00000393847.1
ENST00000573808.1 ENST00000572624.1 |
DPEP2
|
dipeptidase 2 |
| chr16_+_88869621 | 5.98 |
ENST00000301019.4
|
CDT1
|
chromatin licensing and DNA replication factor 1 |
| chr19_+_5690207 | 5.97 |
ENST00000347512.3
|
RPL36
|
ribosomal protein L36 |
| chr2_+_219110149 | 5.95 |
ENST00000456575.1
|
ARPC2
|
actin related protein 2/3 complex, subunit 2, 34kDa |
| chr6_+_139456226 | 5.93 |
ENST00000367658.2
|
HECA
|
headcase homolog (Drosophila) |
| chr12_-_14721283 | 5.93 |
ENST00000240617.5
|
PLBD1
|
phospholipase B domain containing 1 |
| chr10_+_71029740 | 5.84 |
ENST00000450646.1
ENST00000360289.2 ENST00000448642.2 |
HK1
|
hexokinase 1 |
| chr19_-_45953983 | 5.83 |
ENST00000592083.1
|
ERCC1
|
excision repair cross-complementing rodent repair deficiency, complementation group 1 (includes overlapping antisense sequence) |
| chr12_-_118797475 | 5.77 |
ENST00000541786.1
ENST00000419821.2 ENST00000541878.1 |
TAOK3
|
TAO kinase 3 |
| chr3_-_47517302 | 5.74 |
ENST00000441517.2
ENST00000545718.1 |
SCAP
|
SREBF chaperone |
| chr12_-_53601055 | 5.70 |
ENST00000552972.1
ENST00000422257.3 ENST00000267082.5 |
ITGB7
|
integrin, beta 7 |
| chr16_-_29499154 | 5.69 |
ENST00000354563.5
|
RP11-231C14.4
|
Uncharacterized protein |
| chr12_-_6677422 | 5.69 |
ENST00000382421.3
ENST00000545200.1 ENST00000399466.2 ENST00000536124.1 ENST00000540228.1 ENST00000542867.1 ENST00000545492.1 ENST00000322166.5 ENST00000545915.1 |
NOP2
|
NOP2 nucleolar protein |
| chr4_+_2627159 | 5.68 |
ENST00000382839.3
ENST00000324666.5 ENST00000545951.1 ENST00000502458.1 ENST00000505311.1 |
FAM193A
|
family with sequence similarity 193, member A |
| chr19_+_22235310 | 5.66 |
ENST00000600162.1
|
ZNF257
|
zinc finger protein 257 |
| chr6_-_31510181 | 5.63 |
ENST00000458640.1
ENST00000396172.1 ENST00000417556.2 |
DDX39B
|
DEAD (Asp-Glu-Ala-Asp) box polypeptide 39B |
| chr20_+_3869423 | 5.63 |
ENST00000497424.1
|
PANK2
|
pantothenate kinase 2 |
| chr1_-_40042416 | 5.62 |
ENST00000372857.3
ENST00000372856.3 ENST00000531243.2 ENST00000451091.2 |
PABPC4
|
poly(A) binding protein, cytoplasmic 4 (inducible form) |
| chr22_+_40742512 | 5.61 |
ENST00000454266.2
ENST00000342312.6 |
ADSL
|
adenylosuccinate lyase |
| chr12_+_54891495 | 5.57 |
ENST00000293373.6
|
NCKAP1L
|
NCK-associated protein 1-like |
| chr7_-_102232891 | 5.54 |
ENST00000514917.2
|
RP11-514P8.7
|
RP11-514P8.7 |
| chr1_+_144811744 | 5.52 |
ENST00000338347.4
ENST00000440491.2 ENST00000375552.4 |
NBPF9
|
neuroblastoma breakpoint family, member 9 |
| chr2_-_74692473 | 5.51 |
ENST00000535045.1
ENST00000409065.1 ENST00000414701.1 ENST00000448666.1 ENST00000233616.4 ENST00000452063.2 |
MOGS
|
mannosyl-oligosaccharide glucosidase |
| chr2_+_39005325 | 5.51 |
ENST00000281950.3
|
GEMIN6
|
gem (nuclear organelle) associated protein 6 |
| chr19_-_10305752 | 5.50 |
ENST00000540357.1
ENST00000359526.4 ENST00000340748.4 |
DNMT1
|
DNA (cytosine-5-)-methyltransferase 1 |
| chr16_+_85832146 | 5.50 |
ENST00000565078.1
|
COX4I1
|
cytochrome c oxidase subunit IV isoform 1 |
| chr1_-_11115877 | 5.50 |
ENST00000490101.1
|
SRM
|
spermidine synthase |
| chr13_+_25670268 | 5.49 |
ENST00000281589.3
|
PABPC3
|
poly(A) binding protein, cytoplasmic 3 |
| chrX_-_71497148 | 5.49 |
ENST00000316084.6
|
RPS4X
|
ribosomal protein S4, X-linked |
| chr17_+_41158742 | 5.48 |
ENST00000415816.2
ENST00000438323.2 |
IFI35
|
interferon-induced protein 35 |
| chr6_-_41909561 | 5.46 |
ENST00000372991.4
|
CCND3
|
cyclin D3 |
| chr11_-_67211263 | 5.46 |
ENST00000393893.1
|
CORO1B
|
coronin, actin binding protein, 1B |
| chr12_+_7055631 | 5.44 |
ENST00000543115.1
ENST00000399448.1 |
PTPN6
|
protein tyrosine phosphatase, non-receptor type 6 |
| chr3_+_112051347 | 5.41 |
ENST00000606471.1
|
CD200
|
CD200 molecule |
| chr19_+_52932435 | 5.38 |
ENST00000301085.4
|
ZNF534
|
zinc finger protein 534 |
| chr6_+_32938665 | 5.38 |
ENST00000374831.4
ENST00000395289.2 |
BRD2
|
bromodomain containing 2 |
| chr7_+_66386204 | 5.37 |
ENST00000341567.4
ENST00000607045.1 |
TMEM248
|
transmembrane protein 248 |
| chr5_+_118691706 | 5.36 |
ENST00000415806.2
|
TNFAIP8
|
tumor necrosis factor, alpha-induced protein 8 |
| chr19_+_54704610 | 5.33 |
ENST00000302907.4
|
RPS9
|
ribosomal protein S9 |
| chr7_-_76247617 | 5.30 |
ENST00000441393.1
|
POMZP3
|
POM121 and ZP3 fusion |
| chr15_+_78832747 | 5.29 |
ENST00000560217.1
ENST00000044462.7 ENST00000559082.1 ENST00000559948.1 ENST00000413382.2 ENST00000559146.1 ENST00000558281.1 |
PSMA4
|
proteasome (prosome, macropain) subunit, alpha type, 4 |
| chr19_+_50321528 | 5.28 |
ENST00000312865.6
ENST00000595185.1 ENST00000538643.1 |
MED25
|
mediator complex subunit 25 |
| chr19_-_36399149 | 5.28 |
ENST00000585901.2
ENST00000544690.2 ENST00000424586.3 ENST00000262629.4 ENST00000589517.1 |
TYROBP
|
TYRO protein tyrosine kinase binding protein |
| chr3_+_52448539 | 5.26 |
ENST00000461861.1
|
PHF7
|
PHD finger protein 7 |
| chr10_-_30638090 | 5.24 |
ENST00000421701.1
ENST00000263063.4 |
MTPAP
|
mitochondrial poly(A) polymerase |
| chr19_+_36027660 | 5.24 |
ENST00000585510.1
|
GAPDHS
|
glyceraldehyde-3-phosphate dehydrogenase, spermatogenic |
| chr14_+_21249200 | 5.24 |
ENST00000304677.2
|
RNASE6
|
ribonuclease, RNase A family, k6 |
| chr5_+_32531893 | 5.23 |
ENST00000512913.1
|
SUB1
|
SUB1 homolog (S. cerevisiae) |
| chr4_-_24586140 | 5.19 |
ENST00000336812.4
|
DHX15
|
DEAH (Asp-Glu-Ala-His) box helicase 15 |
| chr19_+_17862274 | 5.19 |
ENST00000596536.1
ENST00000593870.1 ENST00000598086.1 ENST00000598932.1 ENST00000595023.1 ENST00000594068.1 ENST00000596507.1 ENST00000595033.1 ENST00000597718.1 |
FCHO1
|
FCH domain only 1 |
| chr5_-_140013275 | 5.18 |
ENST00000512545.1
ENST00000302014.6 ENST00000401743.2 |
CD14
|
CD14 molecule |
| chr3_+_186739636 | 5.18 |
ENST00000440338.1
ENST00000448044.1 |
ST6GAL1
|
ST6 beta-galactosamide alpha-2,6-sialyltranferase 1 |
| chr19_-_14889349 | 5.18 |
ENST00000315576.3
ENST00000392967.2 ENST00000346057.1 ENST00000353876.1 ENST00000353005.1 |
EMR2
|
egf-like module containing, mucin-like, hormone receptor-like 2 |
| chr13_+_98612446 | 5.16 |
ENST00000496368.1
ENST00000421861.2 ENST00000357602.3 |
IPO5
|
importin 5 |
| chr1_-_148347506 | 5.15 |
ENST00000369189.3
|
NBPF20
|
neuroblastoma breakpoint family, member 20 |
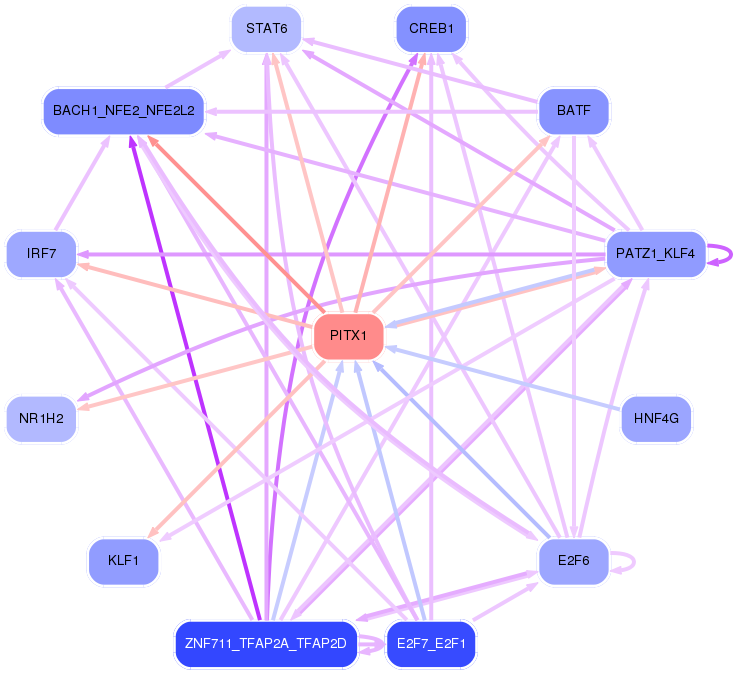
Network of associatons between targets according to the STRING database.

First level regulatory network of PITX1
Gene Ontology Analysis
Gene overrepresentation in biological_process category:
| Log-likelihood per target | Total log-likelihood | Term | Description |
|---|---|---|---|
| 5.2 | 15.6 | GO:0045659 | regulation of neutrophil differentiation(GO:0045658) negative regulation of neutrophil differentiation(GO:0045659) |
| 4.9 | 34.3 | GO:0098989 | NMDA selective glutamate receptor signaling pathway(GO:0098989) |
| 4.9 | 9.8 | GO:0006438 | valyl-tRNA aminoacylation(GO:0006438) |
| 4.6 | 18.4 | GO:0043376 | regulation of CD8-positive, alpha-beta T cell differentiation(GO:0043376) actin polymerization-dependent cell motility(GO:0070358) |
| 4.3 | 13.0 | GO:0006425 | glutaminyl-tRNA aminoacylation(GO:0006425) |
| 4.1 | 12.3 | GO:2000397 | protein targeting to vacuole involved in ubiquitin-dependent protein catabolic process via the multivesicular body sorting pathway(GO:0043328) ubiquitin-dependent endocytosis(GO:0070086) regulation of ubiquitin-dependent endocytosis(GO:2000395) positive regulation of ubiquitin-dependent endocytosis(GO:2000397) |
| 4.0 | 11.9 | GO:0044208 | 'de novo' AMP biosynthetic process(GO:0044208) |
| 3.7 | 11.2 | GO:2001160 | regulation of histone H3-K79 methylation(GO:2001160) positive regulation of histone H3-K79 methylation(GO:2001162) |
| 3.3 | 13.1 | GO:0010216 | maintenance of DNA methylation(GO:0010216) |
| 3.0 | 21.3 | GO:0034316 | negative regulation of Arp2/3 complex-mediated actin nucleation(GO:0034316) |
| 3.0 | 18.1 | GO:0000821 | regulation of arginine metabolic process(GO:0000821) |
| 2.8 | 17.0 | GO:0070537 | histone H2A K63-linked deubiquitination(GO:0070537) |
| 2.8 | 11.3 | GO:0036034 | mediator complex assembly(GO:0036034) regulation of mediator complex assembly(GO:2001176) positive regulation of mediator complex assembly(GO:2001178) |
| 2.8 | 16.9 | GO:1902957 | negative regulation of mitochondrial electron transport, NADH to ubiquinone(GO:1902957) |
| 2.8 | 36.4 | GO:0045059 | positive thymic T cell selection(GO:0045059) |
| 2.6 | 12.9 | GO:0014835 | myoblast differentiation involved in skeletal muscle regeneration(GO:0014835) |
| 2.5 | 7.5 | GO:0001812 | positive regulation of type I hypersensitivity(GO:0001812) positive regulation of mast cell cytokine production(GO:0032765) mast cell homeostasis(GO:0033023) mast cell apoptotic process(GO:0033024) regulation of mast cell apoptotic process(GO:0033025) |
| 2.4 | 9.5 | GO:0033277 | abortive mitotic cell cycle(GO:0033277) |
| 2.4 | 7.1 | GO:0009051 | pentose-phosphate shunt, oxidative branch(GO:0009051) |
| 2.3 | 14.0 | GO:0045903 | positive regulation of translational fidelity(GO:0045903) |
| 2.3 | 22.5 | GO:0090666 | scaRNA localization to Cajal body(GO:0090666) |
| 2.1 | 8.5 | GO:0034473 | U1 snRNA 3'-end processing(GO:0034473) U5 snRNA 3'-end processing(GO:0034476) |
| 2.1 | 6.3 | GO:0050902 | leukocyte adhesive activation(GO:0050902) |
| 2.1 | 10.3 | GO:0038110 | interleukin-2-mediated signaling pathway(GO:0038110) |
| 2.0 | 6.1 | GO:1900368 | regulation of RNA interference(GO:1900368) negative regulation of RNA interference(GO:1900369) |
| 2.0 | 6.0 | GO:0044878 | mitotic cytokinesis checkpoint(GO:0044878) |
| 2.0 | 23.8 | GO:0000972 | transcription-dependent tethering of RNA polymerase II gene DNA at nuclear periphery(GO:0000972) |
| 1.9 | 11.6 | GO:1904550 | chemotaxis to arachidonic acid(GO:0034670) response to arachidonic acid(GO:1904550) |
| 1.9 | 13.3 | GO:0015755 | fructose transport(GO:0015755) fructose import(GO:0032445) carbohydrate import into cell(GO:0097319) carbohydrate import across plasma membrane(GO:0098704) fructose import across plasma membrane(GO:1990539) |
| 1.8 | 16.1 | GO:2000623 | regulation of nuclear-transcribed mRNA catabolic process, nonsense-mediated decay(GO:2000622) negative regulation of nuclear-transcribed mRNA catabolic process, nonsense-mediated decay(GO:2000623) |
| 1.7 | 1.7 | GO:0010730 | negative regulation of hydrogen peroxide biosynthetic process(GO:0010730) |
| 1.7 | 17.1 | GO:0061179 | negative regulation of insulin secretion involved in cellular response to glucose stimulus(GO:0061179) |
| 1.7 | 17.0 | GO:0006268 | DNA unwinding involved in DNA replication(GO:0006268) |
| 1.7 | 10.2 | GO:0035803 | egg coat formation(GO:0035803) |
| 1.7 | 8.4 | GO:0007619 | courtship behavior(GO:0007619) |
| 1.7 | 10.0 | GO:0035694 | mitochondrial protein catabolic process(GO:0035694) |
| 1.6 | 4.9 | GO:0033364 | mast cell secretory granule organization(GO:0033364) |
| 1.6 | 6.4 | GO:0098905 | regulation of bundle of His cell action potential(GO:0098905) |
| 1.6 | 12.5 | GO:1902255 | positive regulation of intrinsic apoptotic signaling pathway by p53 class mediator(GO:1902255) |
| 1.5 | 4.6 | GO:0035915 | pore formation in membrane of other organism(GO:0035915) |
| 1.5 | 13.6 | GO:1901977 | negative regulation of cell cycle checkpoint(GO:1901977) negative regulation of DNA damage checkpoint(GO:2000002) |
| 1.5 | 1.5 | GO:2001020 | regulation of response to DNA damage stimulus(GO:2001020) |
| 1.5 | 37.2 | GO:0006337 | nucleosome disassembly(GO:0006337) |
| 1.5 | 4.4 | GO:0051083 | 'de novo' cotranslational protein folding(GO:0051083) |
| 1.4 | 10.1 | GO:1901526 | positive regulation of macromitophagy(GO:1901526) positive regulation of mitophagy in response to mitochondrial depolarization(GO:1904925) |
| 1.4 | 5.7 | GO:0003366 | cell-matrix adhesion involved in ameboidal cell migration(GO:0003366) |
| 1.4 | 14.1 | GO:0030951 | establishment or maintenance of microtubule cytoskeleton polarity(GO:0030951) |
| 1.4 | 2.8 | GO:1902661 | negative regulation of histone H3-K9 dimethylation(GO:1900110) positive regulation of glucose mediated signaling pathway(GO:1902661) |
| 1.4 | 41.8 | GO:0034035 | purine ribonucleoside bisphosphate metabolic process(GO:0034035) 3'-phosphoadenosine 5'-phosphosulfate metabolic process(GO:0050427) |
| 1.4 | 4.1 | GO:1903033 | regulation of microtubule plus-end binding(GO:1903031) positive regulation of microtubule plus-end binding(GO:1903033) |
| 1.4 | 10.9 | GO:0070475 | rRNA base methylation(GO:0070475) |
| 1.4 | 18.9 | GO:0002291 | T cell activation via T cell receptor contact with antigen bound to MHC molecule on antigen presenting cell(GO:0002291) |
| 1.3 | 4.0 | GO:0060734 | regulation of endoplasmic reticulum stress-induced eIF2 alpha phosphorylation(GO:0060734) positive regulation of peptidyl-serine dephosphorylation(GO:1902310) |
| 1.3 | 8.0 | GO:0042780 | tRNA 3'-end processing(GO:0042780) |
| 1.3 | 2.6 | GO:0045819 | positive regulation of glycogen catabolic process(GO:0045819) |
| 1.3 | 6.5 | GO:0061739 | protein lipidation involved in autophagosome assembly(GO:0061739) |
| 1.3 | 5.2 | GO:0038123 | toll-like receptor TLR1:TLR2 signaling pathway(GO:0038123) response to triacyl bacterial lipopeptide(GO:0071725) cellular response to triacyl bacterial lipopeptide(GO:0071727) |
| 1.3 | 8.9 | GO:0035166 | post-embryonic hemopoiesis(GO:0035166) |
| 1.2 | 5.0 | GO:0043382 | positive regulation of memory T cell differentiation(GO:0043382) |
| 1.2 | 6.2 | GO:0072526 | pyridine-containing compound catabolic process(GO:0072526) |
| 1.2 | 5.0 | GO:0021796 | cerebral cortex regionalization(GO:0021796) |
| 1.2 | 2.5 | GO:0042270 | protection from natural killer cell mediated cytotoxicity(GO:0042270) |
| 1.2 | 7.4 | GO:0032621 | interleukin-18 production(GO:0032621) |
| 1.2 | 6.0 | GO:0045914 | negative regulation of catecholamine metabolic process(GO:0045914) negative regulation of dopamine metabolic process(GO:0045963) |
| 1.2 | 3.6 | GO:0002625 | regulation of T cell antigen processing and presentation(GO:0002625) |
| 1.2 | 4.7 | GO:1904016 | response to Thyroglobulin triiodothyronine(GO:1904016) |
| 1.2 | 8.1 | GO:0042791 | 5S class rRNA transcription from RNA polymerase III type 1 promoter(GO:0042791) tRNA transcription from RNA polymerase III promoter(GO:0042797) |
| 1.1 | 3.4 | GO:0010637 | negative regulation of mitochondrial fusion(GO:0010637) |
| 1.1 | 7.8 | GO:0008295 | spermidine biosynthetic process(GO:0008295) |
| 1.1 | 6.6 | GO:0006741 | NADP biosynthetic process(GO:0006741) |
| 1.1 | 13.1 | GO:0006388 | tRNA splicing, via endonucleolytic cleavage and ligation(GO:0006388) |
| 1.1 | 3.2 | GO:0006269 | DNA replication, synthesis of RNA primer(GO:0006269) |
| 1.1 | 2.1 | GO:1902512 | positive regulation of apoptotic DNA fragmentation(GO:1902512) |
| 1.1 | 51.9 | GO:0000387 | spliceosomal snRNP assembly(GO:0000387) |
| 1.0 | 10.3 | GO:1902455 | negative regulation of stem cell population maintenance(GO:1902455) |
| 1.0 | 3.1 | GO:0006447 | regulation of translational initiation by iron(GO:0006447) |
| 1.0 | 21.4 | GO:0035428 | hexose transmembrane transport(GO:0035428) glucose transmembrane transport(GO:1904659) |
| 1.0 | 4.1 | GO:1902626 | assembly of large subunit precursor of preribosome(GO:1902626) |
| 1.0 | 8.6 | GO:0001878 | response to yeast(GO:0001878) |
| 1.0 | 2.9 | GO:0002224 | toll-like receptor signaling pathway(GO:0002224) |
| 1.0 | 2.9 | GO:0033499 | galactose catabolic process via UDP-galactose(GO:0033499) |
| 0.9 | 9.4 | GO:0015939 | pantothenate metabolic process(GO:0015939) |
| 0.9 | 17.8 | GO:0032060 | bleb assembly(GO:0032060) |
| 0.9 | 7.4 | GO:1903599 | positive regulation of mitophagy(GO:1903599) |
| 0.9 | 2.7 | GO:2001187 | positive regulation of CD8-positive, alpha-beta T cell activation(GO:2001187) |
| 0.9 | 2.7 | GO:0002439 | chronic inflammatory response to antigenic stimulus(GO:0002439) |
| 0.9 | 28.0 | GO:0035590 | purinergic nucleotide receptor signaling pathway(GO:0035590) |
| 0.9 | 6.3 | GO:0010989 | negative regulation of low-density lipoprotein particle clearance(GO:0010989) |
| 0.9 | 4.5 | GO:0031120 | snRNA pseudouridine synthesis(GO:0031120) |
| 0.9 | 10.5 | GO:0006089 | lactate metabolic process(GO:0006089) |
| 0.9 | 2.6 | GO:1903719 | regulation of I-kappaB phosphorylation(GO:1903719) positive regulation of I-kappaB phosphorylation(GO:1903721) |
| 0.8 | 2.5 | GO:2000670 | negative regulation of melanin biosynthetic process(GO:0048022) negative regulation of secondary metabolite biosynthetic process(GO:1900377) positive regulation of dendritic cell apoptotic process(GO:2000670) |
| 0.8 | 4.2 | GO:2000110 | regulation of MyD88-dependent toll-like receptor signaling pathway(GO:0034124) negative regulation of macrophage apoptotic process(GO:2000110) |
| 0.8 | 3.3 | GO:0043248 | proteasome assembly(GO:0043248) |
| 0.8 | 5.8 | GO:0072656 | maintenance of protein location in mitochondrion(GO:0072656) |
| 0.8 | 2.5 | GO:0006419 | alanyl-tRNA aminoacylation(GO:0006419) |
| 0.8 | 5.7 | GO:1900625 | regulation of monocyte aggregation(GO:1900623) positive regulation of monocyte aggregation(GO:1900625) |
| 0.8 | 4.0 | GO:1900041 | negative regulation of interleukin-2 secretion(GO:1900041) |
| 0.8 | 2.4 | GO:0002352 | B cell selection(GO:0002339) B cell negative selection(GO:0002352) post-embryonic camera-type eye morphogenesis(GO:0048597) |
| 0.8 | 44.0 | GO:0050434 | positive regulation of viral transcription(GO:0050434) |
| 0.8 | 7.2 | GO:1902416 | positive regulation of mRNA binding(GO:1902416) |
| 0.8 | 0.8 | GO:0002316 | follicular B cell differentiation(GO:0002316) |
| 0.8 | 14.2 | GO:0030889 | negative regulation of B cell proliferation(GO:0030889) |
| 0.8 | 4.7 | GO:1903435 | positive regulation of constitutive secretory pathway(GO:1903435) |
| 0.8 | 2.3 | GO:0051037 | histone displacement(GO:0001207) regulation of transcription involved in meiotic cell cycle(GO:0051037) positive regulation of transcription involved in meiotic cell cycle(GO:0051039) |
| 0.8 | 3.1 | GO:2000435 | regulation of protein neddylation(GO:2000434) negative regulation of protein neddylation(GO:2000435) |
| 0.8 | 6.9 | GO:0001672 | regulation of chromatin assembly or disassembly(GO:0001672) |
| 0.8 | 3.0 | GO:0045079 | negative regulation of chemokine biosynthetic process(GO:0045079) |
| 0.8 | 2.3 | GO:0072229 | isoleucine catabolic process(GO:0006550) proximal convoluted tubule development(GO:0072019) metanephric proximal convoluted tubule development(GO:0072229) |
| 0.8 | 2.3 | GO:0090187 | positive regulation of pancreatic juice secretion(GO:0090187) |
| 0.7 | 3.7 | GO:0033384 | geranyl diphosphate metabolic process(GO:0033383) geranyl diphosphate biosynthetic process(GO:0033384) farnesyl diphosphate biosynthetic process(GO:0045337) |
| 0.7 | 2.2 | GO:0006423 | cysteinyl-tRNA aminoacylation(GO:0006423) |
| 0.7 | 3.0 | GO:0002183 | cytoplasmic translational initiation(GO:0002183) |
| 0.7 | 2.2 | GO:0019242 | methylglyoxal biosynthetic process(GO:0019242) |
| 0.7 | 5.9 | GO:0032790 | ribosome disassembly(GO:0032790) |
| 0.7 | 22.2 | GO:0048268 | clathrin coat assembly(GO:0048268) |
| 0.7 | 2.2 | GO:0018894 | dibenzo-p-dioxin metabolic process(GO:0018894) |
| 0.7 | 0.7 | GO:0090662 | energy coupled proton transmembrane transport, against electrochemical gradient(GO:0015988) ATP hydrolysis coupled proton transport(GO:0015991) ATP hydrolysis coupled transmembrane transport(GO:0090662) |
| 0.7 | 2.9 | GO:0007249 | I-kappaB kinase/NF-kappaB signaling(GO:0007249) |
| 0.7 | 2.2 | GO:0002296 | T-helper 1 cell lineage commitment(GO:0002296) |
| 0.7 | 9.4 | GO:0032516 | positive regulation of phosphoprotein phosphatase activity(GO:0032516) |
| 0.7 | 2.2 | GO:0010025 | wax biosynthetic process(GO:0010025) wax metabolic process(GO:0010166) |
| 0.7 | 27.0 | GO:0006409 | tRNA export from nucleus(GO:0006409) tRNA-containing ribonucleoprotein complex export from nucleus(GO:0071431) |
| 0.7 | 5.6 | GO:0017182 | peptidyl-diphthamide metabolic process(GO:0017182) peptidyl-diphthamide biosynthetic process from peptidyl-histidine(GO:0017183) |
| 0.7 | 4.2 | GO:0046604 | positive regulation of mitotic centrosome separation(GO:0046604) |
| 0.7 | 2.1 | GO:2000118 | regulation of sodium-dependent phosphate transport(GO:2000118) |
| 0.7 | 1.3 | GO:0051106 | positive regulation of DNA ligation(GO:0051106) |
| 0.7 | 4.6 | GO:0006772 | thiamine metabolic process(GO:0006772) |
| 0.7 | 7.3 | GO:1903265 | positive regulation of tumor necrosis factor-mediated signaling pathway(GO:1903265) |
| 0.7 | 2.6 | GO:0046490 | isopentenyl diphosphate biosynthetic process(GO:0009240) isopentenyl diphosphate metabolic process(GO:0046490) |
| 0.7 | 3.9 | GO:1901838 | positive regulation of transcription of nuclear large rRNA transcript from RNA polymerase I promoter(GO:1901838) |
| 0.7 | 42.7 | GO:0002279 | mast cell activation involved in immune response(GO:0002279) mast cell degranulation(GO:0043303) |
| 0.6 | 3.8 | GO:0006642 | triglyceride mobilization(GO:0006642) |
| 0.6 | 3.8 | GO:2000491 | positive regulation of hepatic stellate cell activation(GO:2000491) |
| 0.6 | 10.0 | GO:0000470 | maturation of LSU-rRNA(GO:0000470) |
| 0.6 | 5.6 | GO:0045716 | positive regulation of low-density lipoprotein particle receptor biosynthetic process(GO:0045716) |
| 0.6 | 5.0 | GO:0010918 | positive regulation of mitochondrial membrane potential(GO:0010918) |
| 0.6 | 5.0 | GO:0006116 | NADH oxidation(GO:0006116) |
| 0.6 | 6.7 | GO:0006030 | chitin metabolic process(GO:0006030) chitin catabolic process(GO:0006032) |
| 0.6 | 1.8 | GO:0072719 | cellular response to cisplatin(GO:0072719) |
| 0.6 | 53.2 | GO:0006521 | regulation of cellular amino acid metabolic process(GO:0006521) |
| 0.6 | 2.4 | GO:0070982 | L-asparagine biosynthetic process(GO:0070981) L-asparagine metabolic process(GO:0070982) |
| 0.6 | 10.7 | GO:1990001 | inhibition of cysteine-type endopeptidase activity involved in apoptotic process(GO:1990001) |
| 0.6 | 1.8 | GO:0009183 | purine deoxyribonucleoside diphosphate biosynthetic process(GO:0009183) dGDP metabolic process(GO:0046066) |
| 0.6 | 10.6 | GO:0006123 | mitochondrial electron transport, cytochrome c to oxygen(GO:0006123) |
| 0.6 | 3.5 | GO:0032483 | regulation of Rab protein signal transduction(GO:0032483) |
| 0.6 | 2.3 | GO:0090200 | positive regulation of release of cytochrome c from mitochondria(GO:0090200) |
| 0.6 | 7.5 | GO:0006122 | mitochondrial electron transport, ubiquinol to cytochrome c(GO:0006122) |
| 0.6 | 2.9 | GO:0003051 | brain renin-angiotensin system(GO:0002035) angiotensin-mediated drinking behavior(GO:0003051) |
| 0.6 | 33.4 | GO:0018279 | protein N-linked glycosylation via asparagine(GO:0018279) |
| 0.6 | 1.7 | GO:0090234 | regulation of kinetochore assembly(GO:0090234) |
| 0.6 | 5.0 | GO:0045901 | positive regulation of translational elongation(GO:0045901) |
| 0.5 | 15.8 | GO:0034080 | CENP-A containing nucleosome assembly(GO:0034080) CENP-A containing chromatin organization(GO:0061641) |
| 0.5 | 4.3 | GO:0032071 | regulation of endodeoxyribonuclease activity(GO:0032071) |
| 0.5 | 1.6 | GO:1903630 | regulation of aminoacyl-tRNA ligase activity(GO:1903630) |
| 0.5 | 1.6 | GO:0007079 | mitotic chromosome movement towards spindle pole(GO:0007079) |
| 0.5 | 21.6 | GO:0015985 | energy coupled proton transport, down electrochemical gradient(GO:0015985) ATP synthesis coupled proton transport(GO:0015986) |
| 0.5 | 77.1 | GO:0006614 | SRP-dependent cotranslational protein targeting to membrane(GO:0006614) |
| 0.5 | 5.9 | GO:0039536 | negative regulation of RIG-I signaling pathway(GO:0039536) |
| 0.5 | 5.3 | GO:0001973 | adenosine receptor signaling pathway(GO:0001973) G-protein coupled purinergic receptor signaling pathway(GO:0035588) |
| 0.5 | 4.7 | GO:0070900 | mitochondrial tRNA modification(GO:0070900) mitochondrial RNA modification(GO:1900864) |
| 0.5 | 2.1 | GO:0006528 | asparagine metabolic process(GO:0006528) |
| 0.5 | 2.6 | GO:0098502 | DNA dephosphorylation(GO:0098502) |
| 0.5 | 9.2 | GO:0072540 | T-helper cell lineage commitment(GO:0002295) T-helper 17 cell lineage commitment(GO:0072540) |
| 0.5 | 4.5 | GO:0051014 | actin filament severing(GO:0051014) |
| 0.5 | 2.5 | GO:0097029 | mature conventional dendritic cell differentiation(GO:0097029) |
| 0.5 | 2.5 | GO:0071630 | nucleus-associated proteasomal ubiquitin-dependent protein catabolic process(GO:0071630) |
| 0.5 | 1.5 | GO:0034127 | regulation of MyD88-independent toll-like receptor signaling pathway(GO:0034127) |
| 0.5 | 1.4 | GO:0046368 | GDP-L-fucose biosynthetic process(GO:0042350) 'de novo' GDP-L-fucose biosynthetic process(GO:0042351) GDP-L-fucose metabolic process(GO:0046368) |
| 0.5 | 1.9 | GO:0097010 | eukaryotic translation initiation factor 4F complex assembly(GO:0097010) |
| 0.5 | 1.9 | GO:0016139 | glycoside catabolic process(GO:0016139) glycosylceramide catabolic process(GO:0046477) |
| 0.5 | 15.9 | GO:0042273 | ribosomal large subunit biogenesis(GO:0042273) |
| 0.5 | 21.4 | GO:0070979 | protein K11-linked ubiquitination(GO:0070979) |
| 0.5 | 4.6 | GO:0002281 | macrophage activation involved in immune response(GO:0002281) |
| 0.5 | 2.3 | GO:0001306 | age-dependent response to oxidative stress(GO:0001306) age-dependent response to reactive oxygen species(GO:0001315) regulation of systemic arterial blood pressure by acetylcholine(GO:0003068) vasodilation by acetylcholine involved in regulation of systemic arterial blood pressure(GO:0003069) regulation of systemic arterial blood pressure by neurotransmitter(GO:0003070) age-dependent general metabolic decline(GO:0007571) |
| 0.5 | 6.5 | GO:1900017 | positive regulation of cytokine production involved in inflammatory response(GO:1900017) |
| 0.5 | 11.0 | GO:0010569 | regulation of double-strand break repair via homologous recombination(GO:0010569) |
| 0.5 | 1.4 | GO:0006059 | hexitol metabolic process(GO:0006059) |
| 0.5 | 1.8 | GO:0042631 | cellular response to water deprivation(GO:0042631) |
| 0.4 | 1.3 | GO:0032466 | negative regulation of cytokinesis(GO:0032466) |
| 0.4 | 2.7 | GO:0000028 | ribosomal small subunit assembly(GO:0000028) |
| 0.4 | 10.2 | GO:0051194 | positive regulation of glycolytic process(GO:0045821) positive regulation of cofactor metabolic process(GO:0051194) positive regulation of coenzyme metabolic process(GO:0051197) |
| 0.4 | 3.5 | GO:0010499 | proteasomal ubiquitin-independent protein catabolic process(GO:0010499) |
| 0.4 | 4.0 | GO:0034244 | negative regulation of transcription elongation from RNA polymerase II promoter(GO:0034244) |
| 0.4 | 2.2 | GO:2000676 | positive regulation of type B pancreatic cell apoptotic process(GO:2000676) |
| 0.4 | 4.3 | GO:0043031 | negative regulation of macrophage activation(GO:0043031) |
| 0.4 | 3.9 | GO:0060754 | regulation of mast cell chemotaxis(GO:0060753) positive regulation of mast cell chemotaxis(GO:0060754) |
| 0.4 | 3.0 | GO:0007519 | skeletal muscle tissue development(GO:0007519) skeletal muscle organ development(GO:0060538) |
| 0.4 | 3.9 | GO:0046689 | response to mercury ion(GO:0046689) |
| 0.4 | 3.0 | GO:0007171 | activation of transmembrane receptor protein tyrosine kinase activity(GO:0007171) |
| 0.4 | 4.6 | GO:0009756 | carbohydrate mediated signaling(GO:0009756) |
| 0.4 | 2.1 | GO:0048539 | bone marrow development(GO:0048539) |
| 0.4 | 1.3 | GO:0044339 | canonical Wnt signaling pathway involved in osteoblast differentiation(GO:0044339) |
| 0.4 | 3.6 | GO:0075522 | IRES-dependent viral translational initiation(GO:0075522) |
| 0.4 | 0.8 | GO:0006788 | heme oxidation(GO:0006788) |
| 0.4 | 8.8 | GO:0097186 | amelogenesis(GO:0097186) |
| 0.4 | 7.1 | GO:0097067 | cellular response to thyroid hormone stimulus(GO:0097067) |
| 0.4 | 1.2 | GO:0044805 | late nucleophagy(GO:0044805) |
| 0.4 | 2.3 | GO:0015693 | magnesium ion transport(GO:0015693) |
| 0.4 | 2.3 | GO:0070315 | G1 to G0 transition involved in cell differentiation(GO:0070315) |
| 0.4 | 2.3 | GO:0050747 | positive regulation of lipoprotein metabolic process(GO:0050747) |
| 0.4 | 10.6 | GO:0000042 | protein targeting to Golgi(GO:0000042) |
| 0.4 | 4.5 | GO:0016236 | macroautophagy(GO:0016236) |
| 0.4 | 1.1 | GO:1990910 | response to thapsigargin(GO:1904578) cellular response to thapsigargin(GO:1904579) response to hypobaric hypoxia(GO:1990910) |
| 0.4 | 7.8 | GO:0048025 | negative regulation of mRNA splicing, via spliceosome(GO:0048025) |
| 0.4 | 5.2 | GO:0006610 | ribosomal protein import into nucleus(GO:0006610) |
| 0.4 | 4.8 | GO:0060285 | cilium-dependent cell motility(GO:0060285) |
| 0.4 | 7.7 | GO:0051123 | RNA polymerase II transcriptional preinitiation complex assembly(GO:0051123) |
| 0.4 | 8.1 | GO:0046339 | diacylglycerol metabolic process(GO:0046339) |
| 0.3 | 2.4 | GO:0051415 | interphase microtubule nucleation by interphase microtubule organizing center(GO:0051415) microtubule nucleation by microtubule organizing center(GO:0051418) |
| 0.3 | 24.7 | GO:0070126 | mitochondrial translational elongation(GO:0070125) mitochondrial translational termination(GO:0070126) |
| 0.3 | 1.7 | GO:0032929 | negative regulation of superoxide anion generation(GO:0032929) |
| 0.3 | 4.1 | GO:2000659 | regulation of interleukin-1-mediated signaling pathway(GO:2000659) |
| 0.3 | 1.4 | GO:0032049 | cardiolipin biosynthetic process(GO:0032049) |
| 0.3 | 6.1 | GO:0060261 | positive regulation of transcription initiation from RNA polymerase II promoter(GO:0060261) |
| 0.3 | 1.3 | GO:2001151 | regulation of renal water transport(GO:2001151) positive regulation of renal water transport(GO:2001153) |
| 0.3 | 3.3 | GO:0016446 | somatic hypermutation of immunoglobulin genes(GO:0016446) |
| 0.3 | 3.9 | GO:0032042 | mitochondrial DNA metabolic process(GO:0032042) |
| 0.3 | 1.3 | GO:1903644 | regulation of chaperone-mediated protein folding(GO:1903644) |
| 0.3 | 1.9 | GO:0036493 | positive regulation of translation in response to endoplasmic reticulum stress(GO:0036493) |
| 0.3 | 7.1 | GO:0007095 | mitotic G2 DNA damage checkpoint(GO:0007095) |
| 0.3 | 3.1 | GO:0007077 | mitotic nuclear envelope disassembly(GO:0007077) |
| 0.3 | 3.0 | GO:0042262 | DNA protection(GO:0042262) |
| 0.3 | 4.2 | GO:0071044 | histone mRNA catabolic process(GO:0071044) |
| 0.3 | 0.3 | GO:0051031 | tRNA transport(GO:0051031) |
| 0.3 | 3.6 | GO:0006782 | protoporphyrinogen IX biosynthetic process(GO:0006782) |
| 0.3 | 5.6 | GO:0042276 | error-prone translesion synthesis(GO:0042276) |
| 0.3 | 2.4 | GO:0031340 | positive regulation of vesicle fusion(GO:0031340) |
| 0.3 | 2.4 | GO:0061469 | regulation of type B pancreatic cell proliferation(GO:0061469) |
| 0.3 | 3.2 | GO:0051601 | exocyst localization(GO:0051601) |
| 0.3 | 12.1 | GO:0000083 | regulation of transcription involved in G1/S transition of mitotic cell cycle(GO:0000083) |
| 0.3 | 2.8 | GO:0042373 | vitamin K metabolic process(GO:0042373) |
| 0.3 | 3.0 | GO:0050930 | induction of positive chemotaxis(GO:0050930) |
| 0.3 | 3.7 | GO:1901750 | leukotriene D4 metabolic process(GO:1901748) leukotriene D4 biosynthetic process(GO:1901750) |
| 0.3 | 1.0 | GO:0036023 | limb joint morphogenesis(GO:0036022) embryonic skeletal limb joint morphogenesis(GO:0036023) |
| 0.3 | 5.4 | GO:0097320 | membrane tubulation(GO:0097320) |
| 0.3 | 0.8 | GO:0043605 | cellular amide catabolic process(GO:0043605) |
| 0.3 | 3.8 | GO:0048026 | positive regulation of mRNA splicing, via spliceosome(GO:0048026) |
| 0.3 | 1.3 | GO:0045654 | positive regulation of megakaryocyte differentiation(GO:0045654) |
| 0.2 | 2.2 | GO:0009249 | protein lipoylation(GO:0009249) |
| 0.2 | 2.5 | GO:0071550 | death-inducing signaling complex assembly(GO:0071550) |
| 0.2 | 10.1 | GO:0045737 | positive regulation of cyclin-dependent protein serine/threonine kinase activity(GO:0045737) |
| 0.2 | 4.6 | GO:0002643 | regulation of tolerance induction(GO:0002643) |
| 0.2 | 0.5 | GO:0002232 | leukocyte chemotaxis involved in inflammatory response(GO:0002232) |
| 0.2 | 0.9 | GO:1904796 | regulation of core promoter binding(GO:1904796) |
| 0.2 | 17.5 | GO:0010257 | NADH dehydrogenase complex assembly(GO:0010257) mitochondrial respiratory chain complex I assembly(GO:0032981) mitochondrial respiratory chain complex I biogenesis(GO:0097031) |
| 0.2 | 1.6 | GO:1902969 | mitotic DNA replication(GO:1902969) |
| 0.2 | 0.7 | GO:0050732 | negative regulation of peptidyl-tyrosine phosphorylation(GO:0050732) |
| 0.2 | 2.8 | GO:0046051 | UTP biosynthetic process(GO:0006228) UTP metabolic process(GO:0046051) |
| 0.2 | 2.7 | GO:0045086 | positive regulation of interleukin-2 biosynthetic process(GO:0045086) positive regulation of isotype switching to IgG isotypes(GO:0048304) |
| 0.2 | 2.5 | GO:0019885 | antigen processing and presentation of endogenous peptide antigen(GO:0002483) antigen processing and presentation of endogenous peptide antigen via MHC class I(GO:0019885) |
| 0.2 | 3.9 | GO:0035641 | locomotory exploration behavior(GO:0035641) |
| 0.2 | 4.3 | GO:0045717 | negative regulation of fatty acid biosynthetic process(GO:0045717) |
| 0.2 | 0.5 | GO:0015743 | thiosulfate transport(GO:0015709) oxaloacetate transport(GO:0015729) malate transport(GO:0015743) malate transmembrane transport(GO:0071423) oxaloacetate(2-) transmembrane transport(GO:1902356) |
| 0.2 | 3.2 | GO:0070389 | chaperone cofactor-dependent protein refolding(GO:0070389) |
| 0.2 | 2.0 | GO:0042769 | DNA damage response, detection of DNA damage(GO:0042769) |
| 0.2 | 1.5 | GO:0034472 | snRNA 3'-end processing(GO:0034472) |
| 0.2 | 1.9 | GO:0051085 | 'de novo' posttranslational protein folding(GO:0051084) chaperone mediated protein folding requiring cofactor(GO:0051085) |
| 0.2 | 0.9 | GO:0006238 | CMP salvage(GO:0006238) CMP biosynthetic process(GO:0009224) CMP metabolic process(GO:0046035) |
| 0.2 | 0.9 | GO:0070245 | snRNA transcription from RNA polymerase III promoter(GO:0042796) positive regulation of thymocyte apoptotic process(GO:0070245) |
| 0.2 | 1.7 | GO:0032020 | ISG15-protein conjugation(GO:0032020) |
| 0.2 | 10.3 | GO:0006283 | transcription-coupled nucleotide-excision repair(GO:0006283) |
| 0.2 | 2.9 | GO:0007084 | mitotic nuclear envelope reassembly(GO:0007084) |
| 0.2 | 3.3 | GO:0034975 | protein folding in endoplasmic reticulum(GO:0034975) |
| 0.2 | 0.2 | GO:0010841 | positive regulation of circadian sleep/wake cycle, wakefulness(GO:0010841) |
| 0.2 | 0.8 | GO:0032487 | regulation of Rap protein signal transduction(GO:0032487) |
| 0.2 | 57.0 | GO:0000377 | RNA splicing, via transesterification reactions with bulged adenosine as nucleophile(GO:0000377) mRNA splicing, via spliceosome(GO:0000398) |
| 0.2 | 1.4 | GO:0031936 | negative regulation of chromatin silencing(GO:0031936) |
| 0.2 | 4.3 | GO:0035024 | negative regulation of Rho protein signal transduction(GO:0035024) |
| 0.2 | 3.4 | GO:0090110 | cargo loading into COPII-coated vesicle(GO:0090110) |
| 0.2 | 0.4 | GO:0002314 | germinal center B cell differentiation(GO:0002314) |
| 0.2 | 0.4 | GO:0005988 | lactose metabolic process(GO:0005988) lactose biosynthetic process(GO:0005989) |
| 0.2 | 19.3 | GO:0034728 | nucleosome organization(GO:0034728) |
| 0.2 | 0.9 | GO:1904977 | lymphatic endothelial cell migration(GO:1904977) |
| 0.2 | 1.6 | GO:0072520 | seminiferous tubule development(GO:0072520) |
| 0.2 | 2.8 | GO:0007220 | Notch receptor processing(GO:0007220) |
| 0.2 | 5.4 | GO:0043068 | positive regulation of apoptotic process(GO:0043065) positive regulation of programmed cell death(GO:0043068) |
| 0.2 | 1.2 | GO:0016180 | snRNA processing(GO:0016180) |
| 0.2 | 0.9 | GO:1903911 | positive regulation of receptor clustering(GO:1903911) |
| 0.2 | 3.4 | GO:0006607 | NLS-bearing protein import into nucleus(GO:0006607) |
| 0.2 | 4.7 | GO:0001881 | receptor recycling(GO:0001881) |
| 0.2 | 1.9 | GO:0048003 | antigen processing and presentation via MHC class Ib(GO:0002475) antigen processing and presentation of lipid antigen via MHC class Ib(GO:0048003) antigen processing and presentation, exogenous lipid antigen via MHC class Ib(GO:0048007) |
| 0.2 | 2.6 | GO:0010592 | positive regulation of lamellipodium assembly(GO:0010592) |
| 0.2 | 1.4 | GO:1904646 | cellular response to beta-amyloid(GO:1904646) |
| 0.2 | 1.9 | GO:0044065 | regulation of respiratory system process(GO:0044065) |
| 0.2 | 0.5 | GO:0043652 | engulfment of apoptotic cell(GO:0043652) |
| 0.1 | 0.9 | GO:0033353 | S-adenosylmethionine cycle(GO:0033353) |
| 0.1 | 0.6 | GO:0015760 | hexose phosphate transport(GO:0015712) glucose-6-phosphate transport(GO:0015760) |
| 0.1 | 5.3 | GO:0071470 | cellular response to osmotic stress(GO:0071470) |
| 0.1 | 2.3 | GO:0045947 | negative regulation of translational initiation(GO:0045947) |
| 0.1 | 3.9 | GO:0007158 | neuron cell-cell adhesion(GO:0007158) |
| 0.1 | 3.7 | GO:0051156 | glucose 6-phosphate metabolic process(GO:0051156) |
| 0.1 | 3.7 | GO:0034383 | low-density lipoprotein particle clearance(GO:0034383) |
| 0.1 | 1.4 | GO:0042074 | cell migration involved in gastrulation(GO:0042074) |
| 0.1 | 1.1 | GO:0045047 | protein targeting to ER(GO:0045047) |
| 0.1 | 0.5 | GO:0000023 | maltose metabolic process(GO:0000023) |
| 0.1 | 1.4 | GO:0042940 | D-amino acid transport(GO:0042940) |
| 0.1 | 1.2 | GO:0030916 | otic vesicle formation(GO:0030916) |
| 0.1 | 1.1 | GO:0015816 | glycine transport(GO:0015816) |
| 0.1 | 1.0 | GO:0010624 | regulation of Schwann cell proliferation(GO:0010624) negative regulation of Schwann cell proliferation(GO:0010626) |
| 0.1 | 1.3 | GO:0042789 | mRNA transcription from RNA polymerase II promoter(GO:0042789) |
| 0.1 | 2.3 | GO:0032418 | lysosome localization(GO:0032418) |
| 0.1 | 4.1 | GO:0032527 | protein exit from endoplasmic reticulum(GO:0032527) |
| 0.1 | 0.6 | GO:0007635 | chemosensory behavior(GO:0007635) |
| 0.1 | 1.5 | GO:0032515 | negative regulation of phosphoprotein phosphatase activity(GO:0032515) |
| 0.1 | 3.8 | GO:0032508 | DNA duplex unwinding(GO:0032508) |
| 0.1 | 3.7 | GO:0030261 | chromosome condensation(GO:0030261) |
| 0.1 | 9.8 | GO:0016575 | histone deacetylation(GO:0016575) |
| 0.1 | 1.3 | GO:0016050 | vesicle organization(GO:0016050) |
| 0.1 | 3.6 | GO:0050832 | defense response to fungus(GO:0050832) |
| 0.1 | 0.6 | GO:0034334 | adherens junction maintenance(GO:0034334) |
| 0.1 | 0.5 | GO:0048840 | otolith development(GO:0048840) |
| 0.1 | 8.4 | GO:0030521 | androgen receptor signaling pathway(GO:0030521) |
| 0.1 | 1.9 | GO:0097421 | liver regeneration(GO:0097421) |
| 0.1 | 0.1 | GO:1904046 | negative regulation of vascular endothelial growth factor production(GO:1904046) |
| 0.1 | 1.5 | GO:0014029 | neural crest formation(GO:0014029) |
| 0.1 | 1.2 | GO:0030210 | heparin metabolic process(GO:0030202) heparin biosynthetic process(GO:0030210) |
| 0.1 | 0.9 | GO:0006659 | phosphatidylserine biosynthetic process(GO:0006659) |
| 0.1 | 3.9 | GO:0010501 | RNA secondary structure unwinding(GO:0010501) |
| 0.1 | 0.6 | GO:0035799 | ureter maturation(GO:0035799) |
| 0.1 | 3.3 | GO:0007339 | binding of sperm to zona pellucida(GO:0007339) |
| 0.1 | 0.7 | GO:0046940 | nucleoside monophosphate phosphorylation(GO:0046940) |
| 0.1 | 14.0 | GO:0006401 | RNA catabolic process(GO:0006401) |
| 0.1 | 1.4 | GO:0018214 | peptidyl-glutamic acid carboxylation(GO:0017187) protein carboxylation(GO:0018214) |
| 0.1 | 2.0 | GO:0006878 | cellular copper ion homeostasis(GO:0006878) |
| 0.1 | 1.8 | GO:0042104 | positive regulation of activated T cell proliferation(GO:0042104) |
| 0.1 | 0.6 | GO:0031648 | protein destabilization(GO:0031648) |
| 0.1 | 0.4 | GO:1905247 | regulation of aspartic-type endopeptidase activity involved in amyloid precursor protein catabolic process(GO:1902959) positive regulation of aspartic-type endopeptidase activity involved in amyloid precursor protein catabolic process(GO:1902961) regulation of aspartic-type peptidase activity(GO:1905245) positive regulation of aspartic-type peptidase activity(GO:1905247) |
| 0.1 | 0.2 | GO:0042255 | ribosome assembly(GO:0042255) |
| 0.1 | 5.4 | GO:0000079 | regulation of cyclin-dependent protein serine/threonine kinase activity(GO:0000079) |
| 0.1 | 1.2 | GO:0001701 | in utero embryonic development(GO:0001701) |
| 0.1 | 2.1 | GO:0007140 | male meiosis(GO:0007140) |
| 0.1 | 1.4 | GO:0016973 | poly(A)+ mRNA export from nucleus(GO:0016973) |
| 0.1 | 0.4 | GO:0033120 | positive regulation of RNA splicing(GO:0033120) |
| 0.1 | 0.5 | GO:0038169 | somatostatin receptor signaling pathway(GO:0038169) somatostatin signaling pathway(GO:0038170) |
| 0.1 | 2.1 | GO:0002479 | antigen processing and presentation of exogenous peptide antigen via MHC class I, TAP-dependent(GO:0002479) |
| 0.1 | 3.1 | GO:0030890 | positive regulation of B cell proliferation(GO:0030890) |
| 0.1 | 1.6 | GO:0005513 | detection of calcium ion(GO:0005513) |
| 0.1 | 1.0 | GO:0015781 | pyrimidine nucleotide-sugar transport(GO:0015781) protein O-linked fucosylation(GO:0036066) |
| 0.1 | 0.6 | GO:0072733 | response to staurosporine(GO:0072733) cellular response to staurosporine(GO:0072734) |
| 0.1 | 0.6 | GO:1903546 | protein localization to photoreceptor outer segment(GO:1903546) |
| 0.1 | 2.0 | GO:0006833 | water transport(GO:0006833) |
| 0.1 | 0.3 | GO:0007096 | regulation of exit from mitosis(GO:0007096) |
| 0.1 | 1.5 | GO:0042136 | neurotransmitter biosynthetic process(GO:0042136) |
| 0.1 | 2.1 | GO:0045070 | positive regulation of viral genome replication(GO:0045070) |
| 0.1 | 4.7 | GO:0050871 | positive regulation of B cell activation(GO:0050871) |
| 0.1 | 2.4 | GO:0001504 | neurotransmitter uptake(GO:0001504) |
| 0.1 | 8.1 | GO:0002377 | immunoglobulin production(GO:0002377) |
| 0.1 | 1.2 | GO:0018298 | protein-chromophore linkage(GO:0018298) |
| 0.1 | 2.7 | GO:0000060 | protein import into nucleus, translocation(GO:0000060) |
| 0.1 | 0.8 | GO:1900028 | negative regulation of ruffle assembly(GO:1900028) |
| 0.1 | 2.6 | GO:0032456 | endocytic recycling(GO:0032456) |
| 0.1 | 0.3 | GO:0046521 | sphingoid catabolic process(GO:0046521) |
| 0.1 | 0.8 | GO:0010642 | negative regulation of platelet-derived growth factor receptor signaling pathway(GO:0010642) |
| 0.1 | 1.2 | GO:0043981 | histone H4-K5 acetylation(GO:0043981) histone H4-K8 acetylation(GO:0043982) |
| 0.1 | 0.3 | GO:0090527 | actin filament reorganization(GO:0090527) |
| 0.1 | 1.9 | GO:0035338 | long-chain fatty-acyl-CoA biosynthetic process(GO:0035338) |
| 0.1 | 0.7 | GO:0045959 | regulation of complement activation, classical pathway(GO:0030450) negative regulation of complement activation, classical pathway(GO:0045959) regulation of opsonization(GO:1903027) |
| 0.1 | 1.0 | GO:0006020 | inositol metabolic process(GO:0006020) |
| 0.1 | 1.8 | GO:0010972 | negative regulation of G2/M transition of mitotic cell cycle(GO:0010972) |
| 0.1 | 1.8 | GO:0032008 | positive regulation of TOR signaling(GO:0032008) |
| 0.1 | 3.9 | GO:0030183 | B cell differentiation(GO:0030183) |
| 0.1 | 4.7 | GO:0031338 | regulation of vesicle fusion(GO:0031338) |
| 0.1 | 1.6 | GO:0048753 | melanosome organization(GO:0032438) pigment granule organization(GO:0048753) |
| 0.1 | 1.0 | GO:0070050 | neuron cellular homeostasis(GO:0070050) |
| 0.1 | 2.1 | GO:0042462 | eye photoreceptor cell development(GO:0042462) |
| 0.1 | 1.6 | GO:0045672 | positive regulation of osteoclast differentiation(GO:0045672) |
| 0.1 | 5.1 | GO:0018022 | peptidyl-lysine methylation(GO:0018022) |
| 0.1 | 2.5 | GO:0050853 | B cell receptor signaling pathway(GO:0050853) |
| 0.1 | 1.2 | GO:0000462 | maturation of SSU-rRNA from tricistronic rRNA transcript (SSU-rRNA, 5.8S rRNA, LSU-rRNA)(GO:0000462) |
| 0.1 | 4.5 | GO:0007286 | spermatid development(GO:0007286) |
| 0.1 | 1.4 | GO:0043171 | peptide catabolic process(GO:0043171) |
| 0.1 | 0.6 | GO:0007168 | receptor guanylyl cyclase signaling pathway(GO:0007168) |
| 0.1 | 0.4 | GO:0018212 | peptidyl-tyrosine phosphorylation(GO:0018108) peptidyl-tyrosine modification(GO:0018212) |
| 0.1 | 0.2 | GO:0033327 | Leydig cell differentiation(GO:0033327) |
| 0.1 | 0.2 | GO:0008298 | intracellular mRNA localization(GO:0008298) |
| 0.1 | 1.4 | GO:0006625 | protein targeting to peroxisome(GO:0006625) protein localization to peroxisome(GO:0072662) establishment of protein localization to peroxisome(GO:0072663) |
| 0.1 | 0.8 | GO:0016578 | histone deubiquitination(GO:0016578) |
| 0.1 | 0.3 | GO:0072310 | glomerular visceral epithelial cell development(GO:0072015) glomerular epithelial cell development(GO:0072310) |
| 0.1 | 0.6 | GO:0031115 | negative regulation of microtubule polymerization(GO:0031115) |
| 0.1 | 1.5 | GO:0006368 | transcription elongation from RNA polymerase II promoter(GO:0006368) |
| 0.1 | 1.0 | GO:1902036 | regulation of hematopoietic stem cell differentiation(GO:1902036) |
| 0.1 | 0.6 | GO:0020027 | hemoglobin metabolic process(GO:0020027) |
| 0.0 | 3.7 | GO:0002223 | stimulatory C-type lectin receptor signaling pathway(GO:0002223) |
| 0.0 | 0.7 | GO:0016024 | CDP-diacylglycerol biosynthetic process(GO:0016024) |
| 0.0 | 1.1 | GO:0032480 | negative regulation of type I interferon production(GO:0032480) |
| 0.0 | 0.4 | GO:0035583 | sequestering of TGFbeta in extracellular matrix(GO:0035583) |
| 0.0 | 0.3 | GO:0034214 | protein hexamerization(GO:0034214) |
| 0.0 | 0.3 | GO:0071425 | hematopoietic stem cell proliferation(GO:0071425) |
| 0.0 | 0.7 | GO:0043011 | myeloid dendritic cell differentiation(GO:0043011) |
| 0.0 | 3.3 | GO:0050852 | T cell receptor signaling pathway(GO:0050852) |
| 0.0 | 2.4 | GO:0038128 | ERBB2 signaling pathway(GO:0038128) |
| 0.0 | 1.1 | GO:0021904 | dorsal/ventral neural tube patterning(GO:0021904) |
| 0.0 | 0.4 | GO:0030225 | macrophage differentiation(GO:0030225) |
| 0.0 | 1.7 | GO:0071349 | interleukin-12-mediated signaling pathway(GO:0035722) response to interleukin-12(GO:0070671) cellular response to interleukin-12(GO:0071349) |
| 0.0 | 0.6 | GO:0071625 | vocalization behavior(GO:0071625) |
| 0.0 | 0.3 | GO:0007207 | phospholipase C-activating G-protein coupled acetylcholine receptor signaling pathway(GO:0007207) |
| 0.0 | 2.2 | GO:0072332 | intrinsic apoptotic signaling pathway by p53 class mediator(GO:0072332) |
| 0.0 | 0.6 | GO:0001682 | tRNA 5'-leader removal(GO:0001682) |
| 0.0 | 0.4 | GO:0015671 | gas transport(GO:0015669) oxygen transport(GO:0015671) |
| 0.0 | 0.3 | GO:0001514 | selenocysteine incorporation(GO:0001514) translational readthrough(GO:0006451) |
| 0.0 | 0.7 | GO:0008286 | insulin receptor signaling pathway(GO:0008286) |
| 0.0 | 1.4 | GO:0006487 | protein N-linked glycosylation(GO:0006487) |
| 0.0 | 0.8 | GO:0008380 | RNA splicing(GO:0008380) |
| 0.0 | 0.4 | GO:0070327 | thyroid hormone transport(GO:0070327) |
| 0.0 | 0.9 | GO:0016266 | O-glycan processing(GO:0016266) |
| 0.0 | 0.1 | GO:0000076 | DNA replication checkpoint(GO:0000076) |
| 0.0 | 0.1 | GO:0046108 | uridine catabolic process(GO:0006218) uridine metabolic process(GO:0046108) |
| 0.0 | 0.5 | GO:1902857 | positive regulation of nonmotile primary cilium assembly(GO:1902857) |
| 0.0 | 0.8 | GO:0002260 | lymphocyte homeostasis(GO:0002260) |
| 0.0 | 0.4 | GO:2001238 | positive regulation of extrinsic apoptotic signaling pathway(GO:2001238) |
| 0.0 | 0.3 | GO:0000737 | DNA catabolic process, endonucleolytic(GO:0000737) apoptotic DNA fragmentation(GO:0006309) |
| 0.0 | 0.6 | GO:0061003 | positive regulation of dendritic spine morphogenesis(GO:0061003) |
| 0.0 | 0.1 | GO:0055129 | proline biosynthetic process(GO:0006561) L-proline biosynthetic process(GO:0055129) |
| 0.0 | 0.1 | GO:0022417 | protein maturation by protein folding(GO:0022417) |
| 0.0 | 0.1 | GO:2000253 | positive regulation of feeding behavior(GO:2000253) |
| 0.0 | 0.4 | GO:0018345 | protein palmitoylation(GO:0018345) |
| 0.0 | 4.1 | GO:0007050 | cell cycle arrest(GO:0007050) |
| 0.0 | 2.1 | GO:0046546 | male gonad development(GO:0008584) development of primary male sexual characteristics(GO:0046546) |
| 0.0 | 0.2 | GO:0071391 | cellular response to estrogen stimulus(GO:0071391) |
| 0.0 | 0.2 | GO:0021516 | dorsal spinal cord development(GO:0021516) |
| 0.0 | 0.1 | GO:2000210 | positive regulation of anoikis(GO:2000210) |
| 0.0 | 1.0 | GO:0030218 | erythrocyte differentiation(GO:0030218) |
| 0.0 | 0.3 | GO:0006516 | glycoprotein catabolic process(GO:0006516) |
| 0.0 | 0.3 | GO:0006488 | dolichol-linked oligosaccharide biosynthetic process(GO:0006488) |
| 0.0 | 0.1 | GO:0006196 | AMP catabolic process(GO:0006196) |
| 0.0 | 4.3 | GO:0007283 | spermatogenesis(GO:0007283) male gamete generation(GO:0048232) |
| 0.0 | 1.1 | GO:0038095 | Fc-epsilon receptor signaling pathway(GO:0038095) |
| 0.0 | 0.7 | GO:0046324 | regulation of glucose import(GO:0046324) |
| 0.0 | 0.3 | GO:0006414 | translational elongation(GO:0006414) |
| 0.0 | 1.7 | GO:0000209 | protein polyubiquitination(GO:0000209) |
Gene overrepresentation in cellular_component category:
| Log-likelihood per target | Total log-likelihood | Term | Description |
|---|---|---|---|
| 5.0 | 14.9 | GO:0030289 | protein phosphatase 4 complex(GO:0030289) |
| 4.2 | 46.0 | GO:0042105 | alpha-beta T cell receptor complex(GO:0042105) |
| 3.4 | 20.2 | GO:0034687 | integrin alphaL-beta2 complex(GO:0034687) |
| 3.3 | 9.8 | GO:1990876 | cytoplasmic side of nuclear pore(GO:1990876) |
| 2.7 | 35.7 | GO:0000243 | commitment complex(GO:0000243) |
| 2.5 | 12.6 | GO:0034715 | pICln-Sm protein complex(GO:0034715) |
| 2.4 | 4.9 | GO:0002081 | outer acrosomal membrane(GO:0002081) |
| 2.3 | 11.7 | GO:0032021 | NELF complex(GO:0032021) |
| 2.3 | 28.1 | GO:0008250 | oligosaccharyltransferase complex(GO:0008250) |
| 2.0 | 22.2 | GO:0005687 | U4 snRNP(GO:0005687) |
| 2.0 | 5.9 | GO:0036195 | muscle cell projection(GO:0036194) muscle cell projection membrane(GO:0036195) |
| 1.9 | 13.1 | GO:0072669 | tRNA-splicing ligase complex(GO:0072669) |
| 1.9 | 22.2 | GO:0019773 | proteasome core complex, alpha-subunit complex(GO:0019773) |
| 1.8 | 12.3 | GO:0000813 | ESCRT I complex(GO:0000813) |
| 1.7 | 22.3 | GO:0042555 | MCM complex(GO:0042555) |
| 1.7 | 5.0 | GO:0002079 | inner acrosomal membrane(GO:0002079) |
| 1.7 | 11.6 | GO:1990589 | ATF4-CREB1 transcription factor complex(GO:1990589) |
| 1.6 | 6.3 | GO:1990745 | EARP complex(GO:1990745) |
| 1.6 | 12.4 | GO:0034719 | SMN-Sm protein complex(GO:0034719) Gemini of coiled bodies(GO:0097504) |
| 1.5 | 19.8 | GO:0002199 | zona pellucida receptor complex(GO:0002199) |
| 1.5 | 7.4 | GO:1990037 | Lewy body core(GO:1990037) |
| 1.4 | 26.0 | GO:0000276 | mitochondrial proton-transporting ATP synthase complex, coupling factor F(o)(GO:0000276) |
| 1.4 | 5.7 | GO:0034669 | integrin alpha4-beta7 complex(GO:0034669) |
| 1.4 | 15.4 | GO:0070531 | BRCA1-A complex(GO:0070531) |
| 1.4 | 28.9 | GO:0031229 | integral component of nuclear inner membrane(GO:0005639) intrinsic component of nuclear inner membrane(GO:0031229) nuclear membrane part(GO:0044453) |
| 1.4 | 21.9 | GO:0097431 | mitotic spindle pole(GO:0097431) |
| 1.4 | 4.1 | GO:0030981 | cortical microtubule cytoskeleton(GO:0030981) |
| 1.3 | 6.7 | GO:0046696 | lipopolysaccharide receptor complex(GO:0046696) |
| 1.3 | 18.4 | GO:0031209 | SCAR complex(GO:0031209) |
| 1.3 | 6.4 | GO:0009368 | endopeptidase Clp complex(GO:0009368) |
| 1.3 | 5.0 | GO:0055087 | Ski complex(GO:0055087) |
| 1.3 | 37.5 | GO:0005665 | DNA-directed RNA polymerase II, core complex(GO:0005665) |
| 1.2 | 6.0 | GO:0034388 | Pwp2p-containing subcomplex of 90S preribosome(GO:0034388) |
| 1.2 | 8.1 | GO:0000127 | transcription factor TFIIIC complex(GO:0000127) |
| 1.1 | 7.9 | GO:0036021 | endolysosome lumen(GO:0036021) |
| 1.1 | 8.5 | GO:0097539 | ciliary transition fiber(GO:0097539) |
| 1.1 | 38.9 | GO:0042629 | mast cell granule(GO:0042629) |
| 1.0 | 5.2 | GO:0071008 | U2-type post-mRNA release spliceosomal complex(GO:0071008) |
| 1.0 | 7.2 | GO:0070522 | ERCC4-ERCC1 complex(GO:0070522) |
| 1.0 | 5.1 | GO:0044530 | supraspliceosomal complex(GO:0044530) |
| 1.0 | 20.7 | GO:0017101 | aminoacyl-tRNA synthetase multienzyme complex(GO:0017101) |
| 0.9 | 8.4 | GO:0071541 | eukaryotic translation initiation factor 3 complex, eIF3m(GO:0071541) |
| 0.9 | 20.9 | GO:0031254 | uropod(GO:0001931) cell trailing edge(GO:0031254) |
| 0.9 | 65.9 | GO:0022627 | cytosolic small ribosomal subunit(GO:0022627) |
| 0.9 | 12.1 | GO:0005753 | mitochondrial proton-transporting ATP synthase complex(GO:0005753) |
| 0.9 | 7.8 | GO:0061574 | ASAP complex(GO:0061574) |
| 0.9 | 13.7 | GO:0031080 | nuclear pore outer ring(GO:0031080) |
| 0.8 | 5.8 | GO:0032133 | chromosome passenger complex(GO:0032133) |
| 0.8 | 5.7 | GO:0035692 | macrophage migration inhibitory factor receptor complex(GO:0035692) |
| 0.8 | 9.5 | GO:0072559 | NLRP3 inflammasome complex(GO:0072559) |
| 0.8 | 14.9 | GO:1990124 | messenger ribonucleoprotein complex(GO:1990124) |
| 0.8 | 6.2 | GO:0016593 | Cdc73/Paf1 complex(GO:0016593) |
| 0.8 | 8.5 | GO:0000176 | nuclear exosome (RNase complex)(GO:0000176) |
| 0.7 | 9.0 | GO:0005751 | mitochondrial respiratory chain complex IV(GO:0005751) |
| 0.7 | 4.5 | GO:0072589 | box H/ACA snoRNP complex(GO:0031429) box H/ACA RNP complex(GO:0072588) box H/ACA scaRNP complex(GO:0072589) box H/ACA telomerase RNP complex(GO:0090661) |
| 0.7 | 0.7 | GO:0033180 | proton-transporting V-type ATPase, V1 domain(GO:0033180) |
| 0.7 | 9.9 | GO:0005852 | eukaryotic translation initiation factor 3 complex(GO:0005852) |
| 0.7 | 5.5 | GO:0070761 | pre-snoRNP complex(GO:0070761) |
| 0.7 | 7.5 | GO:0045275 | mitochondrial respiratory chain complex III(GO:0005750) respiratory chain complex III(GO:0045275) |
| 0.7 | 13.7 | GO:0005839 | proteasome core complex(GO:0005839) |
| 0.6 | 3.2 | GO:0005658 | alpha DNA polymerase:primase complex(GO:0005658) |
| 0.6 | 19.3 | GO:0005838 | proteasome regulatory particle(GO:0005838) |
| 0.6 | 63.4 | GO:0022625 | cytosolic large ribosomal subunit(GO:0022625) |
| 0.6 | 1.7 | GO:0033150 | perinuclear theca(GO:0033011) cytoskeletal calyx(GO:0033150) |
| 0.6 | 2.9 | GO:1990726 | Lsm1-7-Pat1 complex(GO:1990726) |
| 0.6 | 17.1 | GO:0005680 | anaphase-promoting complex(GO:0005680) |
| 0.6 | 3.4 | GO:0070545 | PeBoW complex(GO:0070545) |
| 0.5 | 13.0 | GO:0035371 | microtubule plus-end(GO:0035371) |
| 0.5 | 1.6 | GO:0000939 | condensed chromosome inner kinetochore(GO:0000939) |
| 0.5 | 1.6 | GO:0034991 | nuclear meiotic cohesin complex(GO:0034991) |
| 0.5 | 6.8 | GO:0016461 | unconventional myosin complex(GO:0016461) |
| 0.5 | 4.0 | GO:0005851 | eukaryotic translation initiation factor 2B complex(GO:0005851) |
| 0.5 | 2.4 | GO:0008275 | gamma-tubulin small complex(GO:0008275) |
| 0.5 | 2.4 | GO:1905202 | 3-methylcrotonyl-CoA carboxylase complex, mitochondrial(GO:0002169) methylcrotonoyl-CoA carboxylase complex(GO:1905202) |
| 0.5 | 1.9 | GO:0044611 | nuclear pore inner ring(GO:0044611) |
| 0.5 | 5.7 | GO:0005689 | U12-type spliceosomal complex(GO:0005689) |
| 0.5 | 3.3 | GO:0005663 | DNA replication factor C complex(GO:0005663) |
| 0.5 | 18.8 | GO:0005762 | organellar large ribosomal subunit(GO:0000315) mitochondrial large ribosomal subunit(GO:0005762) |
| 0.5 | 2.3 | GO:0008622 | epsilon DNA polymerase complex(GO:0008622) |
| 0.5 | 1.8 | GO:0061700 | GATOR2 complex(GO:0061700) |
| 0.4 | 2.2 | GO:0030061 | mitochondrial crista(GO:0030061) |
| 0.4 | 3.4 | GO:0005672 | transcription factor TFIIA complex(GO:0005672) |
| 0.4 | 7.7 | GO:0001891 | phagocytic cup(GO:0001891) |
| 0.4 | 13.2 | GO:0005719 | nuclear euchromatin(GO:0005719) |
| 0.4 | 9.5 | GO:0005721 | pericentric heterochromatin(GO:0005721) |
| 0.4 | 2.4 | GO:0032311 | angiogenin-PRI complex(GO:0032311) |
| 0.4 | 4.7 | GO:0033093 | Weibel-Palade body(GO:0033093) |
| 0.4 | 6.7 | GO:0046540 | U4/U6 x U5 tri-snRNP complex(GO:0046540) |
| 0.4 | 3.3 | GO:0072546 | ER membrane protein complex(GO:0072546) |
| 0.4 | 1.9 | GO:0000408 | EKC/KEOPS complex(GO:0000408) |
| 0.4 | 2.5 | GO:0042788 | polysomal ribosome(GO:0042788) |
| 0.3 | 1.0 | GO:0033185 | dolichol-phosphate-mannose synthase complex(GO:0033185) |
| 0.3 | 3.7 | GO:0070765 | gamma-secretase complex(GO:0070765) |
| 0.3 | 8.7 | GO:0016514 | SWI/SNF complex(GO:0016514) |
| 0.3 | 6.0 | GO:0031083 | BLOC-1 complex(GO:0031083) |
| 0.3 | 7.3 | GO:0000145 | exocyst(GO:0000145) |
| 0.3 | 5.6 | GO:0000164 | protein phosphatase type 1 complex(GO:0000164) |
| 0.3 | 2.2 | GO:0000172 | ribonuclease MRP complex(GO:0000172) |
| 0.3 | 2.8 | GO:0005833 | hemoglobin complex(GO:0005833) |
| 0.3 | 2.1 | GO:0005787 | signal peptidase complex(GO:0005787) |
| 0.3 | 6.5 | GO:0034045 | pre-autophagosomal structure membrane(GO:0034045) |
| 0.3 | 3.7 | GO:0001673 | male germ cell nucleus(GO:0001673) |
| 0.3 | 1.4 | GO:0042272 | nuclear RNA export factor complex(GO:0042272) |
| 0.3 | 4.1 | GO:0016281 | eukaryotic translation initiation factor 4F complex(GO:0016281) |
| 0.3 | 3.0 | GO:0035686 | sperm fibrous sheath(GO:0035686) |
| 0.3 | 2.1 | GO:0032010 | phagolysosome(GO:0032010) |
| 0.3 | 3.4 | GO:0044754 | autolysosome(GO:0044754) |
| 0.3 | 1.0 | GO:0000811 | GINS complex(GO:0000811) |
| 0.2 | 2.7 | GO:0034098 | VCP-NPL4-UFD1 AAA ATPase complex(GO:0034098) |
| 0.2 | 4.5 | GO:0002080 | acrosomal membrane(GO:0002080) |
| 0.2 | 5.1 | GO:0030122 | AP-2 adaptor complex(GO:0030122) |
| 0.2 | 23.2 | GO:0035578 | azurophil granule lumen(GO:0035578) |
| 0.2 | 14.6 | GO:0045271 | mitochondrial respiratory chain complex I(GO:0005747) NADH dehydrogenase complex(GO:0030964) respiratory chain complex I(GO:0045271) |
| 0.2 | 15.0 | GO:0000777 | condensed chromosome kinetochore(GO:0000777) |
| 0.2 | 13.6 | GO:0000307 | cyclin-dependent protein kinase holoenzyme complex(GO:0000307) |
| 0.2 | 2.6 | GO:0005642 | annulate lamellae(GO:0005642) |
| 0.2 | 16.1 | GO:0005758 | mitochondrial intermembrane space(GO:0005758) |
| 0.2 | 12.5 | GO:0031463 | Cul3-RING ubiquitin ligase complex(GO:0031463) |
| 0.2 | 5.2 | GO:0005761 | organellar ribosome(GO:0000313) mitochondrial ribosome(GO:0005761) |
| 0.2 | 4.0 | GO:0097228 | sperm principal piece(GO:0097228) |
| 0.2 | 20.1 | GO:0070821 | tertiary granule membrane(GO:0070821) |
| 0.2 | 2.0 | GO:0005664 | origin recognition complex(GO:0000808) nuclear origin of replication recognition complex(GO:0005664) |
| 0.2 | 25.3 | GO:0000922 | spindle pole(GO:0000922) |
| 0.2 | 31.1 | GO:0005681 | spliceosomal complex(GO:0005681) |
| 0.2 | 3.3 | GO:0030904 | retromer complex(GO:0030904) |
| 0.2 | 1.3 | GO:0072687 | meiotic spindle(GO:0072687) |
| 0.2 | 4.6 | GO:0005876 | spindle microtubule(GO:0005876) |
| 0.2 | 3.5 | GO:0042613 | MHC class II protein complex(GO:0042613) |
| 0.2 | 9.1 | GO:0035579 | specific granule membrane(GO:0035579) |
| 0.2 | 5.5 | GO:0005669 | transcription factor TFIID complex(GO:0005669) |
| 0.2 | 19.7 | GO:0016605 | PML body(GO:0016605) |
| 0.2 | 3.8 | GO:0030687 | preribosome, large subunit precursor(GO:0030687) |
| 0.2 | 1.7 | GO:0030008 | TRAPP complex(GO:0030008) |
| 0.2 | 0.6 | GO:0031941 | filamentous actin(GO:0031941) |
| 0.1 | 1.9 | GO:0000407 | pre-autophagosomal structure(GO:0000407) |
| 0.1 | 3.3 | GO:0031231 | integral component of peroxisomal membrane(GO:0005779) intrinsic component of peroxisomal membrane(GO:0031231) |
| 0.1 | 4.3 | GO:0005921 | gap junction(GO:0005921) |
| 0.1 | 0.6 | GO:0097513 | myosin II filament(GO:0097513) |
| 0.1 | 2.7 | GO:0005697 | telomerase holoenzyme complex(GO:0005697) |
| 0.1 | 1.2 | GO:0032039 | integrator complex(GO:0032039) |
| 0.1 | 0.9 | GO:0097550 | transcriptional preinitiation complex(GO:0097550) |
| 0.1 | 10.3 | GO:0005905 | clathrin-coated pit(GO:0005905) |
| 0.1 | 5.6 | GO:0010494 | cytoplasmic stress granule(GO:0010494) |
| 0.1 | 0.8 | GO:0070652 | HAUS complex(GO:0070652) |
| 0.1 | 0.4 | GO:1990578 | perinuclear endoplasmic reticulum membrane(GO:1990578) |
| 0.1 | 0.3 | GO:0036057 | filtration diaphragm(GO:0036056) slit diaphragm(GO:0036057) |
| 0.1 | 3.8 | GO:0045171 | intercellular bridge(GO:0045171) |
| 0.1 | 2.8 | GO:0097381 | photoreceptor disc membrane(GO:0097381) |
| 0.1 | 2.9 | GO:0000159 | protein phosphatase type 2A complex(GO:0000159) |
| 0.1 | 3.7 | GO:0098636 | protein complex involved in cell adhesion(GO:0098636) |
| 0.1 | 4.2 | GO:0042645 | nucleoid(GO:0009295) mitochondrial nucleoid(GO:0042645) |
| 0.1 | 2.3 | GO:0046930 | pore complex(GO:0046930) |
| 0.1 | 4.7 | GO:0042571 | immunoglobulin complex, circulating(GO:0042571) |
| 0.1 | 3.0 | GO:0012507 | ER to Golgi transport vesicle membrane(GO:0012507) |
| 0.1 | 3.0 | GO:0005859 | muscle myosin complex(GO:0005859) |
| 0.1 | 6.0 | GO:0043197 | dendritic spine(GO:0043197) neuron spine(GO:0044309) |
| 0.1 | 0.2 | GO:0000799 | nuclear condensin complex(GO:0000799) |
| 0.1 | 2.3 | GO:0035267 | NuA4 histone acetyltransferase complex(GO:0035267) H4/H2A histone acetyltransferase complex(GO:0043189) H4 histone acetyltransferase complex(GO:1902562) |
| 0.1 | 11.6 | GO:0101002 | ficolin-1-rich granule(GO:0101002) ficolin-1-rich granule lumen(GO:1904813) |
| 0.1 | 1.3 | GO:0031092 | platelet alpha granule membrane(GO:0031092) |
| 0.1 | 4.7 | GO:0014704 | intercalated disc(GO:0014704) |
| 0.1 | 0.3 | GO:0043541 | UDP-N-acetylglucosamine transferase complex(GO:0043541) |
| 0.1 | 1.2 | GO:0030127 | COPII vesicle coat(GO:0030127) |
| 0.1 | 2.9 | GO:0035577 | azurophil granule membrane(GO:0035577) |
| 0.1 | 9.1 | GO:0005923 | bicellular tight junction(GO:0005923) |
| 0.1 | 2.9 | GO:0000786 | nucleosome(GO:0000786) |
| 0.1 | 2.4 | GO:0043657 | host(GO:0018995) host cell(GO:0043657) |
| 0.1 | 3.2 | GO:0033116 | endoplasmic reticulum-Golgi intermediate compartment membrane(GO:0033116) |
| 0.1 | 3.3 | GO:0032154 | cleavage furrow(GO:0032154) cell surface furrow(GO:0097610) |
| 0.1 | 10.3 | GO:0005741 | mitochondrial outer membrane(GO:0005741) |
| 0.1 | 19.2 | GO:0045121 | membrane raft(GO:0045121) membrane microdomain(GO:0098857) |
| 0.1 | 0.4 | GO:0043240 | Fanconi anaemia nuclear complex(GO:0043240) |
| 0.1 | 2.3 | GO:0030315 | T-tubule(GO:0030315) |
| 0.1 | 7.6 | GO:0044798 | nuclear transcription factor complex(GO:0044798) |
| 0.1 | 1.9 | GO:0005840 | ribosome(GO:0005840) |
| 0.1 | 9.5 | GO:0009897 | external side of plasma membrane(GO:0009897) |
| 0.1 | 7.1 | GO:0031225 | anchored component of membrane(GO:0031225) |
| 0.1 | 0.5 | GO:0043020 | NADPH oxidase complex(GO:0043020) |
| 0.0 | 3.4 | GO:0005913 | cell-cell adherens junction(GO:0005913) |
| 0.0 | 3.9 | GO:0030176 | integral component of endoplasmic reticulum membrane(GO:0030176) |
| 0.0 | 1.3 | GO:0015030 | Cajal body(GO:0015030) |
| 0.0 | 0.5 | GO:0031105 | septin complex(GO:0031105) |
| 0.0 | 1.9 | GO:0031519 | PcG protein complex(GO:0031519) |
| 0.0 | 1.8 | GO:0001750 | photoreceptor outer segment(GO:0001750) |
| 0.0 | 1.1 | GO:0000151 | ubiquitin ligase complex(GO:0000151) |
| 0.0 | 5.7 | GO:0016323 | basolateral plasma membrane(GO:0016323) |
| 0.0 | 0.2 | GO:0005638 | lamin filament(GO:0005638) |
| 0.0 | 1.1 | GO:0000794 | condensed nuclear chromosome(GO:0000794) |
| 0.0 | 0.3 | GO:0000815 | ESCRT III complex(GO:0000815) |
| 0.0 | 1.0 | GO:0005643 | nuclear pore(GO:0005643) |
| 0.0 | 2.2 | GO:0030667 | secretory granule membrane(GO:0030667) |
| 0.0 | 1.2 | GO:0000123 | histone acetyltransferase complex(GO:0000123) |
| 0.0 | 0.4 | GO:0031235 | intrinsic component of the cytoplasmic side of the plasma membrane(GO:0031235) |
| 0.0 | 0.2 | GO:0000177 | cytoplasmic exosome (RNase complex)(GO:0000177) |
| 0.0 | 0.4 | GO:0001772 | immunological synapse(GO:0001772) |
| 0.0 | 0.3 | GO:0044322 | endoplasmic reticulum quality control compartment(GO:0044322) |
| 0.0 | 1.0 | GO:0005793 | endoplasmic reticulum-Golgi intermediate compartment(GO:0005793) |
| 0.0 | 0.1 | GO:0031298 | replication fork protection complex(GO:0031298) |
| 0.0 | 1.2 | GO:0017053 | transcriptional repressor complex(GO:0017053) |
| 0.0 | 1.2 | GO:0005903 | brush border(GO:0005903) |
| 0.0 | 4.2 | GO:0005635 | nuclear envelope(GO:0005635) |
| 0.0 | 0.5 | GO:0055038 | recycling endosome membrane(GO:0055038) |
| 0.0 | 0.5 | GO:0015629 | actin cytoskeleton(GO:0015629) |
Gene overrepresentation in molecular_function category:
| Log-likelihood per target | Total log-likelihood | Term | Description |
|---|---|---|---|
| 5.7 | 34.3 | GO:0047685 | amine sulfotransferase activity(GO:0047685) |
| 5.2 | 15.6 | GO:0016314 | phosphatidylinositol-3,4,5-trisphosphate 3-phosphatase activity(GO:0016314) |
| 4.9 | 9.8 | GO:0004832 | valine-tRNA ligase activity(GO:0004832) |
| 4.3 | 13.0 | GO:0004819 | glutamine-tRNA ligase activity(GO:0004819) |
| 3.4 | 10.3 | GO:0004913 | interleukin-4 receptor activity(GO:0004913) interleukin-7 receptor activity(GO:0004917) |
| 3.0 | 9.0 | GO:0000995 | transcription factor activity, core RNA polymerase III binding(GO:0000995) |
| 2.9 | 20.2 | GO:0030369 | ICAM-3 receptor activity(GO:0030369) |
| 2.8 | 28.1 | GO:0004579 | dolichyl-diphosphooligosaccharide-protein glycotransferase activity(GO:0004579) |
| 2.7 | 45.8 | GO:0004062 | aryl sulfotransferase activity(GO:0004062) |
| 2.7 | 21.3 | GO:0071933 | Arp2/3 complex binding(GO:0071933) |
| 2.6 | 28.9 | GO:0004931 | extracellular ATP-gated cation channel activity(GO:0004931) ATP-gated ion channel activity(GO:0035381) |
| 2.5 | 17.5 | GO:0030621 | U4 snRNA binding(GO:0030621) |
| 2.5 | 17.4 | GO:0017077 | oxidative phosphorylation uncoupler activity(GO:0017077) |
| 2.5 | 9.8 | GO:0004365 | glyceraldehyde-3-phosphate dehydrogenase (NAD+) (phosphorylating) activity(GO:0004365) glyceraldehyde-3-phosphate dehydrogenase (NAD(P)+) (phosphorylating) activity(GO:0043891) |
| 2.4 | 7.1 | GO:0017057 | 6-phosphogluconolactonase activity(GO:0017057) |
| 2.2 | 8.9 | GO:0016936 | galactoside binding(GO:0016936) |
| 2.2 | 6.6 | GO:0003953 | NAD+ nucleosidase activity(GO:0003953) NAD(P)+ nucleosidase activity(GO:0050135) |
| 2.1 | 14.9 | GO:0004704 | NF-kappaB-inducing kinase activity(GO:0004704) |
| 2.1 | 21.3 | GO:1990446 | U1 snRNP binding(GO:1990446) |
| 2.1 | 6.4 | GO:0030272 | 5-formyltetrahydrofolate cyclo-ligase activity(GO:0030272) |
| 2.1 | 8.4 | GO:0034988 | Fc-gamma receptor I complex binding(GO:0034988) |
| 2.1 | 6.2 | GO:0004514 | nicotinate-nucleotide diphosphorylase (carboxylating) activity(GO:0004514) |
| 2.0 | 7.8 | GO:0051916 | granulocyte colony-stimulating factor binding(GO:0051916) |
| 1.9 | 15.5 | GO:0004396 | glucokinase activity(GO:0004340) hexokinase activity(GO:0004396) fructokinase activity(GO:0008865) mannokinase activity(GO:0019158) |
| 1.9 | 5.7 | GO:0004766 | spermidine synthase activity(GO:0004766) |
| 1.9 | 13.3 | GO:0005353 | fructose transmembrane transporter activity(GO:0005353) |
| 1.9 | 5.7 | GO:0016434 | rRNA (cytosine) methyltransferase activity(GO:0016434) |
| 1.9 | 5.6 | GO:0017130 | poly(C) RNA binding(GO:0017130) |
| 1.7 | 5.2 | GO:0001884 | pyrimidine nucleoside binding(GO:0001884) UTP binding(GO:0002134) pyrimidine ribonucleoside binding(GO:0032551) |
| 1.7 | 17.4 | GO:0055104 | ligase inhibitor activity(GO:0055104) ubiquitin ligase inhibitor activity(GO:1990948) |
| 1.7 | 5.2 | GO:0016019 | peptidoglycan receptor activity(GO:0016019) |
| 1.7 | 5.2 | GO:0003835 | beta-galactoside alpha-2,6-sialyltransferase activity(GO:0003835) |
| 1.7 | 5.2 | GO:0004853 | uroporphyrinogen decarboxylase activity(GO:0004853) |
| 1.7 | 5.0 | GO:0004611 | phosphoenolpyruvate carboxykinase activity(GO:0004611) phosphoenolpyruvate carboxykinase (GTP) activity(GO:0004613) |
| 1.5 | 17.0 | GO:0015174 | basic amino acid transmembrane transporter activity(GO:0015174) |
| 1.5 | 21.4 | GO:0055056 | D-glucose transmembrane transporter activity(GO:0055056) |
| 1.5 | 31.9 | GO:0001055 | RNA polymerase II activity(GO:0001055) |
| 1.5 | 10.5 | GO:0004457 | lactate dehydrogenase activity(GO:0004457) L-lactate dehydrogenase activity(GO:0004459) |
| 1.5 | 14.9 | GO:0019237 | centromeric DNA binding(GO:0019237) |
| 1.5 | 5.8 | GO:0003726 | double-stranded RNA adenosine deaminase activity(GO:0003726) |
| 1.4 | 11.6 | GO:1990763 | arrestin family protein binding(GO:1990763) |
| 1.4 | 5.6 | GO:0004594 | pantothenate kinase activity(GO:0004594) |
| 1.3 | 10.8 | GO:0016842 | amidine-lyase activity(GO:0016842) |
| 1.3 | 3.8 | GO:0008195 | phosphatidate phosphatase activity(GO:0008195) |
| 1.2 | 19.9 | GO:0008494 | translation activator activity(GO:0008494) |
| 1.2 | 12.9 | GO:0051525 | NFAT protein binding(GO:0051525) |
| 1.1 | 17.0 | GO:0035612 | AP-2 adaptor complex binding(GO:0035612) |
| 1.1 | 10.2 | GO:0032190 | acrosin binding(GO:0032190) |
| 1.1 | 9.0 | GO:1990932 | 5.8S rRNA binding(GO:1990932) |
| 1.1 | 3.4 | GO:0042134 | rRNA primary transcript binding(GO:0042134) |
| 1.1 | 7.5 | GO:0016681 | ubiquinol-cytochrome-c reductase activity(GO:0008121) oxidoreductase activity, acting on diphenols and related substances as donors, cytochrome as acceptor(GO:0016681) |
| 1.0 | 7.2 | GO:1990599 | 3' overhang single-stranded DNA endodeoxyribonuclease activity(GO:1990599) |
| 1.0 | 3.0 | GO:0004802 | transketolase activity(GO:0004802) |
| 1.0 | 10.8 | GO:0005049 | nuclear export signal receptor activity(GO:0005049) |
| 0.9 | 7.5 | GO:0019763 | immunoglobulin receptor activity(GO:0019763) |
| 0.9 | 25.3 | GO:0046933 | proton-transporting ATP synthase activity, rotational mechanism(GO:0046933) |
| 0.9 | 18.5 | GO:0050786 | RAGE receptor binding(GO:0050786) |
| 0.9 | 7.4 | GO:0004563 | beta-N-acetylhexosaminidase activity(GO:0004563) |
| 0.9 | 7.4 | GO:1901612 | cardiolipin binding(GO:1901612) |
| 0.9 | 5.5 | GO:0003886 | DNA (cytosine-5-)-methyltransferase activity(GO:0003886) |
| 0.9 | 27.1 | GO:0004298 | threonine-type endopeptidase activity(GO:0004298) threonine-type peptidase activity(GO:0070003) |
| 0.9 | 4.4 | GO:0001010 | transcription factor activity, sequence-specific DNA binding transcription factor recruiting(GO:0001010) |
| 0.9 | 14.8 | GO:0003688 | DNA replication origin binding(GO:0003688) |
| 0.9 | 6.0 | GO:0005087 | Ran guanyl-nucleotide exchange factor activity(GO:0005087) |
| 0.8 | 2.5 | GO:0004813 | alanine-tRNA ligase activity(GO:0004813) |
| 0.8 | 13.2 | GO:0070530 | K63-linked polyubiquitin binding(GO:0070530) |
| 0.8 | 45.6 | GO:0042169 | SH2 domain binding(GO:0042169) |
| 0.8 | 17.8 | GO:0008239 | dipeptidyl-peptidase activity(GO:0008239) |
| 0.8 | 6.3 | GO:0004865 | protein serine/threonine phosphatase inhibitor activity(GO:0004865) |
| 0.8 | 2.3 | GO:0080101 | phosphatidyl-N-methylethanolamine N-methyltransferase activity(GO:0000773) phosphatidylethanolamine N-methyltransferase activity(GO:0004608) phosphatidyl-N-dimethylethanolamine N-methyltransferase activity(GO:0080101) |
| 0.8 | 3.8 | GO:0017159 | pantetheine hydrolase activity(GO:0017159) |
| 0.7 | 3.7 | GO:0004161 | dimethylallyltranstransferase activity(GO:0004161) geranyltranstransferase activity(GO:0004337) |
| 0.7 | 2.2 | GO:0004817 | cysteine-tRNA ligase activity(GO:0004817) |
| 0.7 | 4.5 | GO:0034513 | box H/ACA snoRNA binding(GO:0034513) |
| 0.7 | 2.2 | GO:0004347 | glucose-6-phosphate isomerase activity(GO:0004347) |
| 0.7 | 5.8 | GO:0004176 | ATP-dependent peptidase activity(GO:0004176) |
| 0.7 | 4.4 | GO:0061649 | ubiquitinated histone binding(GO:0061649) |
| 0.7 | 30.5 | GO:0017069 | snRNA binding(GO:0017069) |
| 0.7 | 2.2 | GO:0080019 | fatty-acyl-CoA reductase (alcohol-forming) activity(GO:0080019) |
| 0.7 | 14.3 | GO:0070717 | poly-purine tract binding(GO:0070717) |
| 0.7 | 2.8 | GO:0016900 | oxidoreductase activity, acting on the CH-OH group of donors, disulfide as acceptor(GO:0016900) vitamin-K-epoxide reductase (warfarin-sensitive) activity(GO:0047057) |
| 0.7 | 2.7 | GO:0033981 | D-dopachrome decarboxylase activity(GO:0033981) |
| 0.7 | 2.1 | GO:0008798 | beta-aspartyl-peptidase activity(GO:0008798) |
| 0.7 | 6.0 | GO:0035174 | histone serine kinase activity(GO:0035174) |
| 0.6 | 5.2 | GO:0008097 | 5S rRNA binding(GO:0008097) |
| 0.6 | 3.9 | GO:0043183 | vascular endothelial growth factor receptor 1 binding(GO:0043183) |
| 0.6 | 2.6 | GO:0046404 | ATP-dependent polydeoxyribonucleotide 5'-hydroxyl-kinase activity(GO:0046404) polydeoxyribonucleotide kinase activity(GO:0051733) ATP-dependent polynucleotide kinase activity(GO:0051734) polynucleotide phosphatase activity(GO:0098518) |
| 0.6 | 2.6 | GO:0032558 | adenyl deoxyribonucleotide binding(GO:0032558) dATP binding(GO:0032564) |
| 0.6 | 28.3 | GO:0050699 | WW domain binding(GO:0050699) |
| 0.6 | 10.5 | GO:0055106 | ubiquitin-protein transferase regulator activity(GO:0055106) |
| 0.6 | 6.7 | GO:0004568 | chitinase activity(GO:0004568) chitin binding(GO:0008061) |
| 0.6 | 3.0 | GO:0030613 | oxidoreductase activity, acting on phosphorus or arsenic in donors(GO:0030613) oxidoreductase activity, acting on phosphorus or arsenic in donors, disulfide as acceptor(GO:0030614) |
| 0.6 | 12.7 | GO:0070628 | proteasome binding(GO:0070628) |
| 0.6 | 26.6 | GO:0031369 | translation initiation factor binding(GO:0031369) |
| 0.6 | 3.6 | GO:0004013 | adenosylhomocysteinase activity(GO:0004013) trialkylsulfonium hydrolase activity(GO:0016802) |
| 0.6 | 1.7 | GO:0004694 | eukaryotic translation initiation factor 2alpha kinase activity(GO:0004694) |
| 0.6 | 4.0 | GO:0072542 | protein phosphatase activator activity(GO:0072542) |
| 0.6 | 2.3 | GO:0003985 | acetyl-CoA C-acetyltransferase activity(GO:0003985) |
| 0.6 | 113.4 | GO:0003735 | structural constituent of ribosome(GO:0003735) |
| 0.5 | 22.3 | GO:0043027 | cysteine-type endopeptidase inhibitor activity involved in apoptotic process(GO:0043027) |
| 0.5 | 22.7 | GO:0031492 | nucleosomal DNA binding(GO:0031492) |
| 0.5 | 14.6 | GO:0003951 | NAD+ kinase activity(GO:0003951) |
| 0.5 | 3.0 | GO:0035402 | histone kinase activity (H3-T11 specific)(GO:0035402) |
| 0.5 | 5.4 | GO:0015926 | glucosidase activity(GO:0015926) |
| 0.5 | 17.1 | GO:0044183 | protein binding involved in protein folding(GO:0044183) |
| 0.5 | 2.4 | GO:0004485 | methylcrotonoyl-CoA carboxylase activity(GO:0004485) |
| 0.5 | 1.4 | GO:0005124 | scavenger receptor binding(GO:0005124) |
| 0.5 | 2.4 | GO:0004066 | asparagine synthase (glutamine-hydrolyzing) activity(GO:0004066) |
| 0.5 | 2.9 | GO:0008241 | peptidyl-dipeptidase activity(GO:0008241) |
| 0.5 | 1.9 | GO:0034057 | RNA strand-exchange activity(GO:0034057) |
| 0.5 | 3.3 | GO:0033170 | DNA clamp loader activity(GO:0003689) protein-DNA loading ATPase activity(GO:0033170) |
| 0.5 | 0.5 | GO:0043139 | 5'-3' DNA helicase activity(GO:0043139) |
| 0.5 | 47.5 | GO:0043130 | ubiquitin binding(GO:0043130) |
| 0.5 | 1.4 | GO:0047223 | beta-1,3-galactosyl-O-glycosyl-glycoprotein beta-1,3-N-acetylglucosaminyltransferase activity(GO:0047223) |
| 0.4 | 4.9 | GO:0042834 | peptidoglycan binding(GO:0042834) |
| 0.4 | 3.6 | GO:0001875 | lipopolysaccharide receptor activity(GO:0001875) |
| 0.4 | 1.8 | GO:0030197 | extracellular matrix constituent, lubricant activity(GO:0030197) |
| 0.4 | 1.7 | GO:0042296 | ISG15 transferase activity(GO:0042296) |
| 0.4 | 1.3 | GO:0010698 | acetyltransferase activator activity(GO:0010698) |
| 0.4 | 5.1 | GO:0004519 | endonuclease activity(GO:0004519) |
| 0.4 | 9.6 | GO:0017056 | structural constituent of nuclear pore(GO:0017056) |
| 0.4 | 1.2 | GO:0004045 | aminoacyl-tRNA hydrolase activity(GO:0004045) |
| 0.4 | 2.5 | GO:0070513 | death domain binding(GO:0070513) |
| 0.4 | 14.0 | GO:0070577 | lysine-acetylated histone binding(GO:0070577) |
| 0.4 | 2.8 | GO:0001165 | RNA polymerase I upstream control element sequence-specific DNA binding(GO:0001165) |
| 0.4 | 1.6 | GO:0004335 | galactokinase activity(GO:0004335) |
| 0.4 | 1.9 | GO:0002046 | opsin binding(GO:0002046) |
| 0.4 | 1.9 | GO:0001594 | trace-amine receptor activity(GO:0001594) |
| 0.4 | 3.1 | GO:0004873 | asialoglycoprotein receptor activity(GO:0004873) |
| 0.4 | 2.3 | GO:0055103 | ligase regulator activity(GO:0055103) |
| 0.4 | 0.4 | GO:0004461 | lactose synthase activity(GO:0004461) |
| 0.4 | 2.2 | GO:0008266 | poly(U) RNA binding(GO:0008266) |
| 0.4 | 2.2 | GO:0035613 | RNA stem-loop binding(GO:0035613) |
| 0.4 | 5.6 | GO:0042809 | vitamin D receptor binding(GO:0042809) |
| 0.3 | 1.0 | GO:0004582 | dolichyl-phosphate beta-D-mannosyltransferase activity(GO:0004582) |
| 0.3 | 9.2 | GO:0000993 | RNA polymerase II core binding(GO:0000993) |
| 0.3 | 2.4 | GO:1990226 | histone methyltransferase binding(GO:1990226) |
| 0.3 | 4.7 | GO:0031957 | very long-chain fatty acid-CoA ligase activity(GO:0031957) |
| 0.3 | 3.0 | GO:0070915 | lysophosphatidic acid receptor activity(GO:0070915) |
| 0.3 | 4.6 | GO:0038187 | signaling pattern recognition receptor activity(GO:0008329) pattern recognition receptor activity(GO:0038187) |
| 0.3 | 5.1 | GO:0035615 | clathrin adaptor activity(GO:0035615) endocytic adaptor activity(GO:0098748) |
| 0.3 | 9.3 | GO:0070063 | RNA polymerase binding(GO:0070063) |
| 0.3 | 1.7 | GO:0039552 | RIG-I binding(GO:0039552) |
| 0.3 | 27.3 | GO:0070035 | ATP-dependent helicase activity(GO:0008026) purine NTP-dependent helicase activity(GO:0070035) |
| 0.3 | 1.4 | GO:0047184 | 1-acylglycerophosphocholine O-acyltransferase activity(GO:0047184) |
| 0.3 | 4.3 | GO:0017049 | GTP-Rho binding(GO:0017049) |
| 0.3 | 0.8 | GO:0004392 | heme oxygenase (decyclizing) activity(GO:0004392) |
| 0.3 | 3.7 | GO:0036374 | glutathione hydrolase activity(GO:0036374) |
| 0.3 | 2.1 | GO:0015321 | sodium-dependent phosphate transmembrane transporter activity(GO:0015321) |
| 0.3 | 2.3 | GO:0004784 | superoxide dismutase activity(GO:0004784) oxidoreductase activity, acting on superoxide radicals as acceptor(GO:0016721) |
| 0.3 | 1.0 | GO:0043138 | 3'-5' DNA helicase activity(GO:0043138) |
| 0.3 | 3.5 | GO:0032395 | MHC class II receptor activity(GO:0032395) |
| 0.2 | 2.4 | GO:0008428 | ribonuclease inhibitor activity(GO:0008428) |
| 0.2 | 2.6 | GO:0016863 | intramolecular oxidoreductase activity, transposing C=C bonds(GO:0016863) |
| 0.2 | 2.9 | GO:0016857 | racemase and epimerase activity, acting on carbohydrates and derivatives(GO:0016857) |
| 0.2 | 0.9 | GO:0042500 | aspartic endopeptidase activity, intramembrane cleaving(GO:0042500) |
| 0.2 | 1.9 | GO:0005250 | A-type (transient outward) potassium channel activity(GO:0005250) |
| 0.2 | 4.5 | GO:0005537 | mannose binding(GO:0005537) |
| 0.2 | 6.1 | GO:0042288 | MHC class I protein binding(GO:0042288) |
| 0.2 | 8.5 | GO:0004532 | exoribonuclease activity(GO:0004532) |
| 0.2 | 6.8 | GO:0046965 | retinoid X receptor binding(GO:0046965) |
| 0.2 | 1.8 | GO:0004064 | arylesterase activity(GO:0004064) |
| 0.2 | 0.5 | GO:0015131 | thiosulfate transmembrane transporter activity(GO:0015117) oxaloacetate transmembrane transporter activity(GO:0015131) |
| 0.2 | 1.1 | GO:0019869 | chloride channel inhibitor activity(GO:0019869) |
| 0.2 | 1.3 | GO:0042577 | lipid phosphatase activity(GO:0042577) |
| 0.2 | 1.5 | GO:0004849 | uridine kinase activity(GO:0004849) |
| 0.2 | 12.6 | GO:0004843 | thiol-dependent ubiquitin-specific protease activity(GO:0004843) |
| 0.2 | 1.5 | GO:0001730 | 2'-5'-oligoadenylate synthetase activity(GO:0001730) |
| 0.2 | 7.2 | GO:0001103 | RNA polymerase II repressing transcription factor binding(GO:0001103) |
| 0.2 | 9.7 | GO:0003743 | translation initiation factor activity(GO:0003743) |
| 0.2 | 1.0 | GO:0033857 | diphosphoinositol-pentakisphosphate kinase activity(GO:0033857) |
| 0.2 | 7.9 | GO:0008536 | Ran GTPase binding(GO:0008536) |
| 0.2 | 1.6 | GO:0016778 | diphosphotransferase activity(GO:0016778) |
| 0.2 | 4.4 | GO:0001968 | fibronectin binding(GO:0001968) |
| 0.2 | 2.8 | GO:0016813 | hydrolase activity, acting on carbon-nitrogen (but not peptide) bonds, in linear amidines(GO:0016813) |
| 0.2 | 0.6 | GO:0061513 | hexose phosphate transmembrane transporter activity(GO:0015119) organophosphate:inorganic phosphate antiporter activity(GO:0015315) hexose-phosphate:inorganic phosphate antiporter activity(GO:0015526) glucose 6-phosphate:inorganic phosphate antiporter activity(GO:0061513) |
| 0.2 | 5.7 | GO:0005540 | hyaluronic acid binding(GO:0005540) |
| 0.2 | 8.1 | GO:0001786 | phosphatidylserine binding(GO:0001786) |
| 0.2 | 4.9 | GO:0032266 | phosphatidylinositol-3-phosphate binding(GO:0032266) |
| 0.2 | 1.9 | GO:0030884 | lipid antigen binding(GO:0030882) endogenous lipid antigen binding(GO:0030883) exogenous lipid antigen binding(GO:0030884) |
| 0.2 | 1.7 | GO:0003993 | acid phosphatase activity(GO:0003993) |
| 0.2 | 2.3 | GO:0015095 | magnesium ion transmembrane transporter activity(GO:0015095) |
| 0.2 | 2.1 | GO:0001075 | transcription factor activity, RNA polymerase II core promoter sequence-specific binding involved in preinitiation complex assembly(GO:0001075) |
| 0.2 | 8.2 | GO:0008138 | protein tyrosine/serine/threonine phosphatase activity(GO:0008138) |
| 0.2 | 9.5 | GO:0005158 | insulin receptor binding(GO:0005158) |
| 0.2 | 7.8 | GO:0000049 | tRNA binding(GO:0000049) |
| 0.2 | 1.1 | GO:0015187 | glycine transmembrane transporter activity(GO:0015187) |
| 0.2 | 5.1 | GO:0043015 | gamma-tubulin binding(GO:0043015) |
| 0.2 | 15.1 | GO:0030295 | protein kinase activator activity(GO:0030295) |
| 0.2 | 0.9 | GO:0001162 | RNA polymerase II intronic transcription regulatory region sequence-specific DNA binding(GO:0001162) |
| 0.2 | 2.2 | GO:0070034 | telomerase RNA binding(GO:0070034) |
| 0.2 | 3.1 | GO:0004177 | aminopeptidase activity(GO:0004177) |
| 0.2 | 3.7 | GO:0070006 | metalloaminopeptidase activity(GO:0070006) |
| 0.2 | 2.4 | GO:0008656 | cysteine-type endopeptidase activator activity involved in apoptotic process(GO:0008656) |
| 0.2 | 2.1 | GO:0051537 | 2 iron, 2 sulfur cluster binding(GO:0051537) |
| 0.2 | 1.4 | GO:0004321 | fatty-acyl-CoA synthase activity(GO:0004321) |
| 0.2 | 8.1 | GO:0050136 | NADH dehydrogenase (ubiquinone) activity(GO:0008137) NADH dehydrogenase (quinone) activity(GO:0050136) |
| 0.2 | 1.9 | GO:0015929 | hexosaminidase activity(GO:0015929) |
| 0.2 | 3.0 | GO:0097602 | cullin family protein binding(GO:0097602) |
| 0.2 | 4.7 | GO:1990841 | promoter-specific chromatin binding(GO:1990841) |
| 0.2 | 4.8 | GO:0031683 | G-protein beta/gamma-subunit complex binding(GO:0031683) |
| 0.2 | 4.5 | GO:0003887 | DNA-directed DNA polymerase activity(GO:0003887) |
| 0.2 | 2.3 | GO:0008140 | cAMP response element binding protein binding(GO:0008140) |
| 0.2 | 2.1 | GO:0004028 | 3-chloroallyl aldehyde dehydrogenase activity(GO:0004028) |
| 0.1 | 0.9 | GO:0038052 | RNA polymerase II transcription factor activity, estrogen-activated sequence-specific DNA binding(GO:0038052) |
| 0.1 | 1.2 | GO:0043996 | histone acetyltransferase activity (H4-K5 specific)(GO:0043995) histone acetyltransferase activity (H4-K8 specific)(GO:0043996) histone acetyltransferase activity (H4-K16 specific)(GO:0046972) |
| 0.1 | 2.2 | GO:0001085 | RNA polymerase II transcription factor binding(GO:0001085) |
| 0.1 | 4.9 | GO:0004709 | MAP kinase kinase kinase activity(GO:0004709) |
| 0.1 | 2.1 | GO:0030515 | snoRNA binding(GO:0030515) |
| 0.1 | 2.2 | GO:0015250 | water channel activity(GO:0015250) |
| 0.1 | 2.6 | GO:0016175 | superoxide-generating NADPH oxidase activity(GO:0016175) |
| 0.1 | 2.1 | GO:0005283 | sodium:amino acid symporter activity(GO:0005283) |
| 0.1 | 0.4 | GO:1990404 | protein ADP-ribosylase activity(GO:1990404) |
| 0.1 | 2.3 | GO:0005522 | profilin binding(GO:0005522) |
| 0.1 | 0.9 | GO:0030368 | interleukin-17 receptor activity(GO:0030368) |
| 0.1 | 14.2 | GO:0042393 | histone binding(GO:0042393) |
| 0.1 | 1.0 | GO:0035497 | cAMP response element binding(GO:0035497) |
| 0.1 | 39.9 | GO:0003713 | transcription coactivator activity(GO:0003713) |
| 0.1 | 0.7 | GO:0008269 | JAK pathway signal transduction adaptor activity(GO:0008269) |
| 0.1 | 3.8 | GO:0051539 | 4 iron, 4 sulfur cluster binding(GO:0051539) |
| 0.1 | 3.3 | GO:0005521 | lamin binding(GO:0005521) |
| 0.1 | 5.1 | GO:0016279 | lysine N-methyltransferase activity(GO:0016278) protein-lysine N-methyltransferase activity(GO:0016279) |
| 0.1 | 0.8 | GO:0019209 | kinase activator activity(GO:0019209) |
| 0.1 | 3.4 | GO:0001671 | ATPase activator activity(GO:0001671) |
| 0.1 | 0.4 | GO:0005499 | vitamin D binding(GO:0005499) |
| 0.1 | 1.2 | GO:0003831 | beta-N-acetylglucosaminylglycopeptide beta-1,4-galactosyltransferase activity(GO:0003831) |
| 0.1 | 2.4 | GO:0031489 | myosin V binding(GO:0031489) |
| 0.1 | 0.3 | GO:0004531 | deoxyribonuclease II activity(GO:0004531) |
| 0.1 | 6.4 | GO:0000979 | RNA polymerase II core promoter sequence-specific DNA binding(GO:0000979) |
| 0.1 | 0.5 | GO:0004994 | somatostatin receptor activity(GO:0004994) |
| 0.1 | 5.0 | GO:0004693 | cyclin-dependent protein serine/threonine kinase activity(GO:0004693) |
| 0.1 | 0.2 | GO:0015433 | peptide antigen-transporting ATPase activity(GO:0015433) |
| 0.1 | 2.4 | GO:0005123 | death receptor binding(GO:0005123) |
| 0.1 | 1.2 | GO:0052629 | phosphatidylinositol-3,5-bisphosphate 3-phosphatase activity(GO:0052629) |
| 0.1 | 0.3 | GO:0033878 | hormone-sensitive lipase activity(GO:0033878) |
| 0.1 | 1.5 | GO:0051400 | BH domain binding(GO:0051400) |
| 0.1 | 1.9 | GO:0008093 | cytoskeletal adaptor activity(GO:0008093) |
| 0.1 | 0.9 | GO:0034450 | ubiquitin-ubiquitin ligase activity(GO:0034450) |
| 0.1 | 4.7 | GO:0034987 | immunoglobulin receptor binding(GO:0034987) |
| 0.1 | 0.4 | GO:0030337 | DNA polymerase processivity factor activity(GO:0030337) |
| 0.1 | 3.2 | GO:0008173 | RNA methyltransferase activity(GO:0008173) |
| 0.1 | 0.4 | GO:0005502 | 11-cis retinal binding(GO:0005502) |
| 0.1 | 2.1 | GO:0031624 | ubiquitin conjugating enzyme binding(GO:0031624) |
| 0.1 | 0.4 | GO:0019958 | C-X-C chemokine binding(GO:0019958) |
| 0.1 | 0.4 | GO:0050436 | microfibril binding(GO:0050436) |
| 0.1 | 0.9 | GO:0017169 | CDP-alcohol phosphatidyltransferase activity(GO:0017169) |
| 0.1 | 6.3 | GO:0001618 | virus receptor activity(GO:0001618) |
| 0.1 | 1.2 | GO:0009881 | photoreceptor activity(GO:0009881) |
| 0.1 | 0.9 | GO:0001848 | complement binding(GO:0001848) |
| 0.1 | 8.5 | GO:0019903 | protein phosphatase binding(GO:0019903) |
| 0.1 | 1.5 | GO:0004549 | tRNA-specific ribonuclease activity(GO:0004549) |
| 0.1 | 0.3 | GO:0004771 | sterol esterase activity(GO:0004771) |
| 0.1 | 0.8 | GO:0004955 | prostaglandin receptor activity(GO:0004955) |
| 0.1 | 1.6 | GO:0015269 | calcium-activated potassium channel activity(GO:0015269) |
| 0.1 | 3.2 | GO:0004715 | non-membrane spanning protein tyrosine kinase activity(GO:0004715) |
| 0.1 | 0.5 | GO:0070064 | proline-rich region binding(GO:0070064) |
| 0.1 | 0.6 | GO:0033038 | bitter taste receptor activity(GO:0033038) |
| 0.1 | 1.0 | GO:0005112 | Notch binding(GO:0005112) |
| 0.1 | 18.9 | GO:0005096 | GTPase activator activity(GO:0005096) |
| 0.1 | 0.6 | GO:0004467 | long-chain fatty acid-CoA ligase activity(GO:0004467) decanoate--CoA ligase activity(GO:0102391) |
| 0.1 | 1.8 | GO:0004385 | guanylate kinase activity(GO:0004385) |
| 0.1 | 3.9 | GO:0003730 | mRNA 3'-UTR binding(GO:0003730) |
| 0.0 | 1.9 | GO:0048365 | Rac GTPase binding(GO:0048365) |
| 0.0 | 0.6 | GO:0101005 | thiol-dependent ubiquitinyl hydrolase activity(GO:0036459) ubiquitinyl hydrolase activity(GO:0101005) |
| 0.0 | 0.3 | GO:0008568 | microtubule-severing ATPase activity(GO:0008568) |
| 0.0 | 0.3 | GO:0004126 | cytidine deaminase activity(GO:0004126) |
| 0.0 | 0.3 | GO:0003998 | acylphosphatase activity(GO:0003998) |
| 0.0 | 0.7 | GO:0003841 | 1-acylglycerol-3-phosphate O-acyltransferase activity(GO:0003841) |
| 0.0 | 0.5 | GO:0070182 | DNA polymerase binding(GO:0070182) |
| 0.0 | 0.2 | GO:0008048 | calcium sensitive guanylate cyclase activator activity(GO:0008048) |
| 0.0 | 0.2 | GO:0071535 | RING-like zinc finger domain binding(GO:0071535) |
| 0.0 | 0.3 | GO:0015450 | P-P-bond-hydrolysis-driven protein transmembrane transporter activity(GO:0015450) |
| 0.0 | 1.0 | GO:0043022 | ribosome binding(GO:0043022) |
| 0.0 | 1.4 | GO:0003684 | damaged DNA binding(GO:0003684) |
| 0.0 | 1.4 | GO:0003727 | single-stranded RNA binding(GO:0003727) |
| 0.0 | 0.1 | GO:0004470 | malic enzyme activity(GO:0004470) |
| 0.0 | 0.1 | GO:0004735 | pyrroline-5-carboxylate reductase activity(GO:0004735) |
| 0.0 | 1.5 | GO:0016831 | carboxy-lyase activity(GO:0016831) |
| 0.0 | 0.4 | GO:0035198 | miRNA binding(GO:0035198) |
| 0.0 | 0.7 | GO:0051019 | mitogen-activated protein kinase binding(GO:0051019) |
| 0.0 | 4.6 | GO:0005057 | receptor signaling protein activity(GO:0005057) |
| 0.0 | 2.0 | GO:0001158 | enhancer sequence-specific DNA binding(GO:0001158) |
| 0.0 | 0.1 | GO:0004850 | uridine phosphorylase activity(GO:0004850) |
| 0.0 | 0.4 | GO:0046875 | ephrin receptor binding(GO:0046875) |
| 0.0 | 4.0 | GO:0001078 | transcriptional repressor activity, RNA polymerase II core promoter proximal region sequence-specific binding(GO:0001078) |
| 0.0 | 15.4 | GO:0050839 | cell adhesion molecule binding(GO:0050839) |
| 0.0 | 0.8 | GO:0002039 | p53 binding(GO:0002039) |
| 0.0 | 1.6 | GO:0032947 | protein complex scaffold(GO:0032947) |
| 0.0 | 0.2 | GO:0050700 | CARD domain binding(GO:0050700) |
| 0.0 | 1.1 | GO:0016811 | hydrolase activity, acting on carbon-nitrogen (but not peptide) bonds, in linear amides(GO:0016811) |
| 0.0 | 0.1 | GO:0008379 | thioredoxin peroxidase activity(GO:0008379) |
| 0.0 | 1.9 | GO:0003714 | transcription corepressor activity(GO:0003714) |
| 0.0 | 0.5 | GO:0042826 | histone deacetylase binding(GO:0042826) |
| 0.0 | 2.2 | GO:0003823 | antigen binding(GO:0003823) |
| 0.0 | 0.1 | GO:0016494 | C-X-C chemokine receptor activity(GO:0016494) |
| 0.0 | 0.7 | GO:0015485 | cholesterol binding(GO:0015485) |
| 0.0 | 0.5 | GO:0048020 | CCR chemokine receptor binding(GO:0048020) |
| 0.0 | 1.3 | GO:0003682 | chromatin binding(GO:0003682) |
| 0.0 | 0.3 | GO:0008374 | O-acyltransferase activity(GO:0008374) |
Gene overrepresentation in C2:CP category:
| Log-likelihood per target | Total log-likelihood | Term | Description |
|---|---|---|---|
| 0.8 | 0.8 | ST GAQ PATHWAY | G alpha q Pathway |
| 0.7 | 39.1 | PID IL12 STAT4 PATHWAY | IL12 signaling mediated by STAT4 |
| 0.7 | 24.3 | ST INTERLEUKIN 4 PATHWAY | Interleukin 4 (IL-4) Pathway |
| 0.7 | 30.4 | PID HIF1A PATHWAY | Hypoxic and oxygen homeostasis regulation of HIF-1-alpha |
| 0.6 | 27.2 | PID LYMPH ANGIOGENESIS PATHWAY | VEGFR3 signaling in lymphatic endothelium |
| 0.6 | 25.9 | PID INTEGRIN CS PATHWAY | Integrin family cell surface interactions |
| 0.5 | 7.7 | PID INTEGRIN2 PATHWAY | Beta2 integrin cell surface interactions |
| 0.5 | 17.4 | PID IL8 CXCR1 PATHWAY | IL8- and CXCR1-mediated signaling events |
| 0.5 | 7.4 | SA PROGRAMMED CELL DEATH | Programmed cell death, or apoptosis, eliminates damaged or unneeded cells. |
| 0.5 | 37.2 | PID FCER1 PATHWAY | Fc-epsilon receptor I signaling in mast cells |
| 0.4 | 14.2 | PID IL2 STAT5 PATHWAY | IL2 signaling events mediated by STAT5 |
| 0.4 | 10.3 | PID EPO PATHWAY | EPO signaling pathway |
| 0.4 | 4.6 | PID NFKAPPAB ATYPICAL PATHWAY | Atypical NF-kappaB pathway |
| 0.3 | 9.9 | PID SMAD2 3PATHWAY | Regulation of cytoplasmic and nuclear SMAD2/3 signaling |
| 0.3 | 12.4 | PID ATM PATHWAY | ATM pathway |
| 0.3 | 20.1 | PID ATR PATHWAY | ATR signaling pathway |
| 0.3 | 9.5 | SIG PIP3 SIGNALING IN B LYMPHOCYTES | Genes related to PIP3 signaling in B lymphocytes |
| 0.3 | 3.9 | PID VEGF VEGFR PATHWAY | VEGF and VEGFR signaling network |
| 0.2 | 4.8 | PID IL23 PATHWAY | IL23-mediated signaling events |
| 0.2 | 2.1 | PID IL2 PI3K PATHWAY | IL2 signaling events mediated by PI3K |
| 0.2 | 4.3 | PID AURORA A PATHWAY | Aurora A signaling |
| 0.2 | 14.6 | PID AURORA B PATHWAY | Aurora B signaling |
| 0.2 | 15.0 | PID HNF3B PATHWAY | FOXA2 and FOXA3 transcription factor networks |
| 0.2 | 7.0 | SIG INSULIN RECEPTOR PATHWAY IN CARDIAC MYOCYTES | Genes related to the insulin receptor pathway |
| 0.2 | 9.6 | SIG CHEMOTAXIS | Genes related to chemotaxis |
| 0.2 | 3.3 | PID DNA PK PATHWAY | DNA-PK pathway in nonhomologous end joining |
| 0.2 | 12.8 | PID HIF1 TFPATHWAY | HIF-1-alpha transcription factor network |
| 0.2 | 2.4 | PID KIT PATHWAY | Signaling events mediated by Stem cell factor receptor (c-Kit) |
| 0.2 | 4.8 | PID BARD1 PATHWAY | BARD1 signaling events |
| 0.2 | 5.8 | PID INSULIN PATHWAY | Insulin Pathway |
| 0.2 | 14.3 | PID RB 1PATHWAY | Regulation of retinoblastoma protein |
| 0.2 | 7.8 | PID TCR PATHWAY | TCR signaling in naïve CD4+ T cells |
| 0.2 | 4.2 | SA CASPASE CASCADE | Apoptosis is mediated by caspases, cysteine proteases arranged in a proteolytic cascade. |
| 0.2 | 10.8 | PID E2F PATHWAY | E2F transcription factor network |
| 0.1 | 4.3 | SA MMP CYTOKINE CONNECTION | Cytokines can induce activation of matrix metalloproteinases, which degrade extracellular matrix. |
| 0.1 | 3.4 | PID CONE PATHWAY | Visual signal transduction: Cones |
| 0.1 | 3.7 | PID SYNDECAN 3 PATHWAY | Syndecan-3-mediated signaling events |
| 0.1 | 5.7 | PID AR TF PATHWAY | Regulation of Androgen receptor activity |
| 0.1 | 4.3 | PID IL12 2PATHWAY | IL12-mediated signaling events |
| 0.1 | 4.4 | PID FOXO PATHWAY | FoxO family signaling |
| 0.1 | 7.6 | PID NFAT TFPATHWAY | Calcineurin-regulated NFAT-dependent transcription in lymphocytes |
| 0.1 | 2.2 | PID NCADHERIN PATHWAY | N-cadherin signaling events |
| 0.1 | 11.1 | PID BETA CATENIN NUC PATHWAY | Regulation of nuclear beta catenin signaling and target gene transcription |
| 0.1 | 4.9 | PID ARF6 TRAFFICKING PATHWAY | Arf6 trafficking events |
| 0.1 | 3.2 | PID P38 MKK3 6PATHWAY | p38 MAPK signaling pathway |
| 0.1 | 4.1 | PID HDAC CLASSII PATHWAY | Signaling events mediated by HDAC Class II |
| 0.1 | 3.5 | PID MYC PATHWAY | C-MYC pathway |
| 0.1 | 1.5 | PID WNT CANONICAL PATHWAY | Canonical Wnt signaling pathway |
| 0.1 | 5.6 | PID CDC42 PATHWAY | CDC42 signaling events |
| 0.1 | 4.3 | PID MTOR 4PATHWAY | mTOR signaling pathway |
| 0.1 | 4.0 | PID BMP PATHWAY | BMP receptor signaling |
| 0.1 | 3.7 | PID PLK1 PATHWAY | PLK1 signaling events |
| 0.1 | 2.6 | PID IL4 2PATHWAY | IL4-mediated signaling events |
| 0.1 | 4.5 | PID SYNDECAN 1 PATHWAY | Syndecan-1-mediated signaling events |
| 0.1 | 2.1 | PID RAC1 PATHWAY | RAC1 signaling pathway |
| 0.1 | 2.5 | PID TNF PATHWAY | TNF receptor signaling pathway |
| 0.1 | 1.5 | PID PTP1B PATHWAY | Signaling events mediated by PTP1B |
| 0.1 | 0.1 | PID CXCR3 PATHWAY | CXCR3-mediated signaling events |
| 0.1 | 1.4 | SIG CD40PATHWAYMAP | Genes related to CD40 signaling |
| 0.1 | 1.8 | PID PDGFRB PATHWAY | PDGFR-beta signaling pathway |
| 0.1 | 1.5 | PID RXR VDR PATHWAY | RXR and RAR heterodimerization with other nuclear receptor |
| 0.1 | 1.6 | PID AMB2 NEUTROPHILS PATHWAY | amb2 Integrin signaling |
| 0.0 | 0.6 | SIG REGULATION OF THE ACTIN CYTOSKELETON BY RHO GTPASES | Genes related to regulation of the actin cytoskeleton |
| 0.0 | 1.1 | PID NFAT 3PATHWAY | Role of Calcineurin-dependent NFAT signaling in lymphocytes |
| 0.0 | 0.3 | PID NEPHRIN NEPH1 PATHWAY | Nephrin/Neph1 signaling in the kidney podocyte |
| 0.0 | 1.8 | PID REG GR PATHWAY | Glucocorticoid receptor regulatory network |
| 0.0 | 2.3 | PID SMAD2 3NUCLEAR PATHWAY | Regulation of nuclear SMAD2/3 signaling |
| 0.0 | 1.3 | PID INTEGRIN A4B1 PATHWAY | Alpha4 beta1 integrin signaling events |
| 0.0 | 2.3 | PID P73PATHWAY | p73 transcription factor network |
| 0.0 | 2.4 | PID CMYB PATHWAY | C-MYB transcription factor network |
| 0.0 | 1.4 | PID P53 REGULATION PATHWAY | p53 pathway |
| 0.0 | 0.5 | PID PI3KCI PATHWAY | Class I PI3K signaling events |
| 0.0 | 0.7 | PID BCR 5PATHWAY | BCR signaling pathway |
| 0.0 | 0.5 | PID EPHRINB REV PATHWAY | Ephrin B reverse signaling |
| 0.0 | 0.8 | PID CD8 TCR DOWNSTREAM PATHWAY | Downstream signaling in naïve CD8+ T cells |
| 0.0 | 1.0 | PID NOTCH PATHWAY | Notch signaling pathway |
| 0.0 | 1.4 | PID ILK PATHWAY | Integrin-linked kinase signaling |
| 0.0 | 0.2 | PID S1P META PATHWAY | Sphingosine 1-phosphate (S1P) pathway |
| 0.0 | 0.4 | PID HIF2PATHWAY | HIF-2-alpha transcription factor network |
| 0.0 | 0.4 | PID INTEGRIN A9B1 PATHWAY | Alpha9 beta1 integrin signaling events |
| 0.0 | 0.5 | PID ERBB1 DOWNSTREAM PATHWAY | ErbB1 downstream signaling |
Gene overrepresentation in C2:CP:REACTOME category:
| Log-likelihood per target | Total log-likelihood | Term | Description |
|---|---|---|---|
| 2.9 | 80.1 | REACTOME CYTOSOLIC SULFONATION OF SMALL MOLECULES | Genes involved in Cytosolic sulfonation of small molecules |
| 1.7 | 39.9 | REACTOME TRANSLOCATION OF ZAP 70 TO IMMUNOLOGICAL SYNAPSE | Genes involved in Translocation of ZAP-70 to Immunological synapse |
| 1.5 | 23.3 | REACTOME UNWINDING OF DNA | Genes involved in Unwinding of DNA |
| 1.3 | 86.1 | REACTOME METABOLISM OF NON CODING RNA | Genes involved in Metabolism of non-coding RNA |
| 1.3 | 31.1 | REACTOME VIRAL MESSENGER RNA SYNTHESIS | Genes involved in Viral Messenger RNA Synthesis |
| 1.2 | 12.3 | REACTOME MEMBRANE BINDING AND TARGETTING OF GAG PROTEINS | Genes involved in Membrane binding and targetting of GAG proteins |
| 1.1 | 30.8 | REACTOME PLATELET SENSITIZATION BY LDL | Genes involved in Platelet sensitization by LDL |
| 1.0 | 17.8 | REACTOME GLUCOSE TRANSPORT | Genes involved in Glucose transport |
| 0.9 | 8.5 | REACTOME MRNA DECAY BY 3 TO 5 EXORIBONUCLEASE | Genes involved in mRNA Decay by 3' to 5' Exoribonuclease |
| 0.9 | 70.6 | REACTOME FORMATION OF THE TERNARY COMPLEX AND SUBSEQUENTLY THE 43S COMPLEX | Genes involved in Formation of the ternary complex, and subsequently, the 43S complex |
| 0.9 | 32.9 | REACTOME CYTOSOLIC TRNA AMINOACYLATION | Genes involved in Cytosolic tRNA aminoacylation |
| 0.8 | 17.2 | REACTOME ACTIVATION OF THE MRNA UPON BINDING OF THE CAP BINDING COMPLEX AND EIFS AND SUBSEQUENT BINDING TO 43S | Genes involved in Activation of the mRNA upon binding of the cap-binding complex and eIFs, and subsequent binding to 43S |
| 0.8 | 71.9 | REACTOME AUTODEGRADATION OF CDH1 BY CDH1 APC C | Genes involved in Autodegradation of Cdh1 by Cdh1:APC/C |
| 0.8 | 7.9 | REACTOME ENDOSOMAL VACUOLAR PATHWAY | Genes involved in Endosomal/Vacuolar pathway |
| 0.8 | 13.3 | REACTOME FACILITATIVE NA INDEPENDENT GLUCOSE TRANSPORTERS | Genes involved in Facilitative Na+-independent glucose transporters |
| 0.7 | 14.1 | REACTOME HYALURONAN UPTAKE AND DEGRADATION | Genes involved in Hyaluronan uptake and degradation |
| 0.7 | 22.4 | REACTOME FORMATION OF TUBULIN FOLDING INTERMEDIATES BY CCT TRIC | Genes involved in Formation of tubulin folding intermediates by CCT/TriC |
| 0.7 | 11.9 | REACTOME PURINE RIBONUCLEOSIDE MONOPHOSPHATE BIOSYNTHESIS | Genes involved in Purine ribonucleoside monophosphate biosynthesis |
| 0.7 | 6.2 | REACTOME NEGATIVE REGULATION OF THE PI3K AKT NETWORK | Genes involved in Negative regulation of the PI3K/AKT network |
| 0.6 | 14.8 | REACTOME FORMATION OF TRANSCRIPTION COUPLED NER TC NER REPAIR COMPLEX | Genes involved in Formation of transcription-coupled NER (TC-NER) repair complex |
| 0.6 | 85.7 | REACTOME SRP DEPENDENT COTRANSLATIONAL PROTEIN TARGETING TO MEMBRANE | Genes involved in SRP-dependent cotranslational protein targeting to membrane |
| 0.6 | 9.9 | REACTOME ACTIVATION OF IRF3 IRF7 MEDIATED BY TBK1 IKK EPSILON | Genes involved in Activation of IRF3/IRF7 mediated by TBK1/IKK epsilon |
| 0.5 | 6.0 | REACTOME APC C CDH1 MEDIATED DEGRADATION OF CDC20 AND OTHER APC C CDH1 TARGETED PROTEINS IN LATE MITOSIS EARLY G1 | Genes involved in APC/C:Cdh1 mediated degradation of Cdc20 and other APC/C:Cdh1 targeted proteins in late mitosis/early G1 |
| 0.5 | 7.6 | REACTOME CDT1 ASSOCIATION WITH THE CDC6 ORC ORIGIN COMPLEX | Genes involved in CDT1 association with the CDC6:ORC:origin complex |
| 0.5 | 14.1 | REACTOME KINESINS | Genes involved in Kinesins |
| 0.5 | 11.1 | REACTOME MRNA SPLICING MINOR PATHWAY | Genes involved in mRNA Splicing - Minor Pathway |
| 0.5 | 20.7 | REACTOME BASIGIN INTERACTIONS | Genes involved in Basigin interactions |
| 0.5 | 13.8 | REACTOME NONSENSE MEDIATED DECAY ENHANCED BY THE EXON JUNCTION COMPLEX | Genes involved in Nonsense Mediated Decay Enhanced by the Exon Junction Complex |
| 0.5 | 11.2 | REACTOME FORMATION OF ATP BY CHEMIOSMOTIC COUPLING | Genes involved in Formation of ATP by chemiosmotic coupling |
| 0.5 | 43.8 | REACTOME RESPIRATORY ELECTRON TRANSPORT ATP SYNTHESIS BY CHEMIOSMOTIC COUPLING AND HEAT PRODUCTION BY UNCOUPLING PROTEINS | Genes involved in Respiratory electron transport, ATP synthesis by chemiosmotic coupling, and heat production by uncoupling proteins. |
| 0.5 | 5.2 | REACTOME INFLUENZA VIRAL RNA TRANSCRIPTION AND REPLICATION | Genes involved in Influenza Viral RNA Transcription and Replication |
| 0.5 | 2.8 | REACTOME PEPTIDE CHAIN ELONGATION | Genes involved in Peptide chain elongation |
| 0.5 | 11.6 | REACTOME CREB PHOSPHORYLATION THROUGH THE ACTIVATION OF CAMKII | Genes involved in CREB phosphorylation through the activation of CaMKII |
| 0.4 | 8.1 | REACTOME RNA POL III TRANSCRIPTION INITIATION FROM TYPE 2 PROMOTER | Genes involved in RNA Polymerase III Transcription Initiation From Type 2 Promoter |
| 0.4 | 5.9 | REACTOME PLATELET ADHESION TO EXPOSED COLLAGEN | Genes involved in Platelet Adhesion to exposed collagen |
| 0.4 | 10.4 | REACTOME CIRCADIAN REPRESSION OF EXPRESSION BY REV ERBA | Genes involved in Circadian Repression of Expression by REV-ERBA |
| 0.4 | 8.4 | REACTOME PYRUVATE METABOLISM | Genes involved in Pyruvate metabolism |
| 0.4 | 7.4 | REACTOME IL 7 SIGNALING | Genes involved in Interleukin-7 signaling |
| 0.3 | 13.1 | REACTOME EXTENSION OF TELOMERES | Genes involved in Extension of Telomeres |
| 0.3 | 7.6 | REACTOME RNA POL II TRANSCRIPTION PRE INITIATION AND PROMOTER OPENING | Genes involved in RNA Polymerase II Transcription Pre-Initiation And Promoter Opening |
| 0.3 | 25.2 | REACTOME IMMUNOREGULATORY INTERACTIONS BETWEEN A LYMPHOID AND A NON LYMPHOID CELL | Genes involved in Immunoregulatory interactions between a Lymphoid and a non-Lymphoid cell |
| 0.3 | 5.3 | REACTOME ADENYLATE CYCLASE INHIBITORY PATHWAY | Genes involved in Adenylate cyclase inhibitory pathway |
| 0.3 | 6.1 | REACTOME ACTIVATION OF BH3 ONLY PROTEINS | Genes involved in Activation of BH3-only proteins |
| 0.3 | 3.0 | REACTOME SYNTHESIS SECRETION AND DEACYLATION OF GHRELIN | Genes involved in Synthesis, Secretion, and Deacylation of Ghrelin |
| 0.3 | 13.5 | REACTOME G1 PHASE | Genes involved in G1 Phase |
| 0.3 | 4.2 | REACTOME GAMMA CARBOXYLATION TRANSPORT AND AMINO TERMINAL CLEAVAGE OF PROTEINS | Genes involved in Gamma-carboxylation, transport, and amino-terminal cleavage of proteins |
| 0.3 | 8.6 | REACTOME GENERATION OF SECOND MESSENGER MOLECULES | Genes involved in Generation of second messenger molecules |
| 0.3 | 4.9 | REACTOME THE NLRP3 INFLAMMASOME | Genes involved in The NLRP3 inflammasome |
| 0.3 | 4.0 | REACTOME TRANSLATION | Genes involved in Translation |
| 0.2 | 2.7 | REACTOME CD28 DEPENDENT VAV1 PATHWAY | Genes involved in CD28 dependent Vav1 pathway |
| 0.2 | 3.7 | REACTOME SIGNALING BY NOTCH4 | Genes involved in Signaling by NOTCH4 |
| 0.2 | 2.9 | REACTOME TRAFFICKING AND PROCESSING OF ENDOSOMAL TLR | Genes involved in Trafficking and processing of endosomal TLR |
| 0.2 | 16.1 | REACTOME MITOTIC PROMETAPHASE | Genes involved in Mitotic Prometaphase |
| 0.2 | 5.1 | REACTOME RETROGRADE NEUROTROPHIN SIGNALLING | Genes involved in Retrograde neurotrophin signalling |
| 0.2 | 5.6 | REACTOME RIP MEDIATED NFKB ACTIVATION VIA DAI | Genes involved in RIP-mediated NFkB activation via DAI |
| 0.2 | 41.0 | REACTOME SIGNALING BY RHO GTPASES | Genes involved in Signaling by Rho GTPases |
| 0.2 | 3.2 | REACTOME KERATAN SULFATE DEGRADATION | Genes involved in Keratan sulfate degradation |
| 0.2 | 6.1 | REACTOME SYNTHESIS OF PC | Genes involved in Synthesis of PC |
| 0.2 | 2.0 | REACTOME REGULATION OF THE FANCONI ANEMIA PATHWAY | Genes involved in Regulation of the Fanconi anemia pathway |
| 0.2 | 3.7 | REACTOME GLUCONEOGENESIS | Genes involved in Gluconeogenesis |
| 0.2 | 5.2 | REACTOME N GLYCAN ANTENNAE ELONGATION | Genes involved in N-Glycan antennae elongation |
| 0.2 | 3.8 | REACTOME CREB PHOSPHORYLATION THROUGH THE ACTIVATION OF RAS | Genes involved in CREB phosphorylation through the activation of Ras |
| 0.2 | 6.4 | REACTOME CHOLESTEROL BIOSYNTHESIS | Genes involved in Cholesterol biosynthesis |
| 0.2 | 4.7 | REACTOME BRANCHED CHAIN AMINO ACID CATABOLISM | Genes involved in Branched-chain amino acid catabolism |
| 0.2 | 7.8 | REACTOME EFFECTS OF PIP2 HYDROLYSIS | Genes involved in Effects of PIP2 hydrolysis |
| 0.2 | 4.2 | REACTOME METABOLISM OF POLYAMINES | Genes involved in Metabolism of polyamines |
| 0.2 | 0.8 | REACTOME TRAF6 MEDIATED INDUCTION OF TAK1 COMPLEX | Genes involved in TRAF6 mediated induction of TAK1 complex |
| 0.2 | 2.2 | REACTOME PASSIVE TRANSPORT BY AQUAPORINS | Genes involved in Passive Transport by Aquaporins |
| 0.2 | 16.5 | REACTOME MRNA PROCESSING | Genes involved in mRNA Processing |
| 0.1 | 9.4 | REACTOME CHEMOKINE RECEPTORS BIND CHEMOKINES | Genes involved in Chemokine receptors bind chemokines |
| 0.1 | 3.8 | REACTOME METABOLISM OF PORPHYRINS | Genes involved in Metabolism of porphyrins |
| 0.1 | 1.8 | REACTOME ABACAVIR TRANSPORT AND METABOLISM | Genes involved in Abacavir transport and metabolism |
| 0.1 | 2.5 | REACTOME VEGF LIGAND RECEPTOR INTERACTIONS | Genes involved in VEGF ligand-receptor interactions |
| 0.1 | 5.2 | REACTOME GLYCOLYSIS | Genes involved in Glycolysis |
| 0.1 | 4.0 | REACTOME DOWNREGULATION OF TGF BETA RECEPTOR SIGNALING | Genes involved in Downregulation of TGF-beta receptor signaling |
| 0.1 | 1.4 | REACTOME ACTIVATION OF NF KAPPAB IN B CELLS | Genes involved in Activation of NF-kappaB in B Cells |
| 0.1 | 1.2 | REACTOME OPSINS | Genes involved in Opsins |
| 0.1 | 2.4 | REACTOME ACTIVATION OF GENES BY ATF4 | Genes involved in Activation of Genes by ATF4 |
| 0.1 | 3.2 | REACTOME SULFUR AMINO ACID METABOLISM | Genes involved in Sulfur amino acid metabolism |
| 0.1 | 0.8 | REACTOME GPVI MEDIATED ACTIVATION CASCADE | Genes involved in GPVI-mediated activation cascade |
| 0.1 | 3.8 | REACTOME NEGATIVE REGULATORS OF RIG I MDA5 SIGNALING | Genes involved in Negative regulators of RIG-I/MDA5 signaling |
| 0.1 | 1.2 | REACTOME TRYPTOPHAN CATABOLISM | Genes involved in Tryptophan catabolism |
| 0.1 | 0.7 | REACTOME REGULATION OF KIT SIGNALING | Genes involved in Regulation of KIT signaling |
| 0.1 | 2.6 | REACTOME SYNTHESIS AND INTERCONVERSION OF NUCLEOTIDE DI AND TRIPHOSPHATES | Genes involved in Synthesis and interconversion of nucleotide di- and triphosphates |
| 0.1 | 2.3 | REACTOME ANTIGEN PROCESSING CROSS PRESENTATION | Genes involved in Antigen processing-Cross presentation |
| 0.1 | 1.5 | REACTOME N GLYCAN TRIMMING IN THE ER AND CALNEXIN CALRETICULIN CYCLE | Genes involved in N-glycan trimming in the ER and Calnexin/Calreticulin cycle |
| 0.1 | 1.7 | REACTOME DOWNREGULATION OF SMAD2 3 SMAD4 TRANSCRIPTIONAL ACTIVITY | Genes involved in Downregulation of SMAD2/3:SMAD4 transcriptional activity |
| 0.1 | 0.5 | REACTOME CTLA4 INHIBITORY SIGNALING | Genes involved in CTLA4 inhibitory signaling |
| 0.1 | 1.8 | REACTOME RAP1 SIGNALLING | Genes involved in Rap1 signalling |
| 0.1 | 1.2 | REACTOME ANTIGEN PRESENTATION FOLDING ASSEMBLY AND PEPTIDE LOADING OF CLASS I MHC | Genes involved in Antigen Presentation: Folding, assembly and peptide loading of class I MHC |
| 0.1 | 2.5 | REACTOME SYNTHESIS OF PIPS AT THE PLASMA MEMBRANE | Genes involved in Synthesis of PIPs at the plasma membrane |
| 0.1 | 3.0 | REACTOME VOLTAGE GATED POTASSIUM CHANNELS | Genes involved in Voltage gated Potassium channels |
| 0.1 | 2.4 | REACTOME SIGNALING BY ERBB2 | Genes involved in Signaling by ERBB2 |
| 0.1 | 1.4 | REACTOME INSULIN SYNTHESIS AND PROCESSING | Genes involved in Insulin Synthesis and Processing |
| 0.1 | 1.7 | REACTOME SIGNAL TRANSDUCTION BY L1 | Genes involved in Signal transduction by L1 |
| 0.1 | 1.3 | REACTOME REGULATION OF COMPLEMENT CASCADE | Genes involved in Regulation of Complement cascade |
| 0.1 | 0.9 | REACTOME SIGNALING BY FGFR | Genes involved in Signaling by FGFR |
| 0.1 | 1.0 | REACTOME AMYLOIDS | Genes involved in Amyloids |
| 0.0 | 0.7 | REACTOME DEADENYLATION OF MRNA | Genes involved in Deadenylation of mRNA |
| 0.0 | 1.1 | REACTOME TRANSPORT TO THE GOLGI AND SUBSEQUENT MODIFICATION | Genes involved in Transport to the Golgi and subsequent modification |
| 0.0 | 3.7 | REACTOME NUCLEAR RECEPTOR TRANSCRIPTION PATHWAY | Genes involved in Nuclear Receptor transcription pathway |
| 0.0 | 0.8 | REACTOME GAP JUNCTION ASSEMBLY | Genes involved in Gap junction assembly |
| 0.0 | 0.7 | REACTOME NEPHRIN INTERACTIONS | Genes involved in Nephrin interactions |
| 0.0 | 1.0 | REACTOME AMINO ACID TRANSPORT ACROSS THE PLASMA MEMBRANE | Genes involved in Amino acid transport across the plasma membrane |
| 0.0 | 1.6 | REACTOME CGMP EFFECTS | Genes involved in cGMP effects |
| 0.0 | 0.5 | REACTOME FGFR1 LIGAND BINDING AND ACTIVATION | Genes involved in FGFR1 ligand binding and activation |
| 0.0 | 1.7 | REACTOME MITOCHONDRIAL PROTEIN IMPORT | Genes involved in Mitochondrial Protein Import |
| 0.0 | 3.9 | REACTOME CLASS I MHC MEDIATED ANTIGEN PROCESSING PRESENTATION | Genes involved in Class I MHC mediated antigen processing & presentation |
| 0.0 | 1.3 | REACTOME SIGNALING BY SCF KIT | Genes involved in Signaling by SCF-KIT |
| 0.0 | 0.7 | REACTOME INTERFERON GAMMA SIGNALING | Genes involved in Interferon gamma signaling |
| 0.0 | 0.4 | REACTOME SPHINGOLIPID DE NOVO BIOSYNTHESIS | Genes involved in Sphingolipid de novo biosynthesis |
| 0.0 | 0.3 | REACTOME BIOSYNTHESIS OF THE N GLYCAN PRECURSOR DOLICHOL LIPID LINKED OLIGOSACCHARIDE LLO AND TRANSFER TO A NASCENT PROTEIN | Genes involved in Biosynthesis of the N-glycan precursor (dolichol lipid-linked oligosaccharide, LLO) and transfer to a nascent protein |
| 0.0 | 0.2 | REACTOME REGULATION OF HYPOXIA INDUCIBLE FACTOR HIF BY OXYGEN | Genes involved in Regulation of Hypoxia-inducible Factor (HIF) by Oxygen |