Project
GNF SymAtlas + NCI-60 cancer cell lines, comparison of cancers vs non-cancers, human (Su, 2004; Ross, 2000)
Navigation
Downloads
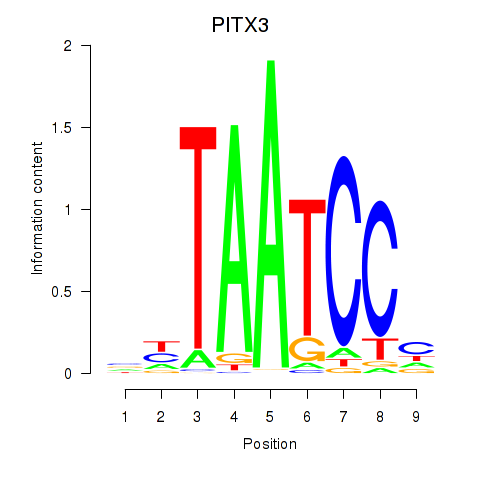
Results for PITX3
Z-value: 1.36
Motif logo
Transcription factors associated with PITX3
| Gene Symbol | Gene ID | Gene Info |
|---|---|---|
|
PITX3
|
ENSG00000107859.5 | paired like homeodomain 3 |
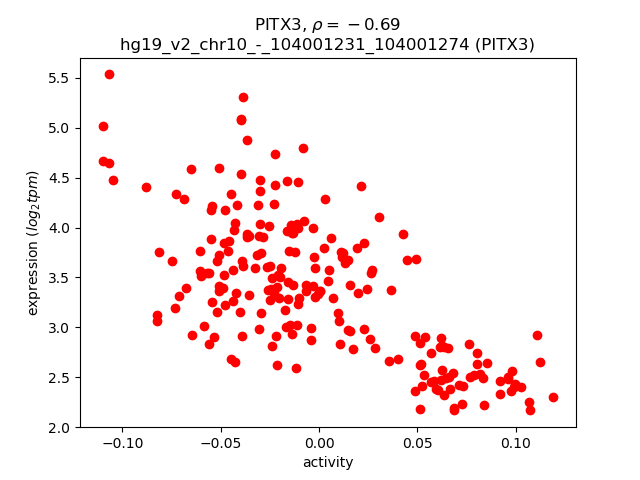
Activity-expression correlation:
| Gene | Promoter | Pearson corr. coef. | P-value | Plot |
|---|---|---|---|---|
| PITX3 | hg19_v2_chr10_-_104001231_104001274 | -0.69 | 5.7e-32 | Click! |
Activity profile of PITX3 motif
Sorted Z-values of PITX3 motif
| Promoter | Log-likelihood | Transcript | Gene | Gene Info |
|---|---|---|---|---|
| chr5_+_159848807 | 53.83 |
ENST00000352433.5
|
PTTG1
|
pituitary tumor-transforming 1 |
| chr12_+_104682496 | 51.89 |
ENST00000378070.4
|
TXNRD1
|
thioredoxin reductase 1 |
| chr6_+_24775153 | 50.91 |
ENST00000356509.3
ENST00000230056.3 |
GMNN
|
geminin, DNA replication inhibitor |
| chr4_-_120988229 | 48.51 |
ENST00000296509.6
|
MAD2L1
|
MAD2 mitotic arrest deficient-like 1 (yeast) |
| chr5_+_159848854 | 47.17 |
ENST00000517480.1
ENST00000520452.1 ENST00000393964.1 |
PTTG1
|
pituitary tumor-transforming 1 |
| chr17_-_4852332 | 42.93 |
ENST00000572383.1
|
PFN1
|
profilin 1 |
| chr13_-_31191642 | 41.86 |
ENST00000405805.1
|
HMGB1
|
high mobility group box 1 |
| chr9_+_75766652 | 39.35 |
ENST00000257497.6
|
ANXA1
|
annexin A1 |
| chr7_+_141438393 | 37.08 |
ENST00000484178.1
ENST00000473783.1 ENST00000481508.1 |
SSBP1
|
single-stranded DNA binding protein 1, mitochondrial |
| chr8_-_101718991 | 36.36 |
ENST00000517990.1
|
PABPC1
|
poly(A) binding protein, cytoplasmic 1 |
| chr5_+_32531893 | 35.74 |
ENST00000512913.1
|
SUB1
|
SUB1 homolog (S. cerevisiae) |
| chr18_+_657578 | 35.45 |
ENST00000323274.10
|
TYMS
|
thymidylate synthetase |
| chr12_+_53693812 | 35.40 |
ENST00000549488.1
|
C12orf10
|
chromosome 12 open reading frame 10 |
| chr11_-_47447767 | 32.87 |
ENST00000530651.1
ENST00000524447.2 ENST00000531051.2 ENST00000526993.1 ENST00000602866.1 |
PSMC3
|
proteasome (prosome, macropain) 26S subunit, ATPase, 3 |
| chr8_-_27695552 | 32.52 |
ENST00000522944.1
ENST00000301905.4 |
PBK
|
PDZ binding kinase |
| chr7_-_87856280 | 32.43 |
ENST00000490437.1
ENST00000431660.1 |
SRI
|
sorcin |
| chr17_+_73230799 | 32.34 |
ENST00000579838.1
|
NUP85
|
nucleoporin 85kDa |
| chr17_-_73150629 | 31.96 |
ENST00000356033.4
ENST00000405458.3 ENST00000409753.3 |
HN1
|
hematological and neurological expressed 1 |
| chr2_-_176046391 | 31.78 |
ENST00000392541.3
ENST00000409194.1 |
ATP5G3
|
ATP synthase, H+ transporting, mitochondrial Fo complex, subunit C3 (subunit 9) |
| chr7_-_87856303 | 31.51 |
ENST00000394641.3
|
SRI
|
sorcin |
| chr17_-_4852243 | 29.95 |
ENST00000225655.5
|
PFN1
|
profilin 1 |
| chr20_+_25388293 | 28.49 |
ENST00000262460.4
ENST00000429262.2 |
GINS1
|
GINS complex subunit 1 (Psf1 homolog) |
| chr10_-_126716459 | 28.28 |
ENST00000309035.6
|
CTBP2
|
C-terminal binding protein 2 |
| chrX_+_21958674 | 27.47 |
ENST00000404933.2
|
SMS
|
spermine synthase |
| chr2_-_225434538 | 27.26 |
ENST00000409096.1
|
CUL3
|
cullin 3 |
| chr2_+_219110149 | 27.18 |
ENST00000456575.1
|
ARPC2
|
actin related protein 2/3 complex, subunit 2, 34kDa |
| chr7_+_73868439 | 27.16 |
ENST00000424337.2
|
GTF2IRD1
|
GTF2I repeat domain containing 1 |
| chr12_-_110883346 | 27.13 |
ENST00000547365.1
|
ARPC3
|
actin related protein 2/3 complex, subunit 3, 21kDa |
| chr2_+_198380763 | 26.78 |
ENST00000448447.2
ENST00000409360.1 |
MOB4
|
MOB family member 4, phocein |
| chr2_-_190044480 | 26.32 |
ENST00000374866.3
|
COL5A2
|
collagen, type V, alpha 2 |
| chr11_-_66206260 | 26.31 |
ENST00000329819.4
ENST00000310999.7 ENST00000430466.2 |
MRPL11
|
mitochondrial ribosomal protein L11 |
| chr17_+_34848049 | 26.00 |
ENST00000588902.1
ENST00000591067.1 |
ZNHIT3
|
zinc finger, HIT-type containing 3 |
| chr14_-_58894223 | 25.91 |
ENST00000555593.1
|
TIMM9
|
translocase of inner mitochondrial membrane 9 homolog (yeast) |
| chr14_+_52456327 | 25.73 |
ENST00000556760.1
|
C14orf166
|
chromosome 14 open reading frame 166 |
| chr22_-_42336209 | 25.66 |
ENST00000472374.2
|
CENPM
|
centromere protein M |
| chrX_+_21958814 | 25.49 |
ENST00000379404.1
ENST00000415881.2 |
SMS
|
spermine synthase |
| chr7_+_73868220 | 25.12 |
ENST00000455841.2
|
GTF2IRD1
|
GTF2I repeat domain containing 1 |
| chr20_+_3869423 | 25.11 |
ENST00000497424.1
|
PANK2
|
pantothenate kinase 2 |
| chr16_+_84801852 | 25.01 |
ENST00000569925.1
ENST00000567526.1 |
USP10
|
ubiquitin specific peptidase 10 |
| chr16_+_3068393 | 24.92 |
ENST00000573001.1
|
TNFRSF12A
|
tumor necrosis factor receptor superfamily, member 12A |
| chr1_+_45205478 | 24.46 |
ENST00000452259.1
ENST00000372224.4 |
KIF2C
|
kinesin family member 2C |
| chr9_-_116172946 | 24.42 |
ENST00000374171.4
|
POLE3
|
polymerase (DNA directed), epsilon 3, accessory subunit |
| chr6_-_31704282 | 24.34 |
ENST00000375784.3
ENST00000375779.2 |
CLIC1
|
chloride intracellular channel 1 |
| chr3_+_138340049 | 24.33 |
ENST00000464668.1
|
FAIM
|
Fas apoptotic inhibitory molecule |
| chr7_+_73868120 | 23.74 |
ENST00000265755.3
|
GTF2IRD1
|
GTF2I repeat domain containing 1 |
| chr4_-_185655278 | 23.30 |
ENST00000281453.5
|
MLF1IP
|
centromere protein U |
| chr2_-_69664549 | 23.16 |
ENST00000450796.2
ENST00000484177.1 |
NFU1
|
NFU1 iron-sulfur cluster scaffold homolog (S. cerevisiae) |
| chr8_+_132952112 | 22.94 |
ENST00000520362.1
ENST00000519656.1 |
EFR3A
|
EFR3 homolog A (S. cerevisiae) |
| chr5_-_68665469 | 22.92 |
ENST00000217893.5
|
TAF9
|
TAF9 RNA polymerase II, TATA box binding protein (TBP)-associated factor, 32kDa |
| chr3_-_10362725 | 22.84 |
ENST00000397109.3
ENST00000428626.1 ENST00000445064.1 ENST00000431352.1 ENST00000397117.1 ENST00000337354.4 ENST00000383801.2 ENST00000432213.1 ENST00000350697.3 |
SEC13
|
SEC13 homolog (S. cerevisiae) |
| chr2_-_69664586 | 22.79 |
ENST00000303698.3
ENST00000394305.1 ENST00000410022.2 |
NFU1
|
NFU1 iron-sulfur cluster scaffold homolog (S. cerevisiae) |
| chr2_-_3595547 | 22.70 |
ENST00000438485.1
|
RP13-512J5.1
|
Uncharacterized protein |
| chr17_+_41158742 | 22.68 |
ENST00000415816.2
ENST00000438323.2 |
IFI35
|
interferon-induced protein 35 |
| chrX_+_114795489 | 22.59 |
ENST00000355899.3
ENST00000537301.1 ENST00000289290.3 |
PLS3
|
plastin 3 |
| chrX_+_69509927 | 22.56 |
ENST00000374403.3
|
KIF4A
|
kinesin family member 4A |
| chr1_-_45987526 | 22.16 |
ENST00000372079.1
ENST00000262746.1 ENST00000447184.1 ENST00000319248.8 |
PRDX1
|
peroxiredoxin 1 |
| chr4_+_169418195 | 22.14 |
ENST00000261509.6
ENST00000335742.7 |
PALLD
|
palladin, cytoskeletal associated protein |
| chr12_+_104337515 | 22.07 |
ENST00000550595.1
|
HSP90B1
|
heat shock protein 90kDa beta (Grp94), member 1 |
| chr1_+_165796753 | 21.98 |
ENST00000367879.4
|
UCK2
|
uridine-cytidine kinase 2 |
| chr8_-_124428569 | 21.97 |
ENST00000521903.1
|
ATAD2
|
ATPase family, AAA domain containing 2 |
| chr18_+_8717369 | 21.67 |
ENST00000359865.3
ENST00000400050.3 ENST00000306285.7 |
SOGA2
|
SOGA family member 2 |
| chr14_+_52456193 | 21.32 |
ENST00000261700.3
|
C14orf166
|
chromosome 14 open reading frame 166 |
| chr7_+_112063192 | 21.23 |
ENST00000005558.4
|
IFRD1
|
interferon-related developmental regulator 1 |
| chr19_+_47634039 | 21.08 |
ENST00000597808.1
ENST00000413379.3 ENST00000600706.1 ENST00000540850.1 ENST00000598840.1 ENST00000600753.1 ENST00000270225.7 ENST00000392776.3 |
SAE1
|
SUMO1 activating enzyme subunit 1 |
| chr2_+_192141611 | 21.07 |
ENST00000392316.1
|
MYO1B
|
myosin IB |
| chr19_+_14672755 | 21.01 |
ENST00000594545.1
|
TECR
|
trans-2,3-enoyl-CoA reductase |
| chr9_+_138391805 | 20.88 |
ENST00000371785.1
|
MRPS2
|
mitochondrial ribosomal protein S2 |
| chr15_+_66797627 | 20.81 |
ENST00000565627.1
ENST00000564179.1 |
ZWILCH
|
zwilch kinetochore protein |
| chr12_-_109125285 | 20.72 |
ENST00000552871.1
ENST00000261401.3 |
CORO1C
|
coronin, actin binding protein, 1C |
| chr5_-_134735568 | 20.50 |
ENST00000510038.1
ENST00000304332.4 |
H2AFY
|
H2A histone family, member Y |
| chr14_-_58893832 | 20.48 |
ENST00000556007.2
|
TIMM9
|
translocase of inner mitochondrial membrane 9 homolog (yeast) |
| chr2_+_201170596 | 20.45 |
ENST00000439084.1
ENST00000409718.1 |
SPATS2L
|
spermatogenesis associated, serine-rich 2-like |
| chr7_-_94285472 | 20.32 |
ENST00000437425.2
ENST00000447873.1 ENST00000415788.2 |
SGCE
|
sarcoglycan, epsilon |
| chr7_-_94285511 | 20.26 |
ENST00000265735.7
|
SGCE
|
sarcoglycan, epsilon |
| chr8_-_121457608 | 20.25 |
ENST00000306185.3
|
MRPL13
|
mitochondrial ribosomal protein L13 |
| chr20_+_33759854 | 20.24 |
ENST00000216968.4
|
PROCR
|
protein C receptor, endothelial |
| chr7_+_98923505 | 20.24 |
ENST00000432884.2
ENST00000262942.5 |
ARPC1A
|
actin related protein 2/3 complex, subunit 1A, 41kDa |
| chr20_-_48732472 | 20.23 |
ENST00000340309.3
ENST00000415862.2 ENST00000371677.3 ENST00000420027.2 |
UBE2V1
|
ubiquitin-conjugating enzyme E2 variant 1 |
| chr3_+_49057876 | 20.22 |
ENST00000326912.4
|
NDUFAF3
|
NADH dehydrogenase (ubiquinone) complex I, assembly factor 3 |
| chr1_+_169079823 | 20.20 |
ENST00000367813.3
|
ATP1B1
|
ATPase, Na+/K+ transporting, beta 1 polypeptide |
| chr2_-_62115725 | 20.16 |
ENST00000538252.1
ENST00000544079.1 ENST00000394440.3 |
CCT4
|
chaperonin containing TCP1, subunit 4 (delta) |
| chr1_-_110950255 | 20.14 |
ENST00000483260.1
ENST00000474861.2 ENST00000602318.1 |
LAMTOR5
|
late endosomal/lysosomal adaptor, MAPK and MTOR activator 5 |
| chr17_-_40134339 | 20.01 |
ENST00000587727.1
|
DNAJC7
|
DnaJ (Hsp40) homolog, subfamily C, member 7 |
| chr7_+_12727250 | 19.85 |
ENST00000404894.1
|
ARL4A
|
ADP-ribosylation factor-like 4A |
| chr12_+_104680659 | 19.62 |
ENST00000526691.1
ENST00000531691.1 ENST00000388854.3 ENST00000354940.6 ENST00000526390.1 ENST00000531689.1 |
TXNRD1
|
thioredoxin reductase 1 |
| chr1_-_110950564 | 19.55 |
ENST00000256644.4
|
LAMTOR5
|
late endosomal/lysosomal adaptor, MAPK and MTOR activator 5 |
| chr3_-_149293990 | 19.52 |
ENST00000472417.1
|
WWTR1
|
WW domain containing transcription regulator 1 |
| chr10_+_70661014 | 19.42 |
ENST00000373585.3
|
DDX50
|
DEAD (Asp-Glu-Ala-Asp) box polypeptide 50 |
| chr19_-_47349395 | 19.40 |
ENST00000597020.1
|
AP2S1
|
adaptor-related protein complex 2, sigma 1 subunit |
| chr4_+_57845043 | 19.34 |
ENST00000433463.1
ENST00000314595.5 |
POLR2B
|
polymerase (RNA) II (DNA directed) polypeptide B, 140kDa |
| chr12_+_49621658 | 19.31 |
ENST00000541364.1
|
TUBA1C
|
tubulin, alpha 1c |
| chr3_-_131221790 | 19.31 |
ENST00000512877.1
ENST00000264995.3 ENST00000511168.1 ENST00000425847.2 |
MRPL3
|
mitochondrial ribosomal protein L3 |
| chr20_+_57556263 | 19.25 |
ENST00000602795.1
ENST00000344018.3 |
NELFCD
|
negative elongation factor complex member C/D |
| chr20_+_35807512 | 19.17 |
ENST00000373622.5
|
RPN2
|
ribophorin II |
| chr3_+_23847432 | 19.14 |
ENST00000346855.3
|
UBE2E1
|
ubiquitin-conjugating enzyme E2E 1 |
| chr20_+_60878005 | 19.11 |
ENST00000253003.2
|
ADRM1
|
adhesion regulating molecule 1 |
| chr1_+_161719552 | 19.07 |
ENST00000367943.4
|
DUSP12
|
dual specificity phosphatase 12 |
| chr7_-_94285402 | 19.03 |
ENST00000428696.2
ENST00000445866.2 |
SGCE
|
sarcoglycan, epsilon |
| chr5_+_154393260 | 19.01 |
ENST00000435029.4
|
KIF4B
|
kinesin family member 4B |
| chr2_+_39005325 | 19.01 |
ENST00000281950.3
|
GEMIN6
|
gem (nuclear organelle) associated protein 6 |
| chr8_+_54764346 | 19.01 |
ENST00000297313.3
ENST00000344277.6 |
RGS20
|
regulator of G-protein signaling 20 |
| chr5_-_77072085 | 18.92 |
ENST00000518338.2
ENST00000520039.1 ENST00000306388.6 ENST00000520361.1 |
TBCA
|
tubulin folding cofactor A |
| chr15_-_59949667 | 18.83 |
ENST00000396061.1
|
GTF2A2
|
general transcription factor IIA, 2, 12kDa |
| chr14_-_71107921 | 18.82 |
ENST00000553982.1
ENST00000500016.1 |
CTD-2540L5.5
CTD-2540L5.6
|
CTD-2540L5.5 CTD-2540L5.6 |
| chr16_-_23607598 | 18.78 |
ENST00000562133.1
ENST00000570319.1 ENST00000007516.3 |
NDUFAB1
|
NADH dehydrogenase (ubiquinone) 1, alpha/beta subcomplex, 1, 8kDa |
| chr11_-_47447970 | 18.71 |
ENST00000298852.3
ENST00000530912.1 |
PSMC3
|
proteasome (prosome, macropain) 26S subunit, ATPase, 3 |
| chr17_+_73201754 | 18.61 |
ENST00000583569.1
ENST00000245544.4 ENST00000579324.1 ENST00000541827.1 ENST00000579298.1 ENST00000447371.2 |
NUP85
|
nucleoporin 85kDa |
| chr1_+_207943667 | 18.46 |
ENST00000462968.2
|
CD46
|
CD46 molecule, complement regulatory protein |
| chr3_-_186524234 | 18.43 |
ENST00000418288.1
ENST00000296273.2 |
RFC4
|
replication factor C (activator 1) 4, 37kDa |
| chr8_-_101719159 | 18.34 |
ENST00000520868.1
ENST00000522658.1 |
PABPC1
|
poly(A) binding protein, cytoplasmic 1 |
| chr4_+_39699664 | 18.30 |
ENST00000261427.5
ENST00000510934.1 ENST00000295963.6 |
UBE2K
|
ubiquitin-conjugating enzyme E2K |
| chr12_+_16064258 | 18.27 |
ENST00000524480.1
ENST00000531803.1 ENST00000532964.1 |
DERA
|
deoxyribose-phosphate aldolase (putative) |
| chr3_-_107777208 | 18.20 |
ENST00000398258.3
|
CD47
|
CD47 molecule |
| chr15_-_56285742 | 18.03 |
ENST00000435532.3
|
NEDD4
|
neural precursor cell expressed, developmentally down-regulated 4, E3 ubiquitin protein ligase |
| chr5_+_892745 | 18.01 |
ENST00000166345.3
|
TRIP13
|
thyroid hormone receptor interactor 13 |
| chrX_+_133594168 | 17.90 |
ENST00000298556.7
|
HPRT1
|
hypoxanthine phosphoribosyltransferase 1 |
| chr7_+_135242652 | 17.82 |
ENST00000285968.6
ENST00000440390.2 |
NUP205
|
nucleoporin 205kDa |
| chr16_+_29690358 | 17.77 |
ENST00000395384.4
ENST00000562473.1 |
QPRT
|
quinolinate phosphoribosyltransferase |
| chr9_-_69262509 | 17.72 |
ENST00000377449.1
ENST00000382399.4 ENST00000377439.1 ENST00000377441.1 ENST00000377457.5 |
CBWD6
|
COBW domain containing 6 |
| chr5_-_133561752 | 17.67 |
ENST00000519718.1
ENST00000481195.1 |
CTD-2410N18.5
PPP2CA
|
S-phase kinase-associated protein 1 protein phosphatase 2, catalytic subunit, alpha isozyme |
| chr12_-_90049828 | 17.66 |
ENST00000261173.2
ENST00000348959.3 |
ATP2B1
|
ATPase, Ca++ transporting, plasma membrane 1 |
| chr1_+_45212074 | 17.64 |
ENST00000372217.1
|
KIF2C
|
kinesin family member 2C |
| chr2_-_150444116 | 17.63 |
ENST00000428879.1
ENST00000422782.2 |
MMADHC
|
methylmalonic aciduria (cobalamin deficiency) cblD type, with homocystinuria |
| chr3_-_149095652 | 17.59 |
ENST00000305366.3
|
TM4SF1
|
transmembrane 4 L six family member 1 |
| chr15_-_66649010 | 17.58 |
ENST00000367709.4
ENST00000261881.4 |
TIPIN
|
TIMELESS interacting protein |
| chr11_+_101983176 | 17.56 |
ENST00000524575.1
|
YAP1
|
Yes-associated protein 1 |
| chr14_-_23504337 | 17.53 |
ENST00000361611.6
|
PSMB5
|
proteasome (prosome, macropain) subunit, beta type, 5 |
| chr13_+_28519343 | 17.51 |
ENST00000381026.3
|
ATP5EP2
|
ATP synthase, H+ transporting, mitochondrial F1 complex, epsilon subunit pseudogene 2 |
| chr2_+_198380289 | 17.50 |
ENST00000233892.4
ENST00000409916.1 |
MOB4
|
MOB family member 4, phocein |
| chr18_+_12703002 | 17.48 |
ENST00000590217.1
|
PSMG2
|
proteasome (prosome, macropain) assembly chaperone 2 |
| chr15_+_44092784 | 17.45 |
ENST00000458412.1
|
HYPK
|
huntingtin interacting protein K |
| chr16_-_8955570 | 17.41 |
ENST00000567554.1
|
CARHSP1
|
calcium regulated heat stable protein 1, 24kDa |
| chr6_+_10694900 | 17.25 |
ENST00000379568.3
|
PAK1IP1
|
PAK1 interacting protein 1 |
| chr17_+_18625336 | 17.18 |
ENST00000395671.4
ENST00000571542.1 ENST00000395672.2 ENST00000414850.2 ENST00000424146.2 |
TRIM16L
|
tripartite motif containing 16-like |
| chr2_-_220119280 | 17.15 |
ENST00000392088.2
|
TUBA4A
|
tubulin, alpha 4a |
| chr2_+_58134756 | 17.09 |
ENST00000435505.2
ENST00000417641.2 |
VRK2
|
vaccinia related kinase 2 |
| chr18_+_9103957 | 17.01 |
ENST00000400033.1
|
NDUFV2
|
NADH dehydrogenase (ubiquinone) flavoprotein 2, 24kDa |
| chr17_+_18759612 | 16.99 |
ENST00000432893.2
ENST00000414602.1 ENST00000574522.1 ENST00000570450.1 ENST00000419071.2 |
PRPSAP2
|
phosphoribosyl pyrophosphate synthetase-associated protein 2 |
| chr12_+_53693466 | 16.94 |
ENST00000267103.5
ENST00000548632.1 |
C12orf10
|
chromosome 12 open reading frame 10 |
| chr2_+_201936707 | 16.86 |
ENST00000433898.1
ENST00000454214.1 |
NDUFB3
|
NADH dehydrogenase (ubiquinone) 1 beta subcomplex, 3, 12kDa |
| chrX_-_10851762 | 16.84 |
ENST00000380785.1
ENST00000380787.1 |
MID1
|
midline 1 (Opitz/BBB syndrome) |
| chr2_-_61765315 | 16.83 |
ENST00000406957.1
ENST00000401558.2 |
XPO1
|
exportin 1 (CRM1 homolog, yeast) |
| chr8_-_87526561 | 16.78 |
ENST00000523911.1
|
RMDN1
|
regulator of microtubule dynamics 1 |
| chr1_-_95391315 | 16.78 |
ENST00000545882.1
ENST00000415017.1 |
CNN3
|
calponin 3, acidic |
| chr16_-_67970990 | 16.63 |
ENST00000358514.4
|
PSMB10
|
proteasome (prosome, macropain) subunit, beta type, 10 |
| chr6_-_38670897 | 16.56 |
ENST00000373365.4
|
GLO1
|
glyoxalase I |
| chr19_-_2456922 | 16.55 |
ENST00000582871.1
ENST00000325327.3 |
LMNB2
|
lamin B2 |
| chr2_+_39005336 | 16.51 |
ENST00000409566.1
|
GEMIN6
|
gem (nuclear organelle) associated protein 6 |
| chr1_-_151965048 | 16.47 |
ENST00000368809.1
|
S100A10
|
S100 calcium binding protein A10 |
| chr2_+_73461364 | 16.47 |
ENST00000540468.1
ENST00000539919.1 ENST00000258091.5 |
CCT7
|
chaperonin containing TCP1, subunit 7 (eta) |
| chrX_-_23761317 | 16.44 |
ENST00000492081.1
ENST00000379303.5 ENST00000336430.7 |
ACOT9
|
acyl-CoA thioesterase 9 |
| chrX_+_23682379 | 16.39 |
ENST00000379349.1
|
PRDX4
|
peroxiredoxin 4 |
| chr1_-_110283660 | 16.38 |
ENST00000361066.2
|
GSTM3
|
glutathione S-transferase mu 3 (brain) |
| chr2_+_73461410 | 16.37 |
ENST00000399032.2
ENST00000398422.2 ENST00000537131.1 ENST00000538797.1 |
CCT7
|
chaperonin containing TCP1, subunit 7 (eta) |
| chr3_+_127317066 | 16.35 |
ENST00000265056.7
|
MCM2
|
minichromosome maintenance complex component 2 |
| chr12_+_109535373 | 16.34 |
ENST00000242576.2
|
UNG
|
uracil-DNA glycosylase |
| chr17_+_52978156 | 16.30 |
ENST00000348161.4
|
TOM1L1
|
target of myb1 (chicken)-like 1 |
| chr3_+_133502877 | 16.25 |
ENST00000466490.2
|
SRPRB
|
signal recognition particle receptor, B subunit |
| chr14_+_58711539 | 16.18 |
ENST00000216455.4
ENST00000412908.2 ENST00000557508.1 |
PSMA3
|
proteasome (prosome, macropain) subunit, alpha type, 3 |
| chr19_-_10697895 | 16.10 |
ENST00000591240.1
ENST00000589684.1 ENST00000591676.1 ENST00000250244.6 ENST00000590923.1 |
AP1M2
|
adaptor-related protein complex 1, mu 2 subunit |
| chr1_-_70671216 | 16.10 |
ENST00000370952.3
|
LRRC40
|
leucine rich repeat containing 40 |
| chr12_-_56121612 | 16.09 |
ENST00000546939.1
|
CD63
|
CD63 molecule |
| chr4_+_147096837 | 15.99 |
ENST00000296581.5
ENST00000502781.1 |
LSM6
|
LSM6 homolog, U6 small nuclear RNA associated (S. cerevisiae) |
| chr1_+_155278539 | 15.90 |
ENST00000447866.1
|
FDPS
|
farnesyl diphosphate synthase |
| chr1_-_159894319 | 15.72 |
ENST00000320307.4
|
TAGLN2
|
transgelin 2 |
| chr3_-_48647470 | 15.71 |
ENST00000203407.5
|
UQCRC1
|
ubiquinol-cytochrome c reductase core protein I |
| chr9_-_130966497 | 15.69 |
ENST00000393608.1
ENST00000372948.3 |
CIZ1
|
CDKN1A interacting zinc finger protein 1 |
| chr8_+_26149007 | 15.66 |
ENST00000380737.3
ENST00000524169.1 |
PPP2R2A
|
protein phosphatase 2, regulatory subunit B, alpha |
| chr12_-_76477707 | 15.64 |
ENST00000551992.1
|
NAP1L1
|
nucleosome assembly protein 1-like 1 |
| chr19_+_23299777 | 15.59 |
ENST00000597761.2
|
ZNF730
|
zinc finger protein 730 |
| chr10_+_12238171 | 15.57 |
ENST00000378900.2
ENST00000442050.1 |
CDC123
|
cell division cycle 123 |
| chr8_+_48920960 | 15.54 |
ENST00000523111.2
ENST00000523432.1 ENST00000521346.1 ENST00000517630.1 |
UBE2V2
|
ubiquitin-conjugating enzyme E2 variant 2 |
| chr10_-_129924468 | 15.51 |
ENST00000368653.3
|
MKI67
|
marker of proliferation Ki-67 |
| chr3_+_49058444 | 15.48 |
ENST00000326925.6
ENST00000395458.2 |
NDUFAF3
|
NADH dehydrogenase (ubiquinone) complex I, assembly factor 3 |
| chr3_+_138340067 | 15.48 |
ENST00000479848.1
|
FAIM
|
Fas apoptotic inhibitory molecule |
| chr8_-_54752406 | 15.45 |
ENST00000520188.1
|
ATP6V1H
|
ATPase, H+ transporting, lysosomal 50/57kDa, V1 subunit H |
| chr5_-_146781153 | 15.38 |
ENST00000520473.1
|
DPYSL3
|
dihydropyrimidinase-like 3 |
| chr4_+_57845024 | 15.36 |
ENST00000431623.2
ENST00000441246.2 |
POLR2B
|
polymerase (RNA) II (DNA directed) polypeptide B, 140kDa |
| chr1_+_207262881 | 15.35 |
ENST00000451804.2
|
C4BPB
|
complement component 4 binding protein, beta |
| chr4_-_122744998 | 15.32 |
ENST00000274026.5
|
CCNA2
|
cyclin A2 |
| chr8_+_37887772 | 15.18 |
ENST00000338825.4
|
EIF4EBP1
|
eukaryotic translation initiation factor 4E binding protein 1 |
| chr17_-_8113542 | 15.11 |
ENST00000578549.1
ENST00000535053.1 ENST00000582368.1 |
AURKB
|
aurora kinase B |
| chr5_+_10250328 | 15.10 |
ENST00000515390.1
|
CCT5
|
chaperonin containing TCP1, subunit 5 (epsilon) |
| chr16_+_30087288 | 15.01 |
ENST00000279387.7
ENST00000562664.1 ENST00000562222.1 |
PPP4C
|
protein phosphatase 4, catalytic subunit |
| chr1_+_45212051 | 15.00 |
ENST00000372222.3
|
KIF2C
|
kinesin family member 2C |
| chr8_-_80993010 | 14.96 |
ENST00000537855.1
ENST00000520527.1 ENST00000517427.1 ENST00000448733.2 ENST00000379097.3 |
TPD52
|
tumor protein D52 |
| chr6_-_8102714 | 14.94 |
ENST00000502429.1
ENST00000429723.2 ENST00000507463.1 ENST00000379715.5 |
EEF1E1
|
eukaryotic translation elongation factor 1 epsilon 1 |
| chr12_+_4647950 | 14.93 |
ENST00000321524.7
ENST00000543041.1 ENST00000228843.9 ENST00000352618.4 ENST00000544927.1 |
RAD51AP1
|
RAD51 associated protein 1 |
| chr3_+_172468472 | 14.89 |
ENST00000232458.5
ENST00000392692.3 |
ECT2
|
epithelial cell transforming sequence 2 oncogene |
| chr1_+_151372010 | 14.82 |
ENST00000290541.6
|
PSMB4
|
proteasome (prosome, macropain) subunit, beta type, 4 |
| chr6_+_83073952 | 14.61 |
ENST00000543496.1
|
TPBG
|
trophoblast glycoprotein |
| chr4_+_57843876 | 14.60 |
ENST00000450656.1
ENST00000381227.1 |
POLR2B
|
polymerase (RNA) II (DNA directed) polypeptide B, 140kDa |
| chr2_-_225362533 | 14.58 |
ENST00000451538.1
|
CUL3
|
cullin 3 |
| chr2_+_136343820 | 14.53 |
ENST00000410054.1
|
R3HDM1
|
R3H domain containing 1 |
| chr16_+_28722684 | 14.49 |
ENST00000331666.6
ENST00000395587.1 ENST00000569690.1 ENST00000564243.1 |
EIF3C
|
eukaryotic translation initiation factor 3, subunit C |
| chr3_+_133293278 | 14.44 |
ENST00000508481.1
ENST00000420115.2 ENST00000504867.1 ENST00000507408.1 ENST00000511392.1 ENST00000515421.1 |
CDV3
|
CDV3 homolog (mouse) |
| chr4_-_103749179 | 14.42 |
ENST00000502690.1
|
UBE2D3
|
ubiquitin-conjugating enzyme E2D 3 |
| chr12_+_4758264 | 14.37 |
ENST00000266544.5
|
NDUFA9
|
NADH dehydrogenase (ubiquinone) 1 alpha subcomplex, 9, 39kDa |
| chr3_-_176914238 | 14.37 |
ENST00000430069.1
ENST00000428970.1 |
TBL1XR1
|
transducin (beta)-like 1 X-linked receptor 1 |
| chr14_+_73634537 | 14.35 |
ENST00000406768.1
|
PSEN1
|
presenilin 1 |
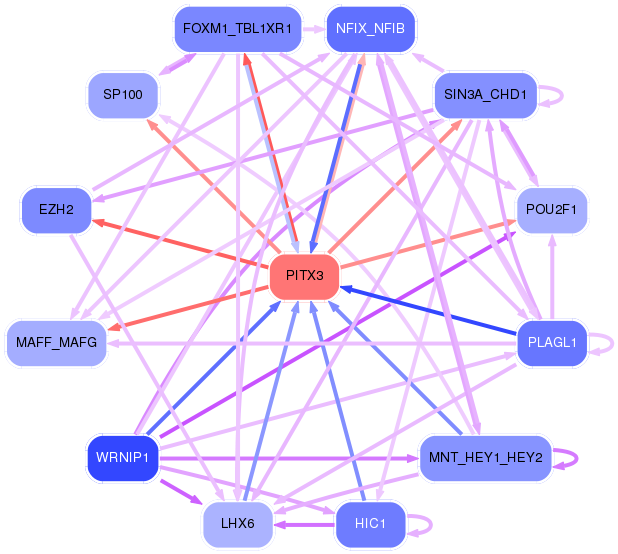
Network of associatons between targets according to the STRING database.

First level regulatory network of PITX3
Gene Ontology Analysis
Gene overrepresentation in biological_process category:
| Log-likelihood per target | Total log-likelihood | Term | Description |
|---|---|---|---|
| 17.7 | 53.0 | GO:0006597 | spermine biosynthetic process(GO:0006597) |
| 15.2 | 76.0 | GO:0014886 | transition between slow and fast fiber(GO:0014886) |
| 13.1 | 39.3 | GO:1900138 | negative regulation of phospholipase A2 activity(GO:1900138) |
| 11.3 | 67.5 | GO:0071163 | DNA replication preinitiation complex assembly(GO:0071163) |
| 10.5 | 41.9 | GO:0002424 | plasmacytoid dendritic cell activation(GO:0002270) T cell mediated immune response to tumor cell(GO:0002424) regulation of T cell mediated immune response to tumor cell(GO:0002840) regulation of restriction endodeoxyribonuclease activity(GO:0032072) negative regulation of apoptotic cell clearance(GO:2000426) |
| 10.5 | 41.8 | GO:0001831 | trophectodermal cellular morphogenesis(GO:0001831) |
| 9.1 | 63.9 | GO:0097577 | intracellular sequestering of iron ion(GO:0006880) sequestering of iron ion(GO:0097577) |
| 9.0 | 27.1 | GO:0051083 | 'de novo' cotranslational protein folding(GO:0051083) |
| 8.9 | 35.5 | GO:0009212 | dTTP biosynthetic process(GO:0006235) pyrimidine deoxyribonucleoside triphosphate biosynthetic process(GO:0009212) transformation of host cell by virus(GO:0019087) |
| 8.2 | 74.0 | GO:0001887 | selenium compound metabolic process(GO:0001887) |
| 7.7 | 76.8 | GO:1900029 | positive regulation of ruffle assembly(GO:1900029) |
| 7.1 | 21.2 | GO:0007518 | myoblast fate determination(GO:0007518) |
| 7.0 | 62.9 | GO:2000623 | regulation of nuclear-transcribed mRNA catabolic process, nonsense-mediated decay(GO:2000622) negative regulation of nuclear-transcribed mRNA catabolic process, nonsense-mediated decay(GO:2000623) |
| 6.8 | 20.5 | GO:1903722 | regulation of centriole elongation(GO:1903722) |
| 6.8 | 20.5 | GO:1901837 | positive regulation of maintenance of sister chromatid cohesion(GO:0034093) positive regulation of maintenance of mitotic sister chromatid cohesion(GO:0034184) negative regulation of transcription of nuclear large rRNA transcript from RNA polymerase I promoter(GO:1901837) negative regulation of protein localization to chromosome, telomeric region(GO:1904815) |
| 6.8 | 68.3 | GO:0030951 | establishment or maintenance of microtubule cytoskeleton polarity(GO:0030951) |
| 6.8 | 27.2 | GO:0046121 | deoxyribonucleoside catabolic process(GO:0046121) |
| 6.6 | 26.3 | GO:1903224 | regulation of endodermal cell differentiation(GO:1903224) |
| 6.5 | 58.9 | GO:0045039 | protein import into mitochondrial inner membrane(GO:0045039) |
| 6.3 | 81.3 | GO:1904869 | regulation of protein localization to Cajal body(GO:1904869) positive regulation of protein localization to Cajal body(GO:1904871) |
| 6.2 | 55.4 | GO:0090267 | positive regulation of mitotic cell cycle spindle assembly checkpoint(GO:0090267) |
| 6.0 | 17.9 | GO:0046098 | hypoxanthine salvage(GO:0043103) guanine metabolic process(GO:0046098) |
| 5.9 | 5.9 | GO:1903625 | negative regulation of DNA catabolic process(GO:1903625) |
| 5.8 | 29.2 | GO:1990034 | calcium ion export from cell(GO:1990034) |
| 5.5 | 22.0 | GO:0043456 | regulation of pentose-phosphate shunt(GO:0043456) |
| 5.5 | 22.0 | GO:0009224 | CMP salvage(GO:0006238) CMP biosynthetic process(GO:0009224) CMP metabolic process(GO:0046035) |
| 5.3 | 47.7 | GO:0048386 | positive regulation of retinoic acid receptor signaling pathway(GO:0048386) |
| 5.3 | 10.5 | GO:1903719 | regulation of I-kappaB phosphorylation(GO:1903719) positive regulation of I-kappaB phosphorylation(GO:1903721) |
| 5.2 | 47.2 | GO:0038007 | netrin-activated signaling pathway(GO:0038007) |
| 5.1 | 25.7 | GO:0033383 | geranyl diphosphate metabolic process(GO:0033383) geranyl diphosphate biosynthetic process(GO:0033384) farnesyl diphosphate biosynthetic process(GO:0045337) |
| 5.0 | 20.2 | GO:1903288 | protein transport into plasma membrane raft(GO:0044861) positive regulation of potassium ion import(GO:1903288) |
| 5.0 | 15.1 | GO:0044878 | mitotic cytokinesis checkpoint(GO:0044878) |
| 4.9 | 29.6 | GO:0007023 | post-chaperonin tubulin folding pathway(GO:0007023) |
| 4.9 | 14.7 | GO:1904481 | response to tetrahydrofolate(GO:1904481) cellular response to tetrahydrofolate(GO:1904482) |
| 4.9 | 63.2 | GO:0000492 | box C/D snoRNP assembly(GO:0000492) |
| 4.8 | 4.8 | GO:1903179 | regulation of dopamine biosynthetic process(GO:1903179) positive regulation of dopamine biosynthetic process(GO:1903181) |
| 4.6 | 46.2 | GO:0051096 | positive regulation of helicase activity(GO:0051096) |
| 4.5 | 18.0 | GO:0044111 | development involved in symbiotic interaction(GO:0044111) |
| 4.5 | 13.5 | GO:1905205 | positive regulation of connective tissue replacement(GO:1905205) |
| 4.5 | 13.5 | GO:1900369 | regulation of RNA interference(GO:1900368) negative regulation of RNA interference(GO:1900369) |
| 4.5 | 13.4 | GO:0051177 | meiotic sister chromatid cohesion(GO:0051177) |
| 4.4 | 53.3 | GO:0006388 | tRNA splicing, via endonucleolytic cleavage and ligation(GO:0006388) |
| 4.4 | 13.2 | GO:0036333 | hepatocyte homeostasis(GO:0036333) response to tetrachloromethane(GO:1904772) |
| 4.4 | 17.5 | GO:0038195 | urokinase plasminogen activator signaling pathway(GO:0038195) |
| 4.3 | 13.0 | GO:2001160 | regulation of genetic imprinting(GO:2000653) regulation of histone H3-K79 methylation(GO:2001160) positive regulation of histone H3-K79 methylation(GO:2001162) |
| 4.3 | 21.6 | GO:0019348 | dolichol metabolic process(GO:0019348) |
| 4.3 | 12.9 | GO:0051066 | dihydrobiopterin metabolic process(GO:0051066) |
| 4.3 | 38.7 | GO:1903027 | regulation of opsonization(GO:1903027) |
| 4.2 | 12.6 | GO:1903630 | regulation of aminoacyl-tRNA ligase activity(GO:1903630) |
| 4.1 | 24.6 | GO:0010608 | posttranscriptional regulation of gene expression(GO:0010608) |
| 4.1 | 32.7 | GO:0032790 | ribosome disassembly(GO:0032790) |
| 4.1 | 12.3 | GO:0006106 | fumarate metabolic process(GO:0006106) aspartate catabolic process(GO:0006533) L-kynurenine metabolic process(GO:0097052) |
| 3.9 | 27.1 | GO:0000056 | ribosomal small subunit export from nucleus(GO:0000056) |
| 3.8 | 15.3 | GO:0071314 | cellular response to cocaine(GO:0071314) |
| 3.8 | 11.4 | GO:1903031 | regulation of microtubule plus-end binding(GO:1903031) positive regulation of microtubule plus-end binding(GO:1903033) |
| 3.8 | 144.1 | GO:2000816 | negative regulation of mitotic sister chromatid separation(GO:2000816) |
| 3.7 | 18.4 | GO:1900264 | regulation of DNA-directed DNA polymerase activity(GO:1900262) positive regulation of DNA-directed DNA polymerase activity(GO:1900264) |
| 3.6 | 10.8 | GO:0032079 | positive regulation of endodeoxyribonuclease activity(GO:0032079) |
| 3.6 | 18.0 | GO:0007144 | female meiosis I(GO:0007144) |
| 3.6 | 28.5 | GO:0010032 | meiotic chromosome condensation(GO:0010032) |
| 3.6 | 17.8 | GO:0072526 | pyridine-containing compound catabolic process(GO:0072526) |
| 3.6 | 21.3 | GO:0090646 | mitochondrial tRNA processing(GO:0090646) |
| 3.5 | 28.2 | GO:0051988 | regulation of attachment of spindle microtubules to kinetochore(GO:0051988) |
| 3.5 | 14.1 | GO:0001971 | negative regulation of activation of membrane attack complex(GO:0001971) |
| 3.5 | 10.5 | GO:2001245 | regulation of phosphatidylcholine biosynthetic process(GO:2001245) |
| 3.5 | 10.4 | GO:1902445 | regulation of mitochondrial membrane permeability involved in programmed necrotic cell death(GO:1902445) |
| 3.4 | 10.3 | GO:0046504 | ether lipid biosynthetic process(GO:0008611) glycerol ether biosynthetic process(GO:0046504) ether biosynthetic process(GO:1901503) |
| 3.4 | 10.1 | GO:0007113 | endomitotic cell cycle(GO:0007113) |
| 3.3 | 19.8 | GO:0032468 | Golgi calcium ion homeostasis(GO:0032468) |
| 3.3 | 16.4 | GO:2000255 | regulation of male germ cell proliferation(GO:2000254) negative regulation of male germ cell proliferation(GO:2000255) |
| 3.3 | 16.4 | GO:0008065 | establishment of blood-nerve barrier(GO:0008065) |
| 3.2 | 41.6 | GO:0051256 | mitotic spindle midzone assembly(GO:0051256) |
| 3.2 | 31.6 | GO:0070141 | response to UV-A(GO:0070141) |
| 3.2 | 28.4 | GO:1902416 | positive regulation of mRNA binding(GO:1902416) |
| 3.1 | 9.4 | GO:0001807 | regulation of type IV hypersensitivity(GO:0001807) positive regulation of female gonad development(GO:2000196) |
| 3.1 | 30.6 | GO:0001833 | inner cell mass cell proliferation(GO:0001833) |
| 3.0 | 12.1 | GO:0031291 | Ran protein signal transduction(GO:0031291) |
| 3.0 | 6.0 | GO:1904751 | positive regulation of protein localization to nucleolus(GO:1904751) |
| 3.0 | 41.5 | GO:0072257 | metanephric nephron tubule epithelial cell differentiation(GO:0072257) regulation of metanephric nephron tubule epithelial cell differentiation(GO:0072307) |
| 2.9 | 14.7 | GO:0051792 | medium-chain fatty acid biosynthetic process(GO:0051792) |
| 2.9 | 11.7 | GO:0000727 | double-strand break repair via break-induced replication(GO:0000727) |
| 2.9 | 8.8 | GO:0006438 | valyl-tRNA aminoacylation(GO:0006438) |
| 2.9 | 8.8 | GO:2000048 | negative regulation of cell-cell adhesion mediated by cadherin(GO:2000048) |
| 2.9 | 8.7 | GO:1902463 | protein localization to cell leading edge(GO:1902463) |
| 2.9 | 2.9 | GO:1901252 | regulation of intracellular transport of viral material(GO:1901252) negative regulation of intracellular transport of viral material(GO:1901253) |
| 2.9 | 28.7 | GO:0008228 | opsonization(GO:0008228) |
| 2.8 | 17.0 | GO:0075525 | viral translational termination-reinitiation(GO:0075525) |
| 2.8 | 53.5 | GO:0045839 | negative regulation of mitotic nuclear division(GO:0045839) |
| 2.8 | 11.2 | GO:1902044 | regulation of Fas signaling pathway(GO:1902044) |
| 2.8 | 47.4 | GO:0035641 | locomotory exploration behavior(GO:0035641) |
| 2.8 | 33.3 | GO:0007084 | mitotic nuclear envelope reassembly(GO:0007084) |
| 2.8 | 11.1 | GO:0030952 | establishment or maintenance of cytoskeleton polarity(GO:0030952) |
| 2.7 | 10.9 | GO:1902361 | mitochondrial pyruvate transport(GO:0006850) mitochondrial pyruvate transmembrane transport(GO:1902361) |
| 2.7 | 5.4 | GO:0006425 | glutaminyl-tRNA aminoacylation(GO:0006425) |
| 2.6 | 10.6 | GO:0007619 | courtship behavior(GO:0007619) |
| 2.6 | 15.9 | GO:0036493 | positive regulation of translation in response to endoplasmic reticulum stress(GO:0036493) |
| 2.6 | 21.0 | GO:0042761 | fatty acid elongation(GO:0030497) very long-chain fatty acid biosynthetic process(GO:0042761) |
| 2.6 | 10.4 | GO:2000825 | positive regulation of androgen receptor activity(GO:2000825) |
| 2.6 | 20.7 | GO:0044387 | negative regulation of protein kinase activity by regulation of protein phosphorylation(GO:0044387) |
| 2.6 | 97.8 | GO:0060261 | positive regulation of transcription initiation from RNA polymerase II promoter(GO:0060261) |
| 2.5 | 43.3 | GO:0032802 | low-density lipoprotein particle receptor catabolic process(GO:0032802) |
| 2.5 | 12.7 | GO:0051511 | regulation of unidimensional cell growth(GO:0051510) negative regulation of unidimensional cell growth(GO:0051511) establishment of cell polarity regulating cell shape(GO:0071964) regulation of establishment or maintenance of cell polarity regulating cell shape(GO:2000769) positive regulation of establishment or maintenance of cell polarity regulating cell shape(GO:2000771) regulation of establishment of cell polarity regulating cell shape(GO:2000782) positive regulation of establishment of cell polarity regulating cell shape(GO:2000784) regulation of barbed-end actin filament capping(GO:2000812) positive regulation of barbed-end actin filament capping(GO:2000814) |
| 2.5 | 10.2 | GO:0048478 | replication fork protection(GO:0048478) |
| 2.5 | 30.3 | GO:0035372 | protein localization to microtubule(GO:0035372) |
| 2.5 | 15.1 | GO:0051563 | smooth endoplasmic reticulum calcium ion homeostasis(GO:0051563) |
| 2.5 | 10.1 | GO:0070981 | L-asparagine biosynthetic process(GO:0070981) L-asparagine metabolic process(GO:0070982) |
| 2.5 | 12.5 | GO:0070370 | heat acclimation(GO:0010286) cellular heat acclimation(GO:0070370) |
| 2.5 | 7.5 | GO:0043311 | positive regulation of eosinophil degranulation(GO:0043311) positive regulation of eosinophil activation(GO:1902568) |
| 2.4 | 7.3 | GO:0044376 | RNA polymerase II complex import to nucleus(GO:0044376) RNA polymerase III complex localization to nucleus(GO:1990022) |
| 2.4 | 9.7 | GO:0051490 | negative regulation of filopodium assembly(GO:0051490) |
| 2.4 | 16.9 | GO:0010792 | DNA double-strand break processing involved in repair via single-strand annealing(GO:0010792) |
| 2.4 | 7.2 | GO:0093001 | glycolysis from storage polysaccharide through glucose-1-phosphate(GO:0093001) |
| 2.4 | 19.1 | GO:0032020 | ISG15-protein conjugation(GO:0032020) |
| 2.4 | 14.3 | GO:0033600 | negative regulation of mammary gland epithelial cell proliferation(GO:0033600) |
| 2.4 | 35.6 | GO:0043248 | proteasome assembly(GO:0043248) |
| 2.4 | 16.6 | GO:0009438 | methylglyoxal metabolic process(GO:0009438) |
| 2.3 | 4.7 | GO:0016095 | polyprenol catabolic process(GO:0016095) |
| 2.3 | 7.0 | GO:0033313 | meiotic cell cycle checkpoint(GO:0033313) |
| 2.3 | 9.3 | GO:0042796 | snRNA transcription from RNA polymerase III promoter(GO:0042796) |
| 2.3 | 9.3 | GO:0072369 | regulation of lipid transport by positive regulation of transcription from RNA polymerase II promoter(GO:0072369) |
| 2.3 | 6.9 | GO:0060447 | bud outgrowth involved in lung branching(GO:0060447) |
| 2.3 | 18.3 | GO:0010993 | regulation of ubiquitin homeostasis(GO:0010993) free ubiquitin chain polymerization(GO:0010994) |
| 2.3 | 13.7 | GO:0036111 | very long-chain fatty-acyl-CoA metabolic process(GO:0036111) |
| 2.3 | 13.6 | GO:0006616 | SRP-dependent cotranslational protein targeting to membrane, translocation(GO:0006616) |
| 2.3 | 18.2 | GO:1901164 | negative regulation of trophoblast cell migration(GO:1901164) |
| 2.2 | 21.7 | GO:0031936 | negative regulation of chromatin silencing(GO:0031936) |
| 2.1 | 158.4 | GO:0010257 | NADH dehydrogenase complex assembly(GO:0010257) mitochondrial respiratory chain complex I assembly(GO:0032981) mitochondrial respiratory chain complex I biogenesis(GO:0097031) |
| 2.1 | 10.7 | GO:0034501 | protein localization to kinetochore(GO:0034501) |
| 2.1 | 99.5 | GO:0006370 | 7-methylguanosine mRNA capping(GO:0006370) |
| 2.1 | 19.0 | GO:0000395 | mRNA 5'-splice site recognition(GO:0000395) |
| 2.1 | 35.8 | GO:0010592 | positive regulation of lamellipodium assembly(GO:0010592) |
| 2.1 | 20.9 | GO:0015939 | pantothenate metabolic process(GO:0015939) |
| 2.1 | 2.1 | GO:0090202 | transcriptional activation by promoter-enhancer looping(GO:0071733) gene looping(GO:0090202) dsDNA loop formation(GO:0090579) |
| 2.1 | 4.1 | GO:0035407 | histone H3-T11 phosphorylation(GO:0035407) |
| 2.1 | 12.4 | GO:0032511 | late endosome to vacuole transport via multivesicular body sorting pathway(GO:0032511) |
| 2.0 | 16.2 | GO:0032968 | positive regulation of transcription elongation from RNA polymerase II promoter(GO:0032968) |
| 2.0 | 20.2 | GO:0043382 | positive regulation of memory T cell differentiation(GO:0043382) |
| 2.0 | 75.8 | GO:0000027 | ribosomal large subunit assembly(GO:0000027) |
| 2.0 | 8.0 | GO:0060633 | negative regulation of transcription initiation from RNA polymerase II promoter(GO:0060633) |
| 2.0 | 7.9 | GO:0046485 | ether lipid metabolic process(GO:0046485) |
| 2.0 | 5.9 | GO:0006566 | threonine metabolic process(GO:0006566) |
| 2.0 | 43.2 | GO:0031163 | iron-sulfur cluster assembly(GO:0016226) metallo-sulfur cluster assembly(GO:0031163) |
| 2.0 | 9.8 | GO:2000676 | positive regulation of type B pancreatic cell apoptotic process(GO:2000676) |
| 1.9 | 87.6 | GO:0006409 | tRNA export from nucleus(GO:0006409) tRNA-containing ribonucleoprotein complex export from nucleus(GO:0071431) |
| 1.9 | 7.8 | GO:0021691 | cerebellar Purkinje cell layer maturation(GO:0021691) |
| 1.9 | 25.1 | GO:1904714 | regulation of chaperone-mediated autophagy(GO:1904714) |
| 1.9 | 5.8 | GO:0031548 | regulation of brain-derived neurotrophic factor receptor signaling pathway(GO:0031548) |
| 1.9 | 40.1 | GO:0006123 | mitochondrial electron transport, cytochrome c to oxygen(GO:0006123) |
| 1.9 | 5.6 | GO:0070902 | mitochondrial tRNA pseudouridine synthesis(GO:0070902) |
| 1.9 | 7.5 | GO:0034476 | U1 snRNA 3'-end processing(GO:0034473) U5 snRNA 3'-end processing(GO:0034476) |
| 1.9 | 13.0 | GO:0008090 | retrograde axonal transport(GO:0008090) |
| 1.8 | 22.1 | GO:0036500 | ATF6-mediated unfolded protein response(GO:0036500) |
| 1.8 | 7.4 | GO:0038165 | oncostatin-M-mediated signaling pathway(GO:0038165) |
| 1.8 | 7.3 | GO:0035964 | COPI-coated vesicle budding(GO:0035964) Golgi transport vesicle coating(GO:0048200) COPI coating of Golgi vesicle(GO:0048205) |
| 1.8 | 1.8 | GO:1902954 | regulation of early endosome to recycling endosome transport(GO:1902954) |
| 1.8 | 5.5 | GO:0071816 | tail-anchored membrane protein insertion into ER membrane(GO:0071816) |
| 1.8 | 16.4 | GO:0006268 | DNA unwinding involved in DNA replication(GO:0006268) |
| 1.8 | 38.0 | GO:0051764 | actin crosslink formation(GO:0051764) |
| 1.8 | 1.8 | GO:0097688 | AMPA glutamate receptor clustering(GO:0097113) glutamate receptor clustering(GO:0097688) |
| 1.8 | 35.8 | GO:0051123 | RNA polymerase II transcriptional preinitiation complex assembly(GO:0051123) |
| 1.8 | 23.2 | GO:2000659 | regulation of interleukin-1-mediated signaling pathway(GO:2000659) |
| 1.8 | 5.4 | GO:0006624 | vacuolar protein processing(GO:0006624) |
| 1.8 | 33.9 | GO:2001046 | positive regulation of integrin-mediated signaling pathway(GO:2001046) |
| 1.8 | 62.4 | GO:0006301 | postreplication repair(GO:0006301) |
| 1.8 | 46.1 | GO:0050434 | positive regulation of viral transcription(GO:0050434) |
| 1.8 | 8.8 | GO:1903527 | positive regulation of membrane tubulation(GO:1903527) |
| 1.8 | 54.6 | GO:0000291 | nuclear-transcribed mRNA catabolic process, exonucleolytic(GO:0000291) exonucleolytic nuclear-transcribed mRNA catabolic process involved in deadenylation-dependent decay(GO:0043928) |
| 1.7 | 5.2 | GO:1903595 | positive regulation of histamine secretion by mast cell(GO:1903595) |
| 1.7 | 5.1 | GO:0048146 | positive regulation of fibroblast proliferation(GO:0048146) |
| 1.7 | 6.8 | GO:0009956 | radial pattern formation(GO:0009956) |
| 1.7 | 25.4 | GO:0032780 | negative regulation of ATPase activity(GO:0032780) |
| 1.7 | 3.4 | GO:0002232 | leukocyte chemotaxis involved in inflammatory response(GO:0002232) |
| 1.7 | 38.8 | GO:0034080 | CENP-A containing nucleosome assembly(GO:0034080) CENP-A containing chromatin organization(GO:0061641) |
| 1.7 | 15.2 | GO:1901836 | regulation of transcription of nuclear large rRNA transcript from RNA polymerase I promoter(GO:1901836) positive regulation of transcription of nuclear large rRNA transcript from RNA polymerase I promoter(GO:1901838) |
| 1.7 | 11.8 | GO:1900246 | positive regulation of RIG-I signaling pathway(GO:1900246) |
| 1.7 | 43.6 | GO:0032201 | telomere maintenance via semi-conservative replication(GO:0032201) |
| 1.7 | 21.6 | GO:1904776 | regulation of protein localization to cell cortex(GO:1904776) positive regulation of protein localization to cell cortex(GO:1904778) |
| 1.6 | 141.5 | GO:1904667 | negative regulation of ubiquitin protein ligase activity(GO:1904667) |
| 1.6 | 8.2 | GO:0019255 | glucose 1-phosphate metabolic process(GO:0019255) |
| 1.6 | 13.1 | GO:0001672 | regulation of chromatin assembly or disassembly(GO:0001672) |
| 1.6 | 50.7 | GO:0032008 | positive regulation of TOR signaling(GO:0032008) |
| 1.6 | 21.2 | GO:0016446 | somatic hypermutation of immunoglobulin genes(GO:0016446) |
| 1.6 | 11.3 | GO:0021847 | ventricular zone neuroblast division(GO:0021847) |
| 1.6 | 11.2 | GO:0042797 | 5S class rRNA transcription from RNA polymerase III type 1 promoter(GO:0042791) tRNA transcription from RNA polymerase III promoter(GO:0042797) |
| 1.6 | 14.1 | GO:1900121 | negative regulation of receptor binding(GO:1900121) |
| 1.6 | 4.7 | GO:1901355 | response to rapamycin(GO:1901355) |
| 1.5 | 10.8 | GO:2000270 | negative regulation of fibroblast apoptotic process(GO:2000270) |
| 1.5 | 34.1 | GO:0070979 | protein K11-linked ubiquitination(GO:0070979) |
| 1.5 | 21.4 | GO:0010569 | regulation of double-strand break repair via homologous recombination(GO:0010569) |
| 1.5 | 6.1 | GO:0061643 | chemorepulsion of dopaminergic neuron axon(GO:0036518) chemorepulsion of axon(GO:0061643) |
| 1.5 | 4.5 | GO:0070966 | nuclear-transcribed mRNA catabolic process, no-go decay(GO:0070966) |
| 1.5 | 4.4 | GO:0071500 | negative stranded viral RNA replication(GO:0039689) multi-organism biosynthetic process(GO:0044034) cellular response to nitrosative stress(GO:0071500) |
| 1.5 | 8.8 | GO:0051708 | intracellular transport of viral protein in host cell(GO:0019060) symbiont intracellular protein transport in host(GO:0030581) intracellular protein transport in other organism involved in symbiotic interaction(GO:0051708) |
| 1.5 | 8.7 | GO:0045716 | positive regulation of low-density lipoprotein particle receptor biosynthetic process(GO:0045716) |
| 1.5 | 4.4 | GO:0019626 | short-chain fatty acid catabolic process(GO:0019626) |
| 1.4 | 24.3 | GO:0016540 | protein autoprocessing(GO:0016540) |
| 1.4 | 20.0 | GO:0070389 | chaperone cofactor-dependent protein refolding(GO:0070389) |
| 1.4 | 15.7 | GO:0006122 | mitochondrial electron transport, ubiquinol to cytochrome c(GO:0006122) |
| 1.4 | 4.3 | GO:2000393 | negative regulation of lamellipodium morphogenesis(GO:2000393) |
| 1.4 | 4.2 | GO:0072711 | cellular response to hydroxyurea(GO:0072711) |
| 1.4 | 18.1 | GO:0001682 | tRNA 5'-leader removal(GO:0001682) |
| 1.4 | 20.9 | GO:0000338 | protein deneddylation(GO:0000338) |
| 1.4 | 4.1 | GO:0017186 | peptidyl-pyroglutamic acid biosynthetic process, using glutaminyl-peptide cyclotransferase(GO:0017186) |
| 1.4 | 11.0 | GO:1903265 | positive regulation of tumor necrosis factor-mediated signaling pathway(GO:1903265) |
| 1.4 | 15.2 | GO:0002192 | IRES-dependent translational initiation(GO:0002192) |
| 1.4 | 8.2 | GO:0046459 | short-chain fatty acid metabolic process(GO:0046459) |
| 1.4 | 6.8 | GO:0010724 | regulation of definitive erythrocyte differentiation(GO:0010724) |
| 1.4 | 9.5 | GO:0045329 | carnitine biosynthetic process(GO:0045329) |
| 1.3 | 10.8 | GO:0007498 | mesoderm development(GO:0007498) |
| 1.3 | 26.7 | GO:0051983 | regulation of chromosome segregation(GO:0051983) |
| 1.3 | 4.0 | GO:0006423 | cysteinyl-tRNA aminoacylation(GO:0006423) |
| 1.3 | 32.0 | GO:0032435 | negative regulation of proteasomal ubiquitin-dependent protein catabolic process(GO:0032435) |
| 1.3 | 54.3 | GO:0015985 | energy coupled proton transport, down electrochemical gradient(GO:0015985) ATP synthesis coupled proton transport(GO:0015986) |
| 1.3 | 3.9 | GO:0060613 | fat pad development(GO:0060613) |
| 1.3 | 7.9 | GO:1902956 | regulation of mitochondrial electron transport, NADH to ubiquinone(GO:1902956) negative regulation of mitochondrial electron transport, NADH to ubiquinone(GO:1902957) |
| 1.3 | 11.6 | GO:0071712 | ER-associated misfolded protein catabolic process(GO:0071712) |
| 1.3 | 35.4 | GO:0090383 | phagosome acidification(GO:0090383) |
| 1.3 | 3.8 | GO:0060574 | intestinal epithelial cell maturation(GO:0060574) |
| 1.3 | 11.3 | GO:0006552 | leucine catabolic process(GO:0006552) |
| 1.3 | 10.0 | GO:0000733 | DNA strand renaturation(GO:0000733) |
| 1.2 | 51.1 | GO:0034314 | Arp2/3 complex-mediated actin nucleation(GO:0034314) |
| 1.2 | 4.9 | GO:2000230 | negative regulation of pancreatic stellate cell proliferation(GO:2000230) |
| 1.2 | 84.3 | GO:0070125 | mitochondrial translational elongation(GO:0070125) mitochondrial translational termination(GO:0070126) |
| 1.2 | 3.7 | GO:1904579 | response to thapsigargin(GO:1904578) cellular response to thapsigargin(GO:1904579) |
| 1.2 | 2.4 | GO:0048936 | peripheral nervous system neuron axonogenesis(GO:0048936) |
| 1.2 | 8.4 | GO:0089700 | protein kinase D signaling(GO:0089700) |
| 1.2 | 7.2 | GO:2000323 | negative regulation of glucocorticoid receptor signaling pathway(GO:2000323) |
| 1.2 | 5.9 | GO:0046532 | regulation of photoreceptor cell differentiation(GO:0046532) |
| 1.2 | 13.0 | GO:0006782 | protoporphyrinogen IX biosynthetic process(GO:0006782) |
| 1.2 | 4.7 | GO:0052405 | negative regulation by host of symbiont molecular function(GO:0052405) |
| 1.2 | 7.0 | GO:0070934 | CRD-mediated mRNA stabilization(GO:0070934) |
| 1.2 | 9.3 | GO:0032364 | peptidyl-proline hydroxylation to 4-hydroxy-L-proline(GO:0018401) oxygen homeostasis(GO:0032364) |
| 1.2 | 17.3 | GO:0097264 | self proteolysis(GO:0097264) |
| 1.2 | 3.5 | GO:0048075 | positive regulation of eye pigmentation(GO:0048075) |
| 1.1 | 2.3 | GO:1901725 | regulation of histone deacetylase activity(GO:1901725) |
| 1.1 | 5.7 | GO:0009137 | purine nucleoside diphosphate catabolic process(GO:0009137) purine ribonucleoside diphosphate catabolic process(GO:0009181) |
| 1.1 | 3.4 | GO:0070541 | response to platinum ion(GO:0070541) |
| 1.1 | 10.3 | GO:0072513 | positive regulation of secondary heart field cardioblast proliferation(GO:0072513) |
| 1.1 | 4.5 | GO:0014038 | regulation of Schwann cell differentiation(GO:0014038) positive regulation of Schwann cell differentiation(GO:0014040) |
| 1.1 | 5.6 | GO:0070900 | positive regulation of mitochondrial translation(GO:0070131) mitochondrial tRNA modification(GO:0070900) mitochondrial RNA modification(GO:1900864) |
| 1.1 | 12.2 | GO:0030150 | protein import into mitochondrial matrix(GO:0030150) |
| 1.1 | 6.7 | GO:0010801 | negative regulation of peptidyl-threonine phosphorylation(GO:0010801) |
| 1.1 | 23.6 | GO:0052695 | cellular glucuronidation(GO:0052695) |
| 1.1 | 9.6 | GO:0045793 | positive regulation of cell size(GO:0045793) |
| 1.1 | 14.9 | GO:2000774 | positive regulation of cellular senescence(GO:2000774) |
| 1.1 | 3.2 | GO:1902303 | regulation of heart rate by hormone(GO:0003064) negative regulation of potassium ion export(GO:1902303) |
| 1.1 | 3.2 | GO:0044205 | 'de novo' UMP biosynthetic process(GO:0044205) |
| 1.1 | 3.2 | GO:0009051 | pentose-phosphate shunt, oxidative branch(GO:0009051) |
| 1.1 | 14.7 | GO:0030050 | vesicle transport along actin filament(GO:0030050) |
| 1.0 | 22.0 | GO:0003334 | keratinocyte development(GO:0003334) |
| 1.0 | 3.1 | GO:1900063 | regulation of peroxisome organization(GO:1900063) |
| 1.0 | 6.2 | GO:0099515 | actin filament-based transport(GO:0099515) |
| 1.0 | 3.1 | GO:0038098 | sequestering of BMP from receptor via BMP binding(GO:0038098) |
| 1.0 | 33.1 | GO:0031572 | G2 DNA damage checkpoint(GO:0031572) |
| 1.0 | 2.0 | GO:0016553 | base conversion or substitution editing(GO:0016553) cytidine to uridine editing(GO:0016554) |
| 1.0 | 15.9 | GO:0001765 | membrane raft assembly(GO:0001765) |
| 1.0 | 42.5 | GO:0000387 | spliceosomal snRNP assembly(GO:0000387) |
| 1.0 | 4.8 | GO:0010637 | negative regulation of mitochondrial fusion(GO:0010637) |
| 1.0 | 4.8 | GO:0035063 | nuclear speck organization(GO:0035063) |
| 1.0 | 18.1 | GO:0006516 | glycoprotein catabolic process(GO:0006516) |
| 0.9 | 10.1 | GO:0006610 | ribosomal protein import into nucleus(GO:0006610) |
| 0.9 | 10.1 | GO:0051601 | exocyst localization(GO:0051601) |
| 0.9 | 6.2 | GO:0032445 | fructose transport(GO:0015755) fructose import(GO:0032445) carbohydrate import into cell(GO:0097319) carbohydrate import across plasma membrane(GO:0098704) fructose import across plasma membrane(GO:1990539) |
| 0.9 | 8.0 | GO:0070973 | protein localization to endoplasmic reticulum exit site(GO:0070973) |
| 0.9 | 8.7 | GO:0046051 | UTP biosynthetic process(GO:0006228) UTP metabolic process(GO:0046051) |
| 0.9 | 4.3 | GO:0033133 | positive regulation of glucokinase activity(GO:0033133) positive regulation of hexokinase activity(GO:1903301) |
| 0.9 | 3.4 | GO:0000103 | sulfate assimilation(GO:0000103) |
| 0.9 | 10.3 | GO:0035338 | long-chain fatty-acyl-CoA biosynthetic process(GO:0035338) |
| 0.9 | 2.6 | GO:1903598 | positive regulation of gap junction assembly(GO:1903598) |
| 0.8 | 3.4 | GO:0048698 | negative regulation of collateral sprouting in absence of injury(GO:0048698) |
| 0.8 | 5.0 | GO:0033211 | adiponectin-activated signaling pathway(GO:0033211) |
| 0.8 | 5.6 | GO:0051026 | chiasma assembly(GO:0051026) |
| 0.8 | 23.1 | GO:0000042 | protein targeting to Golgi(GO:0000042) |
| 0.8 | 2.4 | GO:1903371 | regulation of endoplasmic reticulum tubular network organization(GO:1903371) |
| 0.8 | 31.8 | GO:0043044 | ATP-dependent chromatin remodeling(GO:0043044) |
| 0.8 | 3.8 | GO:0015862 | uridine transport(GO:0015862) |
| 0.8 | 3.0 | GO:2000253 | positive regulation of feeding behavior(GO:2000253) |
| 0.8 | 6.0 | GO:0071044 | histone mRNA catabolic process(GO:0071044) |
| 0.7 | 1.5 | GO:0044818 | mitotic DNA replication checkpoint(GO:0033314) mitotic G2/M transition checkpoint(GO:0044818) |
| 0.7 | 7.3 | GO:0031468 | nuclear envelope reassembly(GO:0031468) |
| 0.7 | 16.0 | GO:0000038 | very long-chain fatty acid metabolic process(GO:0000038) |
| 0.7 | 2.9 | GO:0072205 | metanephric collecting duct development(GO:0072205) |
| 0.7 | 5.0 | GO:0036438 | maintenance of lens transparency(GO:0036438) |
| 0.7 | 4.2 | GO:0006741 | NADP biosynthetic process(GO:0006741) |
| 0.7 | 12.6 | GO:0045717 | negative regulation of fatty acid biosynthetic process(GO:0045717) |
| 0.7 | 2.8 | GO:0019249 | lactate biosynthetic process(GO:0019249) |
| 0.7 | 7.0 | GO:0042373 | vitamin K metabolic process(GO:0042373) |
| 0.7 | 2.8 | GO:2001288 | positive regulation of caveolin-mediated endocytosis(GO:2001288) |
| 0.7 | 4.9 | GO:0070127 | tRNA aminoacylation for mitochondrial protein translation(GO:0070127) |
| 0.7 | 2.8 | GO:0097021 | Peyer's patch morphogenesis(GO:0061146) lymphocyte migration into lymphoid organs(GO:0097021) |
| 0.7 | 3.4 | GO:0038031 | non-canonical Wnt signaling pathway via JNK cascade(GO:0038031) |
| 0.7 | 3.4 | GO:0016476 | regulation of embryonic cell shape(GO:0016476) |
| 0.7 | 2.0 | GO:0048631 | regulation of skeletal muscle tissue growth(GO:0048631) |
| 0.7 | 5.4 | GO:0034128 | negative regulation of MyD88-independent toll-like receptor signaling pathway(GO:0034128) |
| 0.7 | 4.7 | GO:0051415 | interphase microtubule nucleation by interphase microtubule organizing center(GO:0051415) microtubule nucleation by microtubule organizing center(GO:0051418) |
| 0.7 | 4.0 | GO:0032099 | negative regulation of response to food(GO:0032096) negative regulation of appetite(GO:0032099) |
| 0.7 | 5.3 | GO:0061087 | positive regulation of histone H3-K27 methylation(GO:0061087) |
| 0.7 | 4.0 | GO:0009441 | glycolate metabolic process(GO:0009441) |
| 0.7 | 5.9 | GO:0043305 | negative regulation of mast cell degranulation(GO:0043305) |
| 0.7 | 2.6 | GO:1902902 | negative regulation of autophagosome assembly(GO:1902902) |
| 0.6 | 4.4 | GO:1902969 | mitotic DNA replication(GO:1902969) |
| 0.6 | 8.7 | GO:0043457 | regulation of cellular respiration(GO:0043457) |
| 0.6 | 2.5 | GO:0035803 | egg coat formation(GO:0035803) |
| 0.6 | 8.1 | GO:0010739 | positive regulation of protein kinase A signaling(GO:0010739) |
| 0.6 | 6.2 | GO:0030422 | production of siRNA involved in RNA interference(GO:0030422) |
| 0.6 | 4.9 | GO:1901843 | positive regulation of high voltage-gated calcium channel activity(GO:1901843) |
| 0.6 | 10.7 | GO:0051014 | actin filament severing(GO:0051014) |
| 0.6 | 3.0 | GO:0002479 | antigen processing and presentation of exogenous peptide antigen via MHC class I, TAP-dependent(GO:0002479) |
| 0.6 | 4.7 | GO:0048050 | post-embryonic eye morphogenesis(GO:0048050) |
| 0.6 | 3.5 | GO:0090400 | stress-induced premature senescence(GO:0090400) |
| 0.6 | 1.8 | GO:0033341 | regulation of collagen binding(GO:0033341) |
| 0.6 | 9.3 | GO:0006750 | glutathione biosynthetic process(GO:0006750) |
| 0.6 | 2.9 | GO:0006574 | valine catabolic process(GO:0006574) |
| 0.6 | 15.8 | GO:0045948 | positive regulation of translational initiation(GO:0045948) |
| 0.6 | 0.6 | GO:0072282 | metanephric nephron tubule morphogenesis(GO:0072282) |
| 0.6 | 5.6 | GO:0042407 | cristae formation(GO:0042407) |
| 0.6 | 6.1 | GO:0000463 | maturation of LSU-rRNA from tricistronic rRNA transcript (SSU-rRNA, 5.8S rRNA, LSU-rRNA)(GO:0000463) |
| 0.6 | 20.5 | GO:0042273 | ribosomal large subunit biogenesis(GO:0042273) |
| 0.5 | 5.5 | GO:0015014 | heparan sulfate proteoglycan biosynthetic process, polysaccharide chain biosynthetic process(GO:0015014) |
| 0.5 | 2.1 | GO:0042357 | thiamine diphosphate metabolic process(GO:0042357) |
| 0.5 | 3.2 | GO:0070070 | proton-transporting V-type ATPase complex assembly(GO:0070070) vacuolar proton-transporting V-type ATPase complex assembly(GO:0070072) |
| 0.5 | 4.3 | GO:0072733 | response to staurosporine(GO:0072733) cellular response to staurosporine(GO:0072734) |
| 0.5 | 4.3 | GO:0006931 | substrate-dependent cell migration, cell attachment to substrate(GO:0006931) |
| 0.5 | 3.7 | GO:0006307 | DNA dealkylation involved in DNA repair(GO:0006307) |
| 0.5 | 1.0 | GO:0036022 | limb joint morphogenesis(GO:0036022) embryonic skeletal limb joint morphogenesis(GO:0036023) |
| 0.5 | 6.2 | GO:0006825 | copper ion transport(GO:0006825) |
| 0.5 | 21.0 | GO:0007029 | endoplasmic reticulum organization(GO:0007029) |
| 0.5 | 5.1 | GO:0033327 | Leydig cell differentiation(GO:0033327) |
| 0.5 | 7.1 | GO:0006488 | dolichol-linked oligosaccharide biosynthetic process(GO:0006488) |
| 0.5 | 11.6 | GO:0043968 | histone H2A acetylation(GO:0043968) |
| 0.5 | 4.5 | GO:1900119 | positive regulation of execution phase of apoptosis(GO:1900119) |
| 0.5 | 36.0 | GO:0045454 | cell redox homeostasis(GO:0045454) |
| 0.5 | 3.5 | GO:0015712 | hexose phosphate transport(GO:0015712) glucose-6-phosphate transport(GO:0015760) |
| 0.5 | 5.0 | GO:0051451 | myoblast migration(GO:0051451) |
| 0.5 | 12.9 | GO:0016339 | calcium-dependent cell-cell adhesion via plasma membrane cell adhesion molecules(GO:0016339) |
| 0.5 | 2.0 | GO:0003409 | optic cup structural organization(GO:0003409) |
| 0.5 | 1.5 | GO:0061110 | dense core granule biogenesis(GO:0061110) regulation of dense core granule biogenesis(GO:2000705) |
| 0.5 | 2.9 | GO:0033152 | immunoglobulin V(D)J recombination(GO:0033152) |
| 0.5 | 33.5 | GO:0007062 | sister chromatid cohesion(GO:0007062) |
| 0.5 | 3.4 | GO:0048312 | intracellular distribution of mitochondria(GO:0048312) |
| 0.5 | 25.5 | GO:0018279 | protein N-linked glycosylation via asparagine(GO:0018279) |
| 0.5 | 6.2 | GO:2000675 | negative regulation of type B pancreatic cell apoptotic process(GO:2000675) |
| 0.5 | 1.9 | GO:0044351 | macropinocytosis(GO:0044351) |
| 0.5 | 1.4 | GO:0033499 | galactose catabolic process via UDP-galactose(GO:0033499) |
| 0.5 | 5.2 | GO:0015886 | heme transport(GO:0015886) |
| 0.5 | 1.4 | GO:0002322 | B cell proliferation involved in immune response(GO:0002322) |
| 0.5 | 11.7 | GO:0009235 | cobalamin metabolic process(GO:0009235) |
| 0.5 | 4.6 | GO:0071372 | cellular response to follicle-stimulating hormone stimulus(GO:0071372) |
| 0.5 | 2.8 | GO:0090240 | positive regulation of histone H4 acetylation(GO:0090240) |
| 0.5 | 3.7 | GO:1900016 | negative regulation of cytokine production involved in inflammatory response(GO:1900016) |
| 0.5 | 1.8 | GO:0061046 | foregut regionalization(GO:0060423) lung field specification(GO:0060424) lung induction(GO:0060492) regulation of branching involved in lung morphogenesis(GO:0061046) positive regulation of branching involved in lung morphogenesis(GO:0061047) |
| 0.5 | 1.8 | GO:1900193 | regulation of oocyte maturation(GO:1900193) negative regulation of oocyte maturation(GO:1900194) |
| 0.5 | 3.2 | GO:0030091 | protein repair(GO:0030091) |
| 0.4 | 6.6 | GO:0002227 | innate immune response in mucosa(GO:0002227) |
| 0.4 | 3.5 | GO:0051591 | response to cAMP(GO:0051591) |
| 0.4 | 2.6 | GO:1902237 | positive regulation of endoplasmic reticulum stress-induced intrinsic apoptotic signaling pathway(GO:1902237) |
| 0.4 | 3.0 | GO:0007097 | nuclear migration(GO:0007097) |
| 0.4 | 4.2 | GO:0000715 | nucleotide-excision repair, DNA damage recognition(GO:0000715) |
| 0.4 | 5.8 | GO:0090190 | positive regulation of branching involved in ureteric bud morphogenesis(GO:0090190) |
| 0.4 | 3.7 | GO:0015691 | cadmium ion transport(GO:0015691) cadmium ion transmembrane transport(GO:0070574) |
| 0.4 | 2.1 | GO:0048839 | inner ear development(GO:0048839) |
| 0.4 | 8.4 | GO:0048025 | negative regulation of mRNA splicing, via spliceosome(GO:0048025) |
| 0.4 | 4.0 | GO:0070365 | hepatocyte differentiation(GO:0070365) |
| 0.4 | 2.0 | GO:0034334 | adherens junction maintenance(GO:0034334) |
| 0.4 | 2.8 | GO:0048672 | positive regulation of collateral sprouting(GO:0048672) |
| 0.4 | 5.5 | GO:1901386 | negative regulation of voltage-gated calcium channel activity(GO:1901386) |
| 0.4 | 1.2 | GO:0033194 | response to hydroperoxide(GO:0033194) |
| 0.4 | 4.7 | GO:0010666 | positive regulation of striated muscle cell apoptotic process(GO:0010663) positive regulation of cardiac muscle cell apoptotic process(GO:0010666) |
| 0.4 | 8.8 | GO:0061003 | positive regulation of dendritic spine morphogenesis(GO:0061003) |
| 0.4 | 1.9 | GO:0061002 | negative regulation of dendritic spine morphogenesis(GO:0061002) |
| 0.4 | 23.0 | GO:0051881 | regulation of mitochondrial membrane potential(GO:0051881) |
| 0.4 | 1.5 | GO:0006783 | heme biosynthetic process(GO:0006783) |
| 0.4 | 6.7 | GO:0035855 | megakaryocyte development(GO:0035855) |
| 0.4 | 4.7 | GO:0034384 | high-density lipoprotein particle clearance(GO:0034384) |
| 0.4 | 2.1 | GO:0018022 | peptidyl-lysine methylation(GO:0018022) |
| 0.4 | 16.6 | GO:0010501 | RNA secondary structure unwinding(GO:0010501) |
| 0.3 | 8.9 | GO:0008156 | negative regulation of DNA replication(GO:0008156) |
| 0.3 | 5.1 | GO:0050961 | detection of temperature stimulus involved in sensory perception(GO:0050961) detection of temperature stimulus involved in sensory perception of pain(GO:0050965) |
| 0.3 | 4.1 | GO:0019321 | pentose metabolic process(GO:0019321) |
| 0.3 | 4.3 | GO:0031648 | protein destabilization(GO:0031648) |
| 0.3 | 2.9 | GO:0034198 | cellular response to amino acid starvation(GO:0034198) |
| 0.3 | 1.3 | GO:0061368 | behavioral response to chemical pain(GO:0061366) behavioral response to formalin induced pain(GO:0061368) |
| 0.3 | 1.0 | GO:0070244 | negative regulation of thymocyte apoptotic process(GO:0070244) |
| 0.3 | 1.9 | GO:0071569 | protein ufmylation(GO:0071569) protein polyufmylation(GO:1990564) protein K69-linked ufmylation(GO:1990592) |
| 0.3 | 2.2 | GO:0046600 | negative regulation of centriole replication(GO:0046600) |
| 0.3 | 5.1 | GO:0070911 | global genome nucleotide-excision repair(GO:0070911) |
| 0.3 | 1.6 | GO:0097105 | presynaptic membrane assembly(GO:0097105) |
| 0.3 | 0.6 | GO:1904628 | response to phorbol 13-acetate 12-myristate(GO:1904627) cellular response to phorbol 13-acetate 12-myristate(GO:1904628) |
| 0.3 | 0.9 | GO:0009298 | GDP-mannose biosynthetic process(GO:0009298) |
| 0.3 | 5.1 | GO:0048255 | mRNA stabilization(GO:0048255) |
| 0.3 | 9.0 | GO:0043304 | regulation of mast cell activation involved in immune response(GO:0033006) regulation of mast cell degranulation(GO:0043304) |
| 0.3 | 4.2 | GO:0006020 | inositol metabolic process(GO:0006020) |
| 0.3 | 2.4 | GO:0048733 | sebaceous gland development(GO:0048733) |
| 0.3 | 0.9 | GO:0090362 | positive regulation of platelet-derived growth factor production(GO:0090362) |
| 0.3 | 9.2 | GO:0006699 | bile acid biosynthetic process(GO:0006699) |
| 0.3 | 32.3 | GO:0006614 | SRP-dependent cotranslational protein targeting to membrane(GO:0006614) |
| 0.3 | 11.4 | GO:0071470 | cellular response to osmotic stress(GO:0071470) |
| 0.3 | 5.8 | GO:0016254 | preassembly of GPI anchor in ER membrane(GO:0016254) |
| 0.3 | 4.0 | GO:0007567 | parturition(GO:0007567) |
| 0.3 | 7.1 | GO:0050873 | brown fat cell differentiation(GO:0050873) |
| 0.3 | 7.9 | GO:0006891 | intra-Golgi vesicle-mediated transport(GO:0006891) |
| 0.3 | 1.1 | GO:0035720 | intraciliary anterograde transport(GO:0035720) |
| 0.3 | 6.5 | GO:0048935 | peripheral nervous system neuron differentiation(GO:0048934) peripheral nervous system neuron development(GO:0048935) |
| 0.3 | 0.8 | GO:0032875 | regulation of DNA endoreduplication(GO:0032875) DNA endoreduplication(GO:0042023) |
| 0.3 | 0.5 | GO:1904504 | lipophagy(GO:0061724) regulation of lipophagy(GO:1904502) positive regulation of lipophagy(GO:1904504) |
| 0.3 | 1.6 | GO:0046548 | retinal rod cell development(GO:0046548) |
| 0.3 | 3.5 | GO:0046475 | glycerophospholipid catabolic process(GO:0046475) |
| 0.2 | 4.7 | GO:0010738 | regulation of protein kinase A signaling(GO:0010738) |
| 0.2 | 3.7 | GO:0033081 | regulation of T cell differentiation in thymus(GO:0033081) regulation of thymocyte aggregation(GO:2000398) |
| 0.2 | 4.5 | GO:0006359 | regulation of transcription from RNA polymerase III promoter(GO:0006359) |
| 0.2 | 3.2 | GO:0071670 | smooth muscle cell chemotaxis(GO:0071670) |
| 0.2 | 0.2 | GO:0000965 | mitochondrial RNA 3'-end processing(GO:0000965) |
| 0.2 | 9.8 | GO:0042795 | snRNA transcription(GO:0009301) snRNA transcription from RNA polymerase II promoter(GO:0042795) |
| 0.2 | 0.7 | GO:1902938 | phospholipase C-activating G-protein coupled glutamate receptor signaling pathway(GO:0007206) regulation of intracellular calcium activated chloride channel activity(GO:1902938) |
| 0.2 | 19.2 | GO:0006334 | nucleosome assembly(GO:0006334) |
| 0.2 | 3.8 | GO:0071294 | cellular response to zinc ion(GO:0071294) |
| 0.2 | 3.2 | GO:0060117 | auditory receptor cell development(GO:0060117) |
| 0.2 | 12.8 | GO:0051965 | positive regulation of synapse assembly(GO:0051965) |
| 0.2 | 14.3 | GO:0071427 | mRNA export from nucleus(GO:0006406) mRNA-containing ribonucleoprotein complex export from nucleus(GO:0071427) |
| 0.2 | 2.0 | GO:1902236 | negative regulation of endoplasmic reticulum stress-induced intrinsic apoptotic signaling pathway(GO:1902236) |
| 0.2 | 5.0 | GO:0051894 | positive regulation of focal adhesion assembly(GO:0051894) |
| 0.2 | 0.8 | GO:0034243 | regulation of transcription elongation from RNA polymerase II promoter(GO:0034243) |
| 0.2 | 6.3 | GO:0051972 | regulation of telomerase activity(GO:0051972) |
| 0.2 | 8.1 | GO:0002576 | platelet degranulation(GO:0002576) |
| 0.2 | 14.0 | GO:0043488 | regulation of mRNA stability(GO:0043488) |
| 0.2 | 2.9 | GO:0035024 | negative regulation of Rho protein signal transduction(GO:0035024) |
| 0.2 | 1.0 | GO:0007468 | regulation of rhodopsin gene expression(GO:0007468) |
| 0.2 | 1.2 | GO:0048268 | clathrin coat assembly(GO:0048268) |
| 0.2 | 4.2 | GO:0086069 | bundle of His cell to Purkinje myocyte communication(GO:0086069) |
| 0.2 | 6.0 | GO:0007340 | acrosome reaction(GO:0007340) |
| 0.2 | 1.2 | GO:0051549 | positive regulation of keratinocyte migration(GO:0051549) |
| 0.2 | 10.4 | GO:0006261 | DNA-dependent DNA replication(GO:0006261) |
| 0.2 | 1.4 | GO:0070305 | response to cGMP(GO:0070305) |
| 0.2 | 14.8 | GO:0036498 | IRE1-mediated unfolded protein response(GO:0036498) |
| 0.2 | 1.0 | GO:0042492 | gamma-delta T cell differentiation(GO:0042492) |
| 0.2 | 10.2 | GO:0006890 | retrograde vesicle-mediated transport, Golgi to ER(GO:0006890) |
| 0.2 | 1.5 | GO:1905146 | lysosomal protein catabolic process(GO:1905146) |
| 0.2 | 6.8 | GO:0006879 | cellular iron ion homeostasis(GO:0006879) |
| 0.2 | 19.7 | GO:0030705 | cytoskeleton-dependent intracellular transport(GO:0030705) |
| 0.2 | 0.5 | GO:0060370 | susceptibility to T cell mediated cytotoxicity(GO:0060370) |
| 0.2 | 2.1 | GO:1903204 | negative regulation of oxidative stress-induced neuron death(GO:1903204) |
| 0.2 | 1.1 | GO:0070986 | left/right axis specification(GO:0070986) |
| 0.2 | 4.9 | GO:0000381 | regulation of alternative mRNA splicing, via spliceosome(GO:0000381) |
| 0.2 | 1.4 | GO:0032534 | regulation of microvillus assembly(GO:0032534) |
| 0.2 | 0.5 | GO:1903121 | regulation of transcription from RNA polymerase II promoter in response to arsenic-containing substance(GO:0061394) regulation of TRAIL-activated apoptotic signaling pathway(GO:1903121) positive regulation of TRAIL-activated apoptotic signaling pathway(GO:1903984) positive regulation of transcription from RNA polymerase II promoter in response to endoplasmic reticulum stress(GO:1990440) |
| 0.2 | 0.3 | GO:0010513 | positive regulation of phosphatidylinositol biosynthetic process(GO:0010513) |
| 0.2 | 2.5 | GO:0032515 | negative regulation of phosphoprotein phosphatase activity(GO:0032515) |
| 0.2 | 12.9 | GO:0060337 | type I interferon signaling pathway(GO:0060337) cellular response to type I interferon(GO:0071357) |
| 0.2 | 1.1 | GO:0098735 | positive regulation of the force of heart contraction(GO:0098735) |
| 0.2 | 0.8 | GO:0060356 | leucine import(GO:0060356) |
| 0.2 | 2.6 | GO:0032098 | regulation of appetite(GO:0032098) |
| 0.2 | 0.5 | GO:0032581 | ER-dependent peroxisome organization(GO:0032581) |
| 0.1 | 0.6 | GO:0048295 | isotype switching to IgE isotypes(GO:0048289) regulation of isotype switching to IgE isotypes(GO:0048293) positive regulation of isotype switching to IgE isotypes(GO:0048295) |
| 0.1 | 3.8 | GO:0006739 | NADP metabolic process(GO:0006739) |
| 0.1 | 2.8 | GO:0008045 | motor neuron axon guidance(GO:0008045) |
| 0.1 | 0.6 | GO:1990167 | protein K27-linked deubiquitination(GO:1990167) |
| 0.1 | 0.4 | GO:0044332 | Wnt signaling pathway involved in dorsal/ventral axis specification(GO:0044332) |
| 0.1 | 5.0 | GO:0021795 | cerebral cortex cell migration(GO:0021795) |
| 0.1 | 11.3 | GO:0006626 | protein targeting to mitochondrion(GO:0006626) |
| 0.1 | 1.8 | GO:0006309 | apoptotic DNA fragmentation(GO:0006309) |
| 0.1 | 1.7 | GO:0046069 | cGMP catabolic process(GO:0046069) |
| 0.1 | 0.4 | GO:0061743 | motor learning(GO:0061743) |
| 0.1 | 6.7 | GO:0045333 | cellular respiration(GO:0045333) |
| 0.1 | 1.1 | GO:0034138 | toll-like receptor 3 signaling pathway(GO:0034138) |
| 0.1 | 0.9 | GO:0003360 | brainstem development(GO:0003360) |
| 0.1 | 7.8 | GO:0035383 | acyl-CoA metabolic process(GO:0006637) thioester metabolic process(GO:0035383) |
| 0.1 | 1.2 | GO:0010727 | negative regulation of hydrogen peroxide metabolic process(GO:0010727) |
| 0.1 | 1.2 | GO:0006657 | CDP-choline pathway(GO:0006657) |
| 0.1 | 1.2 | GO:0048245 | eosinophil chemotaxis(GO:0048245) |
| 0.1 | 1.6 | GO:0090331 | negative regulation of platelet aggregation(GO:0090331) |
| 0.1 | 3.6 | GO:0045071 | negative regulation of viral genome replication(GO:0045071) |
| 0.1 | 0.3 | GO:0097498 | endothelial tube lumen extension(GO:0097498) |
| 0.1 | 5.4 | GO:0071277 | cellular response to calcium ion(GO:0071277) |
| 0.1 | 0.2 | GO:2000321 | positive regulation of T-helper 17 type immune response(GO:2000318) positive regulation of T-helper 17 cell differentiation(GO:2000321) |
| 0.1 | 1.5 | GO:0046676 | negative regulation of insulin secretion(GO:0046676) negative regulation of peptide hormone secretion(GO:0090278) |
| 0.1 | 4.5 | GO:0006695 | cholesterol biosynthetic process(GO:0006695) |
| 0.1 | 3.9 | GO:0042267 | natural killer cell mediated cytotoxicity(GO:0042267) |
| 0.1 | 6.0 | GO:0006892 | post-Golgi vesicle-mediated transport(GO:0006892) |
| 0.1 | 0.2 | GO:0044210 | 'de novo' CTP biosynthetic process(GO:0044210) |
| 0.1 | 5.9 | GO:0006903 | vesicle targeting(GO:0006903) |
| 0.1 | 1.8 | GO:0031581 | hemidesmosome assembly(GO:0031581) |
| 0.1 | 4.3 | GO:0050772 | positive regulation of axonogenesis(GO:0050772) |
| 0.1 | 0.8 | GO:1901522 | positive regulation of transcription from RNA polymerase II promoter involved in cellular response to chemical stimulus(GO:1901522) |
| 0.1 | 0.2 | GO:0048840 | otolith development(GO:0048840) |
| 0.1 | 5.3 | GO:0034332 | adherens junction organization(GO:0034332) |
| 0.1 | 0.1 | GO:2000767 | positive regulation of cytoplasmic translation(GO:2000767) |
| 0.1 | 1.0 | GO:0007398 | ectoderm development(GO:0007398) |
| 0.1 | 0.9 | GO:0042149 | cellular response to glucose starvation(GO:0042149) |
| 0.1 | 1.7 | GO:0043550 | regulation of lipid kinase activity(GO:0043550) |
| 0.1 | 0.6 | GO:0060512 | prostate gland morphogenesis(GO:0060512) |
| 0.1 | 4.7 | GO:0000910 | cytokinesis(GO:0000910) |
| 0.1 | 1.0 | GO:0006656 | phosphatidylcholine biosynthetic process(GO:0006656) |
| 0.0 | 0.5 | GO:0050832 | defense response to fungus(GO:0050832) |
| 0.0 | 0.4 | GO:0015937 | coenzyme A biosynthetic process(GO:0015937) |
| 0.0 | 0.2 | GO:0018243 | protein O-linked glycosylation via threonine(GO:0018243) |
| 0.0 | 0.8 | GO:1904888 | cranial skeletal system development(GO:1904888) |
| 0.0 | 0.3 | GO:0034058 | endosomal vesicle fusion(GO:0034058) |
| 0.0 | 1.8 | GO:0016575 | histone deacetylation(GO:0016575) |
| 0.0 | 0.7 | GO:0031167 | rRNA methylation(GO:0031167) |
| 0.0 | 2.2 | GO:0008344 | adult locomotory behavior(GO:0008344) |
| 0.0 | 0.3 | GO:0034356 | NAD biosynthesis via nicotinamide riboside salvage pathway(GO:0034356) |
| 0.0 | 0.4 | GO:0060828 | regulation of canonical Wnt signaling pathway(GO:0060828) |
| 0.0 | 0.3 | GO:0070236 | regulation of activation-induced cell death of T cells(GO:0070235) negative regulation of activation-induced cell death of T cells(GO:0070236) |
| 0.0 | 0.1 | GO:2001137 | positive regulation of endocytic recycling(GO:2001137) |
| 0.0 | 0.2 | GO:0009886 | post-embryonic morphogenesis(GO:0009886) |
| 0.0 | 0.5 | GO:0035235 | ionotropic glutamate receptor signaling pathway(GO:0035235) |
| 0.0 | 0.4 | GO:0005513 | detection of calcium ion(GO:0005513) |
| 0.0 | 0.2 | GO:0090003 | regulation of establishment of protein localization to plasma membrane(GO:0090003) |
| 0.0 | 0.1 | GO:0015722 | canalicular bile acid transport(GO:0015722) glycerol transport(GO:0015793) |
| 0.0 | 0.1 | GO:0003095 | pressure natriuresis(GO:0003095) |
| 0.0 | 0.1 | GO:0008582 | regulation of synaptic growth at neuromuscular junction(GO:0008582) |
| 0.0 | 0.4 | GO:0010718 | positive regulation of epithelial to mesenchymal transition(GO:0010718) |
| 0.0 | 0.4 | GO:0007264 | small GTPase mediated signal transduction(GO:0007264) |
| 0.0 | 0.1 | GO:0033353 | S-adenosylmethionine cycle(GO:0033353) |
| 0.0 | 0.1 | GO:0009642 | response to light intensity(GO:0009642) |
Gene overrepresentation in cellular_component category:
| Log-likelihood per target | Total log-likelihood | Term | Description |
|---|---|---|---|
| 14.7 | 58.9 | GO:0042721 | mitochondrial inner membrane protein insertion complex(GO:0042721) |
| 11.9 | 35.8 | GO:0036195 | muscle cell projection(GO:0036194) muscle cell projection membrane(GO:0036195) |
| 11.3 | 22.6 | GO:0032432 | actin filament bundle(GO:0032432) |
| 8.4 | 58.9 | GO:0044326 | dendritic spine neck(GO:0044326) |
| 8.3 | 33.1 | GO:1990423 | RZZ complex(GO:1990423) |
| 7.9 | 39.7 | GO:0071986 | Ragulator complex(GO:0071986) |
| 7.7 | 23.2 | GO:0031372 | UBC13-MMS2 complex(GO:0031372) |
| 7.7 | 30.6 | GO:0000811 | GINS complex(GO:0000811) |
| 7.5 | 59.6 | GO:0016012 | sarcoglycan complex(GO:0016012) |
| 7.3 | 36.5 | GO:0008622 | epsilon DNA polymerase complex(GO:0008622) |
| 7.2 | 21.6 | GO:0033185 | dolichol-phosphate-mannose synthase complex(GO:0033185) |
| 7.1 | 21.4 | GO:0005588 | collagen type V trimer(GO:0005588) |
| 6.7 | 20.2 | GO:0035370 | UBC13-UEV1A complex(GO:0035370) |
| 6.7 | 47.0 | GO:0072669 | tRNA-splicing ligase complex(GO:0072669) |
| 6.3 | 81.3 | GO:0002199 | zona pellucida receptor complex(GO:0002199) |
| 6.2 | 18.5 | GO:0002079 | inner acrosomal membrane(GO:0002079) |
| 6.1 | 48.9 | GO:0070761 | pre-snoRNP complex(GO:0070761) |
| 6.1 | 36.5 | GO:0031313 | extrinsic component of endosome membrane(GO:0031313) |
| 6.0 | 24.2 | GO:0002189 | ribose phosphate diphosphokinase complex(GO:0002189) |
| 5.9 | 94.4 | GO:0019774 | proteasome core complex, beta-subunit complex(GO:0019774) |
| 5.9 | 29.4 | GO:0032021 | NELF complex(GO:0032021) |
| 5.3 | 21.1 | GO:0031510 | SUMO activating enzyme complex(GO:0031510) |
| 5.2 | 41.9 | GO:0097504 | Gemini of coiled bodies(GO:0097504) |
| 5.2 | 62.4 | GO:0031595 | nuclear proteasome complex(GO:0031595) |
| 5.1 | 15.3 | GO:0097124 | cyclin A2-CDK2 complex(GO:0097124) |
| 5.1 | 15.2 | GO:0034455 | t-UTP complex(GO:0034455) |
| 5.0 | 15.0 | GO:0030289 | protein phosphatase 4 complex(GO:0030289) |
| 4.8 | 28.9 | GO:0031298 | replication fork protection complex(GO:0031298) |
| 4.7 | 9.4 | GO:0002081 | outer acrosomal membrane(GO:0002081) |
| 4.6 | 73.8 | GO:0031080 | nuclear pore outer ring(GO:0031080) |
| 4.6 | 41.4 | GO:0005827 | polar microtubule(GO:0005827) |
| 4.5 | 13.6 | GO:0030981 | cortical microtubule cytoskeleton(GO:0030981) |
| 4.5 | 17.8 | GO:0044611 | nuclear pore inner ring(GO:0044611) |
| 3.9 | 19.3 | GO:0000221 | vacuolar proton-transporting V-type ATPase, V1 domain(GO:0000221) |
| 3.8 | 42.2 | GO:0005688 | U6 snRNP(GO:0005688) |
| 3.8 | 11.4 | GO:0031262 | Ndc80 complex(GO:0031262) |
| 3.6 | 25.0 | GO:0005785 | signal recognition particle receptor complex(GO:0005785) |
| 3.5 | 17.6 | GO:0071148 | TEAD-1-YAP complex(GO:0071148) |
| 3.4 | 20.5 | GO:0001740 | Barr body(GO:0001740) |
| 3.4 | 17.0 | GO:0045272 | plasma membrane respiratory chain complex I(GO:0045272) |
| 3.4 | 20.3 | GO:0031390 | Ctf18 RFC-like complex(GO:0031390) |
| 3.4 | 26.9 | GO:0070552 | BRISC complex(GO:0070552) |
| 3.3 | 30.0 | GO:0033588 | Elongator holoenzyme complex(GO:0033588) |
| 3.3 | 16.4 | GO:0030678 | mitochondrial ribonuclease P complex(GO:0030678) |
| 3.3 | 13.1 | GO:0043625 | delta DNA polymerase complex(GO:0043625) |
| 3.1 | 27.8 | GO:0005638 | lamin filament(GO:0005638) |
| 3.1 | 9.2 | GO:0032302 | MutSbeta complex(GO:0032302) |
| 3.0 | 9.1 | GO:0097489 | multivesicular body, internal vesicle lumen(GO:0097489) |
| 3.0 | 8.9 | GO:0071159 | NF-kappaB complex(GO:0071159) |
| 3.0 | 14.9 | GO:0097149 | centralspindlin complex(GO:0097149) |
| 2.9 | 38.0 | GO:0097470 | ribbon synapse(GO:0097470) |
| 2.9 | 22.9 | GO:0032133 | chromosome passenger complex(GO:0032133) |
| 2.9 | 8.6 | GO:0034665 | integrin alpha1-beta1 complex(GO:0034665) |
| 2.9 | 28.5 | GO:0000796 | condensin complex(GO:0000796) |
| 2.8 | 47.4 | GO:0005885 | Arp2/3 protein complex(GO:0005885) |
| 2.7 | 68.2 | GO:0005852 | eukaryotic translation initiation factor 3 complex(GO:0005852) |
| 2.6 | 23.3 | GO:0097487 | multivesicular body, internal vesicle(GO:0097487) |
| 2.6 | 25.5 | GO:0030126 | COPI vesicle coat(GO:0030126) |
| 2.5 | 25.2 | GO:0005853 | eukaryotic translation elongation factor 1 complex(GO:0005853) |
| 2.5 | 45.3 | GO:0000276 | mitochondrial proton-transporting ATP synthase complex, coupling factor F(o)(GO:0000276) |
| 2.5 | 17.5 | GO:0000275 | mitochondrial proton-transporting ATP synthase complex, catalytic core F(1)(GO:0000275) |
| 2.5 | 74.9 | GO:0005665 | DNA-directed RNA polymerase II, core complex(GO:0005665) |
| 2.4 | 22.0 | GO:0008541 | proteasome regulatory particle, lid subcomplex(GO:0008541) |
| 2.4 | 28.9 | GO:0008250 | oligosaccharyltransferase complex(GO:0008250) |
| 2.4 | 28.8 | GO:0045120 | pronucleus(GO:0045120) |
| 2.4 | 35.8 | GO:0097431 | mitotic spindle pole(GO:0097431) |
| 2.3 | 23.1 | GO:0016593 | Cdc73/Paf1 complex(GO:0016593) |
| 2.3 | 11.3 | GO:1905202 | 3-methylcrotonyl-CoA carboxylase complex, mitochondrial(GO:0002169) methylcrotonoyl-CoA carboxylase complex(GO:1905202) |
| 2.2 | 52.6 | GO:0035371 | microtubule plus-end(GO:0035371) |
| 2.2 | 41.2 | GO:0036020 | endolysosome membrane(GO:0036020) |
| 2.2 | 8.7 | GO:0001405 | presequence translocase-associated import motor(GO:0001405) |
| 2.1 | 27.6 | GO:0000243 | commitment complex(GO:0000243) |
| 2.1 | 8.2 | GO:0045121 | membrane raft(GO:0045121) membrane microdomain(GO:0098857) |
| 2.0 | 18.4 | GO:0071438 | invadopodium membrane(GO:0071438) |
| 2.0 | 24.3 | GO:0005642 | annulate lamellae(GO:0005642) |
| 2.0 | 4.0 | GO:0012505 | endomembrane system(GO:0012505) |
| 2.0 | 8.0 | GO:0005846 | nuclear cap binding complex(GO:0005846) |
| 2.0 | 37.8 | GO:0034663 | endoplasmic reticulum chaperone complex(GO:0034663) |
| 2.0 | 9.8 | GO:0034388 | Pwp2p-containing subcomplex of 90S preribosome(GO:0034388) |
| 2.0 | 37.1 | GO:1990124 | messenger ribonucleoprotein complex(GO:1990124) |
| 1.9 | 13.6 | GO:0048500 | signal recognition particle, endoplasmic reticulum targeting(GO:0005786) signal recognition particle(GO:0048500) |
| 1.9 | 11.6 | GO:0008537 | proteasome activator complex(GO:0008537) |
| 1.9 | 13.5 | GO:0005955 | calcineurin complex(GO:0005955) |
| 1.9 | 26.9 | GO:0005751 | mitochondrial respiratory chain complex IV(GO:0005751) |
| 1.9 | 28.0 | GO:0032433 | filopodium tip(GO:0032433) |
| 1.8 | 38.8 | GO:0017101 | aminoacyl-tRNA synthetase multienzyme complex(GO:0017101) |
| 1.8 | 3.7 | GO:0035869 | ciliary transition zone(GO:0035869) |
| 1.8 | 7.3 | GO:1990730 | VCP-NSFL1C complex(GO:1990730) |
| 1.8 | 14.3 | GO:0097255 | R2TP complex(GO:0097255) |
| 1.8 | 48.3 | GO:0000314 | organellar small ribosomal subunit(GO:0000314) mitochondrial small ribosomal subunit(GO:0005763) |
| 1.7 | 15.7 | GO:0045275 | mitochondrial respiratory chain complex III(GO:0005750) respiratory chain complex III(GO:0045275) |
| 1.7 | 7.0 | GO:0030896 | checkpoint clamp complex(GO:0030896) |
| 1.7 | 13.5 | GO:0008540 | proteasome regulatory particle, base subcomplex(GO:0008540) |
| 1.7 | 16.5 | GO:0000439 | core TFIIH complex(GO:0000439) |
| 1.6 | 11.5 | GO:0071203 | WASH complex(GO:0071203) |
| 1.6 | 62.4 | GO:0005762 | organellar large ribosomal subunit(GO:0000315) mitochondrial large ribosomal subunit(GO:0005762) |
| 1.6 | 27.8 | GO:0005839 | proteasome core complex(GO:0005839) |
| 1.6 | 11.3 | GO:0035032 | phosphatidylinositol 3-kinase complex, class III(GO:0035032) |
| 1.6 | 4.8 | GO:0030906 | retromer, cargo-selective complex(GO:0030906) |
| 1.6 | 11.2 | GO:0000127 | transcription factor TFIIIC complex(GO:0000127) |
| 1.6 | 6.4 | GO:0005968 | Rab-protein geranylgeranyltransferase complex(GO:0005968) |
| 1.6 | 20.5 | GO:0000815 | ESCRT III complex(GO:0000815) |
| 1.6 | 6.3 | GO:0000214 | tRNA-intron endonuclease complex(GO:0000214) |
| 1.5 | 7.7 | GO:0070847 | core mediator complex(GO:0070847) |
| 1.5 | 89.4 | GO:0030964 | mitochondrial respiratory chain complex I(GO:0005747) NADH dehydrogenase complex(GO:0030964) respiratory chain complex I(GO:0045271) |
| 1.5 | 14.9 | GO:0070937 | CRD-mediated mRNA stability complex(GO:0070937) |
| 1.4 | 7.2 | GO:0005945 | 6-phosphofructokinase complex(GO:0005945) |
| 1.4 | 10.0 | GO:0005672 | transcription factor TFIIA complex(GO:0005672) |
| 1.4 | 12.8 | GO:0000940 | condensed chromosome outer kinetochore(GO:0000940) |
| 1.4 | 22.5 | GO:0033276 | transcription factor TFTC complex(GO:0033276) |
| 1.4 | 18.1 | GO:0030677 | ribonuclease P complex(GO:0030677) multimeric ribonuclease P complex(GO:0030681) |
| 1.4 | 12.4 | GO:0061574 | ASAP complex(GO:0061574) |
| 1.3 | 8.1 | GO:0033061 | DNA recombinase mediator complex(GO:0033061) Rad51B-Rad51C-Rad51D-XRCC2 complex(GO:0033063) |
| 1.3 | 6.7 | GO:0044530 | supraspliceosomal complex(GO:0044530) |
| 1.3 | 18.7 | GO:0017119 | Golgi transport complex(GO:0017119) |
| 1.3 | 9.2 | GO:0005753 | mitochondrial proton-transporting ATP synthase complex(GO:0005753) |
| 1.3 | 18.0 | GO:0001673 | male germ cell nucleus(GO:0001673) |
| 1.3 | 10.2 | GO:0005851 | eukaryotic translation initiation factor 2B complex(GO:0005851) |
| 1.3 | 22.7 | GO:0033162 | melanosome membrane(GO:0033162) chitosome(GO:0045009) |
| 1.3 | 21.5 | GO:0000177 | cytoplasmic exosome (RNase complex)(GO:0000177) |
| 1.3 | 3.8 | GO:0070557 | PCNA-p21 complex(GO:0070557) |
| 1.3 | 16.4 | GO:0005664 | origin recognition complex(GO:0000808) nuclear origin of replication recognition complex(GO:0005664) MCM complex(GO:0042555) |
| 1.2 | 8.7 | GO:0044194 | cytolytic granule(GO:0044194) |
| 1.2 | 8.7 | GO:0030870 | Mre11 complex(GO:0030870) |
| 1.2 | 13.4 | GO:0035686 | sperm fibrous sheath(GO:0035686) |
| 1.2 | 17.1 | GO:0044754 | autolysosome(GO:0044754) |
| 1.2 | 26.0 | GO:0032591 | dendritic spine membrane(GO:0032591) |
| 1.2 | 4.7 | GO:0008275 | gamma-tubulin small complex(GO:0008275) |
| 1.2 | 65.7 | GO:0045171 | intercellular bridge(GO:0045171) |
| 1.2 | 16.4 | GO:0008091 | spectrin(GO:0008091) |
| 1.1 | 7.9 | GO:0036513 | Derlin-1 retrotranslocation complex(GO:0036513) |
| 1.1 | 3.2 | GO:0043291 | RAVE complex(GO:0043291) |
| 1.0 | 74.9 | GO:0000777 | condensed chromosome kinetochore(GO:0000777) |
| 1.0 | 13.2 | GO:0030478 | actin cap(GO:0030478) |
| 1.0 | 51.4 | GO:0005881 | cytoplasmic microtubule(GO:0005881) |
| 1.0 | 9.7 | GO:0090543 | Flemming body(GO:0090543) |
| 1.0 | 19.1 | GO:0005790 | smooth endoplasmic reticulum(GO:0005790) |
| 1.0 | 6.7 | GO:0033269 | internode region of axon(GO:0033269) |
| 0.9 | 7.4 | GO:0005744 | mitochondrial inner membrane presequence translocase complex(GO:0005744) |
| 0.9 | 16.5 | GO:0005890 | sodium:potassium-exchanging ATPase complex(GO:0005890) |
| 0.9 | 25.6 | GO:0031307 | integral component of mitochondrial outer membrane(GO:0031307) |
| 0.9 | 90.4 | GO:0017053 | transcriptional repressor complex(GO:0017053) |
| 0.9 | 7.8 | GO:0008024 | cyclin/CDK positive transcription elongation factor complex(GO:0008024) |
| 0.9 | 3.5 | GO:0031085 | BLOC-3 complex(GO:0031085) |
| 0.9 | 0.9 | GO:0012507 | ER to Golgi transport vesicle membrane(GO:0012507) |
| 0.8 | 6.7 | GO:0005869 | dynactin complex(GO:0005869) |
| 0.8 | 3.3 | GO:0043541 | UDP-N-acetylglucosamine transferase complex(GO:0043541) |
| 0.8 | 23.2 | GO:0031143 | pseudopodium(GO:0031143) |
| 0.8 | 23.0 | GO:0005680 | anaphase-promoting complex(GO:0005680) |
| 0.8 | 3.2 | GO:0046696 | lipopolysaccharide receptor complex(GO:0046696) |
| 0.8 | 7.3 | GO:0016461 | unconventional myosin complex(GO:0016461) |
| 0.8 | 8.8 | GO:0030008 | TRAPP complex(GO:0030008) |
| 0.8 | 5.6 | GO:0061617 | MICOS complex(GO:0061617) |
| 0.8 | 16.8 | GO:0000922 | spindle pole(GO:0000922) |
| 0.8 | 37.3 | GO:0042645 | nucleoid(GO:0009295) mitochondrial nucleoid(GO:0042645) |
| 0.8 | 18.2 | GO:0000776 | kinetochore(GO:0000776) |
| 0.8 | 20.4 | GO:1902562 | NuA4 histone acetyltransferase complex(GO:0035267) H4/H2A histone acetyltransferase complex(GO:0043189) H4 histone acetyltransferase complex(GO:1902562) |
| 0.8 | 10.0 | GO:0016600 | flotillin complex(GO:0016600) |
| 0.7 | 1.5 | GO:0070939 | Dsl1p complex(GO:0070939) |
| 0.7 | 4.4 | GO:0034274 | Atg12-Atg5-Atg16 complex(GO:0034274) |
| 0.7 | 12.5 | GO:0097228 | sperm principal piece(GO:0097228) |
| 0.7 | 21.8 | GO:0005697 | telomerase holoenzyme complex(GO:0005697) |
| 0.7 | 12.3 | GO:0031932 | TORC2 complex(GO:0031932) |
| 0.7 | 70.7 | GO:0022625 | cytosolic large ribosomal subunit(GO:0022625) |
| 0.7 | 5.3 | GO:0005915 | zonula adherens(GO:0005915) |
| 0.7 | 20.9 | GO:0008180 | COP9 signalosome(GO:0008180) |
| 0.7 | 22.1 | GO:0000159 | protein phosphatase type 2A complex(GO:0000159) |
| 0.6 | 3.2 | GO:1902937 | inward rectifier potassium channel complex(GO:1902937) |
| 0.6 | 18.0 | GO:0000502 | proteasome complex(GO:0000502) |
| 0.6 | 3.1 | GO:0032592 | integral component of mitochondrial membrane(GO:0032592) |
| 0.6 | 14.0 | GO:0030686 | 90S preribosome(GO:0030686) |
| 0.6 | 10.3 | GO:0005868 | cytoplasmic dynein complex(GO:0005868) |
| 0.6 | 10.1 | GO:0000145 | exocyst(GO:0000145) |
| 0.6 | 29.1 | GO:0002102 | podosome(GO:0002102) |
| 0.6 | 4.0 | GO:0000812 | Swr1 complex(GO:0000812) |
| 0.5 | 15.4 | GO:0031941 | filamentous actin(GO:0031941) |
| 0.5 | 1.0 | GO:0045263 | proton-transporting ATP synthase complex, coupling factor F(o)(GO:0045263) |
| 0.5 | 6.7 | GO:0031209 | SCAR complex(GO:0031209) |
| 0.5 | 2.0 | GO:0031417 | NatC complex(GO:0031417) |
| 0.5 | 5.5 | GO:0031362 | anchored component of external side of plasma membrane(GO:0031362) |
| 0.5 | 3.5 | GO:0005854 | nascent polypeptide-associated complex(GO:0005854) |
| 0.5 | 65.4 | GO:0001650 | fibrillar center(GO:0001650) |
| 0.5 | 51.2 | GO:0097517 | stress fiber(GO:0001725) contractile actin filament bundle(GO:0097517) |
| 0.5 | 3.8 | GO:0031465 | Cul4B-RING E3 ubiquitin ligase complex(GO:0031465) |
| 0.5 | 4.8 | GO:0030015 | CCR4-NOT core complex(GO:0030015) |
| 0.5 | 2.4 | GO:0035867 | alphav-beta3 integrin-IGF-1-IGF1R complex(GO:0035867) |
| 0.5 | 16.3 | GO:0030131 | clathrin adaptor complex(GO:0030131) |
| 0.5 | 14.0 | GO:0016592 | mediator complex(GO:0016592) |
| 0.4 | 109.9 | GO:0005743 | mitochondrial inner membrane(GO:0005743) |
| 0.4 | 10.7 | GO:0071339 | MLL1/2 complex(GO:0044665) MLL1 complex(GO:0071339) |
| 0.4 | 7.1 | GO:0016442 | RISC complex(GO:0016442) RNAi effector complex(GO:0031332) |
| 0.4 | 7.0 | GO:0016471 | vacuolar proton-transporting V-type ATPase complex(GO:0016471) |
| 0.4 | 2.6 | GO:0072557 | IPAF inflammasome complex(GO:0072557) |
| 0.4 | 4.3 | GO:0051233 | spindle midzone(GO:0051233) |
| 0.4 | 13.1 | GO:0031258 | lamellipodium membrane(GO:0031258) |
| 0.4 | 3.8 | GO:0032039 | integrator complex(GO:0032039) |
| 0.4 | 45.4 | GO:0042470 | melanosome(GO:0042470) pigment granule(GO:0048770) |
| 0.4 | 8.2 | GO:0030867 | rough endoplasmic reticulum membrane(GO:0030867) |
| 0.4 | 31.0 | GO:0005778 | peroxisomal membrane(GO:0005778) microbody membrane(GO:0031903) |
| 0.4 | 1.6 | GO:0035838 | growing cell tip(GO:0035838) |
| 0.4 | 27.7 | GO:0005758 | mitochondrial intermembrane space(GO:0005758) |
| 0.4 | 5.6 | GO:0016514 | SWI/SNF complex(GO:0016514) |
| 0.4 | 7.6 | GO:0005876 | spindle microtubule(GO:0005876) |
| 0.4 | 3.2 | GO:0032420 | stereocilium(GO:0032420) |
| 0.3 | 29.0 | GO:0000793 | condensed chromosome(GO:0000793) |
| 0.3 | 37.2 | GO:0005903 | brush border(GO:0005903) |
| 0.3 | 48.4 | GO:0005795 | Golgi stack(GO:0005795) |
| 0.3 | 35.2 | GO:0005802 | trans-Golgi network(GO:0005802) |
| 0.3 | 2.3 | GO:0019908 | cyclin-dependent protein kinase activating kinase holoenzyme complex(GO:0019907) nuclear cyclin-dependent protein kinase holoenzyme complex(GO:0019908) |
| 0.3 | 1.6 | GO:0005577 | fibrinogen complex(GO:0005577) |
| 0.3 | 53.3 | GO:0005938 | cell cortex(GO:0005938) |
| 0.2 | 1.2 | GO:0032593 | insulin-responsive compartment(GO:0032593) |
| 0.2 | 3.0 | GO:0030669 | clathrin-coated endocytic vesicle membrane(GO:0030669) |
| 0.2 | 14.7 | GO:0019866 | organelle inner membrane(GO:0019866) |
| 0.2 | 8.8 | GO:0044216 | other organism(GO:0044215) other organism cell(GO:0044216) other organism part(GO:0044217) |
| 0.2 | 0.6 | GO:0033179 | proton-transporting V-type ATPase, V0 domain(GO:0033179) |
| 0.2 | 1.0 | GO:0030688 | preribosome, small subunit precursor(GO:0030688) |
| 0.2 | 0.6 | GO:0097058 | CRLF-CLCF1 complex(GO:0097058) CNTFR-CLCF1 complex(GO:0097059) |
| 0.2 | 1.8 | GO:0030056 | hemidesmosome(GO:0030056) |
| 0.2 | 0.9 | GO:0072357 | PTW/PP1 phosphatase complex(GO:0072357) |
| 0.2 | 3.0 | GO:0030687 | preribosome, large subunit precursor(GO:0030687) |
| 0.2 | 0.5 | GO:1990622 | CHOP-ATF3 complex(GO:1990622) |
| 0.2 | 4.4 | GO:0031966 | mitochondrial membrane(GO:0031966) |
| 0.1 | 13.5 | GO:0031968 | organelle outer membrane(GO:0031968) |
| 0.1 | 0.4 | GO:0032279 | asymmetric synapse(GO:0032279) |
| 0.1 | 0.4 | GO:0000308 | cytoplasmic cyclin-dependent protein kinase holoenzyme complex(GO:0000308) |
| 0.1 | 10.5 | GO:0005913 | cell-cell adherens junction(GO:0005913) |
| 0.1 | 0.5 | GO:0031211 | palmitoyltransferase complex(GO:0002178) serine C-palmitoyltransferase complex(GO:0017059) endoplasmic reticulum palmitoyltransferase complex(GO:0031211) |
| 0.1 | 7.9 | GO:0031463 | Cul3-RING ubiquitin ligase complex(GO:0031463) |
| 0.1 | 0.5 | GO:0019867 | outer membrane(GO:0019867) |
| 0.1 | 2.7 | GO:0008023 | transcription elongation factor complex(GO:0008023) |
| 0.1 | 2.1 | GO:0030140 | trans-Golgi network transport vesicle(GO:0030140) |
| 0.1 | 9.3 | GO:0005882 | intermediate filament(GO:0005882) |
| 0.1 | 1.2 | GO:0071782 | endoplasmic reticulum tubular network(GO:0071782) |
| 0.1 | 0.2 | GO:0043020 | NADPH oxidase complex(GO:0043020) |
| 0.1 | 1.9 | GO:0031092 | platelet alpha granule membrane(GO:0031092) |
| 0.1 | 12.7 | GO:1904813 | ficolin-1-rich granule(GO:0101002) ficolin-1-rich granule lumen(GO:1904813) |
| 0.1 | 1.9 | GO:0005844 | polysome(GO:0005844) |
| 0.1 | 4.1 | GO:0031519 | PcG protein complex(GO:0031519) |
| 0.1 | 33.0 | GO:0005635 | nuclear envelope(GO:0005635) |
| 0.1 | 0.4 | GO:1990031 | pinceau fiber(GO:1990031) |
| 0.1 | 4.0 | GO:0044815 | nucleosome(GO:0000786) DNA packaging complex(GO:0044815) |
| 0.1 | 2.1 | GO:0032154 | cleavage furrow(GO:0032154) cell surface furrow(GO:0097610) |
| 0.1 | 35.6 | GO:0005730 | nucleolus(GO:0005730) |
| 0.1 | 2.8 | GO:0030027 | lamellipodium(GO:0030027) |
| 0.1 | 0.3 | GO:0033263 | CORVET complex(GO:0033263) |
| 0.1 | 21.1 | GO:0016607 | nuclear speck(GO:0016607) |
| 0.1 | 8.3 | GO:0044420 | extracellular matrix component(GO:0044420) |
| 0.0 | 0.2 | GO:0072559 | NLRP3 inflammasome complex(GO:0072559) |
| 0.0 | 2.1 | GO:0015629 | actin cytoskeleton(GO:0015629) |
| 0.0 | 0.6 | GO:0000307 | cyclin-dependent protein kinase holoenzyme complex(GO:0000307) |
| 0.0 | 1.2 | GO:0055038 | recycling endosome membrane(GO:0055038) |
| 0.0 | 1.3 | GO:0001669 | acrosomal vesicle(GO:0001669) |
| 0.0 | 1.5 | GO:0005840 | ribosome(GO:0005840) |
| 0.0 | 0.6 | GO:0005791 | rough endoplasmic reticulum(GO:0005791) |
| 0.0 | 0.0 | GO:0001917 | photoreceptor inner segment(GO:0001917) |
| 0.0 | 0.1 | GO:0032389 | MutLalpha complex(GO:0032389) |
| 0.0 | 0.1 | GO:0071011 | precatalytic spliceosome(GO:0071011) |
| 0.0 | 23.9 | GO:0005654 | nucleoplasm(GO:0005654) |
Gene overrepresentation in molecular_function category:
| Log-likelihood per target | Total log-likelihood | Term | Description |
|---|---|---|---|
| 23.8 | 71.5 | GO:0098626 | methylselenol reductase activity(GO:0098625) methylseleninic acid reductase activity(GO:0098626) |
| 10.5 | 41.8 | GO:0031208 | POZ domain binding(GO:0031208) |
| 10.0 | 29.9 | GO:0005047 | signal recognition particle binding(GO:0005047) |
| 9.1 | 27.2 | GO:0004139 | deoxyribose-phosphate aldolase activity(GO:0004139) |
| 7.2 | 21.6 | GO:0004582 | dolichyl-phosphate beta-D-mannosyltransferase activity(GO:0004582) |
| 7.0 | 41.9 | GO:0010858 | calcium-dependent protein kinase regulator activity(GO:0010858) |
| 6.6 | 66.3 | GO:0019237 | centromeric DNA binding(GO:0019237) |
| 6.6 | 39.3 | GO:0019834 | phospholipase A2 inhibitor activity(GO:0019834) |
| 6.3 | 19.0 | GO:0030627 | pre-mRNA 5'-splice site binding(GO:0030627) |
| 6.3 | 25.1 | GO:0004594 | pantothenate kinase activity(GO:0004594) |
| 6.3 | 18.8 | GO:0000035 | acyl binding(GO:0000035) phosphopantetheine binding(GO:0031177) |
| 6.1 | 72.9 | GO:0000774 | adenyl-nucleotide exchange factor activity(GO:0000774) |
| 5.9 | 17.8 | GO:0004514 | nicotinate-nucleotide diphosphorylase (carboxylating) activity(GO:0004514) |
| 5.8 | 17.5 | GO:0030377 | urokinase plasminogen activator receptor activity(GO:0030377) |
| 5.7 | 62.4 | GO:0036402 | proteasome-activating ATPase activity(GO:0036402) |
| 5.5 | 22.0 | GO:0004619 | bisphosphoglycerate mutase activity(GO:0004082) phosphoglycerate mutase activity(GO:0004619) 2,3-bisphosphoglycerate-dependent phosphoglycerate mutase activity(GO:0046538) |
| 5.4 | 38.0 | GO:0030267 | hydroxypyruvate reductase activity(GO:0016618) glyoxylate reductase (NADP) activity(GO:0030267) |
| 5.4 | 32.4 | GO:0061649 | ubiquitinated histone binding(GO:0061649) |
| 5.3 | 21.0 | GO:0004466 | long-chain-acyl-CoA dehydrogenase activity(GO:0004466) |
| 5.2 | 15.7 | GO:0004853 | uroporphyrinogen decarboxylase activity(GO:0004853) |
| 5.1 | 25.7 | GO:0004161 | dimethylallyltranstransferase activity(GO:0004161) geranyltranstransferase activity(GO:0004337) |
| 5.0 | 30.2 | GO:0004839 | ubiquitin activating enzyme activity(GO:0004839) |
| 4.8 | 38.5 | GO:0008379 | thioredoxin peroxidase activity(GO:0008379) |
| 4.5 | 62.7 | GO:0001075 | transcription factor activity, RNA polymerase II core promoter sequence-specific binding involved in preinitiation complex assembly(GO:0001075) |
| 4.4 | 30.7 | GO:0061133 | endopeptidase activator activity(GO:0061133) |
| 4.3 | 43.4 | GO:0042731 | PH domain binding(GO:0042731) |
| 4.2 | 33.4 | GO:0004563 | beta-N-acetylhexosaminidase activity(GO:0004563) |
| 4.2 | 33.4 | GO:0000182 | rDNA binding(GO:0000182) |
| 4.1 | 70.0 | GO:0008494 | translation activator activity(GO:0008494) |
| 4.0 | 8.1 | GO:0001540 | beta-amyloid binding(GO:0001540) |
| 4.0 | 24.2 | GO:0004749 | ribose phosphate diphosphokinase activity(GO:0004749) |
| 3.7 | 11.2 | GO:0000995 | transcription factor activity, core RNA polymerase III binding(GO:0000995) |
| 3.7 | 110.6 | GO:0004298 | threonine-type endopeptidase activity(GO:0004298) threonine-type peptidase activity(GO:0070003) |
| 3.6 | 14.4 | GO:0042500 | aspartic endopeptidase activity, intramembrane cleaving(GO:0042500) |
| 3.5 | 17.7 | GO:0005006 | epidermal growth factor-activated receptor activity(GO:0005006) |
| 3.5 | 14.1 | GO:0035373 | chondroitin sulfate proteoglycan binding(GO:0035373) |
| 3.4 | 13.5 | GO:0003726 | double-stranded RNA adenosine deaminase activity(GO:0003726) |
| 3.3 | 68.5 | GO:0001055 | RNA polymerase II activity(GO:0001055) |
| 3.2 | 9.7 | GO:0032089 | NACHT domain binding(GO:0032089) |
| 3.2 | 19.1 | GO:0042296 | ISG15 transferase activity(GO:0042296) |
| 3.2 | 12.7 | GO:0004307 | ethanolaminephosphotransferase activity(GO:0004307) |
| 3.1 | 22.0 | GO:0004849 | uridine kinase activity(GO:0004849) |
| 3.0 | 27.4 | GO:0043142 | single-stranded DNA-dependent ATPase activity(GO:0043142) |
| 3.0 | 9.0 | GO:0032427 | GBD domain binding(GO:0032427) |
| 2.9 | 14.7 | GO:0070905 | serine binding(GO:0070905) |
| 2.9 | 8.8 | GO:0004832 | valine-tRNA ligase activity(GO:0004832) |
| 2.9 | 28.9 | GO:0004579 | dolichyl-diphosphooligosaccharide-protein glycotransferase activity(GO:0004579) |
| 2.8 | 11.3 | GO:0043515 | kinetochore binding(GO:0043515) |
| 2.8 | 2.8 | GO:0004457 | lactate dehydrogenase activity(GO:0004457) L-lactate dehydrogenase activity(GO:0004459) |
| 2.8 | 11.2 | GO:0004169 | dolichyl-phosphate-mannose-protein mannosyltransferase activity(GO:0004169) |
| 2.8 | 47.2 | GO:0008432 | JUN kinase binding(GO:0008432) |
| 2.7 | 8.2 | GO:0051748 | UTP:glucose-1-phosphate uridylyltransferase activity(GO:0003983) UTP-monosaccharide-1-phosphate uridylyltransferase activity(GO:0051748) |
| 2.7 | 5.4 | GO:0004819 | glutamine-tRNA ligase activity(GO:0004819) |
| 2.7 | 27.1 | GO:0046790 | virion binding(GO:0046790) |
| 2.6 | 13.2 | GO:0052740 | 1-acyl-2-lysophosphatidylserine acylhydrolase activity(GO:0052740) |
| 2.6 | 20.8 | GO:0019871 | sodium channel inhibitor activity(GO:0019871) |
| 2.6 | 36.3 | GO:0016018 | cyclosporin A binding(GO:0016018) |
| 2.6 | 15.5 | GO:0008553 | hydrogen-exporting ATPase activity, phosphorylative mechanism(GO:0008553) |
| 2.6 | 12.9 | GO:0070404 | NADH binding(GO:0070404) |
| 2.6 | 100.6 | GO:0004198 | calcium-dependent cysteine-type endopeptidase activity(GO:0004198) |
| 2.6 | 7.7 | GO:0000033 | alpha-1,3-mannosyltransferase activity(GO:0000033) |
| 2.5 | 35.5 | GO:1990825 | sequence-specific mRNA binding(GO:1990825) |
| 2.5 | 14.8 | GO:0035402 | histone kinase activity (H3-T11 specific)(GO:0035402) |
| 2.5 | 36.9 | GO:0043138 | 3'-5' DNA helicase activity(GO:0043138) |
| 2.5 | 7.4 | GO:0004924 | oncostatin-M receptor activity(GO:0004924) |
| 2.4 | 7.2 | GO:0004464 | leukotriene-C4 synthase activity(GO:0004464) |
| 2.4 | 14.3 | GO:0043141 | ATP-dependent 5'-3' DNA helicase activity(GO:0043141) |
| 2.4 | 66.7 | GO:0000993 | RNA polymerase II core binding(GO:0000993) |
| 2.4 | 9.4 | GO:0003960 | NADPH:quinone reductase activity(GO:0003960) |
| 2.3 | 37.1 | GO:0047617 | acyl-CoA hydrolase activity(GO:0047617) |
| 2.3 | 9.2 | GO:0004809 | tRNA (guanine-N2-)-methyltransferase activity(GO:0004809) |
| 2.3 | 13.7 | GO:0033989 | 3alpha,7alpha,12alpha-trihydroxy-5beta-cholest-24-enoyl-CoA hydratase activity(GO:0033989) 17-beta-hydroxysteroid dehydrogenase (NAD+) activity(GO:0044594) |
| 2.3 | 11.3 | GO:0004485 | methylcrotonoyl-CoA carboxylase activity(GO:0004485) |
| 2.2 | 15.7 | GO:0016681 | ubiquinol-cytochrome-c reductase activity(GO:0008121) oxidoreductase activity, acting on diphenols and related substances as donors, cytochrome as acceptor(GO:0016681) |
| 2.2 | 34.6 | GO:0004526 | ribonuclease P activity(GO:0004526) |
| 2.1 | 16.8 | GO:0005049 | nuclear export signal receptor activity(GO:0005049) |
| 2.1 | 6.3 | GO:0004719 | protein-L-isoaspartate (D-aspartate) O-methyltransferase activity(GO:0004719) |
| 2.1 | 60.8 | GO:0017056 | structural constituent of nuclear pore(GO:0017056) |
| 2.1 | 10.4 | GO:0016846 | carbon-sulfur lyase activity(GO:0016846) |
| 2.1 | 18.6 | GO:0046976 | histone methyltransferase activity (H3-K27 specific)(GO:0046976) |
| 2.1 | 10.3 | GO:0016509 | long-chain-3-hydroxyacyl-CoA dehydrogenase activity(GO:0016509) |
| 2.0 | 8.1 | GO:0042809 | vitamin D receptor binding(GO:0042809) |
| 2.0 | 6.0 | GO:0001884 | pyrimidine nucleoside binding(GO:0001884) UTP binding(GO:0002134) pyrimidine ribonucleoside binding(GO:0032551) |
| 2.0 | 10.1 | GO:0004066 | asparagine synthase (glutamine-hydrolyzing) activity(GO:0004066) |
| 2.0 | 10.0 | GO:0004663 | Rab geranylgeranyltransferase activity(GO:0004663) |
| 1.9 | 52.5 | GO:0046933 | proton-transporting ATP synthase activity, rotational mechanism(GO:0046933) |
| 1.9 | 5.8 | GO:0005169 | neurotrophin TRKB receptor binding(GO:0005169) |
| 1.9 | 5.7 | GO:0047631 | ADP-ribose diphosphatase activity(GO:0047631) |
| 1.9 | 11.3 | GO:0004167 | dopachrome isomerase activity(GO:0004167) |
| 1.9 | 5.6 | GO:0004730 | pseudouridylate synthase activity(GO:0004730) |
| 1.8 | 40.4 | GO:0035615 | clathrin adaptor activity(GO:0035615) endocytic adaptor activity(GO:0098748) |
| 1.8 | 18.2 | GO:0055104 | ligase inhibitor activity(GO:0055104) ubiquitin ligase inhibitor activity(GO:1990948) |
| 1.8 | 92.9 | GO:0008137 | NADH dehydrogenase (ubiquinone) activity(GO:0008137) NADH dehydrogenase (quinone) activity(GO:0050136) |
| 1.8 | 19.5 | GO:0051371 | muscle alpha-actinin binding(GO:0051371) |
| 1.8 | 10.6 | GO:0010859 | calcium-dependent cysteine-type endopeptidase inhibitor activity(GO:0010859) |
| 1.7 | 7.0 | GO:0016900 | oxidoreductase activity, acting on the CH-OH group of donors, disulfide as acceptor(GO:0016900) vitamin-K-epoxide reductase (warfarin-sensitive) activity(GO:0047057) |
| 1.7 | 8.7 | GO:0030348 | syntaxin-3 binding(GO:0030348) |
| 1.7 | 8.6 | GO:0004844 | uracil DNA N-glycosylase activity(GO:0004844) deaminated base DNA N-glycosylase activity(GO:0097506) |
| 1.7 | 8.6 | GO:0000179 | rRNA (adenine-N6,N6-)-dimethyltransferase activity(GO:0000179) |
| 1.7 | 8.6 | GO:0098639 | collagen binding involved in cell-matrix adhesion(GO:0098639) |
| 1.7 | 18.8 | GO:0031681 | G-protein beta-subunit binding(GO:0031681) |
| 1.7 | 64.8 | GO:0031369 | translation initiation factor binding(GO:0031369) |
| 1.7 | 28.9 | GO:0008266 | poly(U) RNA binding(GO:0008266) |
| 1.7 | 15.1 | GO:0035174 | histone serine kinase activity(GO:0035174) |
| 1.7 | 23.3 | GO:0043024 | ribosomal small subunit binding(GO:0043024) |
| 1.6 | 47.0 | GO:0005388 | calcium-transporting ATPase activity(GO:0005388) |
| 1.6 | 8.0 | GO:0061665 | SUMO ligase activity(GO:0061665) |
| 1.6 | 7.9 | GO:0030060 | L-malate dehydrogenase activity(GO:0030060) |
| 1.6 | 14.2 | GO:0070883 | pre-miRNA binding(GO:0070883) |
| 1.6 | 7.8 | GO:0004905 | type I interferon receptor activity(GO:0004905) |
| 1.5 | 6.0 | GO:0004566 | beta-glucuronidase activity(GO:0004566) |
| 1.5 | 8.9 | GO:0032357 | oxidized purine DNA binding(GO:0032357) |
| 1.4 | 4.3 | GO:0043023 | ribosomal large subunit binding(GO:0043023) |
| 1.4 | 1.4 | GO:0045295 | gamma-catenin binding(GO:0045295) |
| 1.4 | 34.4 | GO:0098641 | cadherin binding involved in cell-cell adhesion(GO:0098641) |
| 1.4 | 5.7 | GO:0051734 | ATP-dependent polydeoxyribonucleotide 5'-hydroxyl-kinase activity(GO:0046404) polydeoxyribonucleotide kinase activity(GO:0051733) ATP-dependent polynucleotide kinase activity(GO:0051734) |
| 1.4 | 15.7 | GO:0048156 | tau protein binding(GO:0048156) |
| 1.4 | 8.5 | GO:0044547 | DNA topoisomerase binding(GO:0044547) |
| 1.4 | 16.9 | GO:0000014 | single-stranded DNA endodeoxyribonuclease activity(GO:0000014) |
| 1.4 | 39.4 | GO:0003887 | DNA-directed DNA polymerase activity(GO:0003887) |
| 1.4 | 4.1 | GO:0016603 | glutaminyl-peptide cyclotransferase activity(GO:0016603) |
| 1.4 | 8.3 | GO:0008853 | exodeoxyribonuclease III activity(GO:0008853) |
| 1.4 | 13.6 | GO:0019784 | NEDD8-specific protease activity(GO:0019784) |
| 1.4 | 10.8 | GO:0050833 | pyruvate transmembrane transporter activity(GO:0050833) |
| 1.3 | 8.0 | GO:0000340 | RNA 7-methylguanosine cap binding(GO:0000340) |
| 1.3 | 4.0 | GO:0004817 | cysteine-tRNA ligase activity(GO:0004817) |
| 1.3 | 8.0 | GO:0008240 | tripeptidyl-peptidase activity(GO:0008240) |
| 1.3 | 46.8 | GO:0044183 | protein binding involved in protein folding(GO:0044183) |
| 1.3 | 2.6 | GO:0008241 | peptidyl-dipeptidase activity(GO:0008241) |
| 1.3 | 34.0 | GO:0070064 | proline-rich region binding(GO:0070064) |
| 1.2 | 6.1 | GO:0004910 | interleukin-1, Type II, blocking receptor activity(GO:0004910) |
| 1.2 | 4.9 | GO:0004549 | tRNA-specific ribonuclease activity(GO:0004549) |
| 1.2 | 3.7 | GO:0051059 | NF-kappaB binding(GO:0051059) |
| 1.2 | 91.4 | GO:0016765 | transferase activity, transferring alkyl or aryl (other than methyl) groups(GO:0016765) |
| 1.2 | 18.2 | GO:0003688 | DNA replication origin binding(GO:0003688) |
| 1.2 | 7.2 | GO:0003872 | 6-phosphofructokinase activity(GO:0003872) |
| 1.2 | 22.3 | GO:0070840 | dynein complex binding(GO:0070840) |
| 1.2 | 4.7 | GO:0035671 | enone reductase activity(GO:0035671) |
| 1.2 | 47.6 | GO:0061631 | ubiquitin conjugating enzyme activity(GO:0061631) |
| 1.1 | 20.7 | GO:0031402 | sodium ion binding(GO:0031402) |
| 1.1 | 3.4 | GO:0004020 | adenylylsulfate kinase activity(GO:0004020) sulfate adenylyltransferase activity(GO:0004779) sulfate adenylyltransferase (ATP) activity(GO:0004781) |
| 1.1 | 4.5 | GO:0005412 | glucose:sodium symporter activity(GO:0005412) |
| 1.1 | 3.4 | GO:0080130 | L-phenylalanine aminotransferase activity(GO:0070546) L-phenylalanine:2-oxoglutarate aminotransferase activity(GO:0080130) |
| 1.1 | 12.2 | GO:0015266 | protein channel activity(GO:0015266) |
| 1.1 | 25.2 | GO:0030898 | actin-dependent ATPase activity(GO:0030898) |
| 1.1 | 9.7 | GO:1901612 | cardiolipin binding(GO:1901612) |
| 1.1 | 16.2 | GO:0034450 | ubiquitin-ubiquitin ligase activity(GO:0034450) |
| 1.1 | 2.1 | GO:0016778 | diphosphotransferase activity(GO:0016778) |
| 1.1 | 7.5 | GO:0004704 | NF-kappaB-inducing kinase activity(GO:0004704) |
| 1.1 | 3.2 | GO:0017057 | 6-phosphogluconolactonase activity(GO:0017057) |
| 1.0 | 44.5 | GO:0003743 | translation initiation factor activity(GO:0003743) |
| 1.0 | 74.5 | GO:0004869 | cysteine-type endopeptidase inhibitor activity(GO:0004869) |
| 1.0 | 27.7 | GO:0015002 | cytochrome-c oxidase activity(GO:0004129) heme-copper terminal oxidase activity(GO:0015002) oxidoreductase activity, acting on a heme group of donors, oxygen as acceptor(GO:0016676) |
| 1.0 | 9.2 | GO:0005384 | manganese ion transmembrane transporter activity(GO:0005384) |
| 1.0 | 6.1 | GO:1904929 | coreceptor activity involved in Wnt signaling pathway, planar cell polarity pathway(GO:1904929) |
| 1.0 | 8.1 | GO:0008821 | crossover junction endodeoxyribonuclease activity(GO:0008821) |
| 1.0 | 6.0 | GO:0035374 | chondroitin sulfate binding(GO:0035374) |
| 1.0 | 6.9 | GO:0045545 | syndecan binding(GO:0045545) |
| 1.0 | 24.6 | GO:0008191 | metalloendopeptidase inhibitor activity(GO:0008191) |
| 1.0 | 19.6 | GO:0051010 | microtubule plus-end binding(GO:0051010) |
| 1.0 | 10.6 | GO:0070016 | armadillo repeat domain binding(GO:0070016) |
| 0.9 | 3.8 | GO:0032190 | acrosin binding(GO:0032190) |
| 0.9 | 23.6 | GO:0003746 | translation elongation factor activity(GO:0003746) |
| 0.9 | 14.1 | GO:0051537 | 2 iron, 2 sulfur cluster binding(GO:0051537) |
| 0.9 | 28.2 | GO:0008574 | ATP-dependent microtubule motor activity, plus-end-directed(GO:0008574) |
| 0.9 | 13.8 | GO:0016864 | protein disulfide isomerase activity(GO:0003756) intramolecular oxidoreductase activity, transposing S-S bonds(GO:0016864) |
| 0.9 | 7.3 | GO:0070087 | chromo shadow domain binding(GO:0070087) |
| 0.9 | 4.6 | GO:0008097 | 5S rRNA binding(GO:0008097) |
| 0.9 | 1.8 | GO:0008449 | N-acetylglucosamine-6-sulfatase activity(GO:0008449) |
| 0.9 | 90.0 | GO:0003697 | single-stranded DNA binding(GO:0003697) |
| 0.9 | 6.2 | GO:0005353 | fructose transmembrane transporter activity(GO:0005353) |
| 0.9 | 3.5 | GO:0004346 | glucose-6-phosphatase activity(GO:0004346) sugar-terminal-phosphatase activity(GO:0050309) |
| 0.9 | 20.9 | GO:0005544 | calcium-dependent phospholipid binding(GO:0005544) |
| 0.9 | 2.6 | GO:0070644 | vitamin D response element binding(GO:0070644) |
| 0.8 | 8.5 | GO:0004312 | fatty acid synthase activity(GO:0004312) |
| 0.8 | 4.2 | GO:0033857 | diphosphoinositol-pentakisphosphate kinase activity(GO:0033857) |
| 0.8 | 3.3 | GO:0050509 | N-acetylglucosaminyl-proteoglycan 4-beta-glucuronosyltransferase activity(GO:0050509) |
| 0.8 | 10.0 | GO:0017049 | GTP-Rho binding(GO:0017049) |
| 0.8 | 4.9 | GO:0050692 | DBD domain binding(GO:0050692) |
| 0.8 | 8.8 | GO:1990381 | ubiquitin-specific protease binding(GO:1990381) |
| 0.8 | 0.8 | GO:0004886 | 9-cis retinoic acid receptor activity(GO:0004886) |
| 0.8 | 7.9 | GO:1904264 | ubiquitin protein ligase activity involved in ERAD pathway(GO:1904264) |
| 0.8 | 33.7 | GO:0046966 | thyroid hormone receptor binding(GO:0046966) |
| 0.8 | 5.4 | GO:0019788 | NEDD8 transferase activity(GO:0019788) |
| 0.8 | 9.3 | GO:0031545 | peptidyl-proline 4-dioxygenase activity(GO:0031545) |
| 0.8 | 155.8 | GO:0003735 | structural constituent of ribosome(GO:0003735) |
| 0.7 | 1.5 | GO:0003689 | DNA clamp loader activity(GO:0003689) protein-DNA loading ATPase activity(GO:0033170) |
| 0.7 | 11.2 | GO:0050811 | GABA receptor binding(GO:0050811) |
| 0.7 | 4.4 | GO:0019776 | Atg8 ligase activity(GO:0019776) |
| 0.7 | 4.4 | GO:0016421 | CoA carboxylase activity(GO:0016421) |
| 0.7 | 11.6 | GO:0070628 | proteasome binding(GO:0070628) |
| 0.7 | 11.6 | GO:0008179 | adenylate cyclase binding(GO:0008179) |
| 0.7 | 2.9 | GO:0001875 | lipopolysaccharide receptor activity(GO:0001875) |
| 0.7 | 2.9 | GO:0005499 | vitamin D binding(GO:0005499) |
| 0.7 | 18.3 | GO:0005523 | tropomyosin binding(GO:0005523) |
| 0.7 | 2.1 | GO:0042328 | heparan sulfate N-acetylglucosaminyltransferase activity(GO:0042328) |
| 0.7 | 6.3 | GO:0004784 | superoxide dismutase activity(GO:0004784) oxidoreductase activity, acting on superoxide radicals as acceptor(GO:0016721) |
| 0.7 | 4.9 | GO:0008109 | N-acetyllactosaminide beta-1,6-N-acetylglucosaminyltransferase activity(GO:0008109) |
| 0.7 | 3.5 | GO:0018479 | benzaldehyde dehydrogenase (NAD+) activity(GO:0018479) |
| 0.7 | 2.1 | GO:0102008 | cytosolic dipeptidase activity(GO:0102008) |
| 0.7 | 3.4 | GO:0031013 | troponin I binding(GO:0031013) |
| 0.7 | 4.7 | GO:0003857 | 3-hydroxyacyl-CoA dehydrogenase activity(GO:0003857) |
| 0.7 | 11.4 | GO:0044769 | ATPase activity, coupled to transmembrane movement of ions, rotational mechanism(GO:0044769) |
| 0.7 | 2.0 | GO:0032184 | SUMO polymer binding(GO:0032184) |
| 0.7 | 68.0 | GO:0008565 | protein transporter activity(GO:0008565) |
| 0.7 | 45.2 | GO:0032947 | protein complex scaffold(GO:0032947) |
| 0.7 | 19.8 | GO:0001848 | complement binding(GO:0001848) |
| 0.7 | 55.3 | GO:0070491 | repressing transcription factor binding(GO:0070491) |
| 0.7 | 22.4 | GO:0015020 | glucuronosyltransferase activity(GO:0015020) |
| 0.6 | 12.1 | GO:0034237 | protein kinase A regulatory subunit binding(GO:0034237) |
| 0.6 | 135.3 | GO:0051015 | actin filament binding(GO:0051015) |
| 0.6 | 12.6 | GO:0031434 | mitogen-activated protein kinase kinase binding(GO:0031434) |
| 0.6 | 6.9 | GO:0050700 | CARD domain binding(GO:0050700) |
| 0.6 | 21.8 | GO:0051539 | 4 iron, 4 sulfur cluster binding(GO:0051539) |
| 0.6 | 10.5 | GO:0102391 | decanoate--CoA ligase activity(GO:0102391) |
| 0.6 | 11.1 | GO:0070300 | phosphatidic acid binding(GO:0070300) |
| 0.6 | 7.9 | GO:0042826 | histone deacetylase binding(GO:0042826) |
| 0.6 | 6.6 | GO:0033038 | bitter taste receptor activity(GO:0033038) |
| 0.6 | 1.8 | GO:0004828 | serine-tRNA ligase activity(GO:0004828) |
| 0.6 | 1.7 | GO:0004711 | ribosomal protein S6 kinase activity(GO:0004711) |
| 0.6 | 2.3 | GO:0034648 | histone demethylase activity (H3-dimethyl-K4 specific)(GO:0034648) |
| 0.5 | 1.6 | GO:0016899 | oxidoreductase activity, acting on the CH-OH group of donors, oxygen as acceptor(GO:0016899) |
| 0.5 | 8.7 | GO:0034236 | protein kinase A catalytic subunit binding(GO:0034236) |
| 0.5 | 13.5 | GO:0015248 | sterol transporter activity(GO:0015248) |
| 0.5 | 3.2 | GO:0004673 | phosphorelay sensor kinase activity(GO:0000155) protein histidine kinase activity(GO:0004673) |
| 0.5 | 3.7 | GO:0048027 | mRNA 5'-UTR binding(GO:0048027) |
| 0.5 | 26.5 | GO:0030276 | clathrin binding(GO:0030276) |
| 0.5 | 5.2 | GO:0015232 | heme transporter activity(GO:0015232) |
| 0.5 | 14.0 | GO:0004407 | histone deacetylase activity(GO:0004407) protein deacetylase activity(GO:0033558) |
| 0.5 | 7.7 | GO:0004003 | ATP-dependent DNA helicase activity(GO:0004003) |
| 0.5 | 10.2 | GO:0008536 | Ran GTPase binding(GO:0008536) |
| 0.5 | 8.5 | GO:0016653 | oxidoreductase activity, acting on NAD(P)H, heme protein as acceptor(GO:0016653) |
| 0.5 | 4.9 | GO:0004028 | 3-chloroallyl aldehyde dehydrogenase activity(GO:0004028) |
| 0.5 | 7.4 | GO:0070513 | death domain binding(GO:0070513) |
| 0.5 | 5.5 | GO:0042043 | neurexin family protein binding(GO:0042043) |
| 0.4 | 8.4 | GO:0004697 | protein kinase C activity(GO:0004697) |
| 0.4 | 8.7 | GO:0004386 | helicase activity(GO:0004386) |
| 0.4 | 2.6 | GO:0036310 | annealing helicase activity(GO:0036310) |
| 0.4 | 3.1 | GO:0016015 | morphogen activity(GO:0016015) |
| 0.4 | 14.8 | GO:0031593 | polyubiquitin binding(GO:0031593) |
| 0.4 | 1.3 | GO:0000253 | 3-keto sterol reductase activity(GO:0000253) |
| 0.4 | 4.3 | GO:0005094 | Rho GDP-dissociation inhibitor activity(GO:0005094) |
| 0.4 | 8.1 | GO:0009931 | calcium-dependent protein serine/threonine kinase activity(GO:0009931) |
| 0.4 | 1.3 | GO:0004531 | deoxyribonuclease II activity(GO:0004531) |
| 0.4 | 10.1 | GO:0031210 | phosphatidylcholine binding(GO:0031210) |
| 0.4 | 5.1 | GO:0031386 | protein tag(GO:0031386) |
| 0.4 | 31.4 | GO:0036459 | thiol-dependent ubiquitinyl hydrolase activity(GO:0036459) ubiquitinyl hydrolase activity(GO:0101005) |
| 0.4 | 1.2 | GO:0099580 | ion antiporter activity involved in regulation of postsynaptic membrane potential(GO:0099580) |
| 0.4 | 1.2 | GO:0004105 | choline-phosphate cytidylyltransferase activity(GO:0004105) |
| 0.4 | 2.8 | GO:0001165 | RNA polymerase I upstream control element sequence-specific DNA binding(GO:0001165) |
| 0.4 | 3.8 | GO:0070053 | thrombospondin receptor activity(GO:0070053) |
| 0.4 | 19.3 | GO:0016763 | transferase activity, transferring pentosyl groups(GO:0016763) |
| 0.4 | 7.8 | GO:0030296 | protein tyrosine kinase activator activity(GO:0030296) |
| 0.4 | 12.2 | GO:0048487 | beta-tubulin binding(GO:0048487) |
| 0.4 | 6.0 | GO:0005537 | mannose binding(GO:0005537) |
| 0.4 | 8.4 | GO:0001786 | phosphatidylserine binding(GO:0001786) |
| 0.3 | 4.3 | GO:0035613 | RNA stem-loop binding(GO:0035613) |
| 0.3 | 2.6 | GO:0050072 | m7G(5')pppN diphosphatase activity(GO:0050072) |
| 0.3 | 1.3 | GO:0005166 | neurotrophin p75 receptor binding(GO:0005166) |
| 0.3 | 1.3 | GO:0004046 | aminoacylase activity(GO:0004046) |
| 0.3 | 0.6 | GO:0098770 | FBXO family protein binding(GO:0098770) |
| 0.3 | 4.9 | GO:0001972 | retinoic acid binding(GO:0001972) |
| 0.3 | 23.6 | GO:0008013 | beta-catenin binding(GO:0008013) |
| 0.3 | 6.8 | GO:0016859 | cis-trans isomerase activity(GO:0016859) |
| 0.3 | 2.9 | GO:0000983 | transcription factor activity, RNA polymerase II core promoter sequence-specific(GO:0000983) |
| 0.3 | 21.3 | GO:0001104 | RNA polymerase II transcription cofactor activity(GO:0001104) |
| 0.3 | 1.9 | GO:0008454 | alpha-1,3-mannosylglycoprotein 4-beta-N-acetylglucosaminyltransferase activity(GO:0008454) |
| 0.3 | 4.7 | GO:0003680 | AT DNA binding(GO:0003680) |
| 0.3 | 11.5 | GO:0008138 | protein tyrosine/serine/threonine phosphatase activity(GO:0008138) |
| 0.3 | 7.7 | GO:0001102 | RNA polymerase II activating transcription factor binding(GO:0001102) |
| 0.3 | 32.3 | GO:0003705 | transcription factor activity, RNA polymerase II distal enhancer sequence-specific binding(GO:0003705) |
| 0.3 | 5.4 | GO:0070577 | lysine-acetylated histone binding(GO:0070577) |
| 0.2 | 5.5 | GO:0031492 | nucleosomal DNA binding(GO:0031492) |
| 0.2 | 1.5 | GO:0015187 | glycine transmembrane transporter activity(GO:0015187) |
| 0.2 | 1.7 | GO:0048101 | calcium- and calmodulin-regulated 3',5'-cyclic-GMP phosphodiesterase activity(GO:0048101) |
| 0.2 | 12.4 | GO:0017112 | Rab guanyl-nucleotide exchange factor activity(GO:0017112) |
| 0.2 | 24.3 | GO:0042393 | histone binding(GO:0042393) |
| 0.2 | 0.7 | GO:0032296 | ribonuclease III activity(GO:0004525) double-stranded RNA-specific ribonuclease activity(GO:0032296) |
| 0.2 | 2.1 | GO:0008301 | DNA binding, bending(GO:0008301) |
| 0.2 | 19.3 | GO:0035257 | nuclear hormone receptor binding(GO:0035257) |
| 0.2 | 3.6 | GO:0008353 | RNA polymerase II carboxy-terminal domain kinase activity(GO:0008353) |
| 0.2 | 14.2 | GO:0003730 | mRNA 3'-UTR binding(GO:0003730) |
| 0.2 | 10.9 | GO:0043130 | ubiquitin binding(GO:0043130) |
| 0.2 | 1.8 | GO:0035612 | AP-2 adaptor complex binding(GO:0035612) |
| 0.2 | 14.1 | GO:0008186 | RNA-dependent ATPase activity(GO:0008186) |
| 0.2 | 0.4 | GO:1990763 | arrestin family protein binding(GO:1990763) |
| 0.2 | 4.7 | GO:0043015 | gamma-tubulin binding(GO:0043015) |
| 0.2 | 18.8 | GO:0031072 | heat shock protein binding(GO:0031072) |
| 0.2 | 0.8 | GO:0019003 | GDP binding(GO:0019003) |
| 0.2 | 0.8 | GO:0070137 | ubiquitin-like protein-specific endopeptidase activity(GO:0070137) SUMO-specific endopeptidase activity(GO:0070139) |
| 0.2 | 0.6 | GO:0086083 | cell adhesive protein binding involved in bundle of His cell-Purkinje myocyte communication(GO:0086083) |
| 0.2 | 4.4 | GO:0004709 | MAP kinase kinase kinase activity(GO:0004709) |
| 0.2 | 0.6 | GO:0005127 | ciliary neurotrophic factor receptor binding(GO:0005127) |
| 0.2 | 15.0 | GO:0046332 | SMAD binding(GO:0046332) |
| 0.2 | 60.5 | GO:0003924 | GTPase activity(GO:0003924) |
| 0.2 | 12.3 | GO:0047485 | protein N-terminus binding(GO:0047485) |
| 0.2 | 2.1 | GO:0005041 | low-density lipoprotein receptor activity(GO:0005041) |
| 0.2 | 3.2 | GO:0008510 | sodium:bicarbonate symporter activity(GO:0008510) |
| 0.2 | 0.5 | GO:0016454 | serine C-palmitoyltransferase activity(GO:0004758) C-palmitoyltransferase activity(GO:0016454) |
| 0.2 | 0.9 | GO:0016882 | cyclo-ligase activity(GO:0016882) |
| 0.2 | 2.4 | GO:0008140 | cAMP response element binding protein binding(GO:0008140) |
| 0.2 | 4.1 | GO:0019200 | carbohydrate kinase activity(GO:0019200) |
| 0.2 | 42.9 | GO:0045296 | cadherin binding(GO:0045296) |
| 0.2 | 2.0 | GO:0004596 | peptide alpha-N-acetyltransferase activity(GO:0004596) |
| 0.2 | 168.4 | GO:0003723 | RNA binding(GO:0003723) |
| 0.2 | 4.2 | GO:0003951 | NAD+ kinase activity(GO:0003951) |
| 0.1 | 0.3 | GO:0010340 | carboxyl-O-methyltransferase activity(GO:0010340) protein carboxyl O-methyltransferase activity(GO:0051998) |
| 0.1 | 1.7 | GO:0016175 | superoxide-generating NADPH oxidase activity(GO:0016175) |
| 0.1 | 3.1 | GO:0005546 | phosphatidylinositol-4,5-bisphosphate binding(GO:0005546) |
| 0.1 | 1.4 | GO:0016857 | racemase and epimerase activity, acting on carbohydrates and derivatives(GO:0016857) |
| 0.1 | 0.9 | GO:0016868 | intramolecular transferase activity, phosphotransferases(GO:0016868) |
| 0.1 | 3.5 | GO:0050699 | WW domain binding(GO:0050699) |
| 0.1 | 0.4 | GO:0004140 | dephospho-CoA kinase activity(GO:0004140) |
| 0.1 | 1.5 | GO:0070063 | RNA polymerase binding(GO:0070063) |
| 0.1 | 5.5 | GO:0005507 | copper ion binding(GO:0005507) |
| 0.1 | 2.9 | GO:0003684 | damaged DNA binding(GO:0003684) |
| 0.1 | 1.9 | GO:0008157 | protein phosphatase 1 binding(GO:0008157) |
| 0.1 | 3.4 | GO:0005154 | epidermal growth factor receptor binding(GO:0005154) |
| 0.1 | 2.8 | GO:0046875 | ephrin receptor binding(GO:0046875) |
| 0.1 | 1.5 | GO:0016505 | peptidase activator activity involved in apoptotic process(GO:0016505) |
| 0.1 | 0.3 | GO:0030760 | nicotinamide N-methyltransferase activity(GO:0008112) pyridine N-methyltransferase activity(GO:0030760) |
| 0.1 | 0.6 | GO:0017166 | vinculin binding(GO:0017166) |
| 0.1 | 2.1 | GO:0004896 | cytokine receptor activity(GO:0004896) |
| 0.1 | 0.2 | GO:0003883 | CTP synthase activity(GO:0003883) |
| 0.1 | 0.3 | GO:0017040 | ceramidase activity(GO:0017040) |
| 0.1 | 1.5 | GO:0030332 | cyclin binding(GO:0030332) |
| 0.1 | 0.3 | GO:0003910 | DNA ligase activity(GO:0003909) DNA ligase (ATP) activity(GO:0003910) |
| 0.0 | 0.8 | GO:0070001 | aspartic-type endopeptidase activity(GO:0004190) aspartic-type peptidase activity(GO:0070001) |
| 0.0 | 0.5 | GO:0004971 | AMPA glutamate receptor activity(GO:0004971) |
| 0.0 | 1.8 | GO:0008307 | structural constituent of muscle(GO:0008307) |
| 0.0 | 0.3 | GO:0032052 | bile acid binding(GO:0032052) |
| 0.0 | 0.5 | GO:0043548 | phosphatidylinositol 3-kinase binding(GO:0043548) |
| 0.0 | 0.4 | GO:0004033 | aldo-keto reductase (NADP) activity(GO:0004033) |
| 0.0 | 0.1 | GO:0004013 | adenosylhomocysteinase activity(GO:0004013) trialkylsulfonium hydrolase activity(GO:0016802) |
| 0.0 | 0.2 | GO:0042834 | peptidoglycan binding(GO:0042834) |
| 0.0 | 0.7 | GO:0005164 | tumor necrosis factor receptor binding(GO:0005164) |
| 0.0 | 0.2 | GO:0043422 | protein kinase B binding(GO:0043422) |
| 0.0 | 0.1 | GO:0015254 | glycerol channel activity(GO:0015254) urea channel activity(GO:0015265) |
| 0.0 | 0.2 | GO:0015643 | toxic substance binding(GO:0015643) |
| 0.0 | 0.2 | GO:0005112 | Notch binding(GO:0005112) |
| 0.0 | 0.2 | GO:0033613 | activating transcription factor binding(GO:0033613) |
| 0.0 | 0.2 | GO:0097110 | scaffold protein binding(GO:0097110) |
| 0.0 | 0.1 | GO:0018685 | alkane 1-monooxygenase activity(GO:0018685) |
| 0.0 | 0.2 | GO:0005123 | death receptor binding(GO:0005123) |
| 0.0 | 0.2 | GO:0005337 | nucleoside transmembrane transporter activity(GO:0005337) |
Gene overrepresentation in C2:CP category:
| Log-likelihood per target | Total log-likelihood | Term | Description |
|---|---|---|---|
| 2.4 | 153.3 | PID AURORA B PATHWAY | Aurora B signaling |
| 1.7 | 25.5 | PID RANBP2 PATHWAY | Sumoylation by RanBP2 regulates transcriptional repression |
| 1.6 | 85.3 | SIG REGULATION OF THE ACTIN CYTOSKELETON BY RHO GTPASES | Genes related to regulation of the actin cytoskeleton |
| 1.6 | 80.0 | PID MYC PATHWAY | C-MYC pathway |
| 1.4 | 25.3 | SA REG CASCADE OF CYCLIN EXPR | Expression of cyclins regulates progression through the cell cycle by activating cyclin-dependent kinases. |
| 1.3 | 10.3 | SA G1 AND S PHASES | Cdk2, 4, and 6 bind cyclin D in G1, while cdk2/cyclin E promotes the G1/S transition. |
| 1.1 | 27.0 | PID PRL SIGNALING EVENTS PATHWAY | Signaling events mediated by PRL |
| 1.0 | 75.2 | PID INTEGRIN3 PATHWAY | Beta3 integrin cell surface interactions |
| 0.9 | 33.8 | PID NECTIN PATHWAY | Nectin adhesion pathway |
| 0.9 | 22.1 | PID CIRCADIAN PATHWAY | Circadian rhythm pathway |
| 0.9 | 18.9 | PID ARF 3PATHWAY | Arf1 pathway |
| 0.9 | 34.0 | PID IL1 PATHWAY | IL1-mediated signaling events |
| 0.8 | 53.8 | PID RAC1 PATHWAY | RAC1 signaling pathway |
| 0.8 | 4.9 | PID WNT NONCANONICAL PATHWAY | Noncanonical Wnt signaling pathway |
| 0.8 | 35.6 | PID ATR PATHWAY | ATR signaling pathway |
| 0.8 | 32.0 | PID NFKAPPAB CANONICAL PATHWAY | Canonical NF-kappaB pathway |
| 0.8 | 14.4 | PID ECADHERIN KERATINOCYTE PATHWAY | E-cadherin signaling in keratinocytes |
| 0.7 | 38.7 | PID PLK1 PATHWAY | PLK1 signaling events |
| 0.7 | 6.1 | PID WNT SIGNALING PATHWAY | Wnt signaling network |
| 0.7 | 16.9 | PID BARD1 PATHWAY | BARD1 signaling events |
| 0.6 | 14.3 | PID PS1 PATHWAY | Presenilin action in Notch and Wnt signaling |
| 0.6 | 44.4 | PID DELTA NP63 PATHWAY | Validated transcriptional targets of deltaNp63 isoforms |
| 0.6 | 51.1 | PID TELOMERASE PATHWAY | Regulation of Telomerase |
| 0.6 | 5.9 | ST IL 13 PATHWAY | Interleukin 13 (IL-13) Pathway |
| 0.6 | 29.8 | PID SYNDECAN 1 PATHWAY | Syndecan-1-mediated signaling events |
| 0.6 | 26.5 | PID FAK PATHWAY | Signaling events mediated by focal adhesion kinase |
| 0.5 | 9.7 | PID P38 MK2 PATHWAY | p38 signaling mediated by MAPKAP kinases |
| 0.5 | 5.4 | PID ATM PATHWAY | ATM pathway |
| 0.5 | 38.6 | PID TRKR PATHWAY | Neurotrophic factor-mediated Trk receptor signaling |
| 0.5 | 10.2 | PID FOXM1 PATHWAY | FOXM1 transcription factor network |
| 0.4 | 21.6 | PID TCR CALCIUM PATHWAY | Calcium signaling in the CD4+ TCR pathway |
| 0.4 | 15.6 | PID HDAC CLASSII PATHWAY | Signaling events mediated by HDAC Class II |
| 0.4 | 3.4 | PID BETA CATENIN DEG PATHWAY | Degradation of beta catenin |
| 0.4 | 23.3 | PID P38 ALPHA BETA DOWNSTREAM PATHWAY | Signaling mediated by p38-alpha and p38-beta |
| 0.4 | 33.2 | PID CASPASE PATHWAY | Caspase cascade in apoptosis |
| 0.4 | 29.9 | PID E2F PATHWAY | E2F transcription factor network |
| 0.4 | 33.7 | PID MYC ACTIV PATHWAY | Validated targets of C-MYC transcriptional activation |
| 0.4 | 11.1 | PID NCADHERIN PATHWAY | N-cadherin signaling events |
| 0.4 | 37.4 | WNT SIGNALING | Genes related to Wnt-mediated signal transduction |
| 0.4 | 11.7 | PID ECADHERIN STABILIZATION PATHWAY | Stabilization and expansion of the E-cadherin adherens junction |
| 0.3 | 14.1 | PID BETA CATENIN NUC PATHWAY | Regulation of nuclear beta catenin signaling and target gene transcription |
| 0.3 | 10.1 | PID ATF2 PATHWAY | ATF-2 transcription factor network |
| 0.3 | 21.0 | PID CMYB PATHWAY | C-MYB transcription factor network |
| 0.3 | 4.0 | ST MYOCYTE AD PATHWAY | Myocyte Adrenergic Pathway is a specific case of the generalized Adrenergic Pathway. |
| 0.3 | 8.5 | ST INTEGRIN SIGNALING PATHWAY | Integrin Signaling Pathway |
| 0.3 | 9.7 | PID VEGFR1 2 PATHWAY | Signaling events mediated by VEGFR1 and VEGFR2 |
| 0.3 | 3.8 | ST GAQ PATHWAY | G alpha q Pathway |
| 0.3 | 13.7 | PID AP1 PATHWAY | AP-1 transcription factor network |
| 0.3 | 7.1 | PID PTP1B PATHWAY | Signaling events mediated by PTP1B |
| 0.3 | 12.6 | PID TAP63 PATHWAY | Validated transcriptional targets of TAp63 isoforms |
| 0.3 | 6.7 | SIG PIP3 SIGNALING IN CARDIAC MYOCTES | Genes related to PIP3 signaling in cardiac myocytes |
| 0.3 | 23.2 | PID AR PATHWAY | Coregulation of Androgen receptor activity |
| 0.3 | 1.8 | PID PDGFRA PATHWAY | PDGFR-alpha signaling pathway |
| 0.3 | 2.8 | ST TYPE I INTERFERON PATHWAY | Type I Interferon (alpha/beta IFN) Pathway |
| 0.2 | 9.7 | ST FAS SIGNALING PATHWAY | Fas Signaling Pathway |
| 0.2 | 7.5 | PID ILK PATHWAY | Integrin-linked kinase signaling |
| 0.2 | 3.5 | ST DIFFERENTIATION PATHWAY IN PC12 CELLS | Differentiation Pathway in PC12 Cells; this is a specific case of PAC1 Receptor Pathway. |
| 0.2 | 3.9 | PID NETRIN PATHWAY | Netrin-mediated signaling events |
| 0.2 | 3.7 | PID PI3KCI AKT PATHWAY | Class I PI3K signaling events mediated by Akt |
| 0.2 | 6.0 | PID NOTCH PATHWAY | Notch signaling pathway |
| 0.2 | 6.8 | PID TGFBR PATHWAY | TGF-beta receptor signaling |
| 0.2 | 5.1 | ST G ALPHA I PATHWAY | G alpha i Pathway |
| 0.1 | 1.1 | PID ANGIOPOIETIN RECEPTOR PATHWAY | Angiopoietin receptor Tie2-mediated signaling |
| 0.1 | 3.8 | PID THROMBIN PAR1 PATHWAY | PAR1-mediated thrombin signaling events |
| 0.1 | 3.3 | PID HNF3A PATHWAY | FOXA1 transcription factor network |
| 0.0 | 0.7 | SIG INSULIN RECEPTOR PATHWAY IN CARDIAC MYOCYTES | Genes related to the insulin receptor pathway |
| 0.0 | 0.7 | PID LIS1 PATHWAY | Lissencephaly gene (LIS1) in neuronal migration and development |
| 0.0 | 0.2 | PID ERBB NETWORK PATHWAY | ErbB receptor signaling network |
Gene overrepresentation in C2:CP:REACTOME category:
| Log-likelihood per target | Total log-likelihood | Term | Description |
|---|---|---|---|
| 5.1 | 158.7 | REACTOME FORMATION OF TUBULIN FOLDING INTERMEDIATES BY CCT TRIC | Genes involved in Formation of tubulin folding intermediates by CCT/TriC |
| 4.3 | 56.2 | REACTOME CDT1 ASSOCIATION WITH THE CDC6 ORC ORIGIN COMPLEX | Genes involved in CDT1 association with the CDC6:ORC:origin complex |
| 3.8 | 99.5 | REACTOME KINESINS | Genes involved in Kinesins |
| 3.6 | 58.4 | REACTOME UNWINDING OF DNA | Genes involved in Unwinding of DNA |
| 3.5 | 382.1 | REACTOME APC C CDC20 MEDIATED DEGRADATION OF MITOTIC PROTEINS | Genes involved in APC/C:Cdc20 mediated degradation of mitotic proteins |
| 3.3 | 29.6 | REACTOME POST CHAPERONIN TUBULIN FOLDING PATHWAY | Genes involved in Post-chaperonin tubulin folding pathway |
| 3.1 | 74.9 | REACTOME VIRAL MESSENGER RNA SYNTHESIS | Genes involved in Viral Messenger RNA Synthesis |
| 3.1 | 119.5 | REACTOME NEP NS2 INTERACTS WITH THE CELLULAR EXPORT MACHINERY | Genes involved in NEP/NS2 Interacts with the Cellular Export Machinery |
| 3.0 | 44.8 | REACTOME MRNA DECAY BY 5 TO 3 EXORIBONUCLEASE | Genes involved in mRNA Decay by 5' to 3' Exoribonuclease |
| 2.6 | 57.0 | REACTOME DESTABILIZATION OF MRNA BY AUF1 HNRNP D0 | Genes involved in Destabilization of mRNA by AUF1 (hnRNP D0) |
| 2.6 | 43.6 | REACTOME REPAIR SYNTHESIS FOR GAP FILLING BY DNA POL IN TC NER | Genes involved in Repair synthesis for gap-filling by DNA polymerase in TC-NER |
| 2.4 | 48.3 | REACTOME APOPTOSIS INDUCED DNA FRAGMENTATION | Genes involved in Apoptosis induced DNA fragmentation |
| 2.4 | 80.4 | REACTOME SYNTHESIS AND INTERCONVERSION OF NUCLEOTIDE DI AND TRIPHOSPHATES | Genes involved in Synthesis and interconversion of nucleotide di- and triphosphates |
| 2.3 | 32.0 | REACTOME G1 S SPECIFIC TRANSCRIPTION | Genes involved in G1/S-Specific Transcription |
| 2.2 | 75.6 | REACTOME NEF MEDIATES DOWN MODULATION OF CELL SURFACE RECEPTORS BY RECRUITING THEM TO CLATHRIN ADAPTERS | Genes involved in Nef-mediates down modulation of cell surface receptors by recruiting them to clathrin adapters |
| 2.2 | 15.1 | REACTOME APC C CDH1 MEDIATED DEGRADATION OF CDC20 AND OTHER APC C CDH1 TARGETED PROTEINS IN LATE MITOSIS EARLY G1 | Genes involved in APC/C:Cdh1 mediated degradation of Cdc20 and other APC/C:Cdh1 targeted proteins in late mitosis/early G1 |
| 2.1 | 19.1 | REACTOME ORC1 REMOVAL FROM CHROMATIN | Genes involved in Orc1 removal from chromatin |
| 2.0 | 75.7 | REACTOME RNA POL II TRANSCRIPTION PRE INITIATION AND PROMOTER OPENING | Genes involved in RNA Polymerase II Transcription Pre-Initiation And Promoter Opening |
| 2.0 | 173.1 | REACTOME RESPIRATORY ELECTRON TRANSPORT | Genes involved in Respiratory electron transport |
| 2.0 | 41.8 | REACTOME SYNTHESIS OF VERY LONG CHAIN FATTY ACYL COAS | Genes involved in Synthesis of very long-chain fatty acyl-CoAs |
| 2.0 | 97.1 | REACTOME SIGNALING BY ROBO RECEPTOR | Genes involved in Signaling by Robo receptor |
| 2.0 | 152.3 | REACTOME MITOTIC PROMETAPHASE | Genes involved in Mitotic Prometaphase |
| 1.8 | 25.5 | REACTOME VITAMIN B5 PANTOTHENATE METABOLISM | Genes involved in Vitamin B5 (pantothenate) metabolism |
| 1.8 | 30.9 | REACTOME ACTIVATION OF ATR IN RESPONSE TO REPLICATION STRESS | Genes involved in Activation of ATR in response to replication stress |
| 1.8 | 52.3 | REACTOME METABOLISM OF NON CODING RNA | Genes involved in Metabolism of non-coding RNA |
| 1.8 | 44.1 | REACTOME DCC MEDIATED ATTRACTIVE SIGNALING | Genes involved in DCC mediated attractive signaling |
| 1.7 | 24.2 | REACTOME TRYPTOPHAN CATABOLISM | Genes involved in Tryptophan catabolism |
| 1.7 | 13.3 | REACTOME COPI MEDIATED TRANSPORT | Genes involved in COPI Mediated Transport |
| 1.6 | 22.1 | REACTOME ACTIVATION OF CHAPERONE GENES BY ATF6 ALPHA | Genes involved in Activation of Chaperone Genes by ATF6-alpha |
| 1.5 | 38.4 | REACTOME METABOLISM OF POLYAMINES | Genes involved in Metabolism of polyamines |
| 1.5 | 21.3 | REACTOME MTORC1 MEDIATED SIGNALLING | Genes involved in mTORC1-mediated signalling |
| 1.5 | 53.1 | REACTOME CYTOSOLIC TRNA AMINOACYLATION | Genes involved in Cytosolic tRNA aminoacylation |
| 1.4 | 53.5 | REACTOME YAP1 AND WWTR1 TAZ STIMULATED GENE EXPRESSION | Genes involved in YAP1- and WWTR1 (TAZ)-stimulated gene expression |
| 1.4 | 85.4 | REACTOME MITOCHONDRIAL PROTEIN IMPORT | Genes involved in Mitochondrial Protein Import |
| 1.4 | 44.9 | REACTOME POST TRANSLATIONAL MODIFICATION SYNTHESIS OF GPI ANCHORED PROTEINS | Genes involved in Post-translational modification: synthesis of GPI-anchored proteins |
| 1.3 | 33.9 | REACTOME NONSENSE MEDIATED DECAY ENHANCED BY THE EXON JUNCTION COMPLEX | Genes involved in Nonsense Mediated Decay Enhanced by the Exon Junction Complex |
| 1.2 | 19.8 | REACTOME DESTABILIZATION OF MRNA BY TRISTETRAPROLIN TTP | Genes involved in Destabilization of mRNA by Tristetraprolin (TTP) |
| 1.2 | 32.1 | REACTOME GLUCURONIDATION | Genes involved in Glucuronidation |
| 1.2 | 39.2 | REACTOME OXYGEN DEPENDENT PROLINE HYDROXYLATION OF HYPOXIA INDUCIBLE FACTOR ALPHA | Genes involved in Oxygen-dependent Proline Hydroxylation of Hypoxia-inducible Factor Alpha |
| 1.2 | 30.2 | REACTOME AMINO ACID SYNTHESIS AND INTERCONVERSION TRANSAMINATION | Genes involved in Amino acid synthesis and interconversion (transamination) |
| 1.1 | 84.5 | REACTOME FORMATION OF THE TERNARY COMPLEX AND SUBSEQUENTLY THE 43S COMPLEX | Genes involved in Formation of the ternary complex, and subsequently, the 43S complex |
| 1.1 | 12.7 | REACTOME SEMA3A PAK DEPENDENT AXON REPULSION | Genes involved in Sema3A PAK dependent Axon repulsion |
| 1.0 | 17.8 | REACTOME PRE NOTCH TRANSCRIPTION AND TRANSLATION | Genes involved in Pre-NOTCH Transcription and Translation |
| 0.9 | 152.9 | REACTOME TRANSLATION | Genes involved in Translation |
| 0.9 | 13.7 | REACTOME ALPHA LINOLENIC ACID ALA METABOLISM | Genes involved in alpha-linolenic acid (ALA) metabolism |
| 0.9 | 27.0 | REACTOME CHOLESTEROL BIOSYNTHESIS | Genes involved in Cholesterol biosynthesis |
| 0.8 | 13.4 | REACTOME DEADENYLATION OF MRNA | Genes involved in Deadenylation of mRNA |
| 0.8 | 16.8 | REACTOME ENDOSOMAL SORTING COMPLEX REQUIRED FOR TRANSPORT ESCRT | Genes involved in Endosomal Sorting Complex Required For Transport (ESCRT) |
| 0.8 | 125.9 | REACTOME ANTIGEN PROCESSING UBIQUITINATION PROTEASOME DEGRADATION | Genes involved in Antigen processing: Ubiquitination & Proteasome degradation |
| 0.8 | 15.0 | REACTOME EXTENSION OF TELOMERES | Genes involved in Extension of Telomeres |
| 0.7 | 16.4 | REACTOME METABOLISM OF PORPHYRINS | Genes involved in Metabolism of porphyrins |
| 0.7 | 17.9 | REACTOME PURINE SALVAGE | Genes involved in Purine salvage |
| 0.7 | 7.1 | REACTOME SYNTHESIS OF PIPS AT THE LATE ENDOSOME MEMBRANE | Genes involved in Synthesis of PIPs at the late endosome membrane |
| 0.6 | 7.8 | REACTOME ROLE OF DCC IN REGULATING APOPTOSIS | Genes involved in Role of DCC in regulating apoptosis |
| 0.6 | 16.8 | REACTOME LYSOSOME VESICLE BIOGENESIS | Genes involved in Lysosome Vesicle Biogenesis |
| 0.6 | 4.5 | REACTOME REGULATORY RNA PATHWAYS | Genes involved in Regulatory RNA pathways |
| 0.6 | 18.9 | REACTOME PYRIMIDINE METABOLISM | Genes involved in Pyrimidine metabolism |
| 0.6 | 23.8 | REACTOME DEGRADATION OF THE EXTRACELLULAR MATRIX | Genes involved in Degradation of the extracellular matrix |
| 0.6 | 15.4 | REACTOME CRMPS IN SEMA3A SIGNALING | Genes involved in CRMPs in Sema3A signaling |
| 0.5 | 21.6 | REACTOME RNA POL III TRANSCRIPTION | Genes involved in RNA Polymerase III Transcription |
| 0.5 | 4.7 | REACTOME NEGATIVE REGULATION OF THE PI3K AKT NETWORK | Genes involved in Negative regulation of the PI3K/AKT network |
| 0.5 | 22.8 | REACTOME GOLGI ASSOCIATED VESICLE BIOGENESIS | Genes involved in Golgi Associated Vesicle Biogenesis |
| 0.5 | 27.6 | REACTOME ION TRANSPORT BY P TYPE ATPASES | Genes involved in Ion transport by P-type ATPases |
| 0.5 | 3.0 | REACTOME CROSS PRESENTATION OF SOLUBLE EXOGENOUS ANTIGENS ENDOSOMES | Genes involved in Cross-presentation of soluble exogenous antigens (endosomes) |
| 0.5 | 12.5 | REACTOME INSULIN RECEPTOR RECYCLING | Genes involved in Insulin receptor recycling |
| 0.5 | 1.9 | REACTOME ACTIVATED TAK1 MEDIATES P38 MAPK ACTIVATION | Genes involved in activated TAK1 mediates p38 MAPK activation |
| 0.5 | 10.8 | REACTOME G BETA GAMMA SIGNALLING THROUGH PLC BETA | Genes involved in G beta:gamma signalling through PLC beta |
| 0.5 | 9.5 | REACTOME SHC1 EVENTS IN EGFR SIGNALING | Genes involved in SHC1 events in EGFR signaling |
| 0.4 | 5.4 | REACTOME TRAF6 MEDIATED INDUCTION OF TAK1 COMPLEX | Genes involved in TRAF6 mediated induction of TAK1 complex |
| 0.4 | 4.7 | REACTOME RECRUITMENT OF NUMA TO MITOTIC CENTROSOMES | Genes involved in Recruitment of NuMA to mitotic centrosomes |
| 0.4 | 27.6 | REACTOME EXTRACELLULAR MATRIX ORGANIZATION | Genes involved in Extracellular matrix organization |
| 0.4 | 8.0 | REACTOME HYALURONAN UPTAKE AND DEGRADATION | Genes involved in Hyaluronan uptake and degradation |
| 0.4 | 46.1 | REACTOME MRNA SPLICING | Genes involved in mRNA Splicing |
| 0.4 | 0.8 | REACTOME IL 7 SIGNALING | Genes involved in Interleukin-7 signaling |
| 0.4 | 8.2 | REACTOME SIGNAL REGULATORY PROTEIN SIRP FAMILY INTERACTIONS | Genes involved in Signal regulatory protein (SIRP) family interactions |
| 0.4 | 24.7 | REACTOME SMOOTH MUSCLE CONTRACTION | Genes involved in Smooth Muscle Contraction |
| 0.4 | 6.7 | REACTOME TGF BETA RECEPTOR SIGNALING IN EMT EPITHELIAL TO MESENCHYMAL TRANSITION | Genes involved in TGF-beta receptor signaling in EMT (epithelial to mesenchymal transition) |
| 0.4 | 6.6 | REACTOME MITOCHONDRIAL FATTY ACID BETA OXIDATION | Genes involved in Mitochondrial Fatty Acid Beta-Oxidation |
| 0.4 | 29.2 | REACTOME INTERFERON ALPHA BETA SIGNALING | Genes involved in Interferon alpha/beta signaling |
| 0.3 | 17.5 | REACTOME DEPOSITION OF NEW CENPA CONTAINING NUCLEOSOMES AT THE CENTROMERE | Genes involved in Deposition of New CENPA-containing Nucleosomes at the Centromere |
| 0.3 | 4.6 | REACTOME SIGNALING BY NOTCH2 | Genes involved in Signaling by NOTCH2 |
| 0.3 | 5.4 | REACTOME HOMOLOGOUS RECOMBINATION REPAIR OF REPLICATION INDEPENDENT DOUBLE STRAND BREAKS | Genes involved in Homologous recombination repair of replication-independent double-strand breaks |
| 0.3 | 8.2 | REACTOME CELL EXTRACELLULAR MATRIX INTERACTIONS | Genes involved in Cell-extracellular matrix interactions |
| 0.2 | 1.9 | REACTOME INHIBITION OF INSULIN SECRETION BY ADRENALINE NORADRENALINE | Genes involved in Inhibition of Insulin Secretion by Adrenaline/Noradrenaline |
| 0.2 | 9.8 | REACTOME G ALPHA Z SIGNALLING EVENTS | Genes involved in G alpha (z) signalling events |
| 0.2 | 3.5 | REACTOME GLUCOSE TRANSPORT | Genes involved in Glucose transport |
| 0.2 | 6.4 | REACTOME PIP3 ACTIVATES AKT SIGNALING | Genes involved in PIP3 activates AKT signaling |
| 0.2 | 12.5 | REACTOME METABOLISM OF VITAMINS AND COFACTORS | Genes involved in Metabolism of vitamins and cofactors |
| 0.2 | 4.4 | REACTOME NEGATIVE REGULATORS OF RIG I MDA5 SIGNALING | Genes involved in Negative regulators of RIG-I/MDA5 signaling |
| 0.2 | 2.4 | REACTOME SYNTHESIS SECRETION AND INACTIVATION OF GIP | Genes involved in Synthesis, Secretion, and Inactivation of Glucose-dependent Insulinotropic Polypeptide (GIP) |
| 0.2 | 5.1 | REACTOME NOD1 2 SIGNALING PATHWAY | Genes involved in NOD1/2 Signaling Pathway |
| 0.2 | 15.1 | REACTOME TRANSCRIPTIONAL REGULATION OF WHITE ADIPOCYTE DIFFERENTIATION | Genes involved in Transcriptional Regulation of White Adipocyte Differentiation |
| 0.2 | 7.3 | REACTOME IL1 SIGNALING | Genes involved in Interleukin-1 signaling |
| 0.2 | 1.3 | REACTOME RETROGRADE NEUROTROPHIN SIGNALLING | Genes involved in Retrograde neurotrophin signalling |
| 0.2 | 10.8 | REACTOME ACTIVATION OF CHAPERONE GENES BY XBP1S | Genes involved in Activation of Chaperone Genes by XBP1(S) |
| 0.2 | 5.5 | REACTOME HS GAG BIOSYNTHESIS | Genes involved in HS-GAG biosynthesis |
| 0.1 | 1.2 | REACTOME PLATELET CALCIUM HOMEOSTASIS | Genes involved in Platelet calcium homeostasis |
| 0.1 | 1.8 | REACTOME GAMMA CARBOXYLATION TRANSPORT AND AMINO TERMINAL CLEAVAGE OF PROTEINS | Genes involved in Gamma-carboxylation, transport, and amino-terminal cleavage of proteins |
| 0.1 | 2.1 | REACTOME FACILITATIVE NA INDEPENDENT GLUCOSE TRANSPORTERS | Genes involved in Facilitative Na+-independent glucose transporters |
| 0.1 | 6.2 | REACTOME CELL DEATH SIGNALLING VIA NRAGE NRIF AND NADE | Genes involved in Cell death signalling via NRAGE, NRIF and NADE |
| 0.1 | 2.8 | REACTOME P75 NTR RECEPTOR MEDIATED SIGNALLING | Genes involved in p75 NTR receptor-mediated signalling |
| 0.1 | 2.6 | REACTOME NETRIN1 SIGNALING | Genes involved in Netrin-1 signaling |
| 0.1 | 1.9 | REACTOME N GLYCAN ANTENNAE ELONGATION | Genes involved in N-Glycan antennae elongation |
| 0.1 | 2.1 | REACTOME REGULATION OF COMPLEMENT CASCADE | Genes involved in Regulation of Complement cascade |
| 0.1 | 1.0 | REACTOME THE NLRP3 INFLAMMASOME | Genes involved in The NLRP3 inflammasome |
| 0.1 | 0.8 | REACTOME RAS ACTIVATION UOPN CA2 INFUX THROUGH NMDA RECEPTOR | Genes involved in Ras activation uopn Ca2+ infux through NMDA receptor |
| 0.1 | 4.3 | REACTOME DIABETES PATHWAYS | Genes involved in Diabetes pathways |
| 0.1 | 2.0 | REACTOME ADHERENS JUNCTIONS INTERACTIONS | Genes involved in Adherens junctions interactions |
| 0.1 | 1.3 | REACTOME NA CL DEPENDENT NEUROTRANSMITTER TRANSPORTERS | Genes involved in Na+/Cl- dependent neurotransmitter transporters |
| 0.1 | 0.9 | REACTOME PURINE RIBONUCLEOSIDE MONOPHOSPHATE BIOSYNTHESIS | Genes involved in Purine ribonucleoside monophosphate biosynthesis |
| 0.0 | 1.2 | REACTOME REGULATION OF AMPK ACTIVITY VIA LKB1 | Genes involved in Regulation of AMPK activity via LKB1 |
| 0.0 | 0.5 | REACTOME UNBLOCKING OF NMDA RECEPTOR GLUTAMATE BINDING AND ACTIVATION | Genes involved in Unblocking of NMDA receptor, glutamate binding and activation |
| 0.0 | 1.8 | REACTOME GLYCOLYSIS | Genes involved in Glycolysis |
| 0.0 | 1.0 | REACTOME BMAL1 CLOCK NPAS2 ACTIVATES CIRCADIAN EXPRESSION | Genes involved in BMAL1:CLOCK/NPAS2 Activates Circadian Expression |
| 0.0 | 0.6 | REACTOME G1 PHASE | Genes involved in G1 Phase |
| 0.0 | 2.1 | REACTOME OPIOID SIGNALLING | Genes involved in Opioid Signalling |
| 0.0 | 0.6 | REACTOME PEROXISOMAL LIPID METABOLISM | Genes involved in Peroxisomal lipid metabolism |
| 0.0 | 0.3 | REACTOME FORMATION OF INCISION COMPLEX IN GG NER | Genes involved in Formation of incision complex in GG-NER |
| 0.0 | 0.3 | REACTOME DOUBLE STRAND BREAK REPAIR | Genes involved in Double-Strand Break Repair |
| 0.0 | 0.6 | REACTOME REGULATION OF BETA CELL DEVELOPMENT | Genes involved in Regulation of beta-cell development |
| 0.0 | 0.7 | REACTOME SYNTHESIS OF PC | Genes involved in Synthesis of PC |
| 0.0 | 0.2 | REACTOME TAK1 ACTIVATES NFKB BY PHOSPHORYLATION AND ACTIVATION OF IKKS COMPLEX | Genes involved in TAK1 activates NFkB by phosphorylation and activation of IKKs complex |
| 0.0 | 0.5 | REACTOME SPHINGOLIPID DE NOVO BIOSYNTHESIS | Genes involved in Sphingolipid de novo biosynthesis |
| 0.0 | 0.2 | REACTOME SHC1 EVENTS IN ERBB4 SIGNALING | Genes involved in SHC1 events in ERBB4 signaling |