Project
GNF SymAtlas + NCI-60 cancer cell lines, comparison of cancers vs non-cancers, human (Su, 2004; Ross, 2000)
Navigation
Downloads
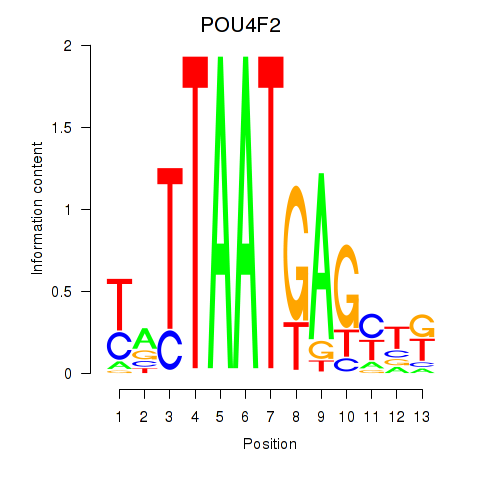
Results for POU4F2
Z-value: 0.75
Motif logo
Transcription factors associated with POU4F2
| Gene Symbol | Gene ID | Gene Info |
|---|---|---|
|
POU4F2
|
ENSG00000151615.3 | POU class 4 homeobox 2 |
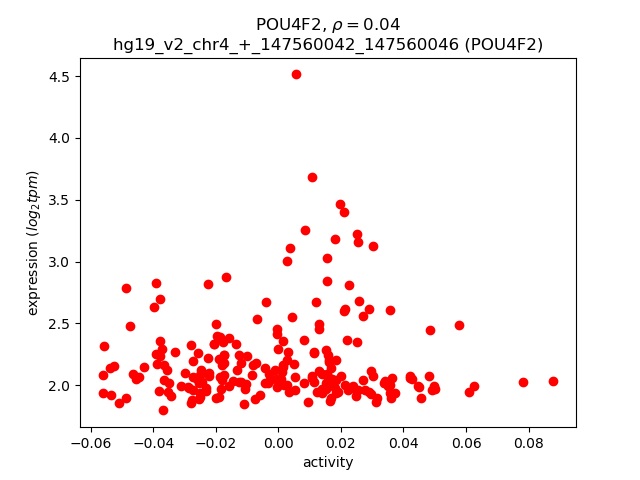
Activity-expression correlation:
| Gene | Promoter | Pearson corr. coef. | P-value | Plot |
|---|---|---|---|---|
| POU4F2 | hg19_v2_chr4_+_147560042_147560046 | 0.04 | 5.3e-01 | Click! |
Activity profile of POU4F2 motif
Sorted Z-values of POU4F2 motif
| Promoter | Log-likelihood | Transcript | Gene | Gene Info |
|---|---|---|---|---|
| chr18_+_74240610 | 9.97 |
ENST00000578092.1
ENST00000578613.1 ENST00000583578.1 |
LINC00908
|
long intergenic non-protein coding RNA 908 |
| chr3_-_58613323 | 9.75 |
ENST00000474531.1
ENST00000465970.1 |
FAM107A
|
family with sequence similarity 107, member A |
| chr5_-_134914673 | 8.05 |
ENST00000512158.1
|
CXCL14
|
chemokine (C-X-C motif) ligand 14 |
| chr6_+_151042224 | 6.95 |
ENST00000358517.2
|
PLEKHG1
|
pleckstrin homology domain containing, family G (with RhoGef domain) member 1 |
| chr10_-_73848086 | 5.09 |
ENST00000536168.1
|
SPOCK2
|
sparc/osteonectin, cwcv and kazal-like domains proteoglycan (testican) 2 |
| chr17_-_9929581 | 4.45 |
ENST00000437099.2
ENST00000396115.2 |
GAS7
|
growth arrest-specific 7 |
| chr8_-_18541603 | 4.05 |
ENST00000428502.2
|
PSD3
|
pleckstrin and Sec7 domain containing 3 |
| chr6_+_39760129 | 3.88 |
ENST00000274867.4
|
DAAM2
|
dishevelled associated activator of morphogenesis 2 |
| chr5_-_140998481 | 3.87 |
ENST00000518047.1
|
DIAPH1
|
diaphanous-related formin 1 |
| chr3_+_115342349 | 3.76 |
ENST00000393780.3
|
GAP43
|
growth associated protein 43 |
| chr10_-_73848531 | 3.62 |
ENST00000373109.2
|
SPOCK2
|
sparc/osteonectin, cwcv and kazal-like domains proteoglycan (testican) 2 |
| chrX_-_99987088 | 3.52 |
ENST00000372981.1
ENST00000263033.5 |
SYTL4
|
synaptotagmin-like 4 |
| chr1_+_50574585 | 3.40 |
ENST00000371824.1
ENST00000371823.4 |
ELAVL4
|
ELAV like neuron-specific RNA binding protein 4 |
| chr19_+_1269324 | 3.33 |
ENST00000589710.1
ENST00000588230.1 ENST00000413636.2 ENST00000586472.1 ENST00000589686.1 ENST00000444172.2 ENST00000587323.1 ENST00000320936.5 ENST00000587896.1 ENST00000589235.1 ENST00000591659.1 |
CIRBP
|
cold inducible RNA binding protein |
| chr9_-_79520989 | 3.15 |
ENST00000376713.3
ENST00000376718.3 ENST00000428286.1 |
PRUNE2
|
prune homolog 2 (Drosophila) |
| chr12_-_6233828 | 2.71 |
ENST00000572068.1
ENST00000261405.5 |
VWF
|
von Willebrand factor |
| chr16_-_4852915 | 2.39 |
ENST00000322048.7
|
ROGDI
|
rogdi homolog (Drosophila) |
| chr12_-_118796910 | 2.32 |
ENST00000541186.1
ENST00000539872.1 |
TAOK3
|
TAO kinase 3 |
| chr5_-_140998616 | 2.24 |
ENST00000389054.3
ENST00000398562.2 ENST00000389057.5 ENST00000398566.3 ENST00000398557.4 ENST00000253811.6 |
DIAPH1
|
diaphanous-related formin 1 |
| chr20_+_56136136 | 2.17 |
ENST00000319441.4
ENST00000543666.1 |
PCK1
|
phosphoenolpyruvate carboxykinase 1 (soluble) |
| chr6_-_25874440 | 2.02 |
ENST00000361703.6
ENST00000397060.4 |
SLC17A3
|
solute carrier family 17 (organic anion transporter), member 3 |
| chr1_+_198608146 | 1.79 |
ENST00000367376.2
ENST00000352140.3 ENST00000594404.1 ENST00000598951.1 ENST00000530727.1 ENST00000442510.2 ENST00000367367.4 ENST00000348564.6 ENST00000367364.1 ENST00000413409.2 |
PTPRC
|
protein tyrosine phosphatase, receptor type, C |
| chr5_+_66300446 | 1.57 |
ENST00000261569.7
|
MAST4
|
microtubule associated serine/threonine kinase family member 4 |
| chr12_-_52779433 | 1.50 |
ENST00000257951.3
|
KRT84
|
keratin 84 |
| chr4_+_78432907 | 1.47 |
ENST00000286758.4
|
CXCL13
|
chemokine (C-X-C motif) ligand 13 |
| chr2_+_44502597 | 1.47 |
ENST00000260649.6
ENST00000409387.1 |
SLC3A1
|
solute carrier family 3 (amino acid transporter heavy chain), member 1 |
| chr4_-_47983519 | 1.45 |
ENST00000358519.4
ENST00000544810.1 ENST00000402813.3 |
CNGA1
|
cyclic nucleotide gated channel alpha 1 |
| chr9_+_125132803 | 1.36 |
ENST00000540753.1
|
PTGS1
|
prostaglandin-endoperoxide synthase 1 (prostaglandin G/H synthase and cyclooxygenase) |
| chr12_+_109577202 | 1.28 |
ENST00000377848.3
ENST00000377854.5 |
ACACB
|
acetyl-CoA carboxylase beta |
| chr2_+_191792376 | 1.22 |
ENST00000409428.1
ENST00000409215.1 |
GLS
|
glutaminase |
| chr11_+_118175132 | 1.16 |
ENST00000361763.4
|
CD3E
|
CD3e molecule, epsilon (CD3-TCR complex) |
| chr1_+_229440129 | 1.15 |
ENST00000366688.3
|
SPHAR
|
S-phase response (cyclin related) |
| chr19_-_36304201 | 1.09 |
ENST00000301175.3
|
PRODH2
|
proline dehydrogenase (oxidase) 2 |
| chr10_+_18549645 | 1.01 |
ENST00000396576.2
|
CACNB2
|
calcium channel, voltage-dependent, beta 2 subunit |
| chr8_+_22857048 | 0.98 |
ENST00000251822.6
|
RHOBTB2
|
Rho-related BTB domain containing 2 |
| chr7_-_81399329 | 0.94 |
ENST00000453411.1
ENST00000444829.2 |
HGF
|
hepatocyte growth factor (hepapoietin A; scatter factor) |
| chr5_-_58295712 | 0.93 |
ENST00000317118.8
|
PDE4D
|
phosphodiesterase 4D, cAMP-specific |
| chr4_-_10686475 | 0.90 |
ENST00000226951.6
|
CLNK
|
cytokine-dependent hematopoietic cell linker |
| chr7_-_81399411 | 0.86 |
ENST00000423064.2
|
HGF
|
hepatocyte growth factor (hepapoietin A; scatter factor) |
| chr15_-_43877062 | 0.83 |
ENST00000381885.1
ENST00000396923.3 |
PPIP5K1
|
diphosphoinositol pentakisphosphate kinase 1 |
| chr3_+_108541545 | 0.80 |
ENST00000295756.6
|
TRAT1
|
T cell receptor associated transmembrane adaptor 1 |
| chr17_-_7832753 | 0.75 |
ENST00000303790.2
|
KCNAB3
|
potassium voltage-gated channel, shaker-related subfamily, beta member 3 |
| chr9_-_14308004 | 0.75 |
ENST00000493697.1
|
NFIB
|
nuclear factor I/B |
| chr3_+_108541608 | 0.71 |
ENST00000426646.1
|
TRAT1
|
T cell receptor associated transmembrane adaptor 1 |
| chrX_+_68835911 | 0.66 |
ENST00000525810.1
ENST00000527388.1 ENST00000374553.2 ENST00000374552.4 ENST00000338901.3 ENST00000524573.1 |
EDA
|
ectodysplasin A |
| chr12_-_118797475 | 0.65 |
ENST00000541786.1
ENST00000419821.2 ENST00000541878.1 |
TAOK3
|
TAO kinase 3 |
| chr6_+_10521574 | 0.64 |
ENST00000495262.1
|
GCNT2
|
glucosaminyl (N-acetyl) transferase 2, I-branching enzyme (I blood group) |
| chr10_+_95372289 | 0.63 |
ENST00000371447.3
|
PDE6C
|
phosphodiesterase 6C, cGMP-specific, cone, alpha prime |
| chr2_-_158300556 | 0.61 |
ENST00000264192.3
|
CYTIP
|
cytohesin 1 interacting protein |
| chr6_-_111136513 | 0.58 |
ENST00000368911.3
|
CDK19
|
cyclin-dependent kinase 19 |
| chr7_-_81399438 | 0.55 |
ENST00000222390.5
|
HGF
|
hepatocyte growth factor (hepapoietin A; scatter factor) |
| chr3_+_121774202 | 0.55 |
ENST00000469710.1
ENST00000493101.1 ENST00000330540.2 ENST00000264468.5 |
CD86
|
CD86 molecule |
| chr12_-_89746173 | 0.52 |
ENST00000308385.6
|
DUSP6
|
dual specificity phosphatase 6 |
| chr6_-_109777128 | 0.49 |
ENST00000358807.3
ENST00000358577.3 |
MICAL1
|
microtubule associated monooxygenase, calponin and LIM domain containing 1 |
| chr3_+_159557637 | 0.46 |
ENST00000445224.2
|
SCHIP1
|
schwannomin interacting protein 1 |
| chr17_+_68100989 | 0.44 |
ENST00000585558.1
ENST00000392670.1 |
KCNJ16
|
potassium inwardly-rectifying channel, subfamily J, member 16 |
| chr1_-_47655686 | 0.39 |
ENST00000294338.2
|
PDZK1IP1
|
PDZK1 interacting protein 1 |
| chr4_+_169418255 | 0.36 |
ENST00000505667.1
ENST00000511948.1 |
PALLD
|
palladin, cytoskeletal associated protein |
| chr8_+_50824233 | 0.34 |
ENST00000522124.1
|
SNTG1
|
syntrophin, gamma 1 |
| chr4_-_123542224 | 0.32 |
ENST00000264497.3
|
IL21
|
interleukin 21 |
| chr17_-_79623597 | 0.32 |
ENST00000574024.1
ENST00000331056.5 |
PDE6G
|
phosphodiesterase 6G, cGMP-specific, rod, gamma |
| chr14_+_55221541 | 0.29 |
ENST00000555192.1
|
SAMD4A
|
sterile alpha motif domain containing 4A |
| chr6_+_118869452 | 0.22 |
ENST00000357525.5
|
PLN
|
phospholamban |
| chr9_+_125133315 | 0.18 |
ENST00000223423.4
ENST00000362012.2 |
PTGS1
|
prostaglandin-endoperoxide synthase 1 (prostaglandin G/H synthase and cyclooxygenase) |
| chr1_-_190446759 | 0.15 |
ENST00000367462.3
|
BRINP3
|
bone morphogenetic protein/retinoic acid inducible neural-specific 3 |
| chr15_+_45544426 | 0.15 |
ENST00000347644.3
ENST00000560438.1 |
SLC28A2
|
solute carrier family 28 (concentrative nucleoside transporter), member 2 |
| chr11_-_125550764 | 0.14 |
ENST00000527795.1
|
ACRV1
|
acrosomal vesicle protein 1 |
| chr14_-_70883708 | 0.09 |
ENST00000256366.4
|
SYNJ2BP
|
synaptojanin 2 binding protein |
| chr7_-_81399355 | 0.09 |
ENST00000457544.2
|
HGF
|
hepatocyte growth factor (hepapoietin A; scatter factor) |
| chr1_+_40506392 | 0.03 |
ENST00000414893.1
ENST00000414281.1 ENST00000420216.1 ENST00000372792.2 ENST00000372798.1 ENST00000340450.3 ENST00000372805.3 ENST00000435719.1 ENST00000427843.1 ENST00000417287.1 ENST00000424977.1 ENST00000446031.1 |
CAP1
|
CAP, adenylate cyclase-associated protein 1 (yeast) |
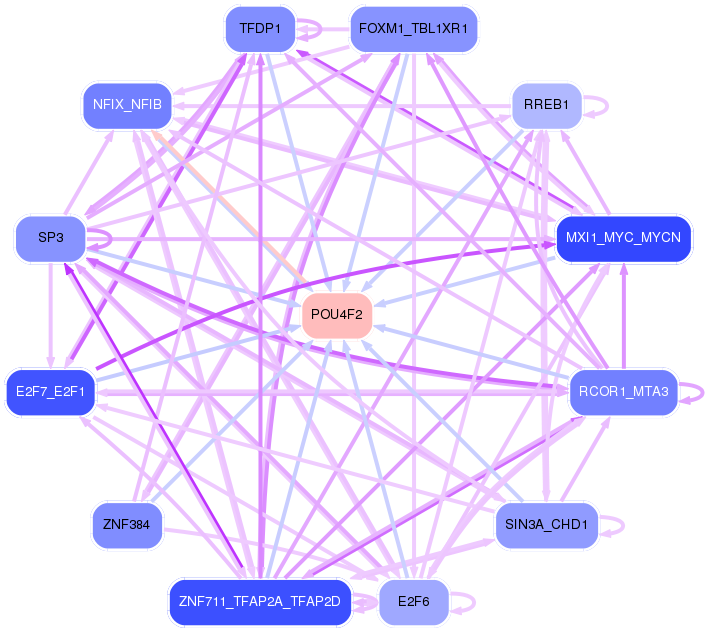
Network of associatons between targets according to the STRING database.

First level regulatory network of POU4F2
Gene Ontology Analysis
Gene overrepresentation in biological_process category:
| Log-likelihood per target | Total log-likelihood | Term | Description |
|---|---|---|---|
| 1.2 | 8.1 | GO:2000503 | positive regulation of natural killer cell chemotaxis(GO:2000503) |
| 0.5 | 2.2 | GO:0006114 | glycerol biosynthetic process(GO:0006114) response to methionine(GO:1904640) |
| 0.5 | 1.5 | GO:0033634 | positive regulation of cell-cell adhesion mediated by integrin(GO:0033634) |
| 0.5 | 6.1 | GO:0035372 | protein localization to microtubule(GO:0035372) |
| 0.4 | 8.7 | GO:0019800 | peptide cross-linking via chondroitin 4-sulfate glycosaminoglycan(GO:0019800) |
| 0.4 | 1.8 | GO:0048539 | immunoglobulin biosynthetic process(GO:0002378) bone marrow development(GO:0048539) |
| 0.4 | 3.6 | GO:0016198 | axon choice point recognition(GO:0016198) |
| 0.3 | 1.3 | GO:2001295 | malonyl-CoA biosynthetic process(GO:2001295) |
| 0.3 | 2.4 | GO:0060665 | regulation of branching involved in salivary gland morphogenesis by mesenchymal-epithelial signaling(GO:0060665) |
| 0.3 | 2.0 | GO:0015712 | hexose phosphate transport(GO:0015712) glucose-6-phosphate transport(GO:0015760) |
| 0.2 | 1.5 | GO:1990822 | L-cystine transport(GO:0015811) basic amino acid transmembrane transport(GO:1990822) |
| 0.2 | 1.2 | GO:0006543 | glutamine catabolic process(GO:0006543) |
| 0.2 | 1.2 | GO:0002913 | positive regulation of T cell anergy(GO:0002669) positive regulation of lymphocyte anergy(GO:0002913) |
| 0.2 | 4.0 | GO:0032012 | regulation of ARF protein signal transduction(GO:0032012) |
| 0.2 | 3.3 | GO:0034063 | stress granule assembly(GO:0034063) |
| 0.2 | 3.5 | GO:0071985 | multivesicular body sorting pathway(GO:0071985) |
| 0.2 | 1.5 | GO:0001920 | negative regulation of receptor recycling(GO:0001920) |
| 0.2 | 0.5 | GO:0042109 | negative regulation of tolerance induction(GO:0002644) lymphotoxin A production(GO:0032641) interleukin-4 biosynthetic process(GO:0042097) lymphotoxin A biosynthetic process(GO:0042109) regulation of interleukin-4 biosynthetic process(GO:0045402) positive regulation of interleukin-4 biosynthetic process(GO:0045404) |
| 0.2 | 1.1 | GO:0010133 | proline catabolic process to glutamate(GO:0010133) |
| 0.2 | 1.0 | GO:1904879 | positive regulation of calcium ion transmembrane transport via high voltage-gated calcium channel(GO:1904879) |
| 0.2 | 0.5 | GO:0019417 | sulfur oxidation(GO:0019417) |
| 0.1 | 0.5 | GO:1903224 | regulation of endodermal cell differentiation(GO:1903224) |
| 0.1 | 1.4 | GO:0060662 | tube lumen cavitation(GO:0060605) salivary gland cavitation(GO:0060662) |
| 0.1 | 2.9 | GO:0007095 | mitotic G2 DNA damage checkpoint(GO:0007095) |
| 0.1 | 1.5 | GO:0035878 | nail development(GO:0035878) |
| 0.1 | 0.9 | GO:0086024 | adrenergic receptor signaling pathway involved in positive regulation of heart rate(GO:0086024) |
| 0.1 | 0.6 | GO:0036438 | maintenance of lens transparency(GO:0036438) |
| 0.1 | 1.5 | GO:0019371 | cyclooxygenase pathway(GO:0019371) |
| 0.1 | 0.2 | GO:0086092 | regulation of the force of heart contraction by cardiac conduction(GO:0086092) regulation of calcium ion binding(GO:1901876) negative regulation of calcium ion binding(GO:1901877) regulation of calcium ion import into sarcoplasmic reticulum(GO:1902080) negative regulation of calcium ion import into sarcoplasmic reticulum(GO:1902081) |
| 0.0 | 1.8 | GO:0022400 | regulation of rhodopsin mediated signaling pathway(GO:0022400) |
| 0.0 | 0.8 | GO:0006020 | inositol metabolic process(GO:0006020) |
| 0.0 | 0.4 | GO:0007603 | phototransduction, visible light(GO:0007603) |
| 0.0 | 1.0 | GO:0007597 | blood coagulation, intrinsic pathway(GO:0007597) |
| 0.0 | 6.9 | GO:0035023 | regulation of Rho protein signal transduction(GO:0035023) |
| 0.0 | 0.3 | GO:0045078 | positive regulation of interferon-gamma biosynthetic process(GO:0045078) |
| 0.0 | 3.9 | GO:0007368 | determination of left/right symmetry(GO:0007368) |
| 0.0 | 2.4 | GO:0042475 | odontogenesis of dentin-containing tooth(GO:0042475) |
| 0.0 | 0.1 | GO:0015860 | purine nucleoside transmembrane transport(GO:0015860) |
| 0.0 | 9.0 | GO:0001558 | regulation of cell growth(GO:0001558) |
| 0.0 | 0.1 | GO:0048312 | intracellular distribution of mitochondria(GO:0048312) |
| 0.0 | 4.6 | GO:0007050 | cell cycle arrest(GO:0007050) |
| 0.0 | 0.4 | GO:0010107 | potassium ion import(GO:0010107) |
Gene overrepresentation in cellular_component category:
| Log-likelihood per target | Total log-likelihood | Term | Description |
|---|---|---|---|
| 0.5 | 3.8 | GO:0032584 | growth cone membrane(GO:0032584) |
| 0.2 | 2.7 | GO:0033093 | Weibel-Palade body(GO:0033093) |
| 0.1 | 3.5 | GO:0031092 | platelet alpha granule membrane(GO:0031092) |
| 0.1 | 1.2 | GO:0042105 | alpha-beta T cell receptor complex(GO:0042105) |
| 0.1 | 1.5 | GO:0042622 | photoreceptor outer segment membrane(GO:0042622) |
| 0.1 | 1.0 | GO:1990454 | L-type voltage-gated calcium channel complex(GO:1990454) |
| 0.1 | 1.5 | GO:0042101 | T cell receptor complex(GO:0042101) |
| 0.1 | 0.7 | GO:0044300 | cerebellar mossy fiber(GO:0044300) |
| 0.1 | 6.1 | GO:0072686 | mitotic spindle(GO:0072686) |
| 0.1 | 3.5 | GO:0031526 | brush border membrane(GO:0031526) |
| 0.0 | 3.3 | GO:0010494 | cytoplasmic stress granule(GO:0010494) |
| 0.0 | 0.3 | GO:0016013 | syntrophin complex(GO:0016013) |
| 0.0 | 1.5 | GO:0045095 | keratin filament(GO:0045095) |
| 0.0 | 1.9 | GO:0001750 | photoreceptor outer segment(GO:0001750) |
| 0.0 | 0.9 | GO:0005891 | voltage-gated calcium channel complex(GO:0005891) |
| 0.0 | 9.8 | GO:0016607 | nuclear speck(GO:0016607) |
| 0.0 | 8.7 | GO:0005578 | proteinaceous extracellular matrix(GO:0005578) |
| 0.0 | 0.7 | GO:0005581 | collagen trimer(GO:0005581) |
| 0.0 | 2.4 | GO:0031093 | platelet alpha granule lumen(GO:0031093) |
| 0.0 | 2.7 | GO:0032587 | ruffle membrane(GO:0032587) |
| 0.0 | 0.6 | GO:0016592 | mediator complex(GO:0016592) |
Gene overrepresentation in molecular_function category:
| Log-likelihood per target | Total log-likelihood | Term | Description |
|---|---|---|---|
| 0.7 | 2.2 | GO:0004613 | phosphoenolpyruvate carboxykinase activity(GO:0004611) phosphoenolpyruvate carboxykinase (GTP) activity(GO:0004613) |
| 0.4 | 3.3 | GO:0070181 | small ribosomal subunit rRNA binding(GO:0070181) |
| 0.4 | 1.5 | GO:0004666 | prostaglandin-endoperoxide synthase activity(GO:0004666) |
| 0.4 | 3.8 | GO:0035727 | lysophosphatidic acid binding(GO:0035727) |
| 0.4 | 1.5 | GO:0031735 | CCR10 chemokine receptor binding(GO:0031735) |
| 0.3 | 8.7 | GO:0008191 | metalloendopeptidase inhibitor activity(GO:0008191) |
| 0.3 | 1.3 | GO:0003989 | acetyl-CoA carboxylase activity(GO:0003989) |
| 0.3 | 2.0 | GO:0015562 | efflux transmembrane transporter activity(GO:0015562) |
| 0.3 | 1.1 | GO:0004657 | proline dehydrogenase activity(GO:0004657) |
| 0.3 | 3.5 | GO:0042043 | neurexin family protein binding(GO:0042043) |
| 0.2 | 1.5 | GO:0015184 | L-cystine transmembrane transporter activity(GO:0015184) |
| 0.2 | 1.2 | GO:0004359 | glutaminase activity(GO:0004359) |
| 0.2 | 8.1 | GO:0008009 | chemokine activity(GO:0008009) |
| 0.2 | 0.8 | GO:0033857 | diphosphoinositol-pentakisphosphate kinase activity(GO:0033857) |
| 0.2 | 4.0 | GO:0005086 | ARF guanyl-nucleotide exchange factor activity(GO:0005086) |
| 0.1 | 1.0 | GO:0086056 | voltage-gated calcium channel activity involved in AV node cell action potential(GO:0086056) |
| 0.1 | 1.5 | GO:0043855 | intracellular cyclic nucleotide activated cation channel activity(GO:0005221) cyclic nucleotide-gated ion channel activity(GO:0043855) |
| 0.1 | 1.5 | GO:0030280 | structural constituent of epidermis(GO:0030280) |
| 0.1 | 3.4 | GO:0017091 | AU-rich element binding(GO:0017091) |
| 0.1 | 0.6 | GO:0008109 | N-acetyllactosaminide beta-1,6-N-acetylglucosaminyltransferase activity(GO:0008109) |
| 0.1 | 1.2 | GO:0042608 | T cell receptor binding(GO:0042608) |
| 0.1 | 3.0 | GO:0004709 | MAP kinase kinase kinase activity(GO:0004709) |
| 0.1 | 2.7 | GO:0019865 | immunoglobulin binding(GO:0019865) |
| 0.1 | 10.0 | GO:0017048 | Rho GTPase binding(GO:0017048) |
| 0.1 | 6.9 | GO:0005089 | Rho guanyl-nucleotide exchange factor activity(GO:0005089) |
| 0.1 | 1.5 | GO:0005068 | transmembrane receptor protein tyrosine kinase adaptor activity(GO:0005068) |
| 0.1 | 1.8 | GO:0005001 | transmembrane receptor protein tyrosine phosphatase activity(GO:0005001) transmembrane receptor protein phosphatase activity(GO:0019198) |
| 0.1 | 2.4 | GO:0042056 | chemoattractant activity(GO:0042056) |
| 0.1 | 0.2 | GO:0042030 | ATPase inhibitor activity(GO:0042030) |
| 0.1 | 0.3 | GO:0005134 | interleukin-2 receptor binding(GO:0005134) |
| 0.0 | 0.9 | GO:0031698 | beta-2 adrenergic receptor binding(GO:0031698) |
| 0.0 | 0.9 | GO:0030553 | cGMP binding(GO:0030553) |
| 0.0 | 0.1 | GO:0005415 | nucleoside:sodium symporter activity(GO:0005415) |
| 0.0 | 0.5 | GO:0017017 | MAP kinase tyrosine/serine/threonine phosphatase activity(GO:0017017) |
| 0.0 | 0.4 | GO:0015467 | G-protein activated inward rectifier potassium channel activity(GO:0015467) |
| 0.0 | 0.5 | GO:0071949 | FAD binding(GO:0071949) |
| 0.0 | 0.7 | GO:0005164 | tumor necrosis factor receptor binding(GO:0005164) |
| 0.0 | 0.3 | GO:0030371 | translation repressor activity(GO:0030371) |
| 0.0 | 0.5 | GO:0015026 | coreceptor activity(GO:0015026) |
Gene overrepresentation in C2:CP category:
| Log-likelihood per target | Total log-likelihood | Term | Description |
|---|---|---|---|
| 0.2 | 8.7 | NABA PROTEOGLYCANS | Genes encoding proteoglycans |
| 0.1 | 8.5 | PID ECADHERIN STABILIZATION PATHWAY | Stabilization and expansion of the E-cadherin adherens junction |
| 0.1 | 3.8 | PID NCADHERIN PATHWAY | N-cadherin signaling events |
| 0.1 | 3.0 | PID P38 MKK3 6PATHWAY | p38 MAPK signaling pathway |
| 0.1 | 0.6 | PID CONE PATHWAY | Visual signal transduction: Cones |
| 0.1 | 1.8 | PID RHODOPSIN PATHWAY | Visual signal transduction: Rods |
| 0.0 | 3.5 | PID CD8 TCR PATHWAY | TCR signaling in naïve CD8+ T cells |
| 0.0 | 2.2 | PID HNF3B PATHWAY | FOXA2 and FOXA3 transcription factor networks |
| 0.0 | 1.5 | PID CXCR3 PATHWAY | CXCR3-mediated signaling events |
| 0.0 | 8.0 | NABA SECRETED FACTORS | Genes encoding secreted soluble factors |
| 0.0 | 0.5 | ST ERK1 ERK2 MAPK PATHWAY | ERK1/ERK2 MAPK Pathway |
| 0.0 | 2.7 | NABA ECM GLYCOPROTEINS | Genes encoding structural ECM glycoproteins |
| 0.0 | 0.7 | PID HNF3A PATHWAY | FOXA1 transcription factor network |
Gene overrepresentation in C2:CP:REACTOME category:
| Log-likelihood per target | Total log-likelihood | Term | Description |
|---|---|---|---|
| 0.2 | 2.2 | REACTOME ABACAVIR TRANSPORT AND METABOLISM | Genes involved in Abacavir transport and metabolism |
| 0.2 | 2.7 | REACTOME PLATELET ADHESION TO EXPOSED COLLAGEN | Genes involved in Platelet Adhesion to exposed collagen |
| 0.1 | 2.4 | REACTOME IL 7 SIGNALING | Genes involved in Interleukin-7 signaling |
| 0.1 | 2.9 | REACTOME PHOSPHORYLATION OF CD3 AND TCR ZETA CHAINS | Genes involved in Phosphorylation of CD3 and TCR zeta chains |
| 0.1 | 1.5 | REACTOME DOWNSTREAM TCR SIGNALING | Genes involved in Downstream TCR signaling |
| 0.0 | 1.2 | REACTOME GLUTAMATE NEUROTRANSMITTER RELEASE CYCLE | Genes involved in Glutamate Neurotransmitter Release Cycle |
| 0.0 | 1.3 | REACTOME ACTIVATED AMPK STIMULATES FATTY ACID OXIDATION IN MUSCLE | Genes involved in Activated AMPK stimulates fatty-acid oxidation in muscle |
| 0.0 | 1.5 | REACTOME AMINO ACID TRANSPORT ACROSS THE PLASMA MEMBRANE | Genes involved in Amino acid transport across the plasma membrane |
| 0.0 | 0.5 | REACTOME ERKS ARE INACTIVATED | Genes involved in ERKs are inactivated |
| 0.0 | 1.0 | REACTOME INHIBITION OF INSULIN SECRETION BY ADRENALINE NORADRENALINE | Genes involved in Inhibition of Insulin Secretion by Adrenaline/Noradrenaline |
| 0.0 | 0.5 | REACTOME CD28 DEPENDENT VAV1 PATHWAY | Genes involved in CD28 dependent Vav1 pathway |
| 0.0 | 0.7 | REACTOME RNA POL III TRANSCRIPTION TERMINATION | Genes involved in RNA Polymerase III Transcription Termination |
| 0.0 | 1.5 | REACTOME CHEMOKINE RECEPTORS BIND CHEMOKINES | Genes involved in Chemokine receptors bind chemokines |
| 0.0 | 0.4 | REACTOME INHIBITION OF VOLTAGE GATED CA2 CHANNELS VIA GBETA GAMMA SUBUNITS | Genes involved in Inhibition of voltage gated Ca2+ channels via Gbeta/gamma subunits |
| 0.0 | 0.9 | REACTOME DARPP 32 EVENTS | Genes involved in DARPP-32 events |
| 0.0 | 1.5 | REACTOME PHASE1 FUNCTIONALIZATION OF COMPOUNDS | Genes involved in Phase 1 - Functionalization of compounds |
| 0.0 | 0.7 | REACTOME VOLTAGE GATED POTASSIUM CHANNELS | Genes involved in Voltage gated Potassium channels |