Project
GNF SymAtlas + NCI-60 cancer cell lines, comparison of cancers vs non-cancers, human (Su, 2004; Ross, 2000)
Navigation
Downloads
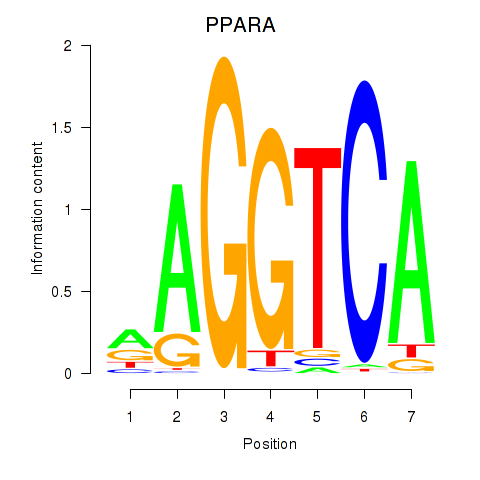
Results for PPARA
Z-value: 0.31
Motif logo
Transcription factors associated with PPARA
| Gene Symbol | Gene ID | Gene Info |
|---|---|---|
|
PPARA
|
ENSG00000186951.12 | peroxisome proliferator activated receptor alpha |
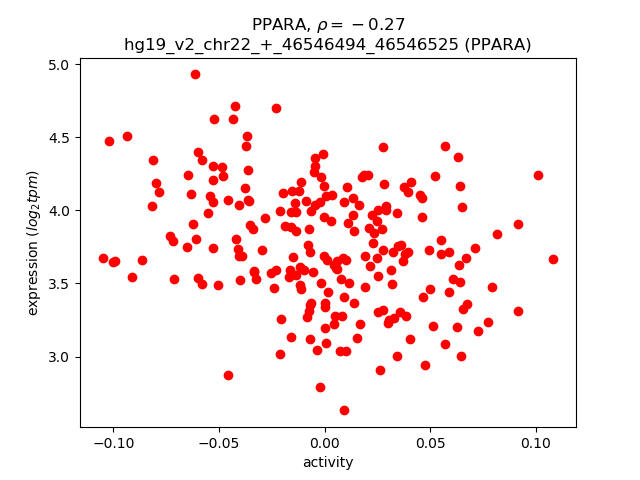
Activity-expression correlation:
| Gene | Promoter | Pearson corr. coef. | P-value | Plot |
|---|---|---|---|---|
| PPARA | hg19_v2_chr22_+_46546494_46546525 | -0.27 | 4.1e-05 | Click! |
Activity profile of PPARA motif
Sorted Z-values of PPARA motif
| Promoter | Log-likelihood | Transcript | Gene | Gene Info |
|---|---|---|---|---|
| chr2_-_176046391 | 24.25 |
ENST00000392541.3
ENST00000409194.1 |
ATP5G3
|
ATP synthase, H+ transporting, mitochondrial Fo complex, subunit C3 (subunit 9) |
| chr22_+_23264766 | 15.49 |
ENST00000390331.2
|
IGLC7
|
immunoglobulin lambda constant 7 |
| chr1_+_169075554 | 14.72 |
ENST00000367815.4
|
ATP1B1
|
ATPase, Na+/K+ transporting, beta 1 polypeptide |
| chr7_-_72936531 | 14.52 |
ENST00000339594.4
|
BAZ1B
|
bromodomain adjacent to zinc finger domain, 1B |
| chr1_-_26233423 | 13.56 |
ENST00000357865.2
|
STMN1
|
stathmin 1 |
| chr1_+_46769303 | 12.36 |
ENST00000311672.5
|
UQCRH
|
ubiquinol-cytochrome c reductase hinge protein |
| chr13_-_41635512 | 11.35 |
ENST00000405737.2
|
ELF1
|
E74-like factor 1 (ets domain transcription factor) |
| chr7_-_10979750 | 10.72 |
ENST00000339600.5
|
NDUFA4
|
NADH dehydrogenase (ubiquinone) 1 alpha subcomplex, 4, 9kDa |
| chr3_-_18480260 | 10.60 |
ENST00000454909.2
|
SATB1
|
SATB homeobox 1 |
| chr14_-_104387888 | 10.37 |
ENST00000286953.3
|
C14orf2
|
chromosome 14 open reading frame 2 |
| chr15_+_75335604 | 9.94 |
ENST00000563393.1
|
PPCDC
|
phosphopantothenoylcysteine decarboxylase |
| chr2_+_201936707 | 9.89 |
ENST00000433898.1
ENST00000454214.1 |
NDUFB3
|
NADH dehydrogenase (ubiquinone) 1 beta subcomplex, 3, 12kDa |
| chr20_+_11898507 | 9.80 |
ENST00000378226.2
|
BTBD3
|
BTB (POZ) domain containing 3 |
| chr17_-_27503770 | 9.39 |
ENST00000533112.1
|
MYO18A
|
myosin XVIIIA |
| chr7_-_123197733 | 9.36 |
ENST00000470123.1
ENST00000471770.1 |
NDUFA5
|
NADH dehydrogenase (ubiquinone) 1 alpha subcomplex, 5 |
| chr2_-_44223138 | 9.36 |
ENST00000260665.7
|
LRPPRC
|
leucine-rich pentatricopeptide repeat containing |
| chr12_+_120875910 | 9.35 |
ENST00000551806.1
|
AL021546.6
|
Glutamyl-tRNA(Gln) amidotransferase subunit C, mitochondrial |
| chr8_+_145149930 | 9.29 |
ENST00000318911.4
|
CYC1
|
cytochrome c-1 |
| chr1_+_169077172 | 9.26 |
ENST00000499679.3
|
ATP1B1
|
ATPase, Na+/K+ transporting, beta 1 polypeptide |
| chr14_-_104387831 | 9.16 |
ENST00000557040.1
ENST00000414262.2 ENST00000555030.1 ENST00000554713.1 ENST00000553430.1 |
C14orf2
|
chromosome 14 open reading frame 2 |
| chr18_-_43678241 | 8.95 |
ENST00000593152.2
ENST00000589252.1 ENST00000590665.1 ENST00000398752.6 |
ATP5A1
|
ATP synthase, H+ transporting, mitochondrial F1 complex, alpha subunit 1, cardiac muscle |
| chr22_-_43355858 | 8.93 |
ENST00000402229.1
ENST00000407585.1 ENST00000453079.1 |
PACSIN2
|
protein kinase C and casein kinase substrate in neurons 2 |
| chr22_+_23248512 | 8.86 |
ENST00000390325.2
|
IGLC3
|
immunoglobulin lambda constant 3 (Kern-Oz+ marker) |
| chr16_-_47007545 | 8.79 |
ENST00000317089.5
|
DNAJA2
|
DnaJ (Hsp40) homolog, subfamily A, member 2 |
| chr14_-_58893832 | 8.69 |
ENST00000556007.2
|
TIMM9
|
translocase of inner mitochondrial membrane 9 homolog (yeast) |
| chr14_-_21492251 | 8.44 |
ENST00000554398.1
|
NDRG2
|
NDRG family member 2 |
| chr12_+_96252706 | 8.39 |
ENST00000266735.5
ENST00000553192.1 ENST00000552085.1 |
SNRPF
|
small nuclear ribonucleoprotein polypeptide F |
| chr1_-_205719295 | 8.36 |
ENST00000367142.4
|
NUCKS1
|
nuclear casein kinase and cyclin-dependent kinase substrate 1 |
| chr16_-_23607598 | 8.25 |
ENST00000562133.1
ENST00000570319.1 ENST00000007516.3 |
NDUFAB1
|
NADH dehydrogenase (ubiquinone) 1, alpha/beta subcomplex, 1, 8kDa |
| chr12_+_120875887 | 7.84 |
ENST00000229379.2
|
COX6A1
|
cytochrome c oxidase subunit VIa polypeptide 1 |
| chr17_-_56082455 | 7.83 |
ENST00000578794.1
|
RP11-159D12.5
|
Uncharacterized protein |
| chr20_+_3776371 | 7.75 |
ENST00000245960.5
|
CDC25B
|
cell division cycle 25B |
| chr5_+_162930114 | 7.75 |
ENST00000280969.5
|
MAT2B
|
methionine adenosyltransferase II, beta |
| chr19_-_12912601 | 7.73 |
ENST00000334482.5
|
PRDX2
|
peroxiredoxin 2 |
| chr3_-_33700589 | 7.72 |
ENST00000461133.3
ENST00000496954.2 |
CLASP2
|
cytoplasmic linker associated protein 2 |
| chr17_-_4852332 | 7.71 |
ENST00000572383.1
|
PFN1
|
profilin 1 |
| chr20_+_3776936 | 7.71 |
ENST00000439880.2
|
CDC25B
|
cell division cycle 25B |
| chr5_+_156712372 | 7.69 |
ENST00000541131.1
|
CYFIP2
|
cytoplasmic FMR1 interacting protein 2 |
| chr16_-_88717423 | 7.64 |
ENST00000568278.1
ENST00000569359.1 ENST00000567174.1 |
CYBA
|
cytochrome b-245, alpha polypeptide |
| chr7_-_123198284 | 7.62 |
ENST00000355749.2
|
NDUFA5
|
NADH dehydrogenase (ubiquinone) 1 alpha subcomplex, 5 |
| chr16_+_21964662 | 7.34 |
ENST00000561553.1
ENST00000565331.1 |
UQCRC2
|
ubiquinol-cytochrome c reductase core protein II |
| chr3_-_113465065 | 7.14 |
ENST00000497255.1
ENST00000478020.1 ENST00000240922.3 ENST00000493900.1 |
NAA50
|
N(alpha)-acetyltransferase 50, NatE catalytic subunit |
| chr3_-_33700933 | 7.11 |
ENST00000480013.1
|
CLASP2
|
cytoplasmic linker associated protein 2 |
| chr5_-_140027175 | 7.09 |
ENST00000512088.1
|
NDUFA2
|
NADH dehydrogenase (ubiquinone) 1 alpha subcomplex, 2, 8kDa |
| chr8_-_18666360 | 7.08 |
ENST00000286485.8
|
PSD3
|
pleckstrin and Sec7 domain containing 3 |
| chr4_-_74088800 | 6.99 |
ENST00000509867.2
|
ANKRD17
|
ankyrin repeat domain 17 |
| chr17_-_73844722 | 6.88 |
ENST00000586257.1
|
WBP2
|
WW domain binding protein 2 |
| chr17_+_2699697 | 6.76 |
ENST00000254695.8
ENST00000366401.4 ENST00000542807.1 |
RAP1GAP2
|
RAP1 GTPase activating protein 2 |
| chr19_+_17416457 | 6.76 |
ENST00000252602.1
|
MRPL34
|
mitochondrial ribosomal protein L34 |
| chr1_+_145516560 | 6.75 |
ENST00000537888.1
|
PEX11B
|
peroxisomal biogenesis factor 11 beta |
| chr10_+_11207438 | 6.75 |
ENST00000609692.1
ENST00000354897.3 |
CELF2
|
CUGBP, Elav-like family member 2 |
| chr9_+_127624387 | 6.75 |
ENST00000353214.2
|
ARPC5L
|
actin related protein 2/3 complex, subunit 5-like |
| chr11_+_73498898 | 6.72 |
ENST00000535529.1
ENST00000497094.2 ENST00000411840.2 ENST00000535277.1 ENST00000398483.3 ENST00000542303.1 |
MRPL48
|
mitochondrial ribosomal protein L48 |
| chr17_+_79670386 | 6.70 |
ENST00000333676.3
ENST00000571730.1 ENST00000541223.1 |
MRPL12
SLC25A10
SLC25A10
|
mitochondrial ribosomal protein L12 Mitochondrial dicarboxylate carrier; Uncharacterized protein; cDNA FLJ60124, highly similar to Mitochondrial dicarboxylate carrier solute carrier family 25 (mitochondrial carrier; dicarboxylate transporter), member 10 |
| chr1_+_145516252 | 6.60 |
ENST00000369306.3
|
PEX11B
|
peroxisomal biogenesis factor 11 beta |
| chr4_-_140216948 | 6.59 |
ENST00000265500.4
|
NDUFC1
|
NADH dehydrogenase (ubiquinone) 1, subcomplex unknown, 1, 6kDa |
| chr8_-_80942139 | 6.56 |
ENST00000521434.1
ENST00000519120.1 ENST00000520946.1 |
MRPS28
|
mitochondrial ribosomal protein S28 |
| chr1_+_236558694 | 6.43 |
ENST00000359362.5
|
EDARADD
|
EDAR-associated death domain |
| chr19_+_17416609 | 6.39 |
ENST00000602206.1
|
MRPL34
|
mitochondrial ribosomal protein L34 |
| chr16_+_85646763 | 6.39 |
ENST00000411612.1
ENST00000253458.7 |
GSE1
|
Gse1 coiled-coil protein |
| chr14_-_21492113 | 6.35 |
ENST00000554094.1
|
NDRG2
|
NDRG family member 2 |
| chr1_-_24126023 | 6.33 |
ENST00000429356.1
|
GALE
|
UDP-galactose-4-epimerase |
| chr16_-_69368774 | 6.28 |
ENST00000562949.1
|
RP11-343C2.12
|
Conserved oligomeric Golgi complex subunit 8 |
| chr10_+_81107271 | 6.25 |
ENST00000448165.1
|
PPIF
|
peptidylprolyl isomerase F |
| chr3_+_113465866 | 6.23 |
ENST00000273398.3
ENST00000538620.1 ENST00000496747.1 ENST00000475322.1 |
ATP6V1A
|
ATPase, H+ transporting, lysosomal 70kDa, V1 subunit A |
| chr1_-_149889382 | 6.18 |
ENST00000369145.1
ENST00000369146.3 |
SV2A
|
synaptic vesicle glycoprotein 2A |
| chr1_+_50574585 | 6.12 |
ENST00000371824.1
ENST00000371823.4 |
ELAVL4
|
ELAV like neuron-specific RNA binding protein 4 |
| chr11_-_64013663 | 6.10 |
ENST00000392210.2
|
PPP1R14B
|
protein phosphatase 1, regulatory (inhibitor) subunit 14B |
| chr10_+_99185917 | 6.10 |
ENST00000334828.5
|
PGAM1
|
phosphoglycerate mutase 1 (brain) |
| chr3_-_42845951 | 6.09 |
ENST00000418900.2
ENST00000430190.1 |
HIGD1A
|
HIG1 hypoxia inducible domain family, member 1A |
| chrX_+_47053208 | 6.08 |
ENST00000442035.1
ENST00000457753.1 ENST00000335972.6 |
UBA1
|
ubiquitin-like modifier activating enzyme 1 |
| chr22_+_23243156 | 6.01 |
ENST00000390323.2
|
IGLC2
|
immunoglobulin lambda constant 2 (Kern-Oz- marker) |
| chr16_+_6069586 | 6.00 |
ENST00000547372.1
|
RBFOX1
|
RNA binding protein, fox-1 homolog (C. elegans) 1 |
| chr12_+_121837905 | 5.99 |
ENST00000392465.3
ENST00000554606.1 ENST00000392464.2 ENST00000555076.1 |
RNF34
|
ring finger protein 34, E3 ubiquitin protein ligase |
| chr6_+_42984723 | 5.95 |
ENST00000332245.8
|
KLHDC3
|
kelch domain containing 3 |
| chr20_-_62130474 | 5.95 |
ENST00000217182.3
|
EEF1A2
|
eukaryotic translation elongation factor 1 alpha 2 |
| chr15_+_25200108 | 5.89 |
ENST00000577949.1
ENST00000338094.6 ENST00000338327.4 ENST00000579070.1 ENST00000577565.1 |
SNURF
SNRPN
|
SNRPN upstream reading frame protein small nuclear ribonucleoprotein polypeptide N |
| chr14_-_24911868 | 5.88 |
ENST00000554698.1
|
SDR39U1
|
short chain dehydrogenase/reductase family 39U, member 1 |
| chr5_+_52856456 | 5.85 |
ENST00000296684.5
ENST00000506765.1 |
NDUFS4
|
NADH dehydrogenase (ubiquinone) Fe-S protein 4, 18kDa (NADH-coenzyme Q reductase) |
| chr15_+_25200074 | 5.80 |
ENST00000390687.4
ENST00000584968.1 ENST00000346403.6 ENST00000554227.2 |
SNRPN
|
small nuclear ribonucleoprotein polypeptide N |
| chr8_-_131028660 | 5.76 |
ENST00000401979.2
ENST00000517654.1 ENST00000522361.1 ENST00000518167.1 |
FAM49B
|
family with sequence similarity 49, member B |
| chr14_+_23791159 | 5.75 |
ENST00000557702.1
|
PABPN1
|
poly(A) binding protein, nuclear 1 |
| chr2_-_207023918 | 5.70 |
ENST00000455934.2
ENST00000449699.1 ENST00000454195.1 |
NDUFS1
|
NADH dehydrogenase (ubiquinone) Fe-S protein 1, 75kDa (NADH-coenzyme Q reductase) |
| chr2_-_207024233 | 5.58 |
ENST00000423725.1
ENST00000233190.6 |
NDUFS1
|
NADH dehydrogenase (ubiquinone) Fe-S protein 1, 75kDa (NADH-coenzyme Q reductase) |
| chr2_-_207024134 | 5.58 |
ENST00000457011.1
ENST00000440274.1 ENST00000432169.1 |
NDUFS1
|
NADH dehydrogenase (ubiquinone) Fe-S protein 1, 75kDa (NADH-coenzyme Q reductase) |
| chr19_-_39826639 | 5.48 |
ENST00000602185.1
ENST00000598034.1 ENST00000601387.1 ENST00000595636.1 ENST00000253054.8 ENST00000594700.1 ENST00000597595.1 |
GMFG
|
glia maturation factor, gamma |
| chr13_-_31191642 | 5.47 |
ENST00000405805.1
|
HMGB1
|
high mobility group box 1 |
| chr12_-_54069856 | 5.45 |
ENST00000602871.1
|
ATP5G2
|
ATP synthase, H+ transporting, mitochondrial Fo complex, subunit C2 (subunit 9) |
| chr12_+_6976687 | 5.45 |
ENST00000396705.5
|
TPI1
|
triosephosphate isomerase 1 |
| chr2_-_86422095 | 5.43 |
ENST00000254636.5
|
IMMT
|
inner membrane protein, mitochondrial |
| chr19_+_8509842 | 5.32 |
ENST00000325495.4
ENST00000600092.1 ENST00000594907.1 ENST00000596984.1 ENST00000601645.1 |
HNRNPM
|
heterogeneous nuclear ribonucleoprotein M |
| chr1_+_174769006 | 5.32 |
ENST00000489615.1
|
RABGAP1L
|
RAB GTPase activating protein 1-like |
| chr17_-_4269920 | 5.32 |
ENST00000572484.1
|
UBE2G1
|
ubiquitin-conjugating enzyme E2G 1 |
| chr19_-_10464570 | 5.28 |
ENST00000529739.1
|
TYK2
|
tyrosine kinase 2 |
| chr21_-_27107198 | 5.28 |
ENST00000400094.1
|
ATP5J
|
ATP synthase, H+ transporting, mitochondrial Fo complex, subunit F6 |
| chr12_-_54070098 | 5.27 |
ENST00000394349.3
ENST00000549164.1 |
ATP5G2
|
ATP synthase, H+ transporting, mitochondrial Fo complex, subunit C2 (subunit 9) |
| chr22_+_30163340 | 5.23 |
ENST00000330029.6
ENST00000401406.3 |
UQCR10
|
ubiquinol-cytochrome c reductase, complex III subunit X |
| chr10_+_81107216 | 5.22 |
ENST00000394579.3
ENST00000225174.3 |
PPIF
|
peptidylprolyl isomerase F |
| chr12_+_98987369 | 5.21 |
ENST00000401722.3
ENST00000188376.5 ENST00000228318.3 ENST00000551917.1 ENST00000548046.1 ENST00000552981.1 ENST00000551265.1 ENST00000550695.1 ENST00000547534.1 ENST00000549338.1 ENST00000548847.1 |
SLC25A3
|
solute carrier family 25 (mitochondrial carrier; phosphate carrier), member 3 |
| chr16_+_4674787 | 5.18 |
ENST00000262370.7
|
MGRN1
|
mahogunin ring finger 1, E3 ubiquitin protein ligase |
| chr1_+_165796753 | 5.17 |
ENST00000367879.4
|
UCK2
|
uridine-cytidine kinase 2 |
| chr12_-_16759711 | 5.11 |
ENST00000447609.1
|
LMO3
|
LIM domain only 3 (rhombotin-like 2) |
| chr3_-_98241760 | 5.11 |
ENST00000507874.1
ENST00000502299.1 ENST00000508659.1 ENST00000510545.1 ENST00000511667.1 ENST00000394185.2 ENST00000394181.2 ENST00000508902.1 ENST00000341181.6 ENST00000437922.1 ENST00000394180.2 |
CLDND1
|
claudin domain containing 1 |
| chr3_-_167452262 | 5.06 |
ENST00000487947.2
|
PDCD10
|
programmed cell death 10 |
| chr20_+_10199468 | 5.01 |
ENST00000254976.2
ENST00000304886.2 |
SNAP25
|
synaptosomal-associated protein, 25kDa |
| chr1_+_32757668 | 4.98 |
ENST00000373548.3
|
HDAC1
|
histone deacetylase 1 |
| chr3_-_98241358 | 4.98 |
ENST00000503004.1
ENST00000506575.1 ENST00000513452.1 ENST00000515620.1 |
CLDND1
|
claudin domain containing 1 |
| chr17_-_47492164 | 4.98 |
ENST00000512041.2
ENST00000446735.1 ENST00000504124.1 |
PHB
|
prohibitin |
| chr3_+_159557637 | 4.97 |
ENST00000445224.2
|
SCHIP1
|
schwannomin interacting protein 1 |
| chr2_-_2334888 | 4.96 |
ENST00000428368.2
ENST00000399161.2 |
MYT1L
|
myelin transcription factor 1-like |
| chr19_-_2328572 | 4.94 |
ENST00000252622.10
|
LSM7
|
LSM7 homolog, U6 small nuclear RNA associated (S. cerevisiae) |
| chr5_+_218356 | 4.93 |
ENST00000264932.6
ENST00000504309.1 ENST00000510361.1 |
SDHA
|
succinate dehydrogenase complex, subunit A, flavoprotein (Fp) |
| chr14_-_102552659 | 4.81 |
ENST00000441629.2
|
HSP90AA1
|
heat shock protein 90kDa alpha (cytosolic), class A member 1 |
| chr8_+_56014949 | 4.78 |
ENST00000327381.6
|
XKR4
|
XK, Kell blood group complex subunit-related family, member 4 |
| chr16_+_85646891 | 4.74 |
ENST00000393243.1
|
GSE1
|
Gse1 coiled-coil protein |
| chr21_-_27107344 | 4.74 |
ENST00000457143.2
|
ATP5J
|
ATP synthase, H+ transporting, mitochondrial Fo complex, subunit F6 |
| chr6_-_41039567 | 4.72 |
ENST00000468811.1
|
OARD1
|
O-acyl-ADP-ribose deacylase 1 |
| chr11_-_78052923 | 4.72 |
ENST00000340149.2
|
GAB2
|
GRB2-associated binding protein 2 |
| chr12_+_6833437 | 4.70 |
ENST00000534947.1
ENST00000541866.1 ENST00000534877.1 ENST00000538753.1 |
COPS7A
|
COP9 signalosome subunit 7A |
| chr1_-_17380630 | 4.69 |
ENST00000375499.3
|
SDHB
|
succinate dehydrogenase complex, subunit B, iron sulfur (Ip) |
| chr2_+_201936458 | 4.68 |
ENST00000237889.4
|
NDUFB3
|
NADH dehydrogenase (ubiquinone) 1 beta subcomplex, 3, 12kDa |
| chr7_+_150065879 | 4.67 |
ENST00000397281.2
ENST00000444957.1 ENST00000466559.1 ENST00000489432.2 ENST00000475514.1 ENST00000482680.1 ENST00000488943.1 ENST00000518514.1 ENST00000478789.1 |
REPIN1
ZNF775
|
replication initiator 1 zinc finger protein 775 |
| chr3_+_179322481 | 4.66 |
ENST00000259037.3
|
NDUFB5
|
NADH dehydrogenase (ubiquinone) 1 beta subcomplex, 5, 16kDa |
| chr12_-_118810688 | 4.62 |
ENST00000542532.1
ENST00000392533.3 |
TAOK3
|
TAO kinase 3 |
| chrX_+_38420783 | 4.61 |
ENST00000422612.2
ENST00000286824.6 ENST00000545599.1 |
TSPAN7
|
tetraspanin 7 |
| chr17_-_4269768 | 4.60 |
ENST00000396981.2
|
UBE2G1
|
ubiquitin-conjugating enzyme E2G 1 |
| chr11_+_34938119 | 4.59 |
ENST00000227868.4
ENST00000430469.2 ENST00000533262.1 |
PDHX
|
pyruvate dehydrogenase complex, component X |
| chr4_-_140222358 | 4.59 |
ENST00000505036.1
ENST00000544855.1 ENST00000539002.1 |
NDUFC1
|
NADH dehydrogenase (ubiquinone) 1, subcomplex unknown, 1, 6kDa |
| chr11_-_73687997 | 4.58 |
ENST00000545212.1
|
UCP2
|
uncoupling protein 2 (mitochondrial, proton carrier) |
| chr15_+_52311398 | 4.58 |
ENST00000261845.5
|
MAPK6
|
mitogen-activated protein kinase 6 |
| chr2_+_64069459 | 4.55 |
ENST00000445915.2
ENST00000475462.1 |
UGP2
|
UDP-glucose pyrophosphorylase 2 |
| chr17_-_7216939 | 4.52 |
ENST00000573684.1
|
GPS2
|
G protein pathway suppressor 2 |
| chr12_+_121837844 | 4.52 |
ENST00000361234.5
|
RNF34
|
ring finger protein 34, E3 ubiquitin protein ligase |
| chrX_-_152989798 | 4.49 |
ENST00000441714.1
ENST00000442093.1 ENST00000429550.1 ENST00000345046.6 |
BCAP31
|
B-cell receptor-associated protein 31 |
| chr10_+_51371390 | 4.45 |
ENST00000478381.1
ENST00000451577.2 ENST00000374098.2 ENST00000374097.2 |
TIMM23B
|
translocase of inner mitochondrial membrane 23 homolog B (yeast) |
| chr8_-_131028869 | 4.43 |
ENST00000518283.1
ENST00000519110.1 |
FAM49B
|
family with sequence similarity 49, member B |
| chr2_-_235405168 | 4.41 |
ENST00000339728.3
|
ARL4C
|
ADP-ribosylation factor-like 4C |
| chr4_+_39699664 | 4.39 |
ENST00000261427.5
ENST00000510934.1 ENST00000295963.6 |
UBE2K
|
ubiquitin-conjugating enzyme E2K |
| chr10_+_80828774 | 4.39 |
ENST00000334512.5
|
ZMIZ1
|
zinc finger, MIZ-type containing 1 |
| chr9_-_130966497 | 4.38 |
ENST00000393608.1
ENST00000372948.3 |
CIZ1
|
CDKN1A interacting zinc finger protein 1 |
| chr21_-_27107283 | 4.31 |
ENST00000284971.3
ENST00000400099.1 |
ATP5J
|
ATP synthase, H+ transporting, mitochondrial Fo complex, subunit F6 |
| chr8_-_144886321 | 4.31 |
ENST00000526832.1
|
SCRIB
|
scribbled planar cell polarity protein |
| chr16_+_2039946 | 4.31 |
ENST00000248121.2
ENST00000568896.1 |
SYNGR3
|
synaptogyrin 3 |
| chr5_+_173472607 | 4.25 |
ENST00000303177.3
ENST00000519867.1 |
NSG2
|
Neuron-specific protein family member 2 |
| chr17_-_29624343 | 4.24 |
ENST00000247271.4
|
OMG
|
oligodendrocyte myelin glycoprotein |
| chr19_-_42498231 | 4.23 |
ENST00000602133.1
|
ATP1A3
|
ATPase, Na+/K+ transporting, alpha 3 polypeptide |
| chr3_+_179322573 | 4.22 |
ENST00000493866.1
ENST00000472629.1 ENST00000482604.1 |
NDUFB5
|
NADH dehydrogenase (ubiquinone) 1 beta subcomplex, 5, 16kDa |
| chr3_+_133465228 | 4.20 |
ENST00000482271.1
ENST00000264998.3 |
TF
|
transferrin |
| chr5_+_1801503 | 4.20 |
ENST00000274137.5
ENST00000469176.1 |
NDUFS6
|
NADH dehydrogenase (ubiquinone) Fe-S protein 6, 13kDa (NADH-coenzyme Q reductase) |
| chr8_-_100905850 | 4.20 |
ENST00000520271.1
ENST00000522940.1 ENST00000523016.1 ENST00000517682.2 ENST00000297564.2 |
COX6C
|
cytochrome c oxidase subunit VIc |
| chr22_-_39239987 | 4.13 |
ENST00000333039.2
|
NPTXR
|
neuronal pentraxin receptor |
| chr8_-_18541603 | 4.12 |
ENST00000428502.2
|
PSD3
|
pleckstrin and Sec7 domain containing 3 |
| chr11_-_64511575 | 4.12 |
ENST00000431822.1
ENST00000377486.3 ENST00000394432.3 |
RASGRP2
|
RAS guanyl releasing protein 2 (calcium and DAG-regulated) |
| chr14_-_50319758 | 4.12 |
ENST00000298310.5
|
NEMF
|
nuclear export mediator factor |
| chr11_+_67798363 | 4.11 |
ENST00000525628.1
|
NDUFS8
|
NADH dehydrogenase (ubiquinone) Fe-S protein 8, 23kDa (NADH-coenzyme Q reductase) |
| chr1_+_165797024 | 4.10 |
ENST00000372212.4
|
UCK2
|
uridine-cytidine kinase 2 |
| chr22_+_23237555 | 4.10 |
ENST00000390321.2
|
IGLC1
|
immunoglobulin lambda constant 1 (Mcg marker) |
| chr10_-_75634326 | 4.08 |
ENST00000322635.3
ENST00000444854.2 ENST00000423381.1 ENST00000322680.3 ENST00000394762.2 |
CAMK2G
|
calcium/calmodulin-dependent protein kinase II gamma |
| chr14_-_24911448 | 4.07 |
ENST00000555355.1
ENST00000553343.1 ENST00000556523.1 ENST00000556249.1 ENST00000538105.2 ENST00000555225.1 |
SDR39U1
|
short chain dehydrogenase/reductase family 39U, member 1 |
| chr1_-_241683001 | 3.99 |
ENST00000366560.3
|
FH
|
fumarate hydratase |
| chr8_-_131028641 | 3.99 |
ENST00000523509.1
|
FAM49B
|
family with sequence similarity 49, member B |
| chr8_+_86376081 | 3.97 |
ENST00000285379.5
|
CA2
|
carbonic anhydrase II |
| chr1_+_160097462 | 3.96 |
ENST00000447527.1
|
ATP1A2
|
ATPase, Na+/K+ transporting, alpha 2 polypeptide |
| chr16_-_85833109 | 3.96 |
ENST00000253457.3
|
EMC8
|
ER membrane protein complex subunit 8 |
| chr5_-_180669236 | 3.95 |
ENST00000507756.1
|
GNB2L1
|
guanine nucleotide binding protein (G protein), beta polypeptide 2-like 1 |
| chr7_+_121513143 | 3.95 |
ENST00000393386.2
|
PTPRZ1
|
protein tyrosine phosphatase, receptor-type, Z polypeptide 1 |
| chr16_-_85833160 | 3.93 |
ENST00000435200.2
|
EMC8
|
ER membrane protein complex subunit 8 |
| chr5_-_133340326 | 3.92 |
ENST00000425992.1
ENST00000395044.3 ENST00000395047.2 |
VDAC1
|
voltage-dependent anion channel 1 |
| chr12_-_57039739 | 3.90 |
ENST00000552959.1
ENST00000551020.1 ENST00000553007.2 ENST00000552919.1 ENST00000552104.1 ENST00000262030.3 |
ATP5B
|
ATP synthase, H+ transporting, mitochondrial F1 complex, beta polypeptide |
| chr19_-_3062465 | 3.89 |
ENST00000327141.4
|
AES
|
amino-terminal enhancer of split |
| chr4_+_26322409 | 3.87 |
ENST00000514807.1
ENST00000348160.4 ENST00000509158.1 ENST00000355476.3 |
RBPJ
|
recombination signal binding protein for immunoglobulin kappa J region |
| chr12_-_16761007 | 3.86 |
ENST00000354662.1
ENST00000441439.2 |
LMO3
|
LIM domain only 3 (rhombotin-like 2) |
| chr2_+_10560147 | 3.82 |
ENST00000422133.1
|
HPCAL1
|
hippocalcin-like 1 |
| chr2_+_44396000 | 3.81 |
ENST00000409895.4
ENST00000409432.3 ENST00000282412.4 ENST00000378551.2 ENST00000345249.4 |
PPM1B
|
protein phosphatase, Mg2+/Mn2+ dependent, 1B |
| chr15_-_41694640 | 3.81 |
ENST00000558719.1
ENST00000260361.4 ENST00000560978.1 |
NDUFAF1
|
NADH dehydrogenase (ubiquinone) complex I, assembly factor 1 |
| chr19_-_11639910 | 3.80 |
ENST00000588998.1
ENST00000586149.1 |
ECSIT
|
ECSIT signalling integrator |
| chr4_-_76598296 | 3.77 |
ENST00000395719.3
|
G3BP2
|
GTPase activating protein (SH3 domain) binding protein 2 |
| chr16_+_6069072 | 3.75 |
ENST00000547605.1
ENST00000550418.1 ENST00000553186.1 |
RBFOX1
|
RNA binding protein, fox-1 homolog (C. elegans) 1 |
| chr4_-_668108 | 3.74 |
ENST00000304312.4
|
ATP5I
|
ATP synthase, H+ transporting, mitochondrial Fo complex, subunit E |
| chr6_-_39693111 | 3.74 |
ENST00000373215.3
ENST00000538893.1 ENST00000287152.7 ENST00000373216.3 |
KIF6
|
kinesin family member 6 |
| chr5_+_43121698 | 3.72 |
ENST00000505606.2
ENST00000509634.1 ENST00000509341.1 |
ZNF131
|
zinc finger protein 131 |
| chr5_+_85913721 | 3.68 |
ENST00000247655.3
ENST00000509578.1 ENST00000515763.1 |
COX7C
|
cytochrome c oxidase subunit VIIc |
| chr10_-_103578182 | 3.66 |
ENST00000439817.1
|
MGEA5
|
meningioma expressed antigen 5 (hyaluronidase) |
| chr14_-_50319482 | 3.66 |
ENST00000546046.1
ENST00000555970.1 ENST00000554626.1 ENST00000545773.1 ENST00000556672.1 |
NEMF
|
nuclear export mediator factor |
| chr6_-_36953833 | 3.65 |
ENST00000538808.1
ENST00000460219.1 ENST00000373616.5 ENST00000373627.5 |
MTCH1
|
mitochondrial carrier 1 |
| chr8_-_100905925 | 3.64 |
ENST00000518171.1
|
COX6C
|
cytochrome c oxidase subunit VIc |
| chr17_-_4852243 | 3.63 |
ENST00000225655.5
|
PFN1
|
profilin 1 |
| chr17_+_40440481 | 3.62 |
ENST00000590726.2
ENST00000452307.2 ENST00000444283.1 ENST00000588868.1 |
STAT5A
|
signal transducer and activator of transcription 5A |
| chr11_+_111896090 | 3.62 |
ENST00000393051.1
|
DLAT
|
dihydrolipoamide S-acetyltransferase |
| chr6_+_43457317 | 3.60 |
ENST00000438588.2
|
TJAP1
|
tight junction associated protein 1 (peripheral) |
| chr8_-_53626974 | 3.59 |
ENST00000435644.2
ENST00000518710.1 ENST00000025008.5 ENST00000517963.1 |
RB1CC1
|
RB1-inducible coiled-coil 1 |
| chr11_-_64014379 | 3.59 |
ENST00000309318.3
|
PPP1R14B
|
protein phosphatase 1, regulatory (inhibitor) subunit 14B |
| chr4_+_26322185 | 3.58 |
ENST00000361572.6
|
RBPJ
|
recombination signal binding protein for immunoglobulin kappa J region |
| chr3_-_183735731 | 3.58 |
ENST00000334444.6
|
ABCC5
|
ATP-binding cassette, sub-family C (CFTR/MRP), member 5 |
| chrX_-_109683446 | 3.55 |
ENST00000372057.1
|
AMMECR1
|
Alport syndrome, mental retardation, midface hypoplasia and elliptocytosis chromosomal region gene 1 |
| chr4_+_39699776 | 3.54 |
ENST00000503368.1
ENST00000445950.2 |
UBE2K
|
ubiquitin-conjugating enzyme E2K |
| chr12_+_6833237 | 3.53 |
ENST00000229251.3
ENST00000539735.1 ENST00000538410.1 |
COPS7A
|
COP9 signalosome subunit 7A |
| chr1_+_50575292 | 3.52 |
ENST00000371821.1
ENST00000371819.1 |
ELAVL4
|
ELAV like neuron-specific RNA binding protein 4 |
| chrX_-_129299638 | 3.49 |
ENST00000535724.1
ENST00000346424.2 |
AIFM1
|
apoptosis-inducing factor, mitochondrion-associated, 1 |
| chr8_-_120685608 | 3.49 |
ENST00000427067.2
|
ENPP2
|
ectonucleotide pyrophosphatase/phosphodiesterase 2 |
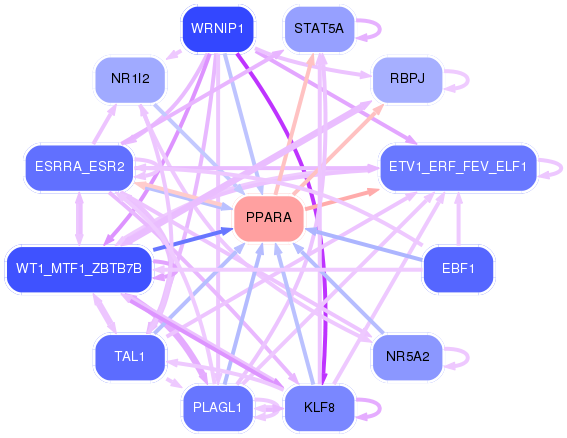
Network of associatons between targets according to the STRING database.

First level regulatory network of PPARA
Gene Ontology Analysis
Gene overrepresentation in biological_process category:
| Log-likelihood per target | Total log-likelihood | Term | Description |
|---|---|---|---|
| 6.0 | 24.0 | GO:0044861 | protein transport into plasma membrane raft(GO:0044861) positive regulation of potassium ion import(GO:1903288) |
| 3.8 | 11.5 | GO:2000276 | regulation of mitochondrial membrane permeability involved in programmed necrotic cell death(GO:1902445) negative regulation of oxidative phosphorylation uncoupler activity(GO:2000276) |
| 3.5 | 10.5 | GO:2000374 | regulation of oxygen metabolic process(GO:2000374) |
| 3.3 | 13.4 | GO:0044375 | regulation of peroxisome size(GO:0044375) |
| 3.1 | 9.4 | GO:1903028 | positive regulation of opsonization(GO:1903028) |
| 2.7 | 13.6 | GO:1905098 | negative regulation of guanyl-nucleotide exchange factor activity(GO:1905098) |
| 2.6 | 7.7 | GO:0072554 | arterial endothelial cell fate commitment(GO:0060844) blood vessel lumenization(GO:0072554) positive regulation of ephrin receptor signaling pathway(GO:1901189) positive regulation of canonical Wnt signaling pathway involved in cardiac muscle cell fate commitment(GO:1901297) positive regulation of canonical Wnt signaling pathway involved in heart development(GO:1905068) |
| 2.5 | 79.4 | GO:0042776 | mitochondrial ATP synthesis coupled proton transport(GO:0042776) |
| 2.4 | 4.8 | GO:0048597 | B cell negative selection(GO:0002352) post-embryonic camera-type eye morphogenesis(GO:0048597) |
| 2.4 | 14.2 | GO:2000568 | memory T cell activation(GO:0035709) regulation of memory T cell activation(GO:2000567) positive regulation of memory T cell activation(GO:2000568) |
| 2.3 | 9.4 | GO:0000960 | mitochondrial RNA catabolic process(GO:0000957) regulation of mitochondrial RNA catabolic process(GO:0000960) |
| 2.3 | 9.3 | GO:0009224 | CMP salvage(GO:0006238) CMP biosynthetic process(GO:0009224) CMP metabolic process(GO:0046035) |
| 2.2 | 6.6 | GO:0006121 | mitochondrial electron transport, succinate to ubiquinone(GO:0006121) |
| 2.1 | 8.4 | GO:0019046 | release from viral latency(GO:0019046) |
| 1.9 | 7.7 | GO:0006556 | S-adenosylmethionine biosynthetic process(GO:0006556) |
| 1.9 | 5.8 | GO:1904247 | positive regulation of polynucleotide adenylyltransferase activity(GO:1904247) |
| 1.9 | 24.9 | GO:0006122 | mitochondrial electron transport, ubiquinol to cytochrome c(GO:0006122) |
| 1.9 | 14.8 | GO:1903690 | negative regulation of wound healing, spreading of epidermal cells(GO:1903690) |
| 1.8 | 126.1 | GO:0006120 | mitochondrial electron transport, NADH to ubiquinone(GO:0006120) |
| 1.8 | 5.4 | GO:0046166 | glyceraldehyde-3-phosphate biosynthetic process(GO:0046166) |
| 1.7 | 7.0 | GO:1900245 | positive regulation of MDA-5 signaling pathway(GO:1900245) |
| 1.7 | 10.3 | GO:2000324 | positive regulation of glucocorticoid receptor signaling pathway(GO:2000324) |
| 1.7 | 8.3 | GO:1903588 | negative regulation of blood vessel endothelial cell proliferation involved in sprouting angiogenesis(GO:1903588) |
| 1.6 | 11.1 | GO:1904044 | response to aldosterone(GO:1904044) |
| 1.5 | 15.5 | GO:0007144 | female meiosis I(GO:0007144) |
| 1.5 | 6.1 | GO:0043456 | regulation of pentose-phosphate shunt(GO:0043456) |
| 1.5 | 4.5 | GO:0015729 | thiosulfate transport(GO:0015709) oxaloacetate transport(GO:0015729) malate transport(GO:0015743) malate transmembrane transport(GO:0071423) oxaloacetate(2-) transmembrane transport(GO:1902356) |
| 1.4 | 4.3 | GO:0098968 | neurotransmitter receptor transport postsynaptic membrane to endosome(GO:0098968) |
| 1.4 | 5.5 | GO:2000426 | plasmacytoid dendritic cell activation(GO:0002270) T cell mediated immune response to tumor cell(GO:0002424) regulation of T cell mediated immune response to tumor cell(GO:0002840) regulation of restriction endodeoxyribonuclease activity(GO:0032072) negative regulation of apoptotic cell clearance(GO:2000426) |
| 1.3 | 4.0 | GO:0006106 | fumarate metabolic process(GO:0006106) |
| 1.3 | 4.0 | GO:0042938 | dipeptide transport(GO:0042938) |
| 1.3 | 7.6 | GO:0045917 | positive regulation of complement activation(GO:0045917) positive regulation of protein activation cascade(GO:2000259) |
| 1.2 | 8.7 | GO:0045039 | protein import into mitochondrial inner membrane(GO:0045039) |
| 1.2 | 4.8 | GO:0043335 | protein unfolding(GO:0043335) |
| 1.2 | 7.1 | GO:0070601 | centromeric sister chromatid cohesion(GO:0070601) |
| 1.2 | 20.0 | GO:0006123 | mitochondrial electron transport, cytochrome c to oxygen(GO:0006123) |
| 1.1 | 7.9 | GO:0010994 | regulation of ubiquitin homeostasis(GO:0010993) free ubiquitin chain polymerization(GO:0010994) |
| 1.1 | 3.4 | GO:0006172 | ADP biosynthetic process(GO:0006172) |
| 1.1 | 17.9 | GO:0090361 | platelet-derived growth factor production(GO:0090360) regulation of platelet-derived growth factor production(GO:0090361) |
| 1.1 | 11.1 | GO:1903416 | response to glycoside(GO:1903416) |
| 1.1 | 7.7 | GO:0051388 | positive regulation of neurotrophin TRK receptor signaling pathway(GO:0051388) |
| 1.1 | 10.9 | GO:1900029 | positive regulation of ruffle assembly(GO:1900029) |
| 1.1 | 12.8 | GO:0048096 | chromatin-mediated maintenance of transcription(GO:0048096) |
| 1.1 | 3.2 | GO:0007113 | endomitotic cell cycle(GO:0007113) |
| 1.0 | 5.0 | GO:0099590 | neurotransmitter receptor internalization(GO:0099590) |
| 1.0 | 7.0 | GO:0000414 | regulation of histone H3-K36 methylation(GO:0000414) |
| 1.0 | 5.0 | GO:0061198 | fungiform papilla formation(GO:0061198) |
| 1.0 | 6.9 | GO:0071442 | positive regulation of histone H3-K14 acetylation(GO:0071442) |
| 0.9 | 4.6 | GO:0061732 | mitochondrial acetyl-CoA biosynthetic process from pyruvate(GO:0061732) |
| 0.9 | 4.5 | GO:0019255 | glucose 1-phosphate metabolic process(GO:0019255) |
| 0.9 | 3.6 | GO:0000255 | allantoin metabolic process(GO:0000255) |
| 0.9 | 4.5 | GO:1904154 | positive regulation of retrograde protein transport, ER to cytosol(GO:1904154) |
| 0.9 | 3.6 | GO:0030242 | pexophagy(GO:0030242) |
| 0.8 | 0.8 | GO:0090164 | asymmetric Golgi ribbon formation(GO:0090164) |
| 0.8 | 7.8 | GO:0061179 | negative regulation of insulin secretion involved in cellular response to glucose stimulus(GO:0061179) |
| 0.8 | 5.5 | GO:0034316 | negative regulation of Arp2/3 complex-mediated actin nucleation(GO:0034316) |
| 0.7 | 4.4 | GO:0007296 | vitellogenesis(GO:0007296) |
| 0.7 | 4.2 | GO:0061083 | regulation of protein refolding(GO:0061083) negative regulation of protein refolding(GO:0061084) |
| 0.7 | 4.2 | GO:0098707 | ferrous iron import into cell(GO:0097460) ferrous iron import across plasma membrane(GO:0098707) |
| 0.7 | 6.2 | GO:0014052 | regulation of gamma-aminobutyric acid secretion(GO:0014052) |
| 0.7 | 21.9 | GO:0006099 | tricarboxylic acid cycle(GO:0006099) |
| 0.7 | 10.6 | GO:0043374 | CD8-positive, alpha-beta T cell differentiation(GO:0043374) |
| 0.7 | 13.0 | GO:0032012 | regulation of ARF protein signal transduction(GO:0032012) |
| 0.6 | 3.2 | GO:0044336 | embryonic genitalia morphogenesis(GO:0030538) canonical Wnt signaling pathway involved in negative regulation of apoptotic process(GO:0044336) |
| 0.6 | 2.6 | GO:0007221 | positive regulation of transcription of Notch receptor target(GO:0007221) |
| 0.6 | 3.8 | GO:0006499 | N-terminal protein myristoylation(GO:0006499) |
| 0.6 | 9.2 | GO:0030150 | protein import into mitochondrial matrix(GO:0030150) |
| 0.6 | 1.8 | GO:0008611 | ether lipid biosynthetic process(GO:0008611) glycerol ether biosynthetic process(GO:0046504) ether biosynthetic process(GO:1901503) |
| 0.6 | 4.7 | GO:0007258 | JUN phosphorylation(GO:0007258) |
| 0.5 | 5.9 | GO:1904714 | regulation of chaperone-mediated autophagy(GO:1904714) |
| 0.5 | 8.2 | GO:0000338 | protein deneddylation(GO:0000338) |
| 0.5 | 1.5 | GO:1902995 | regulation of phospholipid efflux(GO:1902994) positive regulation of phospholipid efflux(GO:1902995) |
| 0.5 | 2.0 | GO:0021564 | vagus nerve development(GO:0021564) |
| 0.5 | 3.9 | GO:0070444 | oligodendrocyte progenitor proliferation(GO:0070444) regulation of oligodendrocyte progenitor proliferation(GO:0070445) |
| 0.5 | 1.5 | GO:0002184 | cytoplasmic translational termination(GO:0002184) |
| 0.5 | 3.9 | GO:2000210 | positive regulation of anoikis(GO:2000210) |
| 0.5 | 6.3 | GO:0019388 | galactose catabolic process(GO:0019388) |
| 0.5 | 2.4 | GO:0006741 | NADP biosynthetic process(GO:0006741) |
| 0.5 | 2.9 | GO:0002036 | regulation of L-glutamate transport(GO:0002036) |
| 0.5 | 5.2 | GO:0042407 | cristae formation(GO:0042407) |
| 0.5 | 3.3 | GO:1901314 | negative regulation of histone ubiquitination(GO:0033183) negative regulation of protein K63-linked ubiquitination(GO:1900045) regulation of histone H2A K63-linked ubiquitination(GO:1901314) negative regulation of histone H2A K63-linked ubiquitination(GO:1901315) negative regulation of protein polyubiquitination(GO:1902915) |
| 0.5 | 12.9 | GO:0050860 | negative regulation of T cell receptor signaling pathway(GO:0050860) |
| 0.4 | 1.8 | GO:0035905 | N-terminal peptidyl-lysine acetylation(GO:0018076) ascending aorta development(GO:0035905) ascending aorta morphogenesis(GO:0035910) |
| 0.4 | 1.8 | GO:0030323 | respiratory tube development(GO:0030323) |
| 0.4 | 4.3 | GO:0030951 | establishment or maintenance of microtubule cytoskeleton polarity(GO:0030951) |
| 0.4 | 5.2 | GO:0043951 | negative regulation of cAMP-mediated signaling(GO:0043951) |
| 0.4 | 1.7 | GO:0021691 | cerebellar Purkinje cell layer maturation(GO:0021691) |
| 0.4 | 1.7 | GO:0090234 | regulation of kinetochore assembly(GO:0090234) |
| 0.4 | 5.1 | GO:1903800 | positive regulation of production of miRNAs involved in gene silencing by miRNA(GO:1903800) |
| 0.4 | 8.9 | GO:0097320 | membrane tubulation(GO:0097320) |
| 0.4 | 2.9 | GO:0090043 | regulation of tubulin deacetylation(GO:0090043) |
| 0.4 | 1.3 | GO:0015680 | intracellular copper ion transport(GO:0015680) |
| 0.4 | 5.0 | GO:0043484 | regulation of RNA splicing(GO:0043484) |
| 0.4 | 38.5 | GO:0006415 | translational termination(GO:0006415) |
| 0.4 | 6.5 | GO:0006516 | glycoprotein catabolic process(GO:0006516) |
| 0.4 | 7.2 | GO:1901897 | regulation of relaxation of cardiac muscle(GO:1901897) |
| 0.4 | 2.3 | GO:0070885 | negative regulation of calcineurin-NFAT signaling cascade(GO:0070885) |
| 0.4 | 1.9 | GO:1902774 | late endosome to lysosome transport(GO:1902774) |
| 0.4 | 2.2 | GO:0035989 | tendon development(GO:0035989) |
| 0.3 | 11.2 | GO:0008334 | histone mRNA metabolic process(GO:0008334) |
| 0.3 | 2.4 | GO:0044800 | fusion of virus membrane with host plasma membrane(GO:0019064) membrane fusion involved in viral entry into host cell(GO:0039663) multi-organism membrane fusion(GO:0044800) |
| 0.3 | 2.1 | GO:0017196 | N-terminal peptidyl-methionine acetylation(GO:0017196) |
| 0.3 | 2.7 | GO:0032510 | endosome to lysosome transport via multivesicular body sorting pathway(GO:0032510) |
| 0.3 | 6.9 | GO:0015937 | coenzyme A biosynthetic process(GO:0015937) |
| 0.3 | 1.6 | GO:0061687 | regulation of sequestering of zinc ion(GO:0061088) detoxification of inorganic compound(GO:0061687) stress response to metal ion(GO:0097501) |
| 0.3 | 0.3 | GO:0021699 | cerebellum maturation(GO:0021590) cerebellar cortex maturation(GO:0021699) |
| 0.3 | 5.7 | GO:0000028 | ribosomal small subunit assembly(GO:0000028) |
| 0.3 | 1.8 | GO:0072592 | oxygen metabolic process(GO:0072592) |
| 0.3 | 1.2 | GO:0070197 | meiotic telomere tethering at nuclear periphery(GO:0044821) meiotic attachment of telomere to nuclear envelope(GO:0070197) chromosome attachment to the nuclear envelope(GO:0097240) |
| 0.3 | 1.8 | GO:0048505 | regulation of development, heterochronic(GO:0040034) regulation of timing of cell differentiation(GO:0048505) |
| 0.3 | 2.7 | GO:0038007 | netrin-activated signaling pathway(GO:0038007) |
| 0.3 | 11.1 | GO:0070534 | protein K63-linked ubiquitination(GO:0070534) |
| 0.3 | 5.2 | GO:0035435 | phosphate ion transmembrane transport(GO:0035435) |
| 0.3 | 2.7 | GO:0060267 | positive regulation of respiratory burst(GO:0060267) |
| 0.3 | 0.8 | GO:0060437 | lung growth(GO:0060437) |
| 0.3 | 3.7 | GO:0045161 | neuronal ion channel clustering(GO:0045161) |
| 0.3 | 0.8 | GO:1901491 | negative regulation of lymphangiogenesis(GO:1901491) |
| 0.3 | 2.8 | GO:0000244 | spliceosomal tri-snRNP complex assembly(GO:0000244) |
| 0.3 | 18.9 | GO:0000380 | alternative mRNA splicing, via spliceosome(GO:0000380) |
| 0.2 | 3.9 | GO:0006851 | mitochondrial calcium ion transport(GO:0006851) |
| 0.2 | 1.7 | GO:1903593 | regulation of histamine secretion by mast cell(GO:1903593) |
| 0.2 | 3.7 | GO:0043306 | positive regulation of mast cell activation involved in immune response(GO:0033008) positive regulation of mast cell degranulation(GO:0043306) |
| 0.2 | 3.5 | GO:2000394 | positive regulation of lamellipodium morphogenesis(GO:2000394) |
| 0.2 | 3.0 | GO:0034497 | protein localization to pre-autophagosomal structure(GO:0034497) |
| 0.2 | 0.7 | GO:0030997 | regulation of centriole-centriole cohesion(GO:0030997) |
| 0.2 | 5.2 | GO:0061157 | mRNA destabilization(GO:0061157) |
| 0.2 | 6.2 | GO:0015988 | energy coupled proton transmembrane transport, against electrochemical gradient(GO:0015988) ATP hydrolysis coupled proton transport(GO:0015991) |
| 0.2 | 2.8 | GO:0010603 | regulation of cytoplasmic mRNA processing body assembly(GO:0010603) |
| 0.2 | 0.6 | GO:2000687 | negative regulation of rubidium ion transport(GO:2000681) negative regulation of rubidium ion transmembrane transporter activity(GO:2000687) |
| 0.2 | 3.8 | GO:0032981 | NADH dehydrogenase complex assembly(GO:0010257) mitochondrial respiratory chain complex I assembly(GO:0032981) mitochondrial respiratory chain complex I biogenesis(GO:0097031) |
| 0.2 | 6.7 | GO:0034314 | Arp2/3 complex-mediated actin nucleation(GO:0034314) |
| 0.2 | 1.3 | GO:1904338 | regulation of dopaminergic neuron differentiation(GO:1904338) |
| 0.2 | 6.5 | GO:0042026 | protein refolding(GO:0042026) |
| 0.2 | 6.8 | GO:0006376 | mRNA splice site selection(GO:0006376) |
| 0.2 | 2.4 | GO:1901387 | positive regulation of voltage-gated calcium channel activity(GO:1901387) |
| 0.2 | 4.6 | GO:0007095 | mitotic G2 DNA damage checkpoint(GO:0007095) |
| 0.2 | 2.4 | GO:0060213 | regulation of nuclear-transcribed mRNA poly(A) tail shortening(GO:0060211) positive regulation of nuclear-transcribed mRNA poly(A) tail shortening(GO:0060213) |
| 0.2 | 5.5 | GO:0010669 | epithelial structure maintenance(GO:0010669) |
| 0.2 | 2.5 | GO:0048025 | negative regulation of mRNA splicing, via spliceosome(GO:0048025) |
| 0.2 | 4.5 | GO:0006491 | N-glycan processing(GO:0006491) |
| 0.2 | 1.5 | GO:0035249 | synaptic transmission, glutamatergic(GO:0035249) |
| 0.2 | 1.8 | GO:0072321 | chaperone-mediated protein transport(GO:0072321) |
| 0.2 | 2.4 | GO:0006527 | arginine catabolic process(GO:0006527) |
| 0.2 | 5.9 | GO:0007131 | reciprocal meiotic recombination(GO:0007131) reciprocal DNA recombination(GO:0035825) |
| 0.2 | 2.9 | GO:0071803 | positive regulation of podosome assembly(GO:0071803) |
| 0.2 | 3.4 | GO:0033169 | histone H3-K9 demethylation(GO:0033169) |
| 0.2 | 2.8 | GO:0009313 | oligosaccharide catabolic process(GO:0009313) |
| 0.2 | 20.6 | GO:0050871 | positive regulation of B cell activation(GO:0050871) |
| 0.2 | 2.2 | GO:0060628 | regulation of ER to Golgi vesicle-mediated transport(GO:0060628) |
| 0.2 | 4.6 | GO:0000289 | nuclear-transcribed mRNA poly(A) tail shortening(GO:0000289) |
| 0.2 | 0.5 | GO:0044829 | positive regulation by host of viral genome replication(GO:0044829) |
| 0.2 | 1.2 | GO:0021847 | ventricular zone neuroblast division(GO:0021847) |
| 0.2 | 2.1 | GO:0021692 | cerebellar Purkinje cell layer morphogenesis(GO:0021692) |
| 0.2 | 4.9 | GO:0000291 | nuclear-transcribed mRNA catabolic process, exonucleolytic(GO:0000291) exonucleolytic nuclear-transcribed mRNA catabolic process involved in deadenylation-dependent decay(GO:0043928) |
| 0.2 | 6.4 | GO:0000413 | protein peptidyl-prolyl isomerization(GO:0000413) |
| 0.2 | 0.8 | GO:0042631 | cellular response to water deprivation(GO:0042631) |
| 0.2 | 1.7 | GO:0090344 | negative regulation of cell aging(GO:0090344) |
| 0.2 | 2.7 | GO:0044130 | negative regulation of growth of symbiont in host(GO:0044130) |
| 0.2 | 4.3 | GO:0048268 | clathrin coat assembly(GO:0048268) |
| 0.1 | 1.2 | GO:0016559 | peroxisome fission(GO:0016559) |
| 0.1 | 4.0 | GO:0051290 | protein heterotetramerization(GO:0051290) |
| 0.1 | 0.7 | GO:0006546 | glycine catabolic process(GO:0006546) glycine decarboxylation via glycine cleavage system(GO:0019464) |
| 0.1 | 1.6 | GO:0033227 | dsRNA transport(GO:0033227) |
| 0.1 | 1.2 | GO:1902037 | negative regulation of hematopoietic stem cell differentiation(GO:1902037) |
| 0.1 | 0.8 | GO:0051013 | microtubule severing(GO:0051013) |
| 0.1 | 2.8 | GO:0006646 | phosphatidylethanolamine biosynthetic process(GO:0006646) |
| 0.1 | 0.5 | GO:0050779 | RNA destabilization(GO:0050779) |
| 0.1 | 1.5 | GO:0031115 | negative regulation of microtubule polymerization(GO:0031115) |
| 0.1 | 9.2 | GO:0045454 | cell redox homeostasis(GO:0045454) |
| 0.1 | 1.2 | GO:0010265 | SCF complex assembly(GO:0010265) |
| 0.1 | 1.7 | GO:0070102 | interleukin-6-mediated signaling pathway(GO:0070102) |
| 0.1 | 1.0 | GO:0016584 | nucleosome positioning(GO:0016584) |
| 0.1 | 2.7 | GO:0060997 | dendritic spine morphogenesis(GO:0060997) |
| 0.1 | 3.1 | GO:0000154 | rRNA modification(GO:0000154) |
| 0.1 | 3.6 | GO:0032008 | positive regulation of TOR signaling(GO:0032008) |
| 0.1 | 2.1 | GO:0070262 | peptidyl-serine dephosphorylation(GO:0070262) |
| 0.1 | 0.9 | GO:0051823 | regulation of synapse structural plasticity(GO:0051823) |
| 0.1 | 0.8 | GO:0045292 | mRNA cis splicing, via spliceosome(GO:0045292) |
| 0.1 | 4.3 | GO:0021762 | substantia nigra development(GO:0021762) |
| 0.1 | 4.3 | GO:0045737 | positive regulation of cyclin-dependent protein serine/threonine kinase activity(GO:0045737) |
| 0.1 | 0.3 | GO:0030728 | ovulation(GO:0030728) |
| 0.1 | 2.2 | GO:0006337 | nucleosome disassembly(GO:0006337) |
| 0.1 | 0.6 | GO:1903286 | regulation of potassium ion import(GO:1903286) |
| 0.1 | 0.5 | GO:0044793 | negative regulation by host of viral process(GO:0044793) negative regulation of catalytic activity in other organism involved in symbiotic interaction(GO:0052199) negative regulation by host of symbiont molecular function(GO:0052405) |
| 0.1 | 0.9 | GO:0051560 | mitochondrial calcium ion homeostasis(GO:0051560) |
| 0.1 | 0.5 | GO:0032006 | regulation of TOR signaling(GO:0032006) |
| 0.1 | 0.8 | GO:0048023 | positive regulation of melanin biosynthetic process(GO:0048023) positive regulation of secondary metabolite biosynthetic process(GO:1900378) |
| 0.1 | 3.4 | GO:0000083 | regulation of transcription involved in G1/S transition of mitotic cell cycle(GO:0000083) |
| 0.1 | 1.2 | GO:0090129 | positive regulation of synapse maturation(GO:0090129) |
| 0.1 | 1.0 | GO:0001783 | B cell apoptotic process(GO:0001783) |
| 0.1 | 2.5 | GO:0090140 | regulation of mitochondrial fission(GO:0090140) |
| 0.1 | 7.0 | GO:0006487 | protein N-linked glycosylation(GO:0006487) |
| 0.1 | 1.7 | GO:0045947 | negative regulation of translational initiation(GO:0045947) |
| 0.1 | 0.4 | GO:0008218 | bioluminescence(GO:0008218) |
| 0.1 | 1.6 | GO:0070935 | 3'-UTR-mediated mRNA stabilization(GO:0070935) |
| 0.1 | 8.3 | GO:0051225 | spindle assembly(GO:0051225) |
| 0.1 | 1.2 | GO:0035020 | regulation of Rac protein signal transduction(GO:0035020) |
| 0.1 | 1.4 | GO:0060236 | regulation of mitotic spindle organization(GO:0060236) regulation of spindle organization(GO:0090224) |
| 0.1 | 2.2 | GO:0048665 | neuron fate specification(GO:0048665) |
| 0.1 | 0.7 | GO:0036500 | ATF6-mediated unfolded protein response(GO:0036500) |
| 0.1 | 0.7 | GO:0051599 | response to hydrostatic pressure(GO:0051599) |
| 0.1 | 0.4 | GO:0070980 | biphenyl catabolic process(GO:0070980) |
| 0.1 | 1.8 | GO:0070886 | positive regulation of calcineurin-NFAT signaling cascade(GO:0070886) |
| 0.1 | 3.3 | GO:0060338 | regulation of type I interferon-mediated signaling pathway(GO:0060338) |
| 0.1 | 1.9 | GO:0043567 | regulation of insulin-like growth factor receptor signaling pathway(GO:0043567) |
| 0.1 | 0.6 | GO:0034063 | stress granule assembly(GO:0034063) |
| 0.1 | 0.3 | GO:0070966 | nuclear-transcribed mRNA catabolic process, no-go decay(GO:0070966) |
| 0.1 | 0.3 | GO:0032972 | diaphragm contraction(GO:0002086) regulation of muscle filament sliding speed(GO:0032972) |
| 0.1 | 2.3 | GO:1901685 | glutathione derivative metabolic process(GO:1901685) glutathione derivative biosynthetic process(GO:1901687) |
| 0.1 | 3.5 | GO:0051865 | protein autoubiquitination(GO:0051865) |
| 0.1 | 2.5 | GO:0006656 | phosphatidylcholine biosynthetic process(GO:0006656) |
| 0.1 | 0.1 | GO:0051462 | cortisol secretion(GO:0043400) regulation of cortisol secretion(GO:0051462) |
| 0.1 | 1.4 | GO:0061049 | physiological muscle hypertrophy(GO:0003298) physiological cardiac muscle hypertrophy(GO:0003301) cell growth involved in cardiac muscle cell development(GO:0061049) |
| 0.0 | 0.3 | GO:0044245 | polysaccharide digestion(GO:0044245) |
| 0.0 | 2.6 | GO:0019933 | cAMP-mediated signaling(GO:0019933) |
| 0.0 | 0.6 | GO:1903830 | magnesium ion transmembrane transport(GO:1903830) |
| 0.0 | 1.0 | GO:0006309 | apoptotic DNA fragmentation(GO:0006309) |
| 0.0 | 5.4 | GO:0002433 | immune response-regulating cell surface receptor signaling pathway involved in phagocytosis(GO:0002433) Fc-gamma receptor signaling pathway involved in phagocytosis(GO:0038096) |
| 0.0 | 0.5 | GO:0051683 | establishment of Golgi localization(GO:0051683) |
| 0.0 | 0.9 | GO:0046785 | microtubule polymerization(GO:0046785) |
| 0.0 | 0.4 | GO:0007168 | receptor guanylyl cyclase signaling pathway(GO:0007168) |
| 0.0 | 1.3 | GO:0046329 | negative regulation of JNK cascade(GO:0046329) |
| 0.0 | 3.4 | GO:0009791 | post-embryonic development(GO:0009791) |
| 0.0 | 8.8 | GO:0042787 | protein ubiquitination involved in ubiquitin-dependent protein catabolic process(GO:0042787) |
| 0.0 | 0.5 | GO:1901642 | nucleoside transmembrane transport(GO:1901642) |
| 0.0 | 0.7 | GO:0045662 | negative regulation of myoblast differentiation(GO:0045662) |
| 0.0 | 2.2 | GO:0090181 | regulation of cholesterol metabolic process(GO:0090181) |
| 0.0 | 1.0 | GO:0033209 | tumor necrosis factor-mediated signaling pathway(GO:0033209) |
| 0.0 | 1.1 | GO:0048488 | synaptic vesicle endocytosis(GO:0048488) |
| 0.0 | 0.1 | GO:0038165 | oncostatin-M-mediated signaling pathway(GO:0038165) |
| 0.0 | 0.9 | GO:0010107 | potassium ion import(GO:0010107) |
| 0.0 | 0.5 | GO:1902236 | negative regulation of endoplasmic reticulum stress-induced intrinsic apoptotic signaling pathway(GO:1902236) |
| 0.0 | 0.1 | GO:0032929 | negative regulation of superoxide anion generation(GO:0032929) |
| 0.0 | 0.9 | GO:0030032 | lamellipodium assembly(GO:0030032) |
| 0.0 | 0.3 | GO:0048311 | mitochondrion distribution(GO:0048311) |
| 0.0 | 0.3 | GO:0000042 | protein targeting to Golgi(GO:0000042) |
| 0.0 | 1.2 | GO:0002244 | hematopoietic progenitor cell differentiation(GO:0002244) |
| 0.0 | 0.6 | GO:0002377 | immunoglobulin production(GO:0002377) |
| 0.0 | 0.1 | GO:0060842 | arterial endothelial cell differentiation(GO:0060842) |
| 0.0 | 0.3 | GO:0090110 | cargo loading into COPII-coated vesicle(GO:0090110) |
| 0.0 | 0.8 | GO:0008284 | positive regulation of cell proliferation(GO:0008284) |
| 0.0 | 3.1 | GO:0019882 | antigen processing and presentation(GO:0019882) |
| 0.0 | 0.4 | GO:0032543 | mitochondrial translation(GO:0032543) |
| 0.0 | 0.6 | GO:0051602 | response to electrical stimulus(GO:0051602) |
| 0.0 | 2.4 | GO:0006614 | SRP-dependent cotranslational protein targeting to membrane(GO:0006614) |
| 0.0 | 0.6 | GO:0060999 | positive regulation of dendritic spine development(GO:0060999) |
| 0.0 | 1.2 | GO:0007030 | Golgi organization(GO:0007030) |
| 0.0 | 1.0 | GO:0042795 | snRNA transcription(GO:0009301) snRNA transcription from RNA polymerase II promoter(GO:0042795) |
| 0.0 | 0.8 | GO:0006501 | C-terminal protein lipidation(GO:0006501) |
| 0.0 | 0.2 | GO:0050690 | regulation of defense response to virus by virus(GO:0050690) |
| 0.0 | 1.1 | GO:0030534 | adult behavior(GO:0030534) |
Gene overrepresentation in cellular_component category:
| Log-likelihood per target | Total log-likelihood | Term | Description |
|---|---|---|---|
| 3.6 | 21.8 | GO:0070470 | plasma membrane respiratory chain(GO:0070470) |
| 3.2 | 57.3 | GO:0000276 | mitochondrial proton-transporting ATP synthase complex, coupling factor F(o)(GO:0000276) |
| 3.1 | 34.2 | GO:0005750 | mitochondrial respiratory chain complex III(GO:0005750) respiratory chain complex III(GO:0045275) |
| 2.6 | 7.7 | GO:0048269 | methionine adenosyltransferase complex(GO:0048269) |
| 2.2 | 8.7 | GO:0042721 | mitochondrial inner membrane protein insertion complex(GO:0042721) |
| 2.1 | 6.3 | GO:0005749 | mitochondrial respiratory chain complex II, succinate dehydrogenase complex (ubiquinone)(GO:0005749) succinate dehydrogenase complex (ubiquinone)(GO:0045257) respiratory chain complex II(GO:0045273) succinate dehydrogenase complex(GO:0045281) fumarate reductase complex(GO:0045283) |
| 2.1 | 25.3 | GO:0005751 | mitochondrial respiratory chain complex IV(GO:0005751) |
| 1.7 | 34.9 | GO:0005890 | sodium:potassium-exchanging ATPase complex(GO:0005890) |
| 1.7 | 24.3 | GO:0005753 | mitochondrial proton-transporting ATP synthase complex(GO:0005753) |
| 1.7 | 6.7 | GO:0070032 | synaptobrevin 2-SNAP-25-syntaxin-1a-complexin I complex(GO:0070032) |
| 1.7 | 6.7 | GO:0005967 | mitochondrial pyruvate dehydrogenase complex(GO:0005967) |
| 1.6 | 98.5 | GO:0005747 | mitochondrial respiratory chain complex I(GO:0005747) NADH dehydrogenase complex(GO:0030964) respiratory chain complex I(GO:0045271) |
| 1.5 | 4.6 | GO:0071745 | IgA immunoglobulin complex(GO:0071745) IgA immunoglobulin complex, circulating(GO:0071746) monomeric IgA immunoglobulin complex(GO:0071748) polymeric IgA immunoglobulin complex(GO:0071749) secretory IgA immunoglobulin complex(GO:0071751) |
| 1.5 | 7.7 | GO:0002193 | MAML1-RBP-Jkappa- ICN1 complex(GO:0002193) |
| 1.5 | 14.8 | GO:0045180 | basal cortex(GO:0045180) |
| 1.3 | 3.9 | GO:0072534 | perineuronal net(GO:0072534) |
| 1.3 | 9.2 | GO:0031415 | NatA complex(GO:0031415) |
| 1.3 | 5.2 | GO:0071001 | U4/U6 snRNP(GO:0071001) |
| 1.2 | 7.4 | GO:0005784 | Sec61 translocon complex(GO:0005784) translocon complex(GO:0071256) |
| 1.2 | 20.1 | GO:0005687 | U4 snRNP(GO:0005687) |
| 0.9 | 4.3 | GO:0034750 | Scrib-APC-beta-catenin complex(GO:0034750) |
| 0.9 | 7.7 | GO:0070652 | HAUS complex(GO:0070652) |
| 0.9 | 2.6 | GO:0031251 | PAN complex(GO:0031251) |
| 0.8 | 4.8 | GO:0045252 | oxoglutarate dehydrogenase complex(GO:0045252) |
| 0.8 | 4.6 | GO:0045254 | pyruvate dehydrogenase complex(GO:0045254) |
| 0.7 | 28.7 | GO:0000315 | organellar large ribosomal subunit(GO:0000315) mitochondrial large ribosomal subunit(GO:0005762) |
| 0.7 | 8.6 | GO:0005744 | mitochondrial inner membrane presequence translocase complex(GO:0005744) |
| 0.7 | 4.9 | GO:1990726 | Lsm1-7-Pat1 complex(GO:1990726) |
| 0.7 | 3.5 | GO:0071986 | Ragulator complex(GO:0071986) |
| 0.7 | 6.0 | GO:0072546 | ER membrane protein complex(GO:0072546) |
| 0.7 | 5.3 | GO:0042382 | paraspeckles(GO:0042382) |
| 0.6 | 3.6 | GO:1990316 | ATG1/ULK1 kinase complex(GO:1990316) |
| 0.6 | 5.9 | GO:0005853 | eukaryotic translation elongation factor 1 complex(GO:0005853) |
| 0.6 | 4.0 | GO:0045239 | tricarboxylic acid cycle enzyme complex(GO:0045239) |
| 0.6 | 3.9 | GO:0072669 | tRNA-splicing ligase complex(GO:0072669) |
| 0.5 | 1.5 | GO:0018444 | translation release factor complex(GO:0018444) |
| 0.5 | 6.2 | GO:0033180 | proton-transporting V-type ATPase, V1 domain(GO:0033180) |
| 0.5 | 7.6 | GO:0097038 | perinuclear endoplasmic reticulum(GO:0097038) |
| 0.5 | 12.8 | GO:0005721 | pericentric heterochromatin(GO:0005721) |
| 0.5 | 1.8 | GO:0042719 | mitochondrial intermembrane space protein transporter complex(GO:0042719) |
| 0.4 | 2.2 | GO:0098643 | fibrillar collagen trimer(GO:0005583) banded collagen fibril(GO:0098643) |
| 0.4 | 19.6 | GO:0042571 | immunoglobulin complex, circulating(GO:0042571) |
| 0.4 | 10.6 | GO:0005720 | nuclear heterochromatin(GO:0005720) |
| 0.4 | 2.8 | GO:0030121 | AP-1 adaptor complex(GO:0030121) |
| 0.4 | 7.5 | GO:0032433 | filopodium tip(GO:0032433) |
| 0.4 | 1.9 | GO:0033263 | CORVET complex(GO:0033263) |
| 0.4 | 4.8 | GO:0097136 | Bcl-2 family protein complex(GO:0097136) |
| 0.4 | 6.2 | GO:0030285 | integral component of synaptic vesicle membrane(GO:0030285) intrinsic component of synaptic vesicle membrane(GO:0098563) |
| 0.4 | 4.7 | GO:0005664 | origin recognition complex(GO:0000808) nuclear origin of replication recognition complex(GO:0005664) |
| 0.4 | 6.7 | GO:0005885 | Arp2/3 protein complex(GO:0005885) |
| 0.4 | 10.2 | GO:0005640 | nuclear outer membrane(GO:0005640) |
| 0.3 | 3.1 | GO:0061574 | ASAP complex(GO:0061574) |
| 0.3 | 6.1 | GO:0070469 | respiratory chain(GO:0070469) |
| 0.3 | 4.2 | GO:1990712 | HFE-transferrin receptor complex(GO:1990712) |
| 0.3 | 2.2 | GO:0036513 | Derlin-1 retrotranslocation complex(GO:0036513) |
| 0.3 | 1.0 | GO:0031213 | RSF complex(GO:0031213) |
| 0.3 | 2.2 | GO:0008091 | spectrin(GO:0008091) |
| 0.3 | 7.0 | GO:0005763 | organellar small ribosomal subunit(GO:0000314) mitochondrial small ribosomal subunit(GO:0005763) |
| 0.3 | 6.1 | GO:0030867 | rough endoplasmic reticulum membrane(GO:0030867) |
| 0.3 | 3.7 | GO:0001673 | male germ cell nucleus(GO:0001673) |
| 0.2 | 32.0 | GO:0032587 | ruffle membrane(GO:0032587) |
| 0.2 | 5.1 | GO:0071141 | SMAD protein complex(GO:0071141) |
| 0.2 | 3.3 | GO:0000124 | SAGA complex(GO:0000124) |
| 0.2 | 2.7 | GO:0000815 | ESCRT III complex(GO:0000815) |
| 0.2 | 5.0 | GO:0016580 | Sin3 complex(GO:0016580) |
| 0.2 | 0.6 | GO:0005873 | plus-end kinesin complex(GO:0005873) |
| 0.2 | 3.1 | GO:0042405 | nuclear inclusion body(GO:0042405) |
| 0.2 | 5.2 | GO:0031231 | integral component of peroxisomal membrane(GO:0005779) intrinsic component of peroxisomal membrane(GO:0031231) |
| 0.2 | 4.6 | GO:0032156 | septin cytoskeleton(GO:0032156) |
| 0.2 | 1.4 | GO:1990635 | proximal dendrite(GO:1990635) |
| 0.2 | 4.3 | GO:0032585 | multivesicular body membrane(GO:0032585) |
| 0.2 | 2.3 | GO:0008250 | oligosaccharyltransferase complex(GO:0008250) |
| 0.2 | 2.5 | GO:0005811 | lipid particle(GO:0005811) |
| 0.2 | 2.0 | GO:0033391 | mRNA cap binding complex(GO:0005845) chromatoid body(GO:0033391) RNA cap binding complex(GO:0034518) |
| 0.2 | 40.3 | GO:0043209 | myelin sheath(GO:0043209) |
| 0.2 | 2.0 | GO:0005614 | interstitial matrix(GO:0005614) |
| 0.2 | 9.8 | GO:0019005 | SCF ubiquitin ligase complex(GO:0019005) |
| 0.2 | 8.2 | GO:0008180 | COP9 signalosome(GO:0008180) |
| 0.2 | 3.0 | GO:0034045 | pre-autophagosomal structure membrane(GO:0034045) |
| 0.2 | 2.0 | GO:0033162 | melanosome membrane(GO:0033162) chitosome(GO:0045009) |
| 0.2 | 4.3 | GO:0035371 | microtubule plus-end(GO:0035371) |
| 0.2 | 1.4 | GO:0032045 | guanyl-nucleotide exchange factor complex(GO:0032045) |
| 0.2 | 7.7 | GO:0005834 | heterotrimeric G-protein complex(GO:0005834) |
| 0.1 | 1.1 | GO:0045495 | P granule(GO:0043186) pole plasm(GO:0045495) germ plasm(GO:0060293) |
| 0.1 | 2.3 | GO:0017053 | transcriptional repressor complex(GO:0017053) |
| 0.1 | 1.7 | GO:0016281 | eukaryotic translation initiation factor 4F complex(GO:0016281) |
| 0.1 | 21.9 | GO:0000922 | spindle pole(GO:0000922) |
| 0.1 | 0.5 | GO:1990037 | Lewy body core(GO:1990037) |
| 0.1 | 8.1 | GO:0022627 | cytosolic small ribosomal subunit(GO:0022627) |
| 0.1 | 0.3 | GO:0005879 | axonemal microtubule(GO:0005879) |
| 0.1 | 7.6 | GO:0005758 | mitochondrial intermembrane space(GO:0005758) |
| 0.1 | 3.4 | GO:0005719 | nuclear euchromatin(GO:0005719) |
| 0.1 | 14.5 | GO:0005793 | endoplasmic reticulum-Golgi intermediate compartment(GO:0005793) |
| 0.1 | 5.4 | GO:0008021 | synaptic vesicle(GO:0008021) |
| 0.1 | 1.1 | GO:0034663 | endoplasmic reticulum chaperone complex(GO:0034663) |
| 0.1 | 2.2 | GO:0016514 | SWI/SNF complex(GO:0016514) |
| 0.1 | 3.4 | GO:0001772 | immunological synapse(GO:0001772) |
| 0.1 | 0.5 | GO:0030126 | COPI vesicle coat(GO:0030126) COPI-coated vesicle membrane(GO:0030663) |
| 0.1 | 2.1 | GO:0000159 | protein phosphatase type 2A complex(GO:0000159) |
| 0.1 | 1.5 | GO:0031519 | PcG protein complex(GO:0031519) |
| 0.1 | 3.3 | GO:0005637 | nuclear inner membrane(GO:0005637) |
| 0.1 | 2.3 | GO:0042645 | nucleoid(GO:0009295) mitochondrial nucleoid(GO:0042645) |
| 0.1 | 1.2 | GO:0034451 | centriolar satellite(GO:0034451) |
| 0.1 | 0.5 | GO:0031931 | TORC1 complex(GO:0031931) |
| 0.1 | 9.0 | GO:0030426 | growth cone(GO:0030426) |
| 0.1 | 12.8 | GO:0005802 | trans-Golgi network(GO:0005802) |
| 0.1 | 3.0 | GO:0099501 | synaptic vesicle membrane(GO:0030672) exocytic vesicle membrane(GO:0099501) |
| 0.1 | 2.8 | GO:0035577 | azurophil granule membrane(GO:0035577) |
| 0.1 | 4.2 | GO:0016234 | inclusion body(GO:0016234) |
| 0.0 | 7.8 | GO:0101002 | ficolin-1-rich granule(GO:0101002) ficolin-1-rich granule lumen(GO:1904813) |
| 0.0 | 2.2 | GO:0033017 | sarcoplasmic reticulum membrane(GO:0033017) |
| 0.0 | 1.6 | GO:0032590 | dendrite membrane(GO:0032590) |
| 0.0 | 5.1 | GO:0031234 | extrinsic component of cytoplasmic side of plasma membrane(GO:0031234) |
| 0.0 | 1.0 | GO:0035861 | site of double-strand break(GO:0035861) |
| 0.0 | 4.1 | GO:0043204 | perikaryon(GO:0043204) |
| 0.0 | 5.0 | GO:0031225 | anchored component of membrane(GO:0031225) |
| 0.0 | 3.3 | GO:0005643 | nuclear pore(GO:0005643) |
| 0.0 | 1.8 | GO:0000118 | histone deacetylase complex(GO:0000118) |
| 0.0 | 3.3 | GO:0016363 | nuclear matrix(GO:0016363) |
| 0.0 | 7.0 | GO:0000790 | nuclear chromatin(GO:0000790) |
| 0.0 | 1.5 | GO:0045171 | intercellular bridge(GO:0045171) |
| 0.0 | 0.2 | GO:0005851 | eukaryotic translation initiation factor 2B complex(GO:0005851) |
| 0.0 | 0.3 | GO:0036020 | endolysosome membrane(GO:0036020) |
| 0.0 | 1.8 | GO:0005604 | basement membrane(GO:0005604) |
| 0.0 | 6.8 | GO:0016607 | nuclear speck(GO:0016607) |
| 0.0 | 5.1 | GO:0005874 | microtubule(GO:0005874) |
| 0.0 | 0.3 | GO:0030127 | COPII vesicle coat(GO:0030127) |
| 0.0 | 0.4 | GO:0055038 | recycling endosome membrane(GO:0055038) |
| 0.0 | 1.3 | GO:0042470 | melanosome(GO:0042470) pigment granule(GO:0048770) |
| 0.0 | 0.4 | GO:0008074 | guanylate cyclase complex, soluble(GO:0008074) |
| 0.0 | 2.0 | GO:0045111 | intermediate filament cytoskeleton(GO:0045111) |
| 0.0 | 1.5 | GO:0031965 | nuclear membrane(GO:0031965) |
| 0.0 | 0.3 | GO:0005892 | acetylcholine-gated channel complex(GO:0005892) |
| 0.0 | 1.4 | GO:0000785 | chromatin(GO:0000785) |
| 0.0 | 0.5 | GO:0031463 | Cul3-RING ubiquitin ligase complex(GO:0031463) |
| 0.0 | 0.3 | GO:0048786 | presynaptic active zone(GO:0048786) |
Gene overrepresentation in molecular_function category:
| Log-likelihood per target | Total log-likelihood | Term | Description |
|---|---|---|---|
| 3.8 | 11.3 | GO:0008177 | succinate dehydrogenase (ubiquinone) activity(GO:0008177) |
| 3.3 | 6.7 | GO:0016418 | S-acetyltransferase activity(GO:0016418) |
| 3.1 | 9.3 | GO:0045155 | electron transporter, transferring electrons from CoQH2-cytochrome c reductase complex and cytochrome c oxidase complex activity(GO:0045155) |
| 2.7 | 8.2 | GO:0000035 | acyl binding(GO:0000035) phosphopantetheine binding(GO:0031177) |
| 2.5 | 17.6 | GO:0008121 | ubiquinol-cytochrome-c reductase activity(GO:0008121) oxidoreductase activity, acting on diphenols and related substances as donors, cytochrome as acceptor(GO:0016681) |
| 2.4 | 14.2 | GO:0023025 | MHC class Ib protein complex binding(GO:0023025) MHC class Ib protein binding, via antigen binding groove(GO:0023030) |
| 2.2 | 114.1 | GO:0050136 | NADH dehydrogenase (ubiquinone) activity(GO:0008137) NADH dehydrogenase (quinone) activity(GO:0050136) |
| 2.2 | 35.1 | GO:0005391 | sodium:potassium-exchanging ATPase activity(GO:0005391) |
| 2.1 | 12.8 | GO:0043532 | angiostatin binding(GO:0043532) |
| 2.1 | 6.3 | GO:0003978 | UDP-N-acetylglucosamine 4-epimerase activity(GO:0003974) UDP-glucose 4-epimerase activity(GO:0003978) |
| 1.9 | 7.6 | GO:0031871 | proteinase activated receptor binding(GO:0031871) |
| 1.7 | 39.2 | GO:0046933 | proton-transporting ATP synthase activity, rotational mechanism(GO:0046933) |
| 1.7 | 5.0 | GO:0033867 | Fas-activated serine/threonine kinase activity(GO:0033867) |
| 1.5 | 6.1 | GO:0004082 | bisphosphoglycerate mutase activity(GO:0004082) phosphoglycerate mutase activity(GO:0004619) 2,3-bisphosphoglycerate-dependent phosphoglycerate mutase activity(GO:0046538) |
| 1.5 | 4.5 | GO:0003983 | UTP:glucose-1-phosphate uridylyltransferase activity(GO:0003983) UTP-monosaccharide-1-phosphate uridylyltransferase activity(GO:0051748) |
| 1.5 | 4.5 | GO:0015117 | thiosulfate transmembrane transporter activity(GO:0015117) oxaloacetate transmembrane transporter activity(GO:0015131) |
| 1.4 | 4.2 | GO:0015091 | ferric iron transmembrane transporter activity(GO:0015091) trivalent inorganic cation transmembrane transporter activity(GO:0072510) |
| 1.3 | 9.3 | GO:0004849 | uridine kinase activity(GO:0004849) |
| 1.3 | 15.6 | GO:0000774 | adenyl-nucleotide exchange factor activity(GO:0000774) |
| 1.2 | 2.4 | GO:0051538 | 3 iron, 4 sulfur cluster binding(GO:0051538) |
| 1.0 | 6.1 | GO:0004839 | ubiquitin activating enzyme activity(GO:0004839) |
| 1.0 | 3.0 | GO:0050613 | delta14-sterol reductase activity(GO:0050613) |
| 1.0 | 13.9 | GO:0016018 | cyclosporin A binding(GO:0016018) |
| 1.0 | 7.7 | GO:0008379 | thioredoxin peroxidase activity(GO:0008379) |
| 1.0 | 4.8 | GO:0004591 | oxoglutarate dehydrogenase (succinyl-transferring) activity(GO:0004591) |
| 0.9 | 2.8 | GO:0016838 | carbon-oxygen lyase activity, acting on phosphates(GO:0016838) |
| 0.9 | 2.8 | GO:0032551 | pyrimidine nucleoside binding(GO:0001884) UTP binding(GO:0002134) pyrimidine ribonucleoside binding(GO:0032551) pyrimidine ribonucleotide binding(GO:0032557) |
| 0.9 | 5.5 | GO:0010858 | calcium-dependent protein kinase regulator activity(GO:0010858) |
| 0.9 | 7.3 | GO:0015450 | P-P-bond-hydrolysis-driven protein transmembrane transporter activity(GO:0015450) |
| 0.9 | 3.5 | GO:0047391 | alkylglycerophosphoethanolamine phosphodiesterase activity(GO:0047391) |
| 0.9 | 5.1 | GO:0035500 | MH2 domain binding(GO:0035500) |
| 0.8 | 3.3 | GO:0004449 | isocitrate dehydrogenase (NAD+) activity(GO:0004449) |
| 0.8 | 6.5 | GO:0004563 | beta-N-acetylhexosaminidase activity(GO:0004563) |
| 0.8 | 4.7 | GO:0016909 | JUN kinase activity(GO:0004705) SAP kinase activity(GO:0016909) |
| 0.8 | 7.7 | GO:0004723 | calcium-dependent protein serine/threonine phosphatase activity(GO:0004723) |
| 0.8 | 4.6 | GO:0034604 | pyruvate dehydrogenase activity(GO:0004738) pyruvate dehydrogenase [NAD(P)+] activity(GO:0034603) pyruvate dehydrogenase (NAD+) activity(GO:0034604) |
| 0.7 | 5.2 | GO:0030621 | U4 snRNA binding(GO:0030621) |
| 0.7 | 5.7 | GO:0070181 | small ribosomal subunit rRNA binding(GO:0070181) |
| 0.7 | 20.0 | GO:0016676 | cytochrome-c oxidase activity(GO:0004129) heme-copper terminal oxidase activity(GO:0015002) oxidoreductase activity, acting on a heme group of donors, oxygen as acceptor(GO:0016676) |
| 0.7 | 9.2 | GO:0004596 | peptide alpha-N-acetyltransferase activity(GO:0004596) |
| 0.7 | 7.7 | GO:0000150 | recombinase activity(GO:0000150) |
| 0.7 | 5.5 | GO:0071933 | Arp2/3 complex binding(GO:0071933) |
| 0.7 | 18.2 | GO:0051010 | microtubule plus-end binding(GO:0051010) |
| 0.7 | 4.6 | GO:0017077 | oxidative phosphorylation uncoupler activity(GO:0017077) |
| 0.6 | 4.3 | GO:0061575 | cyclin-dependent protein serine/threonine kinase activator activity(GO:0061575) |
| 0.6 | 4.8 | GO:0030911 | TPR domain binding(GO:0030911) |
| 0.6 | 1.7 | GO:0008267 | poly-glutamine tract binding(GO:0008267) |
| 0.6 | 1.7 | GO:0032184 | SUMO polymer binding(GO:0032184) |
| 0.6 | 2.3 | GO:0004466 | long-chain-acyl-CoA dehydrogenase activity(GO:0004466) |
| 0.6 | 6.3 | GO:0031681 | G-protein beta-subunit binding(GO:0031681) |
| 0.6 | 7.9 | GO:0034450 | ubiquitin-ubiquitin ligase activity(GO:0034450) |
| 0.5 | 13.0 | GO:0005086 | ARF guanyl-nucleotide exchange factor activity(GO:0005086) |
| 0.5 | 1.5 | GO:0090556 | apolipoprotein A-I receptor activity(GO:0034188) phosphatidylserine-translocating ATPase activity(GO:0090556) |
| 0.5 | 2.5 | GO:0052740 | 1-acyl-2-lysophosphatidylserine acylhydrolase activity(GO:0052740) |
| 0.5 | 4.0 | GO:0004064 | arylesterase activity(GO:0004064) |
| 0.5 | 5.4 | GO:0016861 | intramolecular oxidoreductase activity, interconverting aldoses and ketoses(GO:0016861) |
| 0.5 | 2.5 | GO:0070404 | NADH binding(GO:0070404) |
| 0.5 | 6.4 | GO:1990247 | N6-methyladenosine-containing RNA binding(GO:1990247) |
| 0.5 | 2.4 | GO:0016403 | dimethylargininase activity(GO:0016403) |
| 0.5 | 12.8 | GO:0035173 | histone kinase activity(GO:0035173) |
| 0.5 | 4.3 | GO:0032051 | clathrin light chain binding(GO:0032051) |
| 0.5 | 3.2 | GO:0019788 | small protein activating enzyme activity(GO:0008641) NEDD8 transferase activity(GO:0019788) |
| 0.4 | 24.2 | GO:0034987 | immunoglobulin receptor binding(GO:0034987) |
| 0.4 | 9.2 | GO:0003746 | translation elongation factor activity(GO:0003746) |
| 0.4 | 8.6 | GO:0070300 | phosphatidic acid binding(GO:0070300) |
| 0.4 | 7.6 | GO:0016175 | superoxide-generating NADPH oxidase activity(GO:0016175) |
| 0.4 | 4.9 | GO:0017070 | U6 snRNA binding(GO:0017070) |
| 0.4 | 22.5 | GO:0015078 | hydrogen ion transmembrane transporter activity(GO:0015078) |
| 0.4 | 3.3 | GO:0015288 | porin activity(GO:0015288) |
| 0.4 | 4.9 | GO:0031078 | histone deacetylase activity (H3-K14 specific)(GO:0031078) NAD-dependent histone deacetylase activity (H3-K14 specific)(GO:0032041) |
| 0.4 | 5.3 | GO:0031702 | type 1 angiotensin receptor binding(GO:0031702) |
| 0.3 | 4.5 | GO:0001087 | transcription factor activity, sequence-specific DNA binding, RNA polymerase recruiting(GO:0001011) transcription factor activity, TFIIB-class binding(GO:0001087) |
| 0.3 | 3.2 | GO:0019784 | NEDD8-specific protease activity(GO:0019784) |
| 0.3 | 1.3 | GO:0016532 | superoxide dismutase copper chaperone activity(GO:0016532) |
| 0.3 | 1.8 | GO:0008948 | malate dehydrogenase (decarboxylating) (NAD+) activity(GO:0004471) malate dehydrogenase (decarboxylating) (NADP+) activity(GO:0004473) oxaloacetate decarboxylase activity(GO:0008948) |
| 0.3 | 3.6 | GO:0043225 | anion transmembrane-transporting ATPase activity(GO:0043225) |
| 0.3 | 10.6 | GO:0017091 | AU-rich element binding(GO:0017091) |
| 0.3 | 4.6 | GO:0004707 | MAP kinase activity(GO:0004707) |
| 0.3 | 6.3 | GO:0008242 | omega peptidase activity(GO:0008242) |
| 0.3 | 3.4 | GO:0004017 | adenylate kinase activity(GO:0004017) |
| 0.3 | 5.2 | GO:0015114 | phosphate ion transmembrane transporter activity(GO:0015114) |
| 0.3 | 2.7 | GO:1990381 | ubiquitin-specific protease binding(GO:1990381) |
| 0.3 | 1.6 | GO:0051032 | nucleic acid transmembrane transporter activity(GO:0051032) RNA transmembrane transporter activity(GO:0051033) |
| 0.3 | 1.0 | GO:0061649 | ubiquitinated histone binding(GO:0061649) |
| 0.3 | 2.0 | GO:0000340 | RNA 7-methylguanosine cap binding(GO:0000340) |
| 0.2 | 7.0 | GO:0048487 | beta-tubulin binding(GO:0048487) |
| 0.2 | 4.7 | GO:0043325 | phosphatidylinositol-3,4-bisphosphate binding(GO:0043325) |
| 0.2 | 3.0 | GO:0080025 | phosphatidylinositol-3,5-bisphosphate binding(GO:0080025) |
| 0.2 | 7.6 | GO:0001671 | ATPase activator activity(GO:0001671) |
| 0.2 | 1.5 | GO:0003747 | translation release factor activity(GO:0003747) translation termination factor activity(GO:0008079) |
| 0.2 | 4.8 | GO:0051400 | BH domain binding(GO:0051400) |
| 0.2 | 2.3 | GO:0004579 | dolichyl-diphosphooligosaccharide-protein glycotransferase activity(GO:0004579) |
| 0.2 | 2.2 | GO:1904264 | ubiquitin protein ligase activity involved in ERAD pathway(GO:1904264) |
| 0.2 | 4.2 | GO:0015923 | mannosidase activity(GO:0015923) |
| 0.2 | 6.7 | GO:0017075 | syntaxin-1 binding(GO:0017075) |
| 0.2 | 9.9 | GO:0061631 | ubiquitin conjugating enzyme activity(GO:0061631) |
| 0.2 | 0.8 | GO:0008568 | microtubule-severing ATPase activity(GO:0008568) |
| 0.2 | 1.2 | GO:0004167 | dopachrome isomerase activity(GO:0004167) |
| 0.2 | 2.5 | GO:1990825 | sequence-specific mRNA binding(GO:1990825) |
| 0.2 | 0.7 | GO:0004047 | aminomethyltransferase activity(GO:0004047) |
| 0.2 | 8.5 | GO:0016831 | carboxy-lyase activity(GO:0016831) |
| 0.2 | 3.4 | GO:0032454 | histone demethylase activity (H3-K9 specific)(GO:0032454) |
| 0.2 | 2.8 | GO:0019992 | diacylglycerol binding(GO:0019992) |
| 0.2 | 1.9 | GO:0030274 | LIM domain binding(GO:0030274) |
| 0.2 | 4.5 | GO:0042288 | MHC class I protein binding(GO:0042288) |
| 0.2 | 6.8 | GO:0036002 | pre-mRNA binding(GO:0036002) |
| 0.2 | 0.5 | GO:0034353 | RNA pyrophosphohydrolase activity(GO:0034353) |
| 0.2 | 3.9 | GO:0019198 | transmembrane receptor protein tyrosine phosphatase activity(GO:0005001) transmembrane receptor protein phosphatase activity(GO:0019198) |
| 0.2 | 1.4 | GO:0031821 | G-protein coupled serotonin receptor binding(GO:0031821) |
| 0.2 | 4.4 | GO:0043014 | alpha-tubulin binding(GO:0043014) |
| 0.1 | 1.5 | GO:0034594 | inositol-polyphosphate 5-phosphatase activity(GO:0004445) phosphatidylinositol-3,4,5-trisphosphate 5-phosphatase activity(GO:0034485) phosphatidylinositol trisphosphate phosphatase activity(GO:0034594) |
| 0.1 | 7.0 | GO:0042169 | SH2 domain binding(GO:0042169) |
| 0.1 | 2.6 | GO:0004535 | poly(A)-specific ribonuclease activity(GO:0004535) |
| 0.1 | 4.0 | GO:0005527 | macrolide binding(GO:0005527) FK506 binding(GO:0005528) |
| 0.1 | 1.8 | GO:0038132 | neuregulin binding(GO:0038132) |
| 0.1 | 2.7 | GO:0005095 | GTPase inhibitor activity(GO:0005095) |
| 0.1 | 9.9 | GO:0051087 | chaperone binding(GO:0051087) |
| 0.1 | 4.5 | GO:0005080 | protein kinase C binding(GO:0005080) |
| 0.1 | 2.4 | GO:0044548 | S100 protein binding(GO:0044548) |
| 0.1 | 1.2 | GO:0046790 | virion binding(GO:0046790) |
| 0.1 | 1.7 | GO:0008190 | eukaryotic initiation factor 4E binding(GO:0008190) |
| 0.1 | 3.1 | GO:0030742 | GTP-dependent protein binding(GO:0030742) |
| 0.1 | 23.1 | GO:0061630 | ubiquitin protein ligase activity(GO:0061630) |
| 0.1 | 5.9 | GO:0001105 | RNA polymerase II transcription coactivator activity(GO:0001105) |
| 0.1 | 1.2 | GO:0016290 | palmitoyl-CoA hydrolase activity(GO:0016290) |
| 0.1 | 0.8 | GO:0004873 | asialoglycoprotein receptor activity(GO:0004873) |
| 0.1 | 16.0 | GO:0003823 | antigen binding(GO:0003823) |
| 0.1 | 5.8 | GO:0070063 | RNA polymerase binding(GO:0070063) |
| 0.1 | 2.4 | GO:0008093 | cytoskeletal adaptor activity(GO:0008093) |
| 0.1 | 9.4 | GO:0004725 | protein tyrosine phosphatase activity(GO:0004725) |
| 0.1 | 25.5 | GO:0015631 | tubulin binding(GO:0015631) |
| 0.1 | 2.4 | GO:0003951 | NAD+ kinase activity(GO:0003951) |
| 0.1 | 0.3 | GO:0016160 | amylase activity(GO:0016160) |
| 0.1 | 1.0 | GO:0003680 | AT DNA binding(GO:0003680) |
| 0.1 | 1.6 | GO:0005385 | zinc ion transmembrane transporter activity(GO:0005385) |
| 0.1 | 14.7 | GO:0003729 | mRNA binding(GO:0003729) poly(A) RNA binding(GO:0044822) |
| 0.1 | 18.1 | GO:0003735 | structural constituent of ribosome(GO:0003735) |
| 0.1 | 0.8 | GO:0070273 | phosphatidylinositol-4-phosphate binding(GO:0070273) |
| 0.1 | 4.0 | GO:0016836 | hydro-lyase activity(GO:0016836) |
| 0.1 | 2.2 | GO:0031492 | nucleosomal DNA binding(GO:0031492) |
| 0.1 | 0.5 | GO:0001733 | galactosylceramide sulfotransferase activity(GO:0001733) galactose 3-O-sulfotransferase activity(GO:0050694) |
| 0.1 | 5.6 | GO:0016765 | transferase activity, transferring alkyl or aryl (other than methyl) groups(GO:0016765) |
| 0.1 | 1.7 | GO:0005104 | fibroblast growth factor receptor binding(GO:0005104) |
| 0.1 | 4.2 | GO:0016651 | oxidoreductase activity, acting on NAD(P)H(GO:0016651) |
| 0.1 | 0.8 | GO:0004497 | monooxygenase activity(GO:0004497) |
| 0.1 | 2.4 | GO:0030552 | cAMP binding(GO:0030552) |
| 0.1 | 1.2 | GO:0017025 | TBP-class protein binding(GO:0017025) |
| 0.1 | 1.3 | GO:0051721 | protein phosphatase 2A binding(GO:0051721) |
| 0.1 | 2.6 | GO:0019213 | deacetylase activity(GO:0019213) |
| 0.1 | 4.6 | GO:0008013 | beta-catenin binding(GO:0008013) |
| 0.1 | 1.0 | GO:0031491 | nucleosome binding(GO:0031491) |
| 0.1 | 0.6 | GO:0097016 | L27 domain binding(GO:0097016) |
| 0.1 | 0.9 | GO:0015467 | G-protein activated inward rectifier potassium channel activity(GO:0015467) |
| 0.0 | 0.6 | GO:0015095 | magnesium ion transmembrane transporter activity(GO:0015095) |
| 0.0 | 0.8 | GO:0070064 | proline-rich region binding(GO:0070064) |
| 0.0 | 3.7 | GO:0051082 | unfolded protein binding(GO:0051082) |
| 0.0 | 0.5 | GO:0015280 | ligand-gated sodium channel activity(GO:0015280) |
| 0.0 | 4.4 | GO:0004222 | metalloendopeptidase activity(GO:0004222) |
| 0.0 | 0.5 | GO:0008503 | benzodiazepine receptor activity(GO:0008503) |
| 0.0 | 2.7 | GO:0004860 | protein kinase inhibitor activity(GO:0004860) |
| 0.0 | 2.2 | GO:0050840 | extracellular matrix binding(GO:0050840) |
| 0.0 | 0.4 | GO:0015643 | toxic substance binding(GO:0015643) |
| 0.0 | 0.1 | GO:0001588 | dopamine neurotransmitter receptor activity, coupled via Gs(GO:0001588) |
| 0.0 | 1.4 | GO:0043531 | ADP binding(GO:0043531) |
| 0.0 | 0.4 | GO:0016884 | carbon-nitrogen ligase activity, with glutamine as amido-N-donor(GO:0016884) |
| 0.0 | 0.5 | GO:0005337 | nucleoside transmembrane transporter activity(GO:0005337) |
| 0.0 | 1.0 | GO:0004864 | protein phosphatase inhibitor activity(GO:0004864) |
| 0.0 | 0.3 | GO:0031013 | troponin I binding(GO:0031013) |
| 0.0 | 1.3 | GO:0008375 | acetylglucosaminyltransferase activity(GO:0008375) |
| 0.0 | 2.3 | GO:0008565 | protein transporter activity(GO:0008565) |
| 0.0 | 2.7 | GO:0042393 | histone binding(GO:0042393) |
| 0.0 | 3.7 | GO:0004842 | ubiquitin-protein transferase activity(GO:0004842) |
| 0.0 | 0.9 | GO:0005544 | calcium-dependent phospholipid binding(GO:0005544) |
| 0.0 | 0.3 | GO:0042166 | acetylcholine binding(GO:0042166) |
| 0.0 | 0.7 | GO:0004722 | protein serine/threonine phosphatase activity(GO:0004722) |
| 0.0 | 0.1 | GO:0008199 | ferric iron binding(GO:0008199) |
| 0.0 | 0.3 | GO:0015020 | glucuronosyltransferase activity(GO:0015020) |
Gene overrepresentation in C2:CP category:
| Log-likelihood per target | Total log-likelihood | Term | Description |
|---|---|---|---|
| 1.1 | 15.5 | SA G2 AND M PHASES | Cdc25 activates the cdc2/cyclin B complex to induce the G2/M transition. |
| 0.8 | 13.6 | PID P38 GAMMA DELTA PATHWAY | Signaling mediated by p38-gamma and p38-delta |
| 0.4 | 4.3 | ST IL 13 PATHWAY | Interleukin 13 (IL-13) Pathway |
| 0.4 | 13.1 | ST WNT CA2 CYCLIC GMP PATHWAY | Wnt/Ca2+/cyclic GMP signaling. |
| 0.3 | 5.0 | PID RANBP2 PATHWAY | Sumoylation by RanBP2 regulates transcriptional repression |
| 0.3 | 4.8 | SA PROGRAMMED CELL DEATH | Programmed cell death, or apoptosis, eliminates damaged or unneeded cells. |
| 0.2 | 14.4 | PID IL2 STAT5 PATHWAY | IL2 signaling events mediated by STAT5 |
| 0.2 | 4.7 | ST GRANULE CELL SURVIVAL PATHWAY | Granule Cell Survival Pathway is a specific case of more general PAC1 Receptor Pathway. |
| 0.2 | 4.6 | PID P38 MKK3 6PATHWAY | p38 MAPK signaling pathway |
| 0.2 | 16.6 | PID ILK PATHWAY | Integrin-linked kinase signaling |
| 0.2 | 15.3 | PID RAC1 PATHWAY | RAC1 signaling pathway |
| 0.2 | 11.6 | PID PS1 PATHWAY | Presenilin action in Notch and Wnt signaling |
| 0.2 | 12.8 | PID HNF3A PATHWAY | FOXA1 transcription factor network |
| 0.2 | 7.9 | PID IGF1 PATHWAY | IGF1 pathway |
| 0.2 | 5.5 | PID TOLL ENDOGENOUS PATHWAY | Endogenous TLR signaling |
| 0.2 | 16.1 | PID AR PATHWAY | Coregulation of Androgen receptor activity |
| 0.1 | 17.9 | PID MYC REPRESS PATHWAY | Validated targets of C-MYC transcriptional repression |
| 0.1 | 10.5 | ST FAS SIGNALING PATHWAY | Fas Signaling Pathway |
| 0.1 | 3.5 | PID CERAMIDE PATHWAY | Ceramide signaling pathway |
| 0.1 | 8.3 | PID CASPASE PATHWAY | Caspase cascade in apoptosis |
| 0.1 | 1.4 | PID S1P S1P4 PATHWAY | S1P4 pathway |
| 0.1 | 4.9 | PID FOXM1 PATHWAY | FOXM1 transcription factor network |
| 0.1 | 5.2 | PID HNF3B PATHWAY | FOXA2 and FOXA3 transcription factor networks |
| 0.1 | 1.3 | PID EPHA2 FWD PATHWAY | EPHA2 forward signaling |
| 0.1 | 1.8 | PID ERBB NETWORK PATHWAY | ErbB receptor signaling network |
| 0.1 | 0.7 | PID IL6 7 PATHWAY | IL6-mediated signaling events |
| 0.1 | 2.8 | PID CDC42 REG PATHWAY | Regulation of CDC42 activity |
| 0.1 | 4.9 | PID TRKR PATHWAY | Neurotrophic factor-mediated Trk receptor signaling |
| 0.1 | 2.7 | PID ERBB1 INTERNALIZATION PATHWAY | Internalization of ErbB1 |
| 0.1 | 5.1 | PID CMYB PATHWAY | C-MYB transcription factor network |
| 0.1 | 1.0 | PID ATM PATHWAY | ATM pathway |
| 0.1 | 2.2 | NABA COLLAGENS | Genes encoding collagen proteins |
| 0.0 | 1.4 | PID RAS PATHWAY | Regulation of Ras family activation |
| 0.0 | 1.5 | PID HDAC CLASSII PATHWAY | Signaling events mediated by HDAC Class II |
| 0.0 | 0.6 | PID ERBB2 ERBB3 PATHWAY | ErbB2/ErbB3 signaling events |
| 0.0 | 2.5 | PID TELOMERASE PATHWAY | Regulation of Telomerase |
| 0.0 | 0.8 | PID LIS1 PATHWAY | Lissencephaly gene (LIS1) in neuronal migration and development |
| 0.0 | 0.9 | PID P75 NTR PATHWAY | p75(NTR)-mediated signaling |
| 0.0 | 0.6 | PID ECADHERIN NASCENT AJ PATHWAY | E-cadherin signaling in the nascent adherens junction |
| 0.0 | 0.8 | PID P38 ALPHA BETA DOWNSTREAM PATHWAY | Signaling mediated by p38-alpha and p38-beta |
| 0.0 | 0.5 | PID AP1 PATHWAY | AP-1 transcription factor network |
Gene overrepresentation in C2:CP:REACTOME category:
| Log-likelihood per target | Total log-likelihood | Term | Description |
|---|---|---|---|
| 2.2 | 183.5 | REACTOME RESPIRATORY ELECTRON TRANSPORT | Genes involved in Respiratory electron transport |
| 1.5 | 35.2 | REACTOME FORMATION OF ATP BY CHEMIOSMOTIC COUPLING | Genes involved in Formation of ATP by chemiosmotic coupling |
| 1.1 | 4.3 | REACTOME SCFSKP2 MEDIATED DEGRADATION OF P27 P21 | Genes involved in SCF(Skp2)-mediated degradation of p27/p21 |
| 0.8 | 4.2 | REACTOME TRANSFERRIN ENDOCYTOSIS AND RECYCLING | Genes involved in Transferrin endocytosis and recycling |
| 0.7 | 9.9 | REACTOME VITAMIN B5 PANTOTHENATE METABOLISM | Genes involved in Vitamin B5 (pantothenate) metabolism |
| 0.7 | 4.6 | REACTOME RESPIRATORY ELECTRON TRANSPORT ATP SYNTHESIS BY CHEMIOSMOTIC COUPLING AND HEAT PRODUCTION BY UNCOUPLING PROTEINS | Genes involved in Respiratory electron transport, ATP synthesis by chemiosmotic coupling, and heat production by uncoupling proteins. |
| 0.6 | 35.1 | REACTOME ION TRANSPORT BY P TYPE ATPASES | Genes involved in Ion transport by P-type ATPases |
| 0.6 | 7.7 | REACTOME NOTCH HLH TRANSCRIPTION PATHWAY | Genes involved in Notch-HLH transcription pathway |
| 0.6 | 9.9 | REACTOME REGULATION OF PYRUVATE DEHYDROGENASE PDH COMPLEX | Genes involved in Regulation of pyruvate dehydrogenase (PDH) complex |
| 0.6 | 15.5 | REACTOME CYCLIN A B1 ASSOCIATED EVENTS DURING G2 M TRANSITION | Genes involved in Cyclin A/B1 associated events during G2/M transition |
| 0.5 | 8.4 | REACTOME SLBP DEPENDENT PROCESSING OF REPLICATION DEPENDENT HISTONE PRE MRNAS | Genes involved in SLBP Dependent Processing of Replication-Dependent Histone Pre-mRNAs |
| 0.5 | 9.8 | REACTOME CITRIC ACID CYCLE TCA CYCLE | Genes involved in Citric acid cycle (TCA cycle) |
| 0.5 | 2.4 | REACTOME BINDING AND ENTRY OF HIV VIRION | Genes involved in Binding and entry of HIV virion |
| 0.5 | 5.3 | REACTOME IL 6 SIGNALING | Genes involved in Interleukin-6 signaling |
| 0.5 | 23.3 | REACTOME MITOCHONDRIAL PROTEIN IMPORT | Genes involved in Mitochondrial Protein Import |
| 0.5 | 17.7 | REACTOME SIGNALING BY FGFR1 FUSION MUTANTS | Genes involved in Signaling by FGFR1 fusion mutants |
| 0.3 | 13.9 | REACTOME LATENT INFECTION OF HOMO SAPIENS WITH MYCOBACTERIUM TUBERCULOSIS | Genes involved in Latent infection of Homo sapiens with Mycobacterium tuberculosis |
| 0.3 | 5.6 | REACTOME CALNEXIN CALRETICULIN CYCLE | Genes involved in Calnexin/calreticulin cycle |
| 0.3 | 7.5 | REACTOME TETRAHYDROBIOPTERIN BH4 SYNTHESIS RECYCLING SALVAGE AND REGULATION | Genes involved in Tetrahydrobiopterin (BH4) synthesis, recycling, salvage and regulation |
| 0.3 | 6.5 | REACTOME APOPTOSIS INDUCED DNA FRAGMENTATION | Genes involved in Apoptosis induced DNA fragmentation |
| 0.3 | 4.4 | REACTOME PROCESSING OF CAPPED INTRONLESS PRE MRNA | Genes involved in Processing of Capped Intronless Pre-mRNA |
| 0.3 | 12.2 | REACTOME SULFUR AMINO ACID METABOLISM | Genes involved in Sulfur amino acid metabolism |
| 0.3 | 2.4 | REACTOME PRE NOTCH TRANSCRIPTION AND TRANSLATION | Genes involved in Pre-NOTCH Transcription and Translation |
| 0.3 | 7.0 | REACTOME INSULIN SYNTHESIS AND PROCESSING | Genes involved in Insulin Synthesis and Processing |
| 0.3 | 9.3 | REACTOME PYRIMIDINE METABOLISM | Genes involved in Pyrimidine metabolism |
| 0.3 | 4.0 | REACTOME REVERSIBLE HYDRATION OF CARBON DIOXIDE | Genes involved in Reversible Hydration of Carbon Dioxide |
| 0.3 | 5.8 | REACTOME G0 AND EARLY G1 | Genes involved in G0 and Early G1 |
| 0.2 | 4.7 | REACTOME ACTIVATION OF THE AP1 FAMILY OF TRANSCRIPTION FACTORS | Genes involved in Activation of the AP-1 family of transcription factors |
| 0.2 | 11.3 | REACTOME RAP1 SIGNALLING | Genes involved in Rap1 signalling |
| 0.2 | 1.5 | REACTOME SHC MEDIATED SIGNALLING | Genes involved in SHC-mediated signalling |
| 0.2 | 17.2 | REACTOME APOPTOTIC CLEAVAGE OF CELLULAR PROTEINS | Genes involved in Apoptotic cleavage of cellular proteins |
| 0.2 | 5.0 | REACTOME KINESINS | Genes involved in Kinesins |
| 0.2 | 4.9 | REACTOME GLUCURONIDATION | Genes involved in Glucuronidation |
| 0.2 | 48.0 | REACTOME ANTIGEN PROCESSING UBIQUITINATION PROTEASOME DEGRADATION | Genes involved in Antigen processing: Ubiquitination & Proteasome degradation |
| 0.2 | 7.9 | REACTOME GLUCONEOGENESIS | Genes involved in Gluconeogenesis |
| 0.1 | 3.4 | REACTOME N GLYCAN ANTENNAE ELONGATION | Genes involved in N-Glycan antennae elongation |
| 0.1 | 4.8 | REACTOME INTRINSIC PATHWAY FOR APOPTOSIS | Genes involved in Intrinsic Pathway for Apoptosis |
| 0.1 | 1.8 | REACTOME SIGNALING BY FGFR1 MUTANTS | Genes involved in Signaling by FGFR1 mutants |
| 0.1 | 0.7 | REACTOME APC CDC20 MEDIATED DEGRADATION OF NEK2A | Genes involved in APC-Cdc20 mediated degradation of Nek2A |
| 0.1 | 1.6 | REACTOME ZINC TRANSPORTERS | Genes involved in Zinc transporters |
| 0.1 | 8.1 | REACTOME FORMATION OF THE TERNARY COMPLEX AND SUBSEQUENTLY THE 43S COMPLEX | Genes involved in Formation of the ternary complex, and subsequently, the 43S complex |
| 0.1 | 2.0 | REACTOME MTORC1 MEDIATED SIGNALLING | Genes involved in mTORC1-mediated signalling |
| 0.1 | 3.4 | REACTOME SYNTHESIS AND INTERCONVERSION OF NUCLEOTIDE DI AND TRIPHOSPHATES | Genes involved in Synthesis and interconversion of nucleotide di- and triphosphates |
| 0.1 | 3.0 | REACTOME CHOLESTEROL BIOSYNTHESIS | Genes involved in Cholesterol biosynthesis |
| 0.1 | 4.5 | REACTOME MYOGENESIS | Genes involved in Myogenesis |
| 0.1 | 2.5 | REACTOME MRNA 3 END PROCESSING | Genes involved in mRNA 3'-end processing |
| 0.1 | 1.8 | REACTOME DOWNREGULATION OF ERBB2 ERBB3 SIGNALING | Genes involved in Downregulation of ERBB2:ERBB3 signaling |
| 0.1 | 2.2 | REACTOME CELL EXTRACELLULAR MATRIX INTERACTIONS | Genes involved in Cell-extracellular matrix interactions |
| 0.1 | 2.3 | REACTOME GLUTATHIONE CONJUGATION | Genes involved in Glutathione conjugation |
| 0.1 | 7.5 | REACTOME MRNA SPLICING | Genes involved in mRNA Splicing |
| 0.1 | 0.7 | REACTOME ACTIVATION OF CHAPERONE GENES BY ATF6 ALPHA | Genes involved in Activation of Chaperone Genes by ATF6-alpha |
| 0.1 | 1.1 | REACTOME IONOTROPIC ACTIVITY OF KAINATE RECEPTORS | Genes involved in Ionotropic activity of Kainate Receptors |
| 0.1 | 4.9 | REACTOME TRAF6 MEDIATED INDUCTION OF NFKB AND MAP KINASES UPON TLR7 8 OR 9 ACTIVATION | Genes involved in TRAF6 mediated induction of NFkB and MAP kinases upon TLR7/8 or 9 activation |
| 0.1 | 1.4 | REACTOME ADP SIGNALLING THROUGH P2RY12 | Genes involved in ADP signalling through P2Y purinoceptor 12 |
| 0.1 | 0.9 | REACTOME SYNTHESIS OF SUBSTRATES IN N GLYCAN BIOSYTHESIS | Genes involved in Synthesis of substrates in N-glycan biosythesis |
| 0.1 | 3.8 | REACTOME ANTIVIRAL MECHANISM BY IFN STIMULATED GENES | Genes involved in Antiviral mechanism by IFN-stimulated genes |
| 0.0 | 1.0 | REACTOME SYNTHESIS OF BILE ACIDS AND BILE SALTS VIA 7ALPHA HYDROXYCHOLESTEROL | Genes involved in Synthesis of bile acids and bile salts via 7alpha-hydroxycholesterol |
| 0.0 | 2.7 | REACTOME ASPARAGINE N LINKED GLYCOSYLATION | Genes involved in Asparagine N-linked glycosylation |
| 0.0 | 0.9 | REACTOME INHIBITION OF VOLTAGE GATED CA2 CHANNELS VIA GBETA GAMMA SUBUNITS | Genes involved in Inhibition of voltage gated Ca2+ channels via Gbeta/gamma subunits |
| 0.0 | 1.0 | REACTOME HOMOLOGOUS RECOMBINATION REPAIR OF REPLICATION INDEPENDENT DOUBLE STRAND BREAKS | Genes involved in Homologous recombination repair of replication-independent double-strand breaks |
| 0.0 | 1.6 | REACTOME REGULATION OF MRNA STABILITY BY PROTEINS THAT BIND AU RICH ELEMENTS | Genes involved in Regulation of mRNA Stability by Proteins that Bind AU-rich Elements |
| 0.0 | 1.5 | REACTOME SYNTHESIS OF PIPS AT THE PLASMA MEMBRANE | Genes involved in Synthesis of PIPs at the plasma membrane |
| 0.0 | 2.2 | REACTOME ACTIVATION OF CHAPERONE GENES BY XBP1S | Genes involved in Activation of Chaperone Genes by XBP1(S) |
| 0.0 | 0.6 | REACTOME PRESYNAPTIC NICOTINIC ACETYLCHOLINE RECEPTORS | Genes involved in Presynaptic nicotinic acetylcholine receptors |
| 0.0 | 2.2 | REACTOME COLLAGEN FORMATION | Genes involved in Collagen formation |
| 0.0 | 1.8 | REACTOME NCAM SIGNALING FOR NEURITE OUT GROWTH | Genes involved in NCAM signaling for neurite out-growth |
| 0.0 | 2.6 | REACTOME INTERFERON GAMMA SIGNALING | Genes involved in Interferon gamma signaling |
| 0.0 | 0.4 | REACTOME REGULATION OF WATER BALANCE BY RENAL AQUAPORINS | Genes involved in Regulation of Water Balance by Renal Aquaporins |
| 0.0 | 0.7 | REACTOME DOWNSTREAM SIGNALING EVENTS OF B CELL RECEPTOR BCR | Genes involved in Downstream Signaling Events Of B Cell Receptor (BCR) |
| 0.0 | 0.2 | REACTOME NEF MEDIATED DOWNREGULATION OF MHC CLASS I COMPLEX CELL SURFACE EXPRESSION | Genes involved in Nef mediated downregulation of MHC class I complex cell surface expression |
| 0.0 | 1.0 | REACTOME DEPOSITION OF NEW CENPA CONTAINING NUCLEOSOMES AT THE CENTROMERE | Genes involved in Deposition of New CENPA-containing Nucleosomes at the Centromere |
| 0.0 | 0.3 | REACTOME ASSOCIATION OF TRIC CCT WITH TARGET PROTEINS DURING BIOSYNTHESIS | Genes involved in Association of TriC/CCT with target proteins during biosynthesis |
| 0.0 | 1.1 | REACTOME P75 NTR RECEPTOR MEDIATED SIGNALLING | Genes involved in p75 NTR receptor-mediated signalling |