Project
GNF SymAtlas + NCI-60 cancer cell lines, comparison of cancers vs non-cancers, human (Su, 2004; Ross, 2000)
Navigation
Downloads
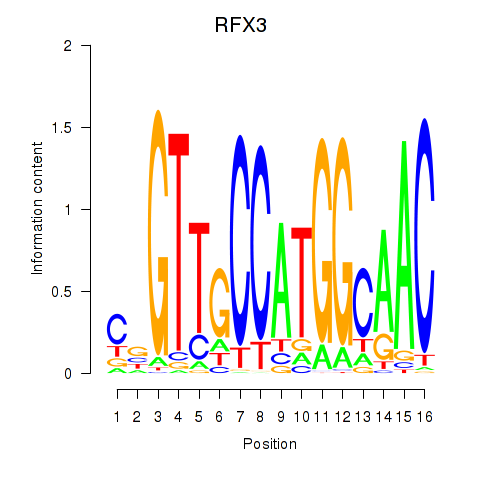
Results for RFX3_RFX2
Z-value: 1.78
Motif logo

Transcription factors associated with RFX3_RFX2
| Gene Symbol | Gene ID | Gene Info |
|---|---|---|
|
RFX3
|
ENSG00000080298.11 | regulatory factor X3 |
|
RFX2
|
ENSG00000087903.8 | regulatory factor X2 |
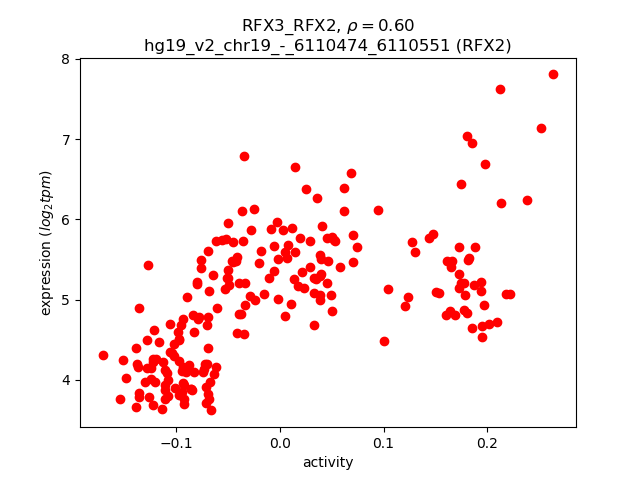
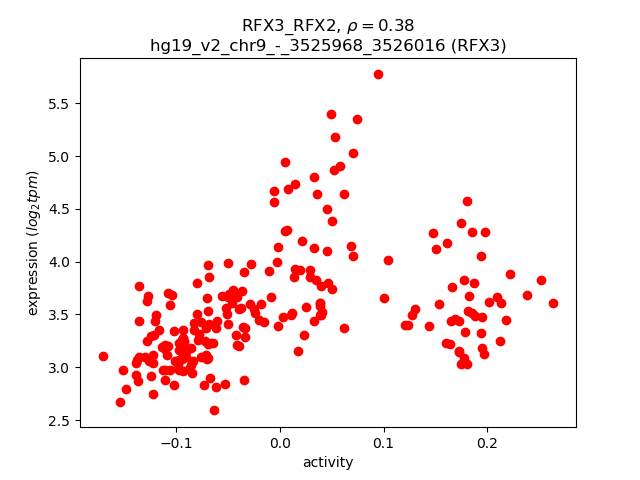
Activity-expression correlation:
| Gene | Promoter | Pearson corr. coef. | P-value | Plot |
|---|---|---|---|---|
| RFX2 | hg19_v2_chr19_-_6110474_6110551 | 0.60 | 1.8e-22 | Click! |
| RFX3 | hg19_v2_chr9_-_3525968_3526016 | 0.38 | 5.3e-09 | Click! |
Activity profile of RFX3_RFX2 motif
Sorted Z-values of RFX3_RFX2 motif
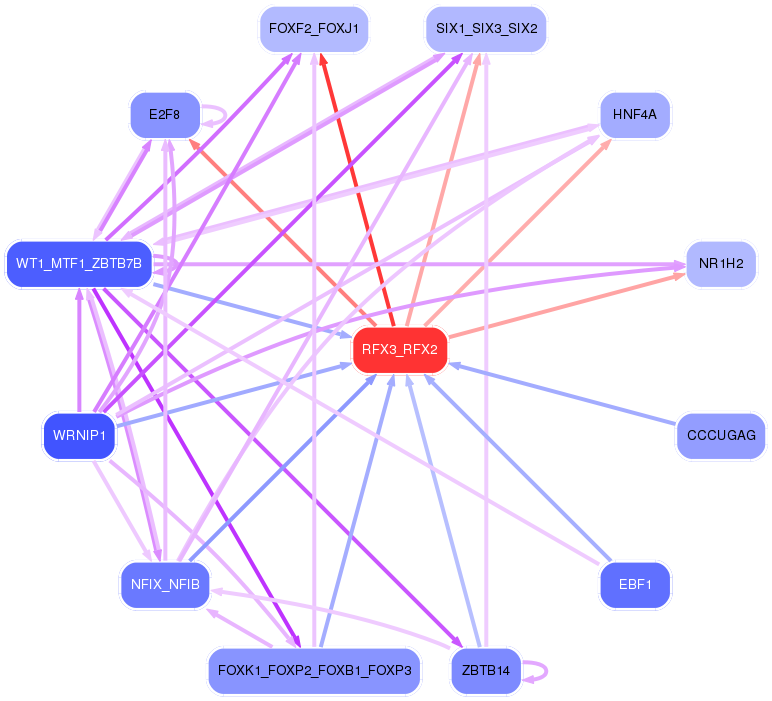
Network of associatons between targets according to the STRING database.

First level regulatory network of RFX3_RFX2
Gene Ontology Analysis
Gene overrepresentation in biological_process category:
| Log-likelihood per target | Total log-likelihood | Term | Description |
|---|---|---|---|
| 32.1 | 192.4 | GO:0010732 | protein glutathionylation(GO:0010731) regulation of protein glutathionylation(GO:0010732) negative regulation of protein glutathionylation(GO:0010734) |
| 29.0 | 116.2 | GO:0061528 | negative regulation of gamma-aminobutyric acid secretion(GO:0014053) aspartate secretion(GO:0061528) regulation of aspartate secretion(GO:1904448) positive regulation of aspartate secretion(GO:1904450) |
| 24.2 | 72.7 | GO:1902490 | regulation of sperm capacitation(GO:1902490) |
| 17.7 | 159.1 | GO:0002318 | myeloid progenitor cell differentiation(GO:0002318) |
| 17.0 | 51.1 | GO:1903033 | regulation of microtubule plus-end binding(GO:1903031) positive regulation of microtubule plus-end binding(GO:1903033) |
| 16.5 | 49.4 | GO:0036371 | protein localization to M-band(GO:0036309) protein localization to T-tubule(GO:0036371) |
| 16.3 | 49.0 | GO:1903697 | negative regulation of microvillus assembly(GO:1903697) |
| 13.4 | 40.3 | GO:0002661 | B cell tolerance induction(GO:0002514) regulation of B cell tolerance induction(GO:0002661) positive regulation of B cell tolerance induction(GO:0002663) |
| 11.6 | 69.8 | GO:0070560 | protein secretion by platelet(GO:0070560) |
| 11.1 | 122.2 | GO:0036159 | inner dynein arm assembly(GO:0036159) |
| 10.9 | 98.3 | GO:1903912 | negative regulation of endoplasmic reticulum stress-induced eIF2 alpha phosphorylation(GO:1903912) |
| 10.4 | 72.5 | GO:0034316 | negative regulation of Arp2/3 complex-mediated actin nucleation(GO:0034316) |
| 10.3 | 82.1 | GO:0007258 | JUN phosphorylation(GO:0007258) |
| 9.7 | 38.9 | GO:1904491 | protein localization to ciliary transition zone(GO:1904491) |
| 9.6 | 38.3 | GO:0018094 | protein polyglycylation(GO:0018094) |
| 9.5 | 37.8 | GO:0070426 | positive regulation of nucleotide-binding oligomerization domain containing signaling pathway(GO:0070426) positive regulation of nucleotide-binding oligomerization domain containing 2 signaling pathway(GO:0070434) |
| 9.4 | 28.2 | GO:1900220 | semaphorin-plexin signaling pathway involved in bone trabecula morphogenesis(GO:1900220) |
| 9.3 | 55.5 | GO:0060294 | cilium movement involved in cell motility(GO:0060294) |
| 9.1 | 27.2 | GO:0006420 | arginyl-tRNA aminoacylation(GO:0006420) |
| 8.6 | 25.8 | GO:0050760 | negative regulation of thymidylate synthase biosynthetic process(GO:0050760) |
| 8.4 | 50.6 | GO:0051013 | microtubule severing(GO:0051013) |
| 8.4 | 42.0 | GO:2001106 | regulation of Rho guanyl-nucleotide exchange factor activity(GO:2001106) |
| 8.3 | 33.4 | GO:0001757 | somite specification(GO:0001757) |
| 8.2 | 147.1 | GO:0044458 | motile cilium assembly(GO:0044458) |
| 8.0 | 72.1 | GO:0034454 | microtubule anchoring at centrosome(GO:0034454) |
| 7.8 | 31.2 | GO:0042271 | susceptibility to natural killer cell mediated cytotoxicity(GO:0042271) |
| 7.4 | 36.8 | GO:0006398 | mRNA 3'-end processing by stem-loop binding and cleavage(GO:0006398) |
| 7.2 | 28.8 | GO:0042357 | thiamine diphosphate metabolic process(GO:0042357) |
| 7.2 | 21.5 | GO:0035359 | negative regulation of peroxisome proliferator activated receptor signaling pathway(GO:0035359) |
| 7.0 | 21.0 | GO:0050902 | leukocyte adhesive activation(GO:0050902) |
| 7.0 | 27.8 | GO:0044375 | regulation of peroxisome size(GO:0044375) |
| 6.9 | 6.9 | GO:0036466 | synaptic vesicle recycling via endosome(GO:0036466) |
| 6.8 | 68.2 | GO:0018026 | peptidyl-lysine monomethylation(GO:0018026) |
| 6.7 | 33.3 | GO:1904100 | regulation of protein O-linked glycosylation(GO:1904098) positive regulation of protein O-linked glycosylation(GO:1904100) |
| 6.6 | 132.3 | GO:0002021 | response to dietary excess(GO:0002021) |
| 6.0 | 18.0 | GO:1903348 | positive regulation of bicellular tight junction assembly(GO:1903348) |
| 5.8 | 23.4 | GO:0090038 | negative regulation of protein kinase C signaling(GO:0090038) |
| 5.8 | 23.1 | GO:1900425 | negative regulation of defense response to bacterium(GO:1900425) |
| 5.7 | 40.0 | GO:0007288 | sperm axoneme assembly(GO:0007288) |
| 5.6 | 128.2 | GO:0034389 | lipid particle organization(GO:0034389) |
| 5.4 | 16.3 | GO:0071988 | regulation of spindle elongation(GO:0032887) regulation of mitotic spindle elongation(GO:0032888) anastral spindle assembly(GO:0055048) protein localization to spindle pole body(GO:0071988) regulation of protein localization to spindle pole body(GO:1902363) positive regulation of protein localization to spindle pole body(GO:1902365) positive regulation of mitotic spindle elongation(GO:1902846) |
| 5.4 | 21.7 | GO:1902261 | positive regulation of delayed rectifier potassium channel activity(GO:1902261) |
| 5.4 | 16.2 | GO:0010637 | negative regulation of mitochondrial fusion(GO:0010637) |
| 5.0 | 15.1 | GO:0071043 | CUT catabolic process(GO:0071034) CUT metabolic process(GO:0071043) |
| 4.9 | 24.7 | GO:0097338 | response to clozapine(GO:0097338) |
| 4.9 | 9.9 | GO:0021798 | forebrain dorsal/ventral pattern formation(GO:0021798) |
| 4.9 | 19.7 | GO:1903644 | regulation of chaperone-mediated protein folding(GO:1903644) |
| 4.9 | 58.7 | GO:1900028 | negative regulation of ruffle assembly(GO:1900028) |
| 4.8 | 14.5 | GO:0030860 | regulation of polarized epithelial cell differentiation(GO:0030860) |
| 4.5 | 22.6 | GO:1902775 | mitochondrial ribosome assembly(GO:0061668) mitochondrial large ribosomal subunit assembly(GO:1902775) |
| 4.5 | 153.0 | GO:0008045 | motor neuron axon guidance(GO:0008045) |
| 4.5 | 35.8 | GO:1903750 | regulation of intrinsic apoptotic signaling pathway in response to hydrogen peroxide(GO:1903750) negative regulation of intrinsic apoptotic signaling pathway in response to hydrogen peroxide(GO:1903751) |
| 4.4 | 35.4 | GO:0032790 | ribosome disassembly(GO:0032790) |
| 4.4 | 30.8 | GO:0035093 | spermatogenesis, exchange of chromosomal proteins(GO:0035093) |
| 4.3 | 13.0 | GO:0070213 | protein auto-ADP-ribosylation(GO:0070213) |
| 4.3 | 12.9 | GO:1903070 | negative regulation of ER-associated ubiquitin-dependent protein catabolic process(GO:1903070) |
| 4.2 | 33.8 | GO:0032510 | endosome to lysosome transport via multivesicular body sorting pathway(GO:0032510) |
| 4.2 | 21.1 | GO:0060718 | chorionic trophoblast cell differentiation(GO:0060718) |
| 3.9 | 31.4 | GO:0017183 | peptidyl-diphthamide metabolic process(GO:0017182) peptidyl-diphthamide biosynthetic process from peptidyl-histidine(GO:0017183) |
| 3.6 | 10.9 | GO:0090187 | positive regulation of pancreatic juice secretion(GO:0090187) |
| 3.6 | 139.7 | GO:2000300 | regulation of synaptic vesicle exocytosis(GO:2000300) |
| 3.6 | 28.5 | GO:0070475 | rRNA base methylation(GO:0070475) |
| 3.5 | 24.5 | GO:0030643 | cellular phosphate ion homeostasis(GO:0030643) cellular trivalent inorganic anion homeostasis(GO:0072502) |
| 3.4 | 78.2 | GO:0048791 | calcium ion-regulated exocytosis of neurotransmitter(GO:0048791) |
| 3.3 | 19.8 | GO:0048549 | positive regulation of pinocytosis(GO:0048549) |
| 3.2 | 22.5 | GO:0009730 | detection of carbohydrate stimulus(GO:0009730) detection of hexose stimulus(GO:0009732) detection of monosaccharide stimulus(GO:0034287) detection of glucose(GO:0051594) |
| 3.1 | 12.6 | GO:0006391 | transcription initiation from mitochondrial promoter(GO:0006391) |
| 3.1 | 34.1 | GO:0043653 | mitochondrial fragmentation involved in apoptotic process(GO:0043653) |
| 3.0 | 48.6 | GO:0045475 | locomotor rhythm(GO:0045475) |
| 2.9 | 20.5 | GO:0006572 | tyrosine catabolic process(GO:0006572) |
| 2.8 | 71.2 | GO:0006895 | Golgi to endosome transport(GO:0006895) |
| 2.8 | 8.5 | GO:1900060 | glucosylceramide biosynthetic process(GO:0006679) negative regulation of sphingolipid biosynthetic process(GO:0090155) negative regulation of ceramide biosynthetic process(GO:1900060) |
| 2.7 | 16.4 | GO:0006287 | base-excision repair, gap-filling(GO:0006287) |
| 2.7 | 65.1 | GO:0007141 | male meiosis I(GO:0007141) |
| 2.6 | 7.9 | GO:0018874 | benzoate metabolic process(GO:0018874) butyrate metabolic process(GO:0019605) |
| 2.6 | 34.0 | GO:0021942 | radial glia guided migration of Purkinje cell(GO:0021942) |
| 2.5 | 37.1 | GO:0048490 | anterograde synaptic vesicle transport(GO:0048490) synaptic vesicle cytoskeletal transport(GO:0099514) synaptic vesicle transport along microtubule(GO:0099517) |
| 2.4 | 21.9 | GO:1902412 | regulation of mitotic cytokinesis(GO:1902412) |
| 2.4 | 75.9 | GO:0097120 | receptor localization to synapse(GO:0097120) |
| 2.3 | 22.9 | GO:0060831 | smoothened signaling pathway involved in dorsal/ventral neural tube patterning(GO:0060831) |
| 2.2 | 33.5 | GO:0016024 | CDP-diacylglycerol biosynthetic process(GO:0016024) |
| 2.2 | 17.8 | GO:0035721 | intraciliary retrograde transport(GO:0035721) |
| 2.2 | 21.7 | GO:0035414 | negative regulation of catenin import into nucleus(GO:0035414) |
| 2.2 | 32.5 | GO:2000480 | negative regulation of cAMP-dependent protein kinase activity(GO:2000480) |
| 2.1 | 8.4 | GO:0008089 | anterograde axonal transport(GO:0008089) |
| 2.1 | 29.3 | GO:0071028 | nuclear RNA surveillance(GO:0071027) nuclear mRNA surveillance(GO:0071028) |
| 2.1 | 16.5 | GO:1903546 | protein localization to photoreceptor outer segment(GO:1903546) |
| 1.9 | 5.8 | GO:1901842 | negative regulation of high voltage-gated calcium channel activity(GO:1901842) |
| 1.9 | 20.9 | GO:0015886 | heme transport(GO:0015886) |
| 1.9 | 24.7 | GO:0031573 | intra-S DNA damage checkpoint(GO:0031573) |
| 1.8 | 34.2 | GO:0032012 | regulation of ARF protein signal transduction(GO:0032012) |
| 1.8 | 3.5 | GO:0071426 | ribonucleoprotein complex export from nucleus(GO:0071426) |
| 1.8 | 31.6 | GO:0001682 | tRNA 5'-leader removal(GO:0001682) |
| 1.8 | 57.9 | GO:0010738 | regulation of protein kinase A signaling(GO:0010738) |
| 1.7 | 26.0 | GO:1902857 | positive regulation of nonmotile primary cilium assembly(GO:1902857) |
| 1.7 | 13.9 | GO:1900227 | positive regulation of NLRP3 inflammasome complex assembly(GO:1900227) |
| 1.7 | 17.3 | GO:0015889 | cobalamin transport(GO:0015889) |
| 1.7 | 53.4 | GO:0000027 | ribosomal large subunit assembly(GO:0000027) |
| 1.6 | 6.5 | GO:0042360 | vitamin E metabolic process(GO:0042360) |
| 1.6 | 4.9 | GO:1904504 | positive regulation of inositol 1,4,5-trisphosphate-sensitive calcium-release channel activity(GO:0031587) regulation of lipophagy(GO:1904502) positive regulation of lipophagy(GO:1904504) |
| 1.6 | 4.9 | GO:1990523 | bone regeneration(GO:1990523) |
| 1.6 | 20.9 | GO:0033617 | mitochondrial respiratory chain complex IV assembly(GO:0033617) mitochondrial respiratory chain complex IV biogenesis(GO:0097034) |
| 1.6 | 23.8 | GO:0034315 | regulation of Arp2/3 complex-mediated actin nucleation(GO:0034315) |
| 1.5 | 38.2 | GO:0048665 | neuron fate specification(GO:0048665) |
| 1.5 | 3.0 | GO:0098917 | retrograde trans-synaptic signaling(GO:0098917) |
| 1.5 | 94.6 | GO:0060997 | dendritic spine morphogenesis(GO:0060997) |
| 1.4 | 5.7 | GO:1901895 | negative regulation of calcium-transporting ATPase activity(GO:1901895) |
| 1.4 | 8.4 | GO:0008626 | granzyme-mediated apoptotic signaling pathway(GO:0008626) |
| 1.4 | 5.6 | GO:0009298 | GDP-mannose biosynthetic process(GO:0009298) |
| 1.4 | 10.9 | GO:0070995 | NADPH oxidation(GO:0070995) |
| 1.4 | 52.7 | GO:0043001 | Golgi to plasma membrane protein transport(GO:0043001) |
| 1.3 | 15.5 | GO:0061051 | positive regulation of cell growth involved in cardiac muscle cell development(GO:0061051) |
| 1.3 | 12.7 | GO:0006685 | sphingomyelin catabolic process(GO:0006685) |
| 1.3 | 16.4 | GO:0032516 | positive regulation of phosphoprotein phosphatase activity(GO:0032516) |
| 1.2 | 55.7 | GO:0043268 | positive regulation of potassium ion transport(GO:0043268) |
| 1.2 | 18.8 | GO:0021692 | cerebellar Purkinje cell layer morphogenesis(GO:0021692) |
| 1.2 | 3.5 | GO:0000294 | nuclear-transcribed mRNA catabolic process, endonucleolytic cleavage-dependent decay(GO:0000294) negative regulation by host of viral genome replication(GO:0044828) |
| 1.1 | 10.3 | GO:0048672 | positive regulation of collateral sprouting(GO:0048672) |
| 1.1 | 57.5 | GO:0071480 | cellular response to gamma radiation(GO:0071480) |
| 1.1 | 10.0 | GO:0061302 | smooth muscle cell-matrix adhesion(GO:0061302) |
| 1.1 | 21.0 | GO:0042340 | keratan sulfate catabolic process(GO:0042340) |
| 1.1 | 31.8 | GO:0016601 | Rac protein signal transduction(GO:0016601) |
| 1.1 | 4.3 | GO:2000232 | regulation of ribosome biogenesis(GO:0090069) regulation of rRNA processing(GO:2000232) |
| 1.1 | 8.5 | GO:2000189 | positive regulation of cholesterol homeostasis(GO:2000189) |
| 1.0 | 3.1 | GO:2000282 | regulation of cellular amine catabolic process(GO:0033241) negative regulation of cellular amine catabolic process(GO:0033242) negative regulation of adrenergic receptor signaling pathway(GO:0071878) negative regulation of the force of heart contraction(GO:0098736) regulation of arginine catabolic process(GO:1900081) negative regulation of arginine catabolic process(GO:1900082) regulation of adrenergic receptor signaling pathway involved in heart process(GO:1901204) negative regulation of adrenergic receptor signaling pathway involved in heart process(GO:1901205) regulation of citrulline biosynthetic process(GO:1903248) negative regulation of citrulline biosynthetic process(GO:1903249) regulation of cellular amino acid biosynthetic process(GO:2000282) negative regulation of cellular amino acid biosynthetic process(GO:2000283) |
| 1.0 | 33.0 | GO:0007340 | acrosome reaction(GO:0007340) |
| 1.0 | 60.3 | GO:0017156 | calcium ion regulated exocytosis(GO:0017156) |
| 1.0 | 16.1 | GO:0034656 | nucleobase-containing small molecule catabolic process(GO:0034656) |
| 1.0 | 21.5 | GO:0035024 | negative regulation of Rho protein signal transduction(GO:0035024) |
| 0.9 | 52.7 | GO:0002437 | inflammatory response to antigenic stimulus(GO:0002437) |
| 0.9 | 24.4 | GO:2001275 | positive regulation of glucose import in response to insulin stimulus(GO:2001275) |
| 0.9 | 15.0 | GO:0035970 | peptidyl-threonine dephosphorylation(GO:0035970) |
| 0.9 | 17.4 | GO:1901663 | ubiquinone biosynthetic process(GO:0006744) quinone biosynthetic process(GO:1901663) |
| 0.9 | 47.9 | GO:0007212 | dopamine receptor signaling pathway(GO:0007212) |
| 0.9 | 9.9 | GO:0003298 | physiological muscle hypertrophy(GO:0003298) physiological cardiac muscle hypertrophy(GO:0003301) cell growth involved in cardiac muscle cell development(GO:0061049) |
| 0.9 | 0.9 | GO:0032423 | regulation of mismatch repair(GO:0032423) positive regulation of mismatch repair(GO:0032425) |
| 0.9 | 46.7 | GO:2000649 | regulation of sodium ion transmembrane transporter activity(GO:2000649) |
| 0.9 | 50.5 | GO:0009060 | aerobic respiration(GO:0009060) |
| 0.8 | 33.5 | GO:0007274 | neuromuscular synaptic transmission(GO:0007274) |
| 0.8 | 30.8 | GO:0008038 | neuron recognition(GO:0008038) |
| 0.8 | 58.5 | GO:0031338 | regulation of vesicle fusion(GO:0031338) |
| 0.8 | 2.4 | GO:0060278 | regulation of ovulation(GO:0060278) positive regulation of ovulation(GO:0060279) |
| 0.8 | 22.2 | GO:0006904 | vesicle docking involved in exocytosis(GO:0006904) |
| 0.8 | 9.8 | GO:0006359 | regulation of transcription from RNA polymerase III promoter(GO:0006359) |
| 0.7 | 9.6 | GO:0006002 | fructose 6-phosphate metabolic process(GO:0006002) |
| 0.7 | 13.2 | GO:0050775 | positive regulation of dendrite morphogenesis(GO:0050775) |
| 0.7 | 56.1 | GO:0033275 | muscle filament sliding(GO:0030049) actin-myosin filament sliding(GO:0033275) |
| 0.7 | 18.7 | GO:0045662 | negative regulation of myoblast differentiation(GO:0045662) |
| 0.7 | 10.8 | GO:0006004 | fucose metabolic process(GO:0006004) |
| 0.7 | 73.1 | GO:0007224 | smoothened signaling pathway(GO:0007224) |
| 0.6 | 18.2 | GO:0007062 | sister chromatid cohesion(GO:0007062) |
| 0.6 | 35.6 | GO:0032570 | response to progesterone(GO:0032570) |
| 0.6 | 4.2 | GO:0000290 | deadenylation-dependent decapping of nuclear-transcribed mRNA(GO:0000290) positive regulation of cytoplasmic mRNA processing body assembly(GO:0010606) |
| 0.6 | 5.9 | GO:0060267 | positive regulation of respiratory burst(GO:0060267) |
| 0.6 | 51.3 | GO:0036498 | IRE1-mediated unfolded protein response(GO:0036498) |
| 0.6 | 1.7 | GO:0046947 | hydroxylysine metabolic process(GO:0046946) hydroxylysine biosynthetic process(GO:0046947) |
| 0.5 | 14.2 | GO:0090083 | regulation of inclusion body assembly(GO:0090083) |
| 0.5 | 3.4 | GO:0045007 | depurination(GO:0045007) |
| 0.5 | 8.6 | GO:0006704 | glucocorticoid biosynthetic process(GO:0006704) |
| 0.5 | 12.9 | GO:0048147 | negative regulation of fibroblast proliferation(GO:0048147) |
| 0.5 | 3.7 | GO:0045198 | establishment of epithelial cell apical/basal polarity(GO:0045198) |
| 0.5 | 1.8 | GO:1902613 | regulation of anti-Mullerian hormone signaling pathway(GO:1902612) negative regulation of anti-Mullerian hormone signaling pathway(GO:1902613) anti-Mullerian hormone signaling pathway(GO:1990262) |
| 0.5 | 41.0 | GO:0005977 | glycogen metabolic process(GO:0005977) |
| 0.5 | 12.7 | GO:0003091 | renal water homeostasis(GO:0003091) |
| 0.5 | 5.9 | GO:0070935 | 3'-UTR-mediated mRNA stabilization(GO:0070935) |
| 0.4 | 23.3 | GO:0016574 | histone ubiquitination(GO:0016574) |
| 0.4 | 7.9 | GO:2000171 | negative regulation of dendrite development(GO:2000171) |
| 0.4 | 10.7 | GO:0007520 | myoblast fusion(GO:0007520) |
| 0.4 | 22.0 | GO:0045646 | regulation of erythrocyte differentiation(GO:0045646) |
| 0.4 | 14.0 | GO:0022400 | regulation of rhodopsin mediated signaling pathway(GO:0022400) |
| 0.4 | 6.7 | GO:0042276 | error-prone translesion synthesis(GO:0042276) |
| 0.4 | 1.5 | GO:0006627 | protein processing involved in protein targeting to mitochondrion(GO:0006627) |
| 0.4 | 2.5 | GO:0009597 | detection of virus(GO:0009597) |
| 0.4 | 3.2 | GO:0010571 | positive regulation of nuclear cell cycle DNA replication(GO:0010571) |
| 0.4 | 7.1 | GO:0016254 | preassembly of GPI anchor in ER membrane(GO:0016254) |
| 0.3 | 15.0 | GO:0060996 | dendritic spine development(GO:0060996) |
| 0.3 | 3.4 | GO:0034723 | DNA replication-dependent nucleosome assembly(GO:0006335) DNA replication-dependent nucleosome organization(GO:0034723) |
| 0.3 | 4.4 | GO:0043523 | regulation of neuron apoptotic process(GO:0043523) |
| 0.3 | 1.7 | GO:2001013 | epithelial cell proliferation involved in renal tubule morphogenesis(GO:2001013) |
| 0.3 | 1.0 | GO:0031914 | negative regulation of synaptic plasticity(GO:0031914) |
| 0.3 | 5.9 | GO:0003341 | cilium movement(GO:0003341) |
| 0.3 | 28.0 | GO:1903955 | positive regulation of protein targeting to mitochondrion(GO:1903955) |
| 0.3 | 9.3 | GO:0010107 | potassium ion import(GO:0010107) |
| 0.3 | 5.7 | GO:0001975 | response to amphetamine(GO:0001975) |
| 0.3 | 18.4 | GO:0045453 | bone resorption(GO:0045453) |
| 0.3 | 133.5 | GO:0048232 | spermatogenesis(GO:0007283) male gamete generation(GO:0048232) |
| 0.3 | 7.3 | GO:0051865 | protein autoubiquitination(GO:0051865) |
| 0.3 | 7.7 | GO:0050919 | negative chemotaxis(GO:0050919) |
| 0.3 | 11.4 | GO:0006986 | response to unfolded protein(GO:0006986) |
| 0.3 | 2.5 | GO:0006707 | cholesterol catabolic process(GO:0006707) sterol catabolic process(GO:0016127) |
| 0.3 | 3.6 | GO:0032526 | response to retinoic acid(GO:0032526) |
| 0.3 | 9.2 | GO:0051155 | positive regulation of striated muscle cell differentiation(GO:0051155) |
| 0.3 | 9.3 | GO:0006284 | base-excision repair(GO:0006284) |
| 0.3 | 25.7 | GO:0022900 | electron transport chain(GO:0022900) |
| 0.2 | 73.2 | GO:0051056 | regulation of small GTPase mediated signal transduction(GO:0051056) |
| 0.2 | 29.5 | GO:0006661 | phosphatidylinositol biosynthetic process(GO:0006661) |
| 0.2 | 0.8 | GO:0034599 | cellular response to oxidative stress(GO:0034599) |
| 0.2 | 7.6 | GO:0014047 | glutamate secretion(GO:0014047) |
| 0.2 | 6.3 | GO:0019228 | neuronal action potential(GO:0019228) |
| 0.2 | 2.0 | GO:0032968 | positive regulation of transcription elongation from RNA polymerase II promoter(GO:0032968) |
| 0.2 | 17.7 | GO:0008277 | regulation of G-protein coupled receptor protein signaling pathway(GO:0008277) |
| 0.2 | 11.1 | GO:0046785 | microtubule polymerization(GO:0046785) |
| 0.2 | 1.9 | GO:0098789 | pre-mRNA cleavage required for polyadenylation(GO:0098789) |
| 0.2 | 14.2 | GO:0002456 | T cell mediated immunity(GO:0002456) |
| 0.2 | 1.6 | GO:0045454 | cell redox homeostasis(GO:0045454) |
| 0.2 | 3.4 | GO:1901661 | quinone metabolic process(GO:1901661) |
| 0.2 | 2.0 | GO:0006379 | mRNA cleavage(GO:0006379) |
| 0.2 | 1.4 | GO:0002098 | tRNA wobble uridine modification(GO:0002098) |
| 0.1 | 9.6 | GO:0007156 | homophilic cell adhesion via plasma membrane adhesion molecules(GO:0007156) |
| 0.1 | 5.3 | GO:0046426 | negative regulation of JAK-STAT cascade(GO:0046426) negative regulation of STAT cascade(GO:1904893) |
| 0.1 | 6.3 | GO:0007193 | adenylate cyclase-inhibiting G-protein coupled receptor signaling pathway(GO:0007193) |
| 0.1 | 0.6 | GO:0098700 | neurotransmitter loading into synaptic vesicle(GO:0098700) |
| 0.1 | 22.0 | GO:0007411 | axon guidance(GO:0007411) |
| 0.1 | 13.4 | GO:0016579 | protein deubiquitination(GO:0016579) |
| 0.1 | 2.2 | GO:0000910 | cytokinesis(GO:0000910) |
| 0.0 | 0.4 | GO:0022029 | cerebral cortex cell migration(GO:0021795) telencephalon cell migration(GO:0022029) |
| 0.0 | 13.2 | GO:0043547 | positive regulation of GTPase activity(GO:0043547) |
| 0.0 | 1.0 | GO:0000188 | inactivation of MAPK activity(GO:0000188) |
| 0.0 | 2.1 | GO:0006970 | response to osmotic stress(GO:0006970) |
| 0.0 | 1.4 | GO:0010977 | negative regulation of neuron projection development(GO:0010977) |
| 0.0 | 2.6 | GO:0007416 | synapse assembly(GO:0007416) |
| 0.0 | 0.6 | GO:0060135 | maternal process involved in female pregnancy(GO:0060135) |
| 0.0 | 4.9 | GO:0030335 | positive regulation of cell migration(GO:0030335) |
| 0.0 | 2.6 | GO:0008285 | negative regulation of cell proliferation(GO:0008285) |
| 0.0 | 7.6 | GO:0007186 | G-protein coupled receptor signaling pathway(GO:0007186) |
| 0.0 | 3.9 | GO:0045860 | positive regulation of protein kinase activity(GO:0045860) |
Gene overrepresentation in cellular_component category:
| Log-likelihood per target | Total log-likelihood | Term | Description |
|---|---|---|---|
| 30.7 | 122.7 | GO:0097224 | sperm connecting piece(GO:0097224) |
| 29.0 | 116.2 | GO:0032144 | 4-aminobutyrate transaminase complex(GO:0032144) |
| 19.9 | 19.9 | GO:0002199 | zona pellucida receptor complex(GO:0002199) |
| 14.7 | 59.0 | GO:0016939 | kinesin II complex(GO:0016939) |
| 13.0 | 65.1 | GO:0097123 | cyclin A1-CDK2 complex(GO:0097123) |
| 12.1 | 144.7 | GO:0033010 | paranodal junction(GO:0033010) |
| 11.9 | 71.2 | GO:0000138 | Golgi trans cisterna(GO:0000138) |
| 11.4 | 68.7 | GO:0002177 | manchette(GO:0002177) |
| 11.4 | 34.1 | GO:0044609 | DBIRD complex(GO:0044609) |
| 11.3 | 67.6 | GO:1990769 | proximal neuron projection(GO:1990769) |
| 9.6 | 192.4 | GO:0005890 | sodium:potassium-exchanging ATPase complex(GO:0005890) |
| 7.1 | 35.6 | GO:0036128 | CatSper complex(GO:0036128) |
| 6.7 | 46.9 | GO:0001520 | outer dense fiber(GO:0001520) |
| 6.3 | 75.9 | GO:0060077 | inhibitory synapse(GO:0060077) |
| 5.9 | 52.8 | GO:0034464 | BBSome(GO:0034464) |
| 5.7 | 39.6 | GO:0005854 | nascent polypeptide-associated complex(GO:0005854) |
| 5.5 | 77.2 | GO:0036038 | MKS complex(GO:0036038) |
| 5.4 | 65.4 | GO:0035869 | ciliary transition zone(GO:0035869) |
| 5.4 | 16.3 | GO:0055028 | cortical microtubule(GO:0055028) mitotic spindle astral microtubule(GO:0061673) |
| 4.9 | 83.0 | GO:0000164 | protein phosphatase type 1 complex(GO:0000164) |
| 4.4 | 21.9 | GO:0000235 | astral microtubule(GO:0000235) aster(GO:0005818) |
| 4.2 | 33.4 | GO:0044294 | dendritic growth cone(GO:0044294) |
| 4.0 | 19.8 | GO:0044352 | pinosome(GO:0044352) macropinosome(GO:0044354) |
| 3.9 | 65.7 | GO:0031095 | platelet dense tubular network membrane(GO:0031095) |
| 3.9 | 54.0 | GO:0035102 | PRC1 complex(GO:0035102) |
| 3.8 | 80.6 | GO:0034451 | centriolar satellite(GO:0034451) |
| 3.8 | 72.7 | GO:0097225 | sperm midpiece(GO:0097225) |
| 3.7 | 25.8 | GO:0097427 | microtubule bundle(GO:0097427) |
| 3.3 | 177.8 | GO:0016235 | aggresome(GO:0016235) |
| 3.2 | 31.6 | GO:0005655 | nucleolar ribonuclease P complex(GO:0005655) |
| 3.1 | 21.7 | GO:0014701 | junctional sarcoplasmic reticulum membrane(GO:0014701) |
| 3.1 | 33.6 | GO:0097431 | mitotic spindle pole(GO:0097431) |
| 3.0 | 56.1 | GO:0005862 | muscle thin filament tropomyosin(GO:0005862) |
| 2.9 | 25.8 | GO:1990812 | growth cone lamellipodium(GO:1990761) growth cone filopodium(GO:1990812) |
| 2.8 | 25.2 | GO:0032797 | SMN complex(GO:0032797) |
| 2.7 | 10.9 | GO:1990031 | pinceau fiber(GO:1990031) |
| 2.7 | 72.1 | GO:0035371 | microtubule plus-end(GO:0035371) |
| 2.7 | 31.8 | GO:0032045 | guanyl-nucleotide exchange factor complex(GO:0032045) |
| 2.6 | 21.0 | GO:0030992 | intraciliary transport particle B(GO:0030992) |
| 2.6 | 216.0 | GO:0097014 | axoneme(GO:0005930) ciliary plasm(GO:0097014) |
| 2.6 | 12.9 | GO:0070847 | core mediator complex(GO:0070847) |
| 2.6 | 28.2 | GO:0002116 | semaphorin receptor complex(GO:0002116) |
| 2.5 | 12.7 | GO:0000137 | Golgi cis cisterna(GO:0000137) |
| 2.1 | 25.7 | GO:0043190 | ATP-binding cassette (ABC) transporter complex(GO:0043190) |
| 1.8 | 21.7 | GO:0016342 | catenin complex(GO:0016342) |
| 1.5 | 10.8 | GO:0000120 | RNA polymerase I transcription factor complex(GO:0000120) |
| 1.5 | 90.8 | GO:0036064 | ciliary basal body(GO:0036064) |
| 1.4 | 18.1 | GO:0008091 | spectrin(GO:0008091) |
| 1.4 | 4.2 | GO:0031251 | PAN complex(GO:0031251) |
| 1.4 | 15.1 | GO:0000176 | nuclear exosome (RNase complex)(GO:0000176) |
| 1.3 | 13.3 | GO:0032391 | photoreceptor connecting cilium(GO:0032391) |
| 1.3 | 10.5 | GO:0033018 | sarcoplasmic reticulum lumen(GO:0033018) |
| 1.2 | 13.6 | GO:0035686 | sperm fibrous sheath(GO:0035686) |
| 1.2 | 24.4 | GO:0005942 | phosphatidylinositol 3-kinase complex(GO:0005942) |
| 1.1 | 97.7 | GO:0001669 | acrosomal vesicle(GO:0001669) |
| 1.1 | 27.8 | GO:0031231 | integral component of peroxisomal membrane(GO:0005779) intrinsic component of peroxisomal membrane(GO:0031231) |
| 1.0 | 49.4 | GO:0043034 | costamere(GO:0043034) |
| 1.0 | 24.2 | GO:0097546 | ciliary base(GO:0097546) |
| 0.9 | 35.1 | GO:1904115 | axon cytoplasm(GO:1904115) |
| 0.8 | 58.7 | GO:0043195 | terminal bouton(GO:0043195) |
| 0.7 | 16.2 | GO:0031307 | integral component of mitochondrial outer membrane(GO:0031307) |
| 0.7 | 47.6 | GO:0097610 | cleavage furrow(GO:0032154) cell surface furrow(GO:0097610) |
| 0.7 | 20.4 | GO:0016581 | NuRD complex(GO:0016581) CHD-type complex(GO:0090545) |
| 0.7 | 2.0 | GO:0005674 | transcription factor TFIIF complex(GO:0005674) |
| 0.7 | 67.2 | GO:0005913 | cell-cell adherens junction(GO:0005913) |
| 0.6 | 35.2 | GO:0009295 | nucleoid(GO:0009295) mitochondrial nucleoid(GO:0042645) |
| 0.6 | 16.4 | GO:0055038 | recycling endosome membrane(GO:0055038) |
| 0.6 | 8.5 | GO:0031588 | nucleotide-activated protein kinase complex(GO:0031588) |
| 0.6 | 3.5 | GO:0042406 | extrinsic component of endoplasmic reticulum membrane(GO:0042406) |
| 0.5 | 45.2 | GO:0032587 | ruffle membrane(GO:0032587) |
| 0.5 | 37.5 | GO:0031463 | Cul3-RING ubiquitin ligase complex(GO:0031463) |
| 0.5 | 2.5 | GO:0005945 | 6-phosphofructokinase complex(GO:0005945) |
| 0.5 | 3.0 | GO:0043196 | varicosity(GO:0043196) |
| 0.5 | 174.2 | GO:0005874 | microtubule(GO:0005874) |
| 0.5 | 66.5 | GO:0031901 | early endosome membrane(GO:0031901) |
| 0.5 | 23.4 | GO:0005801 | cis-Golgi network(GO:0005801) |
| 0.5 | 24.1 | GO:0005814 | centriole(GO:0005814) |
| 0.5 | 71.4 | GO:0030176 | integral component of endoplasmic reticulum membrane(GO:0030176) |
| 0.5 | 88.9 | GO:0005802 | trans-Golgi network(GO:0005802) |
| 0.5 | 56.8 | GO:0043204 | perikaryon(GO:0043204) |
| 0.4 | 3.1 | GO:0097228 | sperm principal piece(GO:0097228) |
| 0.3 | 85.6 | GO:0005938 | cell cortex(GO:0005938) |
| 0.3 | 20.8 | GO:0005811 | lipid particle(GO:0005811) |
| 0.3 | 7.6 | GO:0048786 | presynaptic active zone(GO:0048786) |
| 0.3 | 38.5 | GO:0031234 | extrinsic component of cytoplasmic side of plasma membrane(GO:0031234) |
| 0.3 | 7.5 | GO:0048770 | melanosome(GO:0042470) pigment granule(GO:0048770) |
| 0.3 | 40.3 | GO:0001650 | fibrillar center(GO:0001650) |
| 0.3 | 17.3 | GO:0005776 | autophagosome(GO:0005776) |
| 0.3 | 4.4 | GO:0031011 | Ino80 complex(GO:0031011) DNA helicase complex(GO:0033202) |
| 0.3 | 24.1 | GO:0030027 | lamellipodium(GO:0030027) |
| 0.3 | 27.8 | GO:0008021 | synaptic vesicle(GO:0008021) |
| 0.3 | 3.5 | GO:0044613 | nuclear pore central transport channel(GO:0044613) |
| 0.2 | 1.9 | GO:0005847 | mRNA cleavage and polyadenylation specificity factor complex(GO:0005847) |
| 0.2 | 26.7 | GO:0005796 | Golgi lumen(GO:0005796) |
| 0.2 | 16.7 | GO:0000922 | spindle pole(GO:0000922) |
| 0.2 | 18.3 | GO:0031902 | late endosome membrane(GO:0031902) |
| 0.2 | 30.8 | GO:0031225 | anchored component of membrane(GO:0031225) |
| 0.2 | 4.9 | GO:0005921 | gap junction(GO:0005921) |
| 0.2 | 1.0 | GO:0031314 | extrinsic component of mitochondrial inner membrane(GO:0031314) |
| 0.2 | 9.0 | GO:0001726 | ruffle(GO:0001726) |
| 0.2 | 126.6 | GO:0043005 | neuron projection(GO:0043005) |
| 0.2 | 1.4 | GO:0033588 | Elongator holoenzyme complex(GO:0033588) |
| 0.1 | 22.4 | GO:0030055 | cell-substrate adherens junction(GO:0005924) focal adhesion(GO:0005925) cell-substrate junction(GO:0030055) |
| 0.1 | 2.0 | GO:0005665 | DNA-directed RNA polymerase II, core complex(GO:0005665) |
| 0.1 | 5.3 | GO:0005903 | brush border(GO:0005903) |
| 0.1 | 1.4 | GO:0005771 | multivesicular body(GO:0005771) |
| 0.1 | 7.0 | GO:0042579 | peroxisome(GO:0005777) microbody(GO:0042579) |
| 0.1 | 6.2 | GO:0031461 | cullin-RING ubiquitin ligase complex(GO:0031461) |
| 0.0 | 3.3 | GO:0005882 | intermediate filament(GO:0005882) |
| 0.0 | 3.7 | GO:0043202 | lysosomal lumen(GO:0043202) |
| 0.0 | 1.1 | GO:1902562 | NuA4 histone acetyltransferase complex(GO:0035267) H4/H2A histone acetyltransferase complex(GO:0043189) H4 histone acetyltransferase complex(GO:1902562) |
| 0.0 | 1.8 | GO:0034705 | voltage-gated potassium channel complex(GO:0008076) potassium channel complex(GO:0034705) |
| 0.0 | 0.7 | GO:0016324 | apical plasma membrane(GO:0016324) |
| 0.0 | 2.3 | GO:0005789 | endoplasmic reticulum membrane(GO:0005789) |
Gene overrepresentation in molecular_function category:
| Log-likelihood per target | Total log-likelihood | Term | Description |
|---|---|---|---|
| 29.0 | 116.2 | GO:0003867 | 4-aminobutyrate transaminase activity(GO:0003867) succinate-semialdehyde dehydrogenase binding(GO:0032145) (S)-3-amino-2-methylpropionate transaminase activity(GO:0047298) |
| 13.7 | 82.1 | GO:0004705 | JUN kinase activity(GO:0004705) SAP kinase activity(GO:0016909) |
| 13.4 | 40.3 | GO:0008321 | Ral guanyl-nucleotide exchange factor activity(GO:0008321) |
| 10.2 | 122.7 | GO:0032027 | myosin light chain binding(GO:0032027) |
| 9.8 | 29.3 | GO:0034353 | RNA pyrophosphohydrolase activity(GO:0034353) |
| 9.6 | 38.3 | GO:0070735 | protein-glycine ligase activity(GO:0070735) |
| 9.5 | 28.5 | GO:0016434 | rRNA (cytosine) methyltransferase activity(GO:0016434) |
| 9.1 | 27.2 | GO:0004814 | arginine-tRNA ligase activity(GO:0004814) |
| 9.1 | 72.5 | GO:0071933 | Arp2/3 complex binding(GO:0071933) |
| 8.8 | 26.4 | GO:0015439 | heme-transporting ATPase activity(GO:0015439) |
| 8.4 | 50.6 | GO:0008568 | microtubule-severing ATPase activity(GO:0008568) |
| 7.7 | 30.8 | GO:0061628 | H3K27me3 modified histone binding(GO:0061628) |
| 6.1 | 24.5 | GO:0015562 | efflux transmembrane transporter activity(GO:0015562) |
| 6.1 | 30.6 | GO:0070740 | tubulin-glutamic acid ligase activity(GO:0070740) |
| 6.1 | 139.7 | GO:0070008 | serine-type exopeptidase activity(GO:0070008) |
| 5.8 | 17.3 | GO:0015235 | cobalamin transporter activity(GO:0015235) |
| 5.6 | 33.3 | GO:0004169 | dolichyl-phosphate-mannose-protein mannosyltransferase activity(GO:0004169) |
| 5.3 | 47.9 | GO:0032051 | clathrin light chain binding(GO:0032051) |
| 4.7 | 19.0 | GO:0022865 | transmembrane electron transfer carrier(GO:0022865) |
| 4.6 | 18.4 | GO:0035473 | lipase binding(GO:0035473) |
| 4.4 | 242.2 | GO:0017080 | sodium channel regulator activity(GO:0017080) |
| 4.3 | 86.3 | GO:0045504 | dynein heavy chain binding(GO:0045504) |
| 4.3 | 12.9 | GO:1904288 | BAT3 complex binding(GO:1904288) |
| 4.2 | 12.7 | GO:0004382 | guanosine-diphosphatase activity(GO:0004382) |
| 4.1 | 32.7 | GO:0004865 | protein serine/threonine phosphatase inhibitor activity(GO:0004865) |
| 4.0 | 23.7 | GO:0005119 | smoothened binding(GO:0005119) |
| 3.9 | 19.6 | GO:0036312 | phosphatidylinositol 3-kinase regulatory subunit binding(GO:0036312) |
| 3.5 | 165.6 | GO:0030507 | spectrin binding(GO:0030507) |
| 3.2 | 12.7 | GO:0008158 | hedgehog receptor activity(GO:0008158) |
| 3.1 | 15.5 | GO:0050815 | phosphoserine binding(GO:0050815) |
| 3.0 | 35.8 | GO:0000774 | adenyl-nucleotide exchange factor activity(GO:0000774) |
| 2.9 | 143.6 | GO:0046875 | ephrin receptor binding(GO:0046875) |
| 2.9 | 8.6 | GO:0003845 | 11-beta-hydroxysteroid dehydrogenase [NAD(P)] activity(GO:0003845) |
| 2.8 | 8.5 | GO:0050405 | [hydroxymethylglutaryl-CoA reductase (NADPH)] kinase activity(GO:0047322) [acetyl-CoA carboxylase] kinase activity(GO:0050405) |
| 2.8 | 22.6 | GO:0034452 | dynactin binding(GO:0034452) |
| 2.8 | 22.5 | GO:0004396 | glucokinase activity(GO:0004340) hexokinase activity(GO:0004396) fructokinase activity(GO:0008865) mannokinase activity(GO:0019158) |
| 2.8 | 13.9 | GO:0004468 | lysine N-acetyltransferase activity, acting on acetyl phosphate as donor(GO:0004468) |
| 2.5 | 27.6 | GO:0004645 | phosphorylase activity(GO:0004645) |
| 2.5 | 92.0 | GO:0030552 | cAMP binding(GO:0030552) |
| 2.3 | 11.6 | GO:0070568 | guanylyltransferase activity(GO:0070568) |
| 2.3 | 62.3 | GO:0008198 | ferrous iron binding(GO:0008198) |
| 2.3 | 96.9 | GO:0003785 | actin monomer binding(GO:0003785) |
| 2.2 | 24.4 | GO:0046935 | 1-phosphatidylinositol-3-kinase regulator activity(GO:0046935) |
| 2.2 | 72.5 | GO:0070840 | dynein complex binding(GO:0070840) |
| 2.2 | 25.8 | GO:0048156 | tau protein binding(GO:0048156) |
| 2.1 | 35.4 | GO:0003746 | translation elongation factor activity(GO:0003746) |
| 2.1 | 41.1 | GO:0004862 | cAMP-dependent protein kinase inhibitor activity(GO:0004862) |
| 2.0 | 28.2 | GO:0030215 | semaphorin receptor binding(GO:0030215) |
| 2.0 | 10.0 | GO:0038062 | protein tyrosine kinase collagen receptor activity(GO:0038062) |
| 2.0 | 23.8 | GO:0070273 | phosphatidylinositol-4-phosphate binding(GO:0070273) |
| 2.0 | 31.6 | GO:0004526 | ribonuclease P activity(GO:0004526) |
| 1.8 | 10.9 | GO:0034191 | apolipoprotein A-I receptor binding(GO:0034191) |
| 1.6 | 16.4 | GO:0051575 | 5'-deoxyribose-5-phosphate lyase activity(GO:0051575) |
| 1.6 | 90.0 | GO:0043022 | ribosome binding(GO:0043022) |
| 1.5 | 33.5 | GO:0003841 | 1-acylglycerol-3-phosphate O-acyltransferase activity(GO:0003841) |
| 1.5 | 78.2 | GO:0005544 | calcium-dependent phospholipid binding(GO:0005544) |
| 1.5 | 20.6 | GO:0004691 | cAMP-dependent protein kinase activity(GO:0004691) |
| 1.4 | 35.4 | GO:0000993 | RNA polymerase II core binding(GO:0000993) |
| 1.4 | 21.7 | GO:0008179 | adenylate cyclase binding(GO:0008179) |
| 1.3 | 35.7 | GO:0001965 | G-protein alpha-subunit binding(GO:0001965) |
| 1.3 | 34.2 | GO:0005086 | ARF guanyl-nucleotide exchange factor activity(GO:0005086) |
| 1.3 | 23.6 | GO:0031418 | L-ascorbic acid binding(GO:0031418) |
| 1.3 | 82.2 | GO:0016279 | lysine N-methyltransferase activity(GO:0016278) protein-lysine N-methyltransferase activity(GO:0016279) |
| 1.3 | 21.9 | GO:0008157 | protein phosphatase 1 binding(GO:0008157) |
| 1.2 | 13.6 | GO:0043015 | gamma-tubulin binding(GO:0043015) |
| 1.2 | 21.5 | GO:0017049 | GTP-Rho binding(GO:0017049) |
| 1.2 | 9.3 | GO:0004844 | uracil DNA N-glycosylase activity(GO:0004844) deaminated base DNA N-glycosylase activity(GO:0097506) |
| 1.1 | 5.7 | GO:0016427 | tRNA (cytosine) methyltransferase activity(GO:0016427) |
| 1.1 | 124.9 | GO:0004867 | serine-type endopeptidase inhibitor activity(GO:0004867) |
| 1.1 | 114.4 | GO:0019888 | protein phosphatase regulator activity(GO:0019888) |
| 1.1 | 9.9 | GO:0001222 | transcription corepressor binding(GO:0001222) |
| 1.1 | 117.0 | GO:0008013 | beta-catenin binding(GO:0008013) |
| 1.1 | 3.2 | GO:0070984 | SET domain binding(GO:0070984) |
| 1.1 | 16.0 | GO:0017017 | MAP kinase tyrosine/serine/threonine phosphatase activity(GO:0017017) |
| 1.0 | 27.0 | GO:0032266 | phosphatidylinositol-3-phosphate binding(GO:0032266) |
| 1.0 | 37.8 | GO:0001106 | RNA polymerase II transcription corepressor activity(GO:0001106) |
| 1.0 | 16.2 | GO:0019789 | SUMO transferase activity(GO:0019789) |
| 0.9 | 18.9 | GO:0008484 | sulfuric ester hydrolase activity(GO:0008484) |
| 0.9 | 60.3 | GO:0019843 | rRNA binding(GO:0019843) |
| 0.9 | 7.9 | GO:0004321 | fatty-acyl-CoA synthase activity(GO:0004321) |
| 0.9 | 3.4 | GO:0032406 | MutLbeta complex binding(GO:0032406) MutSbeta complex binding(GO:0032408) |
| 0.8 | 15.0 | GO:0098641 | cadherin binding involved in cell-cell adhesion(GO:0098641) |
| 0.8 | 22.1 | GO:0071949 | FAD binding(GO:0071949) |
| 0.8 | 93.9 | GO:0005496 | steroid binding(GO:0005496) |
| 0.8 | 7.7 | GO:0038191 | neuropilin binding(GO:0038191) |
| 0.8 | 136.4 | GO:0005178 | integrin binding(GO:0005178) |
| 0.7 | 64.7 | GO:0030165 | PDZ domain binding(GO:0030165) |
| 0.7 | 188.1 | GO:0008017 | microtubule binding(GO:0008017) |
| 0.7 | 13.5 | GO:0030676 | Rac guanyl-nucleotide exchange factor activity(GO:0030676) |
| 0.7 | 66.0 | GO:0008307 | structural constituent of muscle(GO:0008307) |
| 0.7 | 19.4 | GO:0031434 | mitogen-activated protein kinase kinase binding(GO:0031434) |
| 0.7 | 20.5 | GO:0004602 | glutathione peroxidase activity(GO:0004602) |
| 0.7 | 6.1 | GO:0008526 | phosphatidylinositol transporter activity(GO:0008526) |
| 0.6 | 3.4 | GO:0003960 | NADPH:quinone reductase activity(GO:0003960) |
| 0.6 | 25.2 | GO:0005246 | calcium channel regulator activity(GO:0005246) |
| 0.6 | 44.8 | GO:0004843 | thiol-dependent ubiquitin-specific protease activity(GO:0004843) |
| 0.5 | 9.3 | GO:0015467 | G-protein activated inward rectifier potassium channel activity(GO:0015467) |
| 0.5 | 17.1 | GO:0003950 | NAD+ ADP-ribosyltransferase activity(GO:0003950) |
| 0.5 | 6.3 | GO:0031821 | G-protein coupled serotonin receptor binding(GO:0031821) |
| 0.5 | 2.5 | GO:0070095 | fructose-6-phosphate binding(GO:0070095) |
| 0.5 | 2.0 | GO:0019211 | phosphatase activator activity(GO:0019211) |
| 0.5 | 13.6 | GO:0051018 | protein kinase A binding(GO:0051018) |
| 0.5 | 1.8 | GO:0005026 | transforming growth factor beta receptor activity, type II(GO:0005026) |
| 0.4 | 6.9 | GO:0016864 | protein disulfide isomerase activity(GO:0003756) intramolecular oxidoreductase activity, transposing S-S bonds(GO:0016864) |
| 0.4 | 59.7 | GO:0017137 | Rab GTPase binding(GO:0017137) |
| 0.4 | 7.0 | GO:0008483 | transaminase activity(GO:0008483) |
| 0.4 | 61.9 | GO:0001078 | transcriptional repressor activity, RNA polymerase II core promoter proximal region sequence-specific binding(GO:0001078) |
| 0.4 | 10.4 | GO:0004033 | aldo-keto reductase (NADP) activity(GO:0004033) |
| 0.3 | 2.6 | GO:0032050 | clathrin heavy chain binding(GO:0032050) |
| 0.3 | 4.7 | GO:0008417 | fucosyltransferase activity(GO:0008417) |
| 0.3 | 0.9 | GO:0004698 | calcium-dependent protein kinase C activity(GO:0004698) |
| 0.3 | 40.3 | GO:0017124 | SH3 domain binding(GO:0017124) |
| 0.3 | 90.5 | GO:0003924 | GTPase activity(GO:0003924) |
| 0.3 | 3.4 | GO:0097027 | ubiquitin-protein transferase activator activity(GO:0097027) |
| 0.2 | 6.3 | GO:0015269 | calcium-activated potassium channel activity(GO:0015269) |
| 0.2 | 3.4 | GO:0016594 | glycine binding(GO:0016594) |
| 0.2 | 3.0 | GO:0047372 | acylglycerol lipase activity(GO:0047372) |
| 0.2 | 10.1 | GO:0017112 | Rab guanyl-nucleotide exchange factor activity(GO:0017112) |
| 0.2 | 8.5 | GO:0005504 | fatty acid binding(GO:0005504) |
| 0.2 | 2.5 | GO:0015194 | L-serine transmembrane transporter activity(GO:0015194) serine transmembrane transporter activity(GO:0022889) |
| 0.2 | 5.9 | GO:0017091 | AU-rich element binding(GO:0017091) |
| 0.2 | 2.3 | GO:0008190 | eukaryotic initiation factor 4E binding(GO:0008190) |
| 0.2 | 10.7 | GO:0004712 | protein serine/threonine/tyrosine kinase activity(GO:0004712) |
| 0.2 | 10.9 | GO:0004722 | protein serine/threonine phosphatase activity(GO:0004722) |
| 0.1 | 12.6 | GO:0001046 | core promoter sequence-specific DNA binding(GO:0001046) |
| 0.1 | 9.0 | GO:0005089 | Rho guanyl-nucleotide exchange factor activity(GO:0005089) |
| 0.1 | 12.8 | GO:0003725 | double-stranded RNA binding(GO:0003725) |
| 0.1 | 5.4 | GO:0048306 | calcium-dependent protein binding(GO:0048306) |
| 0.1 | 4.5 | GO:0030544 | Hsp70 protein binding(GO:0030544) |
| 0.1 | 3.5 | GO:0017056 | structural constituent of nuclear pore(GO:0017056) |
| 0.1 | 40.7 | GO:0004842 | ubiquitin-protein transferase activity(GO:0004842) |
| 0.1 | 0.6 | GO:0015172 | L-glutamate transmembrane transporter activity(GO:0005313) acidic amino acid transmembrane transporter activity(GO:0015172) |
| 0.1 | 15.6 | GO:0005096 | GTPase activator activity(GO:0005096) |
| 0.1 | 2.5 | GO:0008395 | steroid hydroxylase activity(GO:0008395) |
| 0.1 | 9.2 | GO:0005525 | GTP binding(GO:0005525) |
| 0.1 | 1.4 | GO:0005537 | mannose binding(GO:0005537) |
| 0.1 | 29.7 | GO:0004930 | G-protein coupled receptor activity(GO:0004930) |
| 0.1 | 223.6 | GO:0046872 | metal ion binding(GO:0046872) |
| 0.1 | 12.5 | GO:0005085 | guanyl-nucleotide exchange factor activity(GO:0005085) |
| 0.1 | 0.5 | GO:0045503 | dynein light chain binding(GO:0045503) |
| 0.1 | 2.4 | GO:0005160 | transforming growth factor beta receptor binding(GO:0005160) |
| 0.1 | 3.3 | GO:0035091 | phosphatidylinositol binding(GO:0035091) |
| 0.0 | 2.1 | GO:0005201 | extracellular matrix structural constituent(GO:0005201) |
| 0.0 | 0.2 | GO:0004550 | nucleoside diphosphate kinase activity(GO:0004550) |
| 0.0 | 1.9 | GO:0008168 | methyltransferase activity(GO:0008168) |
Gene overrepresentation in C2:CP category:
| Log-likelihood per target | Total log-likelihood | Term | Description |
|---|---|---|---|
| 2.9 | 198.3 | PID RAC1 REG PATHWAY | Regulation of RAC1 activity |
| 2.7 | 141.7 | PID INTEGRIN2 PATHWAY | Beta2 integrin cell surface interactions |
| 2.2 | 13.2 | SA G1 AND S PHASES | Cdk2, 4, and 6 bind cyclin D in G1, while cdk2/cyclin E promotes the G1/S transition. |
| 1.7 | 111.9 | ST ADRENERGIC | Adrenergic Pathway |
| 1.2 | 19.8 | ST G ALPHA S PATHWAY | G alpha s Pathway |
| 1.1 | 60.4 | SIG REGULATION OF THE ACTIN CYTOSKELETON BY RHO GTPASES | Genes related to regulation of the actin cytoskeleton |
| 0.6 | 29.5 | PID CXCR3 PATHWAY | CXCR3-mediated signaling events |
| 0.6 | 37.5 | PID PLK1 PATHWAY | PLK1 signaling events |
| 0.5 | 32.8 | PID HEDGEHOG GLI PATHWAY | Hedgehog signaling events mediated by Gli proteins |
| 0.5 | 19.6 | PID EPHRINB REV PATHWAY | Ephrin B reverse signaling |
| 0.5 | 31.0 | PID HNF3B PATHWAY | FOXA2 and FOXA3 transcription factor networks |
| 0.4 | 49.9 | PID CMYB PATHWAY | C-MYB transcription factor network |
| 0.4 | 15.5 | PID MYC PATHWAY | C-MYC pathway |
| 0.3 | 14.2 | PID ALPHA SYNUCLEIN PATHWAY | Alpha-synuclein signaling |
| 0.3 | 10.9 | PID RXR VDR PATHWAY | RXR and RAR heterodimerization with other nuclear receptor |
| 0.2 | 12.7 | PID CERAMIDE PATHWAY | Ceramide signaling pathway |
| 0.2 | 5.3 | PID ERBB1 DOWNSTREAM PATHWAY | ErbB1 downstream signaling |
| 0.1 | 11.2 | PID CASPASE PATHWAY | Caspase cascade in apoptosis |
| 0.1 | 4.4 | PID NCADHERIN PATHWAY | N-cadherin signaling events |
| 0.1 | 7.4 | NABA PROTEOGLYCANS | Genes encoding proteoglycans |
| 0.1 | 1.8 | PID ALK2 PATHWAY | ALK2 signaling events |
| 0.1 | 8.5 | PID VEGFR1 2 PATHWAY | Signaling events mediated by VEGFR1 and VEGFR2 |
| 0.1 | 5.9 | PID TELOMERASE PATHWAY | Regulation of Telomerase |
| 0.1 | 2.1 | PID DNA PK PATHWAY | DNA-PK pathway in nonhomologous end joining |
| 0.1 | 0.9 | PID IL8 CXCR1 PATHWAY | IL8- and CXCR1-mediated signaling events |
| 0.1 | 21.0 | NABA SECRETED FACTORS | Genes encoding secreted soluble factors |
| 0.0 | 5.2 | PID P73PATHWAY | p73 transcription factor network |
| 0.0 | 10.7 | NABA ECM REGULATORS | Genes encoding enzymes and their regulators involved in the remodeling of the extracellular matrix |
| 0.0 | 1.0 | PID RAS PATHWAY | Regulation of Ras family activation |
| 0.0 | 0.8 | PID CDC42 REG PATHWAY | Regulation of CDC42 activity |
| 0.0 | 0.7 | PID LYSOPHOSPHOLIPID PATHWAY | LPA receptor mediated events |
Gene overrepresentation in C2:CP:REACTOME category:
| Log-likelihood per target | Total log-likelihood | Term | Description |
|---|---|---|---|
| 5.3 | 31.8 | REACTOME THE ROLE OF NEF IN HIV1 REPLICATION AND DISEASE PATHOGENESIS | Genes involved in The role of Nef in HIV-1 replication and disease pathogenesis |
| 3.7 | 82.1 | REACTOME JNK C JUN KINASES PHOSPHORYLATION AND ACTIVATION MEDIATED BY ACTIVATED HUMAN TAK1 | Genes involved in JNK (c-Jun kinases) phosphorylation and activation mediated by activated human TAK1 |
| 2.9 | 101.0 | REACTOME GABA SYNTHESIS RELEASE REUPTAKE AND DEGRADATION | Genes involved in GABA synthesis, release, reuptake and degradation |
| 2.4 | 65.1 | REACTOME CYCLIN A B1 ASSOCIATED EVENTS DURING G2 M TRANSITION | Genes involved in Cyclin A/B1 associated events during G2/M transition |
| 2.3 | 36.8 | REACTOME SLBP DEPENDENT PROCESSING OF REPLICATION DEPENDENT HISTONE PRE MRNAS | Genes involved in SLBP Dependent Processing of Replication-Dependent Histone Pre-mRNAs |
| 2.0 | 92.5 | REACTOME RAP1 SIGNALLING | Genes involved in Rap1 signalling |
| 1.7 | 15.1 | REACTOME MRNA DECAY BY 3 TO 5 EXORIBONUCLEASE | Genes involved in mRNA Decay by 3' to 5' Exoribonuclease |
| 1.5 | 16.3 | REACTOME RECRUITMENT OF NUMA TO MITOTIC CENTROSOMES | Genes involved in Recruitment of NuMA to mitotic centrosomes |
| 1.5 | 28.2 | REACTOME SEMA4D INDUCED CELL MIGRATION AND GROWTH CONE COLLAPSE | Genes involved in Sema4D induced cell migration and growth-cone collapse |
| 1.4 | 73.6 | REACTOME SIGNALING BY ROBO RECEPTOR | Genes involved in Signaling by Robo receptor |
| 1.4 | 20.7 | REACTOME SIGNALLING TO P38 VIA RIT AND RIN | Genes involved in Signalling to p38 via RIT and RIN |
| 1.2 | 169.2 | REACTOME CELL SURFACE INTERACTIONS AT THE VASCULAR WALL | Genes involved in Cell surface interactions at the vascular wall |
| 1.2 | 12.7 | REACTOME REGULATION OF WATER BALANCE BY RENAL AQUAPORINS | Genes involved in Regulation of Water Balance by Renal Aquaporins |
| 1.1 | 73.0 | REACTOME SMOOTH MUSCLE CONTRACTION | Genes involved in Smooth Muscle Contraction |
| 1.0 | 166.5 | REACTOME SIGNALING BY RHO GTPASES | Genes involved in Signaling by Rho GTPases |
| 1.0 | 31.2 | REACTOME ADHERENS JUNCTIONS INTERACTIONS | Genes involved in Adherens junctions interactions |
| 1.0 | 31.0 | REACTOME REGULATION OF GENE EXPRESSION IN BETA CELLS | Genes involved in Regulation of gene expression in beta cells |
| 0.9 | 22.0 | REACTOME CRMPS IN SEMA3A SIGNALING | Genes involved in CRMPs in Sema3A signaling |
| 0.8 | 12.6 | REACTOME SYNTHESIS OF SUBSTRATES IN N GLYCAN BIOSYTHESIS | Genes involved in Synthesis of substrates in N-glycan biosythesis |
| 0.7 | 12.7 | REACTOME BASE FREE SUGAR PHOSPHATE REMOVAL VIA THE SINGLE NUCLEOTIDE REPLACEMENT PATHWAY | Genes involved in Base-free sugar-phosphate removal via the single-nucleotide replacement pathway |
| 0.7 | 26.4 | REACTOME ABC FAMILY PROTEINS MEDIATED TRANSPORT | Genes involved in ABC-family proteins mediated transport |
| 0.7 | 63.3 | REACTOME ER PHAGOSOME PATHWAY | Genes involved in ER-Phagosome pathway |
| 0.7 | 33.5 | REACTOME TRIGLYCERIDE BIOSYNTHESIS | Genes involved in Triglyceride Biosynthesis |
| 0.7 | 13.2 | REACTOME SYNTHESIS OF PIPS AT THE GOLGI MEMBRANE | Genes involved in Synthesis of PIPs at the Golgi membrane |
| 0.6 | 6.3 | REACTOME G PROTEIN ACTIVATION | Genes involved in G-protein activation |
| 0.6 | 18.1 | REACTOME INTERACTION BETWEEN L1 AND ANKYRINS | Genes involved in Interaction between L1 and Ankyrins |
| 0.4 | 8.5 | REACTOME REGULATION OF RHEB GTPASE ACTIVITY BY AMPK | Genes involved in Regulation of Rheb GTPase activity by AMPK |
| 0.4 | 15.5 | REACTOME NEGATIVE REGULATORS OF RIG I MDA5 SIGNALING | Genes involved in Negative regulators of RIG-I/MDA5 signaling |
| 0.4 | 7.7 | REACTOME OTHER SEMAPHORIN INTERACTIONS | Genes involved in Other semaphorin interactions |
| 0.4 | 27.8 | REACTOME PPARA ACTIVATES GENE EXPRESSION | Genes involved in PPARA Activates Gene Expression |
| 0.3 | 7.1 | REACTOME SYNTHESIS OF GLYCOSYLPHOSPHATIDYLINOSITOL GPI | Genes involved in Synthesis of glycosylphosphatidylinositol (GPI) |
| 0.3 | 21.0 | REACTOME CHEMOKINE RECEPTORS BIND CHEMOKINES | Genes involved in Chemokine receptors bind chemokines |
| 0.3 | 6.5 | REACTOME HDL MEDIATED LIPID TRANSPORT | Genes involved in HDL-mediated lipid transport |
| 0.3 | 4.0 | REACTOME VIRAL MESSENGER RNA SYNTHESIS | Genes involved in Viral Messenger RNA Synthesis |
| 0.3 | 120.1 | REACTOME GENERIC TRANSCRIPTION PATHWAY | Genes involved in Generic Transcription Pathway |
| 0.3 | 22.0 | REACTOME LOSS OF NLP FROM MITOTIC CENTROSOMES | Genes involved in Loss of Nlp from mitotic centrosomes |
| 0.2 | 2.5 | REACTOME SYNTHESIS OF BILE ACIDS AND BILE SALTS VIA 24 HYDROXYCHOLESTEROL | Genes involved in Synthesis of bile acids and bile salts via 24-hydroxycholesterol |
| 0.2 | 8.6 | REACTOME STEROID HORMONES | Genes involved in Steroid hormones |
| 0.2 | 5.3 | REACTOME P38MAPK EVENTS | Genes involved in p38MAPK events |
| 0.2 | 5.4 | REACTOME PROTEOLYTIC CLEAVAGE OF SNARE COMPLEX PROTEINS | Genes involved in Proteolytic cleavage of SNARE complex proteins |
| 0.2 | 10.4 | REACTOME VOLTAGE GATED POTASSIUM CHANNELS | Genes involved in Voltage gated Potassium channels |
| 0.2 | 4.6 | REACTOME SIGNALING BY HIPPO | Genes involved in Signaling by Hippo |
| 0.2 | 2.4 | REACTOME GLYCOPROTEIN HORMONES | Genes involved in Glycoprotein hormones |
| 0.2 | 6.3 | REACTOME CGMP EFFECTS | Genes involved in cGMP effects |
| 0.2 | 5.4 | REACTOME RNA POL I TRANSCRIPTION TERMINATION | Genes involved in RNA Polymerase I Transcription Termination |
| 0.1 | 2.5 | REACTOME DCC MEDIATED ATTRACTIVE SIGNALING | Genes involved in DCC mediated attractive signaling |
| 0.1 | 1.9 | REACTOME PROCESSING OF INTRONLESS PRE MRNAS | Genes involved in Processing of Intronless Pre-mRNAs |
| 0.1 | 2.1 | REACTOME KERATAN SULFATE DEGRADATION | Genes involved in Keratan sulfate degradation |
| 0.1 | 7.3 | REACTOME REGULATION OF INSULIN SECRETION | Genes involved in Regulation of Insulin Secretion |
| 0.1 | 1.7 | REACTOME POST CHAPERONIN TUBULIN FOLDING PATHWAY | Genes involved in Post-chaperonin tubulin folding pathway |
| 0.1 | 0.9 | REACTOME CA DEPENDENT EVENTS | Genes involved in Ca-dependent events |
| 0.1 | 7.9 | REACTOME PHASE II CONJUGATION | Genes involved in Phase II conjugation |
| 0.0 | 1.7 | REACTOME COLLAGEN FORMATION | Genes involved in Collagen formation |
| 0.0 | 0.6 | REACTOME AMINO ACID AND OLIGOPEPTIDE SLC TRANSPORTERS | Genes involved in Amino acid and oligopeptide SLC transporters |