Project
GNF SymAtlas + NCI-60 cancer cell lines, comparison of cancers vs non-cancers, human (Su, 2004; Ross, 2000)
Navigation
Downloads
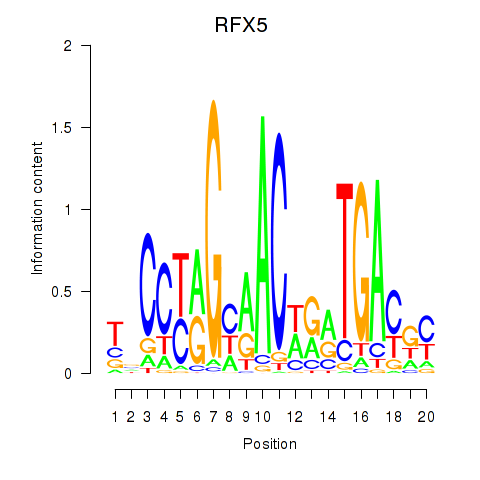
Results for RFX5
Z-value: 0.27
Motif logo
Transcription factors associated with RFX5
| Gene Symbol | Gene ID | Gene Info |
|---|---|---|
|
RFX5
|
ENSG00000143390.13 | regulatory factor X5 |
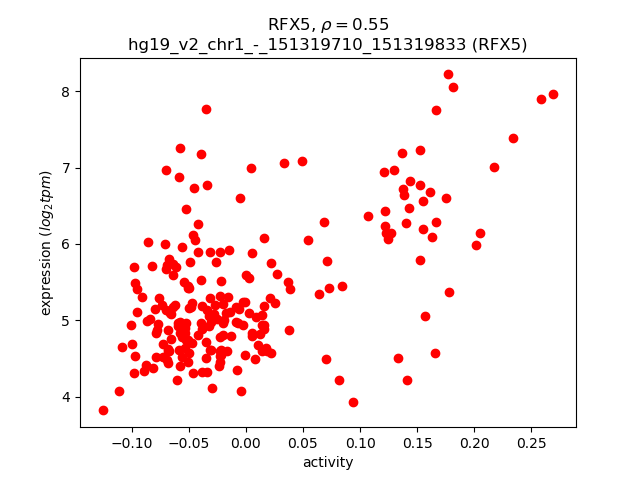
Activity-expression correlation:
| Gene | Promoter | Pearson corr. coef. | P-value | Plot |
|---|---|---|---|---|
| RFX5 | hg19_v2_chr1_-_151319710_151319833 | 0.55 | 1.2e-18 | Click! |
Activity profile of RFX5 motif
Sorted Z-values of RFX5 motif
| Promoter | Log-likelihood | Transcript | Gene | Gene Info |
|---|---|---|---|---|
| chr6_-_32557610 | 76.97 |
ENST00000360004.5
|
HLA-DRB1
|
major histocompatibility complex, class II, DR beta 1 |
| chr6_+_33043703 | 75.99 |
ENST00000418931.2
ENST00000535465.1 |
HLA-DPB1
|
major histocompatibility complex, class II, DP beta 1 |
| chr5_-_149792295 | 70.60 |
ENST00000518797.1
ENST00000524315.1 ENST00000009530.7 ENST00000377795.3 |
CD74
|
CD74 molecule, major histocompatibility complex, class II invariant chain |
| chr6_-_32498046 | 64.95 |
ENST00000374975.3
|
HLA-DRB5
|
major histocompatibility complex, class II, DR beta 5 |
| chr6_-_32920794 | 63.68 |
ENST00000395305.3
ENST00000395303.3 ENST00000374843.4 ENST00000429234.1 |
HLA-DMA
XXbac-BPG181M17.5
|
major histocompatibility complex, class II, DM alpha Uncharacterized protein |
| chr6_+_32821924 | 43.85 |
ENST00000374859.2
ENST00000453265.2 |
PSMB9
|
proteasome (prosome, macropain) subunit, beta type, 9 |
| chr6_-_32634425 | 36.64 |
ENST00000399082.3
ENST00000399079.3 ENST00000374943.4 ENST00000434651.2 |
HLA-DQB1
|
major histocompatibility complex, class II, DQ beta 1 |
| chr6_-_32908792 | 33.72 |
ENST00000418107.2
|
HLA-DMB
|
major histocompatibility complex, class II, DM beta |
| chr6_-_32812420 | 33.01 |
ENST00000374881.2
|
PSMB8
|
proteasome (prosome, macropain) subunit, beta type, 8 |
| chr6_-_32731299 | 29.97 |
ENST00000435145.2
ENST00000437316.2 |
HLA-DQB2
|
major histocompatibility complex, class II, DQ beta 2 |
| chr6_+_32812568 | 29.55 |
ENST00000414474.1
|
PSMB9
|
proteasome (prosome, macropain) subunit, beta type, 9 |
| chr6_-_32821599 | 24.30 |
ENST00000354258.4
|
TAP1
|
transporter 1, ATP-binding cassette, sub-family B (MDR/TAP) |
| chr6_-_32784687 | 17.46 |
ENST00000447394.1
ENST00000438763.2 |
HLA-DOB
|
major histocompatibility complex, class II, DO beta |
| chr11_-_6640585 | 16.59 |
ENST00000533371.1
ENST00000528657.1 ENST00000436873.2 ENST00000299427.6 |
TPP1
|
tripeptidyl peptidase I |
| chr1_+_249132462 | 13.64 |
ENST00000306562.3
|
ZNF672
|
zinc finger protein 672 |
| chr6_+_26440700 | 13.47 |
ENST00000494393.1
ENST00000482451.1 ENST00000244519.2 ENST00000339789.4 ENST00000471353.1 ENST00000361232.3 ENST00000487627.1 ENST00000496719.1 ENST00000490254.1 ENST00000487272.1 |
BTN3A3
|
butyrophilin, subfamily 3, member A3 |
| chr6_-_32731243 | 13.13 |
ENST00000427449.1
ENST00000411527.1 |
HLA-DQB2
|
major histocompatibility complex, class II, DQ beta 2 |
| chr11_+_8008867 | 12.98 |
ENST00000309828.4
ENST00000449102.2 |
EIF3F
|
eukaryotic translation initiation factor 3, subunit F |
| chr6_-_32908765 | 12.90 |
ENST00000416244.2
|
HLA-DMB
|
major histocompatibility complex, class II, DM beta |
| chr6_+_26383404 | 12.63 |
ENST00000416795.2
ENST00000494184.1 |
BTN2A2
|
butyrophilin, subfamily 2, member A2 |
| chr6_+_26458171 | 11.70 |
ENST00000493173.1
ENST00000541522.1 ENST00000429381.1 ENST00000469185.1 |
BTN2A1
|
butyrophilin, subfamily 2, member A1 |
| chr6_+_26458152 | 11.40 |
ENST00000312541.5
|
BTN2A1
|
butyrophilin, subfamily 2, member A1 |
| chr6_+_26365443 | 10.50 |
ENST00000527422.1
ENST00000356386.2 ENST00000396934.3 ENST00000377708.2 ENST00000396948.1 ENST00000508906.2 |
BTN3A2
|
butyrophilin, subfamily 3, member A2 |
| chr15_+_45003675 | 9.71 |
ENST00000558401.1
ENST00000559916.1 ENST00000544417.1 |
B2M
|
beta-2-microglobulin |
| chr3_+_43328004 | 9.44 |
ENST00000454177.1
ENST00000429705.2 ENST00000296088.7 ENST00000437827.1 |
SNRK
|
SNF related kinase |
| chr13_-_47012325 | 8.94 |
ENST00000409879.2
|
KIAA0226L
|
KIAA0226-like |
| chr6_+_26383318 | 8.35 |
ENST00000469230.1
ENST00000490025.1 ENST00000356709.4 ENST00000352867.2 ENST00000493275.1 ENST00000472507.1 ENST00000482536.1 ENST00000432533.2 ENST00000482842.1 |
BTN2A2
|
butyrophilin, subfamily 2, member A2 |
| chr6_-_133079022 | 7.23 |
ENST00000525289.1
ENST00000326499.6 |
VNN2
|
vanin 2 |
| chr19_+_19496624 | 6.04 |
ENST00000494516.2
ENST00000360315.3 ENST00000252577.5 |
GATAD2A
|
GATA zinc finger domain containing 2A |
| chr2_-_242088850 | 5.65 |
ENST00000358649.4
ENST00000452907.1 ENST00000403638.3 ENST00000539818.1 ENST00000415234.1 ENST00000234040.4 |
PASK
|
PAS domain containing serine/threonine kinase |
| chr19_+_45418067 | 5.42 |
ENST00000589078.1
ENST00000586638.1 |
APOC1
|
apolipoprotein C-I |
| chr3_+_196466710 | 4.10 |
ENST00000327134.3
|
PAK2
|
p21 protein (Cdc42/Rac)-activated kinase 2 |
| chr4_-_83719884 | 3.95 |
ENST00000282709.4
ENST00000273908.4 |
SCD5
|
stearoyl-CoA desaturase 5 |
| chr22_-_30987837 | 3.79 |
ENST00000335214.6
|
PES1
|
pescadillo ribosomal biogenesis factor 1 |
| chr6_-_30181133 | 3.73 |
ENST00000454678.2
ENST00000434785.1 |
TRIM26
|
tripartite motif containing 26 |
| chr6_-_30181156 | 3.55 |
ENST00000418026.1
ENST00000416596.1 ENST00000453195.1 |
TRIM26
|
tripartite motif containing 26 |
| chr11_-_72433346 | 3.08 |
ENST00000334211.8
|
ARAP1
|
ArfGAP with RhoGAP domain, ankyrin repeat and PH domain 1 |
| chr4_-_143227088 | 2.22 |
ENST00000511838.1
|
INPP4B
|
inositol polyphosphate-4-phosphatase, type II, 105kDa |
| chr1_+_181003067 | 2.13 |
ENST00000434571.2
ENST00000367579.3 ENST00000282990.6 ENST00000367580.5 |
MR1
|
major histocompatibility complex, class I-related |
| chr6_-_24666819 | 2.08 |
ENST00000341060.3
|
TDP2
|
tyrosyl-DNA phosphodiesterase 2 |
| chr6_-_24667180 | 1.86 |
ENST00000545995.1
|
TDP2
|
tyrosyl-DNA phosphodiesterase 2 |
| chr4_-_143226979 | 1.71 |
ENST00000514525.1
|
INPP4B
|
inositol polyphosphate-4-phosphatase, type II, 105kDa |
| chr16_+_67381263 | 1.67 |
ENST00000541146.1
ENST00000563189.1 ENST00000290940.7 |
LRRC36
|
leucine rich repeat containing 36 |
| chr16_+_67381289 | 1.64 |
ENST00000435835.3
|
LRRC36
|
leucine rich repeat containing 36 |
| chr19_+_45417921 | 1.20 |
ENST00000252491.4
ENST00000592885.1 ENST00000589781.1 |
APOC1
|
apolipoprotein C-I |
| chr19_+_36103631 | 1.18 |
ENST00000203166.5
ENST00000379045.2 |
HAUS5
|
HAUS augmin-like complex, subunit 5 |
| chr1_+_36549676 | 0.94 |
ENST00000207457.3
|
TEKT2
|
tektin 2 (testicular) |
| chr1_-_202936394 | 0.35 |
ENST00000367249.4
|
CYB5R1
|
cytochrome b5 reductase 1 |
| chr19_+_3933579 | 0.23 |
ENST00000593949.1
|
NMRK2
|
nicotinamide riboside kinase 2 |
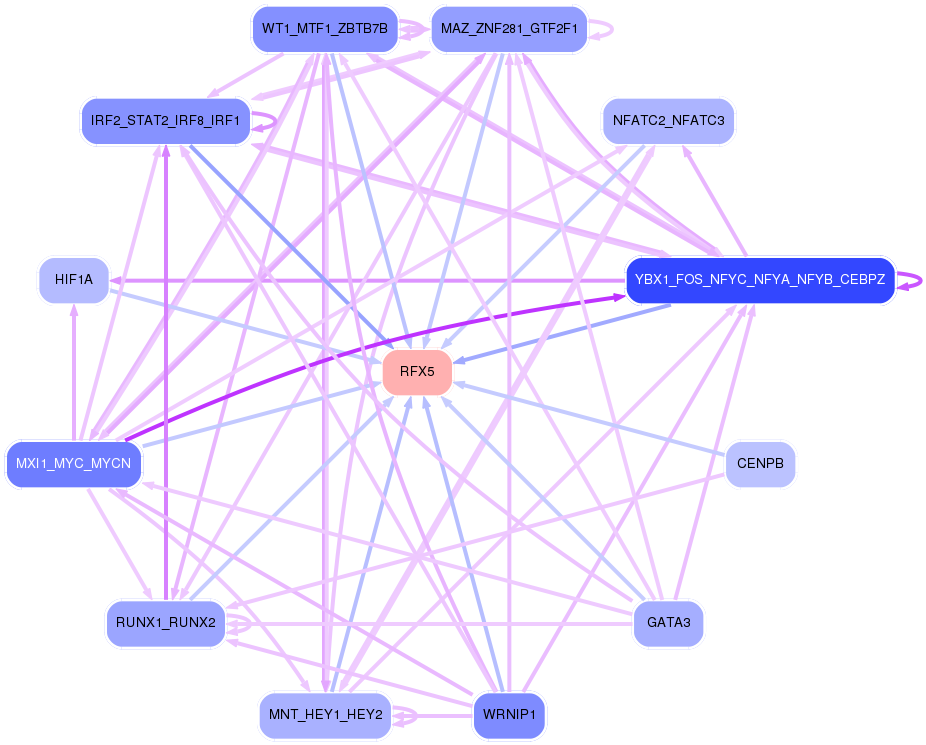
Network of associatons between targets according to the STRING database.

First level regulatory network of RFX5
Gene Ontology Analysis
Gene overrepresentation in biological_process category:
| Log-likelihood per target | Total log-likelihood | Term | Description |
|---|---|---|---|
| 37.5 | 187.3 | GO:0002399 | MHC class II protein complex assembly(GO:0002399) |
| 14.1 | 70.6 | GO:0002906 | mature B cell apoptotic process(GO:0002901) regulation of mature B cell apoptotic process(GO:0002905) negative regulation of mature B cell apoptotic process(GO:0002906) |
| 6.1 | 24.3 | GO:0046967 | cytosol to ER transport(GO:0046967) |
| 5.8 | 17.5 | GO:0002581 | negative regulation of antigen processing and presentation of peptide or polysaccharide antigen via MHC class II(GO:0002581) |
| 4.9 | 9.7 | GO:0002428 | antigen processing and presentation of peptide antigen via MHC class Ib(GO:0002428) |
| 1.8 | 224.8 | GO:0031295 | T cell costimulation(GO:0031295) |
| 1.7 | 6.6 | GO:0010900 | negative regulation of phosphatidylcholine catabolic process(GO:0010900) |
| 1.5 | 21.0 | GO:0046007 | negative regulation of activated T cell proliferation(GO:0046007) |
| 0.9 | 5.7 | GO:0070092 | regulation of glucagon secretion(GO:0070092) |
| 0.9 | 95.9 | GO:0006521 | regulation of cellular amino acid metabolic process(GO:0006521) |
| 0.8 | 3.1 | GO:0030037 | actin filament reorganization involved in cell cycle(GO:0030037) |
| 0.8 | 13.0 | GO:0075522 | IRES-dependent viral translational initiation(GO:0075522) |
| 0.7 | 7.2 | GO:0015939 | pantothenate metabolic process(GO:0015939) |
| 0.6 | 10.5 | GO:0072643 | interferon-gamma secretion(GO:0072643) |
| 0.4 | 7.3 | GO:1902187 | negative regulation of viral release from host cell(GO:1902187) |
| 0.4 | 3.8 | GO:0007000 | nucleolus organization(GO:0007000) |
| 0.3 | 16.6 | GO:0043171 | peptide catabolic process(GO:0043171) |
| 0.1 | 0.9 | GO:0060294 | cilium movement involved in cell motility(GO:0060294) |
| 0.1 | 13.5 | GO:0002456 | T cell mediated immunity(GO:0002456) |
| 0.1 | 3.9 | GO:0046949 | fatty-acyl-CoA biosynthetic process(GO:0046949) |
| 0.1 | 2.1 | GO:0032620 | interleukin-17 production(GO:0032620) |
| 0.1 | 6.0 | GO:0006306 | DNA alkylation(GO:0006305) DNA methylation(GO:0006306) |
| 0.1 | 3.9 | GO:0036092 | phosphatidylinositol-3-phosphate biosynthetic process(GO:0036092) |
| 0.0 | 9.4 | GO:0030099 | myeloid cell differentiation(GO:0030099) |
| 0.0 | 3.9 | GO:0006302 | double-strand break repair(GO:0006302) |
| 0.0 | 0.2 | GO:0045662 | negative regulation of myoblast differentiation(GO:0045662) |
Gene overrepresentation in cellular_component category:
| Log-likelihood per target | Total log-likelihood | Term | Description |
|---|---|---|---|
| 23.6 | 496.0 | GO:0042613 | MHC class II protein complex(GO:0042613) |
| 13.3 | 106.4 | GO:1990111 | spermatoproteasome complex(GO:1990111) |
| 4.1 | 24.3 | GO:0042825 | TAP complex(GO:0042825) |
| 1.9 | 9.7 | GO:0031905 | early endosome lumen(GO:0031905) |
| 1.4 | 13.0 | GO:0071541 | eukaryotic translation initiation factor 3 complex, eIF3m(GO:0071541) |
| 0.6 | 3.8 | GO:0070545 | PeBoW complex(GO:0070545) |
| 0.3 | 6.6 | GO:0042627 | chylomicron(GO:0042627) |
| 0.2 | 2.1 | GO:0042611 | MHC protein complex(GO:0042611) |
| 0.2 | 6.0 | GO:0090545 | NuRD complex(GO:0016581) CHD-type complex(GO:0090545) |
| 0.1 | 1.2 | GO:0070652 | HAUS complex(GO:0070652) |
| 0.1 | 16.6 | GO:0043202 | lysosomal lumen(GO:0043202) |
| 0.1 | 3.9 | GO:0016235 | aggresome(GO:0016235) |
| 0.0 | 7.2 | GO:0031225 | anchored component of membrane(GO:0031225) |
| 0.0 | 3.1 | GO:0032580 | Golgi cisterna membrane(GO:0032580) |
| 0.0 | 0.9 | GO:0036126 | sperm flagellum(GO:0036126) |
| 0.0 | 0.4 | GO:0031092 | platelet alpha granule membrane(GO:0031092) |
| 0.0 | 51.6 | GO:0016021 | integral component of membrane(GO:0016021) |
Gene overrepresentation in molecular_function category:
| Log-likelihood per target | Total log-likelihood | Term | Description |
|---|---|---|---|
| 14.1 | 70.6 | GO:0042289 | MHC class II protein binding(GO:0042289) |
| 8.1 | 242.2 | GO:0042605 | peptide antigen binding(GO:0042605) |
| 7.5 | 97.2 | GO:0032395 | MHC class II receptor activity(GO:0032395) |
| 4.2 | 110.3 | GO:0023026 | MHC class II protein complex binding(GO:0023026) |
| 3.5 | 106.4 | GO:0070003 | threonine-type endopeptidase activity(GO:0004298) threonine-type peptidase activity(GO:0070003) |
| 2.8 | 16.6 | GO:0008240 | tripeptidyl-peptidase activity(GO:0008240) |
| 1.4 | 7.2 | GO:0017159 | pantetheine hydrolase activity(GO:0017159) |
| 1.3 | 3.9 | GO:0004768 | stearoyl-CoA 9-desaturase activity(GO:0004768) acyl-CoA desaturase activity(GO:0016215) |
| 1.3 | 3.9 | GO:0036317 | tyrosyl-RNA phosphodiesterase activity(GO:0036317) 5'-tyrosyl-DNA phosphodiesterase activity(GO:0070260) |
| 0.8 | 6.6 | GO:0060228 | phosphatidylcholine-sterol O-acyltransferase activator activity(GO:0060228) |
| 0.8 | 3.9 | GO:0016316 | phosphatidylinositol-3,4-bisphosphate 4-phosphatase activity(GO:0016316) inositol-1,3,4-trisphosphate 4-phosphatase activity(GO:0017161) phosphatidylinositol-4,5-bisphosphate 4-phosphatase activity(GO:0034597) inositol-3,4-bisphosphate 4-phosphatase activity(GO:0052828) |
| 0.3 | 13.0 | GO:0031369 | translation initiation factor binding(GO:0031369) |
| 0.2 | 3.1 | GO:0031702 | type 1 angiotensin receptor binding(GO:0031702) |
| 0.2 | 2.1 | GO:0032393 | MHC class I receptor activity(GO:0032393) |
| 0.1 | 4.1 | GO:0030296 | protein tyrosine kinase activator activity(GO:0030296) |
| 0.1 | 0.2 | GO:0050262 | ribosylnicotinamide kinase activity(GO:0050262) ribosylnicotinate kinase activity(GO:0061769) |
| 0.0 | 9.4 | GO:0000287 | magnesium ion binding(GO:0000287) |
| 0.0 | 0.4 | GO:0004128 | cytochrome-b5 reductase activity, acting on NAD(P)H(GO:0004128) |
| 0.0 | 6.0 | GO:0030674 | protein binding, bridging(GO:0030674) |
| 0.0 | 5.7 | GO:0035091 | phosphatidylinositol binding(GO:0035091) |
Gene overrepresentation in C2:CP category:
| Log-likelihood per target | Total log-likelihood | Term | Description |
|---|---|---|---|
| 1.5 | 77.0 | PID IL12 STAT4 PATHWAY | IL12 signaling mediated by STAT4 |
| 0.1 | 9.7 | PID CD8 TCR DOWNSTREAM PATHWAY | Downstream signaling in naïve CD8+ T cells |
| 0.1 | 24.3 | PID P53 DOWNSTREAM PATHWAY | Direct p53 effectors |
| 0.1 | 4.1 | PID MYC PATHWAY | C-MYC pathway |
| 0.1 | 3.9 | PID CD40 PATHWAY | CD40/CD40L signaling |
| 0.1 | 6.0 | PID HDAC CLASSI PATHWAY | Signaling events mediated by HDAC Class I |
| 0.0 | 3.1 | PID RHOA REG PATHWAY | Regulation of RhoA activity |
Gene overrepresentation in C2:CP:REACTOME category:
| Log-likelihood per target | Total log-likelihood | Term | Description |
|---|---|---|---|
| 9.5 | 217.9 | REACTOME TRANSLOCATION OF ZAP 70 TO IMMUNOLOGICAL SYNAPSE | Genes involved in Translocation of ZAP-70 to Immunological synapse |
| 2.4 | 9.7 | REACTOME NEF MEDIATED DOWNREGULATION OF MHC CLASS I COMPLEX CELL SURFACE EXPRESSION | Genes involved in Nef mediated downregulation of MHC class I complex cell surface expression |
| 1.6 | 24.3 | REACTOME ANTIGEN PRESENTATION FOLDING ASSEMBLY AND PEPTIDE LOADING OF CLASS I MHC | Genes involved in Antigen Presentation: Folding, assembly and peptide loading of class I MHC |
| 1.5 | 198.4 | REACTOME MHC CLASS II ANTIGEN PRESENTATION | Genes involved in MHC class II antigen presentation |
| 1.3 | 95.9 | REACTOME CROSS PRESENTATION OF SOLUBLE EXOGENOUS ANTIGENS ENDOSOMES | Genes involved in Cross-presentation of soluble exogenous antigens (endosomes) |
| 0.3 | 3.9 | REACTOME SYNTHESIS OF PIPS AT THE EARLY ENDOSOME MEMBRANE | Genes involved in Synthesis of PIPs at the early endosome membrane |
| 0.3 | 4.1 | REACTOME REGULATION OF APOPTOSIS | Genes involved in Regulation of Apoptosis |
| 0.2 | 16.6 | REACTOME ACTIVATION OF CHAPERONE GENES BY XBP1S | Genes involved in Activation of Chaperone Genes by XBP1(S) |
| 0.2 | 13.0 | REACTOME FORMATION OF THE TERNARY COMPLEX AND SUBSEQUENTLY THE 43S COMPLEX | Genes involved in Formation of the ternary complex, and subsequently, the 43S complex |
| 0.0 | 3.1 | REACTOME SIGNALING BY RHO GTPASES | Genes involved in Signaling by Rho GTPases |