Project
GNF SymAtlas + NCI-60 cancer cell lines, comparison of cancers vs non-cancers, human (Su, 2004; Ross, 2000)
Navigation
Downloads
Results for SIX6
Z-value: 0.31
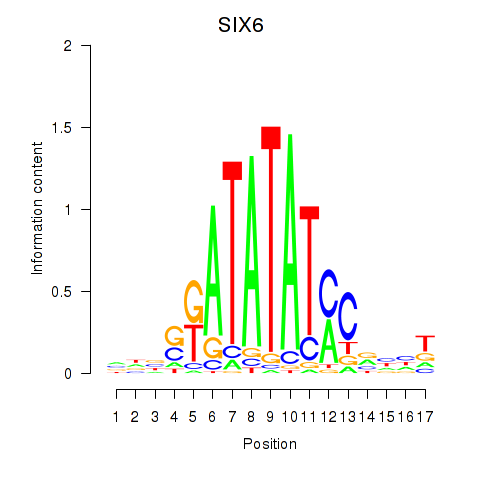
Motif logo
Transcription factors associated with SIX6
| Gene Symbol | Gene ID | Gene Info |
|---|---|---|
|
SIX6
|
ENSG00000184302.6 | SIX homeobox 6 |
Activity-expression correlation:
| Gene | Promoter | Pearson corr. coef. | P-value | Plot |
|---|---|---|---|---|
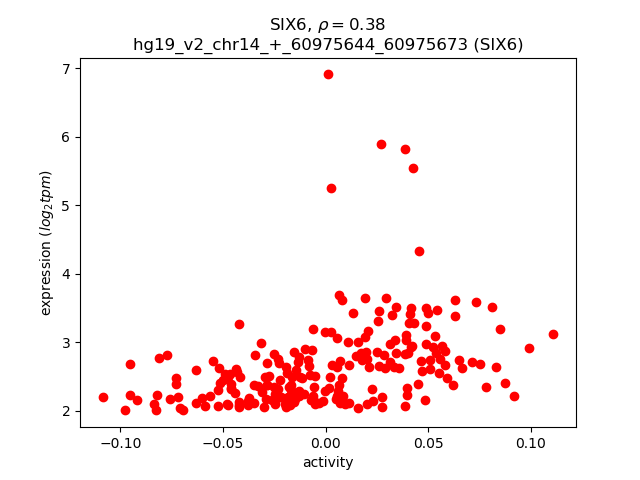
| SIX6 | hg19_v2_chr14_+_60975644_60975673 | 0.38 | 5.9e-09 | Click! |
Activity profile of SIX6 motif
Sorted Z-values of SIX6 motif
| Promoter | Log-likelihood | Transcript | Gene | Gene Info |
|---|---|---|---|---|
| chrX_+_64708615 | 21.90 |
ENST00000338957.4
ENST00000423889.3 |
ZC3H12B
|
zinc finger CCCH-type containing 12B |
| chr8_+_84824920 | 16.88 |
ENST00000523678.1
|
RP11-120I21.2
|
RP11-120I21.2 |
| chr18_+_74240610 | 16.40 |
ENST00000578092.1
ENST00000578613.1 ENST00000583578.1 |
LINC00908
|
long intergenic non-protein coding RNA 908 |
| chr4_+_113739244 | 10.31 |
ENST00000503271.1
ENST00000503423.1 ENST00000506722.1 |
ANK2
|
ankyrin 2, neuronal |
| chrX_+_8433376 | 8.57 |
ENST00000440654.2
ENST00000381029.4 |
VCX3B
|
variable charge, X-linked 3B |
| chr2_-_100939195 | 8.25 |
ENST00000393437.3
|
LONRF2
|
LON peptidase N-terminal domain and ring finger 2 |
| chr1_+_21880560 | 7.06 |
ENST00000425315.2
|
ALPL
|
alkaline phosphatase, liver/bone/kidney |
| chr3_+_8543533 | 6.73 |
ENST00000454244.1
|
LMCD1
|
LIM and cysteine-rich domains 1 |
| chrY_-_16098393 | 6.54 |
ENST00000250825.4
|
VCY
|
variable charge, Y-linked |
| chr2_-_88427568 | 6.50 |
ENST00000393750.3
ENST00000295834.3 |
FABP1
|
fatty acid binding protein 1, liver |
| chr9_-_21142144 | 6.06 |
ENST00000380229.2
|
IFNW1
|
interferon, omega 1 |
| chr11_+_74699942 | 6.02 |
ENST00000526068.1
ENST00000532963.1 ENST00000531619.1 ENST00000534628.1 ENST00000545272.1 |
NEU3
|
sialidase 3 (membrane sialidase) |
| chrY_+_16168097 | 5.73 |
ENST00000250823.4
|
VCY1B
|
variable charge, Y-linked 1B |
| chr12_-_122018859 | 5.60 |
ENST00000536437.1
ENST00000377071.4 ENST00000538046.2 |
KDM2B
|
lysine (K)-specific demethylase 2B |
| chr1_-_67142710 | 5.50 |
ENST00000502413.2
|
AL139147.1
|
Uncharacterized protein |
| chr11_+_74699703 | 5.29 |
ENST00000529024.1
ENST00000544263.1 |
NEU3
|
sialidase 3 (membrane sialidase) |
| chr1_+_160709055 | 5.22 |
ENST00000368043.3
ENST00000368042.3 ENST00000458602.2 ENST00000458104.2 |
SLAMF7
|
SLAM family member 7 |
| chr3_+_151531810 | 4.99 |
ENST00000232892.7
|
AADAC
|
arylacetamide deacetylase |
| chrX_-_55020511 | 4.79 |
ENST00000375006.3
ENST00000374992.2 |
PFKFB1
|
6-phosphofructo-2-kinase/fructose-2,6-biphosphatase 1 |
| chr1_-_36235559 | 4.71 |
ENST00000251195.5
|
CLSPN
|
claspin |
| chrX_-_53350522 | 4.64 |
ENST00000396435.3
ENST00000375368.5 |
IQSEC2
|
IQ motif and Sec7 domain 2 |
| chr1_+_160709029 | 4.39 |
ENST00000444090.2
ENST00000441662.2 |
SLAMF7
|
SLAM family member 7 |
| chr1_-_150669604 | 4.37 |
ENST00000427665.1
ENST00000540514.1 |
GOLPH3L
|
golgi phosphoprotein 3-like |
| chr6_+_26204825 | 4.35 |
ENST00000360441.4
|
HIST1H4E
|
histone cluster 1, H4e |
| chr7_-_44530479 | 4.35 |
ENST00000355451.7
|
NUDCD3
|
NudC domain containing 3 |
| chr3_+_125694347 | 4.17 |
ENST00000505382.1
ENST00000511082.1 |
ROPN1B
|
rhophilin associated tail protein 1B |
| chr9_-_23821842 | 4.15 |
ENST00000544538.1
|
ELAVL2
|
ELAV like neuron-specific RNA binding protein 2 |
| chr1_+_86934526 | 4.06 |
ENST00000394711.1
|
CLCA1
|
chloride channel accessory 1 |
| chrX_-_18238999 | 3.94 |
ENST00000380033.4
ENST00000380030.3 |
BEND2
|
BEN domain containing 2 |
| chr16_+_19467772 | 3.87 |
ENST00000219821.5
ENST00000561503.1 ENST00000564959.1 |
TMC5
|
transmembrane channel-like 5 |
| chr5_-_177207634 | 3.79 |
ENST00000513554.1
ENST00000440605.3 |
FAM153A
|
family with sequence similarity 153, member A |
| chr13_+_73629107 | 3.71 |
ENST00000539231.1
|
KLF5
|
Kruppel-like factor 5 (intestinal) |
| chr1_-_13673511 | 3.61 |
ENST00000344998.3
ENST00000334600.6 |
PRAMEF14
|
PRAME family member 14 |
| chr1_+_53308398 | 3.48 |
ENST00000371528.1
|
ZYG11A
|
zyg-11 family member A, cell cycle regulator |
| chr2_-_208989225 | 3.45 |
ENST00000264376.4
|
CRYGD
|
crystallin, gamma D |
| chr1_+_160709076 | 3.43 |
ENST00000359331.4
ENST00000495334.1 |
SLAMF7
|
SLAM family member 7 |
| chr3_+_8543561 | 3.42 |
ENST00000397386.3
|
LMCD1
|
LIM and cysteine-rich domains 1 |
| chr16_-_29517141 | 3.41 |
ENST00000550665.1
|
RP11-231C14.4
|
Uncharacterized protein |
| chr10_+_91061712 | 3.32 |
ENST00000371826.3
|
IFIT2
|
interferon-induced protein with tetratricopeptide repeats 2 |
| chr16_-_20364122 | 3.30 |
ENST00000396138.4
ENST00000577168.1 |
UMOD
|
uromodulin |
| chr11_-_45307817 | 3.29 |
ENST00000020926.3
|
SYT13
|
synaptotagmin XIII |
| chr7_+_117251671 | 3.24 |
ENST00000468795.1
|
CFTR
|
cystic fibrosis transmembrane conductance regulator (ATP-binding cassette sub-family C, member 7) |
| chr3_-_9994021 | 3.21 |
ENST00000411976.2
ENST00000412055.1 |
PRRT3
|
proline-rich transmembrane protein 3 |
| chr2_-_62081148 | 3.20 |
ENST00000404929.1
|
FAM161A
|
family with sequence similarity 161, member A |
| chr6_-_26189304 | 3.17 |
ENST00000340756.2
|
HIST1H4D
|
histone cluster 1, H4d |
| chr9_-_21351377 | 3.15 |
ENST00000380210.1
|
IFNA6
|
interferon, alpha 6 |
| chr11_+_33902189 | 3.14 |
ENST00000330381.2
|
AC132216.1
|
HCG1785179; PRO1787; Uncharacterized protein |
| chr16_-_20364030 | 2.98 |
ENST00000396134.2
ENST00000573567.1 ENST00000570757.1 ENST00000424589.1 ENST00000302509.4 ENST00000571174.1 ENST00000576688.1 |
UMOD
|
uromodulin |
| chr6_+_146348782 | 2.96 |
ENST00000361719.2
ENST00000392299.2 |
GRM1
|
glutamate receptor, metabotropic 1 |
| chr10_-_61720640 | 2.88 |
ENST00000521074.1
ENST00000444900.1 |
C10orf40
|
chromosome 10 open reading frame 40 |
| chr19_-_16008880 | 2.72 |
ENST00000011989.7
ENST00000221700.6 |
CYP4F2
|
cytochrome P450, family 4, subfamily F, polypeptide 2 |
| chr5_+_40909354 | 2.70 |
ENST00000313164.9
|
C7
|
complement component 7 |
| chr1_+_156119798 | 2.61 |
ENST00000355014.2
|
SEMA4A
|
sema domain, immunoglobulin domain (Ig), transmembrane domain (TM) and short cytoplasmic domain, (semaphorin) 4A |
| chr4_-_70826725 | 2.61 |
ENST00000353151.3
|
CSN2
|
casein beta |
| chr17_-_42327236 | 2.58 |
ENST00000399246.2
|
AC003102.1
|
AC003102.1 |
| chr1_-_20446020 | 2.56 |
ENST00000375105.3
|
PLA2G2D
|
phospholipase A2, group IID |
| chr21_-_19775973 | 2.56 |
ENST00000284885.3
|
TMPRSS15
|
transmembrane protease, serine 15 |
| chr6_-_26018007 | 2.41 |
ENST00000244573.3
|
HIST1H1A
|
histone cluster 1, H1a |
| chr8_+_101170257 | 2.31 |
ENST00000251809.3
|
SPAG1
|
sperm associated antigen 1 |
| chr17_+_60501228 | 2.25 |
ENST00000311506.5
|
METTL2A
|
methyltransferase like 2A |
| chr4_-_155511887 | 2.24 |
ENST00000302053.3
ENST00000403106.3 |
FGA
|
fibrinogen alpha chain |
| chr16_-_87350970 | 2.24 |
ENST00000567970.1
|
C16orf95
|
chromosome 16 open reading frame 95 |
| chr19_+_55235969 | 2.23 |
ENST00000402254.2
ENST00000538269.1 ENST00000541392.1 ENST00000291860.1 ENST00000396284.2 |
KIR3DL1
KIR3DL3
KIR2DL4
|
killer cell immunoglobulin-like receptor, three domains, long cytoplasmic tail, 1 killer cell immunoglobulin-like receptor, three domains, long cytoplasmic tail, 3 killer cell immunoglobulin-like receptor, two domains, long cytoplasmic tail, 4 |
| chr16_+_72090053 | 2.19 |
ENST00000576168.2
ENST00000567185.3 ENST00000567612.2 |
HP
|
haptoglobin |
| chr6_+_80816342 | 2.16 |
ENST00000369760.4
ENST00000356489.5 ENST00000320393.6 |
BCKDHB
|
branched chain keto acid dehydrogenase E1, beta polypeptide |
| chr15_-_51397473 | 2.10 |
ENST00000327536.5
|
TNFAIP8L3
|
tumor necrosis factor, alpha-induced protein 8-like 3 |
| chr14_+_22948510 | 2.06 |
ENST00000390483.1
|
TRAJ56
|
T cell receptor alpha joining 56 |
| chr12_-_121477039 | 2.01 |
ENST00000257570.5
|
OASL
|
2'-5'-oligoadenylate synthetase-like |
| chr22_-_17302589 | 2.01 |
ENST00000331428.5
|
XKR3
|
XK, Kell blood group complex subunit-related family, member 3 |
| chr18_+_55018044 | 1.95 |
ENST00000324000.3
|
ST8SIA3
|
ST8 alpha-N-acetyl-neuraminide alpha-2,8-sialyltransferase 3 |
| chr1_-_161193349 | 1.91 |
ENST00000469730.2
ENST00000463273.1 ENST00000464492.1 ENST00000367990.3 ENST00000470459.2 ENST00000468465.1 ENST00000463812.1 |
APOA2
|
apolipoprotein A-II |
| chr14_+_21152259 | 1.89 |
ENST00000555835.1
ENST00000336811.6 |
RNASE4
ANG
|
ribonuclease, RNase A family, 4 angiogenin, ribonuclease, RNase A family, 5 |
| chr12_-_121476959 | 1.74 |
ENST00000339275.5
|
OASL
|
2'-5'-oligoadenylate synthetase-like |
| chr9_-_100684845 | 1.68 |
ENST00000375119.3
|
C9orf156
|
chromosome 9 open reading frame 156 |
| chr2_-_228497888 | 1.65 |
ENST00000264387.4
ENST00000409066.1 |
C2orf83
|
chromosome 2 open reading frame 83 |
| chr10_-_79397479 | 1.65 |
ENST00000404771.3
|
KCNMA1
|
potassium large conductance calcium-activated channel, subfamily M, alpha member 1 |
| chr6_-_26043885 | 1.64 |
ENST00000357905.2
|
HIST1H2BB
|
histone cluster 1, H2bb |
| chr16_-_21436459 | 1.58 |
ENST00000448012.2
ENST00000504841.2 ENST00000419180.2 |
NPIPB3
|
nuclear pore complex interacting protein family, member B3 |
| chr6_+_146348810 | 1.52 |
ENST00000492807.2
|
GRM1
|
glutamate receptor, metabotropic 1 |
| chr5_+_175490540 | 1.51 |
ENST00000515817.1
|
FAM153B
|
family with sequence similarity 153, member B |
| chr20_+_54987305 | 1.48 |
ENST00000371336.3
ENST00000434344.1 |
CASS4
|
Cas scaffolding protein family member 4 |
| chr22_-_19137796 | 1.48 |
ENST00000086933.2
|
GSC2
|
goosecoid homeobox 2 |
| chr20_+_54987168 | 1.46 |
ENST00000360314.3
|
CASS4
|
Cas scaffolding protein family member 4 |
| chr21_-_43735446 | 1.41 |
ENST00000398431.2
|
TFF3
|
trefoil factor 3 (intestinal) |
| chr6_+_52051171 | 1.32 |
ENST00000340057.1
|
IL17A
|
interleukin 17A |
| chrY_-_24038660 | 1.30 |
ENST00000382677.3
|
RBMY1D
|
RNA binding motif protein, Y-linked, family 1, member D |
| chr3_-_53916202 | 1.20 |
ENST00000335754.3
|
ACTR8
|
ARP8 actin-related protein 8 homolog (yeast) |
| chr12_-_11091862 | 1.18 |
ENST00000537503.1
|
TAS2R14
|
taste receptor, type 2, member 14 |
| chrX_-_118699325 | 1.18 |
ENST00000320339.4
ENST00000371594.4 ENST00000536133.1 |
CXorf56
|
chromosome X open reading frame 56 |
| chr2_-_77749474 | 1.11 |
ENST00000409093.1
ENST00000409088.3 |
LRRTM4
|
leucine rich repeat transmembrane neuronal 4 |
| chr1_+_159557607 | 1.11 |
ENST00000255040.2
|
APCS
|
amyloid P component, serum |
| chr12_-_28123206 | 1.07 |
ENST00000542963.1
ENST00000535992.1 |
PTHLH
|
parathyroid hormone-like hormone |
| chr12_-_10978957 | 1.07 |
ENST00000240619.2
|
TAS2R10
|
taste receptor, type 2, member 10 |
| chr5_+_140201183 | 1.05 |
ENST00000529619.1
ENST00000529859.1 ENST00000378126.3 |
PCDHA5
|
protocadherin alpha 5 |
| chr8_+_1993152 | 1.04 |
ENST00000262113.4
|
MYOM2
|
myomesin 2 |
| chr9_-_99382065 | 1.01 |
ENST00000265659.2
ENST00000375241.1 ENST00000375236.1 |
CDC14B
|
cell division cycle 14B |
| chrY_+_23698778 | 0.94 |
ENST00000303902.5
|
RBMY1A1
|
RNA binding motif protein, Y-linked, family 1, member A1 |
| chr16_+_28648975 | 0.90 |
ENST00000529716.1
|
NPIPB8
|
nuclear pore complex interacting protein family, member B8 |
| chr10_+_52094298 | 0.81 |
ENST00000595931.1
|
AC069547.1
|
HCG1745369; PRO3073; Uncharacterized protein |
| chr21_-_43735628 | 0.77 |
ENST00000291525.10
ENST00000518498.1 |
TFF3
|
trefoil factor 3 (intestinal) |
| chr13_-_46679185 | 0.75 |
ENST00000439329.3
|
CPB2
|
carboxypeptidase B2 (plasma) |
| chr13_-_46679144 | 0.75 |
ENST00000181383.4
|
CPB2
|
carboxypeptidase B2 (plasma) |
| chr4_-_123377880 | 0.74 |
ENST00000226730.4
|
IL2
|
interleukin 2 |
| chr16_+_22524844 | 0.67 |
ENST00000538606.1
ENST00000424340.1 ENST00000517539.1 ENST00000528249.1 |
NPIPB5
|
nuclear pore complex interacting protein family, member B5 |
| chr4_-_13546632 | 0.66 |
ENST00000382438.5
|
NKX3-2
|
NK3 homeobox 2 |
| chr20_-_4990931 | 0.62 |
ENST00000379333.1
|
SLC23A2
|
solute carrier family 23 (ascorbic acid transporter), member 2 |
| chr1_+_63063152 | 0.59 |
ENST00000371129.3
|
ANGPTL3
|
angiopoietin-like 3 |
| chr12_-_121476750 | 0.59 |
ENST00000543677.1
|
OASL
|
2'-5'-oligoadenylate synthetase-like |
| chr8_+_24241969 | 0.58 |
ENST00000522298.1
|
ADAMDEC1
|
ADAM-like, decysin 1 |
| chr16_-_21868978 | 0.57 |
ENST00000357370.5
ENST00000451409.1 ENST00000341400.7 ENST00000518761.4 |
NPIPB4
|
nuclear pore complex interacting protein family, member B4 |
| chr19_+_3136115 | 0.49 |
ENST00000262958.3
|
GNA15
|
guanine nucleotide binding protein (G protein), alpha 15 (Gq class) |
| chr8_+_24241789 | 0.37 |
ENST00000256412.4
ENST00000538205.1 |
ADAMDEC1
|
ADAM-like, decysin 1 |
| chr8_+_1993173 | 0.33 |
ENST00000523438.1
|
MYOM2
|
myomesin 2 |
| chr11_+_30253410 | 0.32 |
ENST00000533718.1
|
FSHB
|
follicle stimulating hormone, beta polypeptide |
| chr19_-_1650666 | 0.26 |
ENST00000588136.1
|
TCF3
|
transcription factor 3 |
| chr8_+_32579341 | 0.19 |
ENST00000519240.1
ENST00000539990.1 |
NRG1
|
neuregulin 1 |
| chr16_-_21868739 | 0.18 |
ENST00000415645.2
|
NPIPB4
|
nuclear pore complex interacting protein family, member B4 |
| chr2_+_177134201 | 0.18 |
ENST00000452865.1
|
MTX2
|
metaxin 2 |
| chr3_-_111314230 | 0.14 |
ENST00000317012.4
|
ZBED2
|
zinc finger, BED-type containing 2 |
| chr4_+_74301880 | 0.03 |
ENST00000395792.2
ENST00000226359.2 |
AFP
|
alpha-fetoprotein |
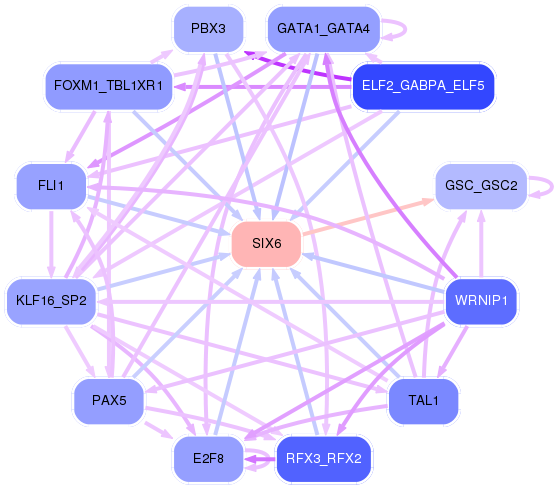
Network of associatons between targets according to the STRING database.

First level regulatory network of SIX6
Gene Ontology Analysis
Gene overrepresentation in biological_process category:
| Log-likelihood per target | Total log-likelihood | Term | Description |
|---|---|---|---|
| 3.4 | 10.3 | GO:0036371 | protein localization to M-band(GO:0036309) protein localization to T-tubule(GO:0036371) |
| 2.4 | 7.1 | GO:0071529 | cementum mineralization(GO:0071529) |
| 1.9 | 5.6 | GO:0021678 | midbrain-hindbrain boundary morphogenesis(GO:0021555) fourth ventricle development(GO:0021592) third ventricle development(GO:0021678) |
| 1.4 | 11.3 | GO:0006689 | ganglioside catabolic process(GO:0006689) |
| 1.3 | 6.3 | GO:0072233 | thick ascending limb development(GO:0072023) metanephric thick ascending limb development(GO:0072233) |
| 1.1 | 3.2 | GO:1902161 | positive regulation of cyclic nucleotide-gated ion channel activity(GO:1902161) |
| 0.9 | 4.7 | GO:0033314 | mitotic DNA replication checkpoint(GO:0033314) |
| 0.9 | 2.7 | GO:0032304 | negative regulation of icosanoid secretion(GO:0032304) |
| 0.9 | 2.6 | GO:1903487 | regulation of lactation(GO:1903487) |
| 0.8 | 4.8 | GO:1903301 | fructose 2,6-bisphosphate metabolic process(GO:0006003) positive regulation of glucokinase activity(GO:0033133) positive regulation of hexokinase activity(GO:1903301) |
| 0.7 | 2.2 | GO:2000296 | negative regulation of hydrogen peroxide catabolic process(GO:2000296) |
| 0.6 | 6.5 | GO:0032000 | positive regulation of fatty acid beta-oxidation(GO:0032000) |
| 0.6 | 1.9 | GO:0060620 | regulation of cholesterol import(GO:0060620) negative regulation of cholesterol import(GO:0060621) regulation of sterol import(GO:2000909) negative regulation of sterol import(GO:2000910) |
| 0.6 | 4.5 | GO:0099566 | regulation of postsynaptic cytosolic calcium ion concentration(GO:0099566) |
| 0.5 | 1.6 | GO:0015888 | thiamine transport(GO:0015888) thiamine transmembrane transport(GO:0071934) |
| 0.5 | 2.6 | GO:0002361 | CD4-positive, CD25-positive, alpha-beta regulatory T cell differentiation(GO:0002361) |
| 0.5 | 5.0 | GO:0010898 | positive regulation of triglyceride catabolic process(GO:0010898) |
| 0.5 | 9.2 | GO:0033141 | positive regulation of peptidyl-serine phosphorylation of STAT protein(GO:0033141) |
| 0.4 | 3.7 | GO:0032534 | regulation of microvillus assembly(GO:0032534) |
| 0.4 | 1.9 | GO:0006651 | diacylglycerol biosynthetic process(GO:0006651) |
| 0.4 | 1.5 | GO:0003331 | regulation of extracellular matrix constituent secretion(GO:0003330) positive regulation of extracellular matrix constituent secretion(GO:0003331) |
| 0.4 | 4.4 | GO:0048194 | Golgi vesicle budding(GO:0048194) |
| 0.3 | 1.3 | GO:0032747 | positive regulation of interleukin-23 production(GO:0032747) |
| 0.3 | 7.7 | GO:0070886 | positive regulation of calcineurin-NFAT signaling cascade(GO:0070886) |
| 0.3 | 3.3 | GO:0035457 | cellular response to interferon-alpha(GO:0035457) |
| 0.2 | 0.7 | GO:2000320 | negative regulation of T-helper 17 type immune response(GO:2000317) negative regulation of T-helper 17 cell differentiation(GO:2000320) |
| 0.2 | 4.6 | GO:0032012 | regulation of ARF protein signal transduction(GO:0032012) |
| 0.2 | 1.9 | GO:0001574 | ganglioside biosynthetic process(GO:0001574) |
| 0.2 | 4.2 | GO:0007342 | fusion of sperm to egg plasma membrane(GO:0007342) |
| 0.2 | 2.2 | GO:0043152 | induction of bacterial agglutination(GO:0043152) |
| 0.2 | 1.1 | GO:0052199 | negative regulation of catalytic activity in other organism involved in symbiotic interaction(GO:0052199) |
| 0.2 | 14.1 | GO:0042267 | natural killer cell mediated cytotoxicity(GO:0042267) |
| 0.2 | 1.4 | GO:0002074 | extraocular skeletal muscle development(GO:0002074) |
| 0.1 | 1.6 | GO:0034465 | response to carbon monoxide(GO:0034465) |
| 0.1 | 2.7 | GO:0006883 | cellular sodium ion homeostasis(GO:0006883) |
| 0.1 | 2.3 | GO:0070286 | axonemal dynein complex assembly(GO:0070286) |
| 0.1 | 3.9 | GO:0048741 | skeletal muscle fiber development(GO:0048741) |
| 0.1 | 0.6 | GO:0035461 | vitamin transmembrane transport(GO:0035461) |
| 0.1 | 0.6 | GO:0010519 | negative regulation of phospholipase activity(GO:0010519) |
| 0.1 | 2.3 | GO:0001580 | detection of chemical stimulus involved in sensory perception of bitter taste(GO:0001580) |
| 0.1 | 2.3 | GO:0030488 | tRNA methylation(GO:0030488) |
| 0.1 | 0.5 | GO:0007207 | phospholipase C-activating G-protein coupled acetylcholine receptor signaling pathway(GO:0007207) |
| 0.1 | 3.3 | GO:0048791 | calcium ion-regulated exocytosis of neurotransmitter(GO:0048791) |
| 0.1 | 3.4 | GO:0070306 | lens fiber cell differentiation(GO:0070306) |
| 0.1 | 2.6 | GO:0045063 | T-helper 1 cell differentiation(GO:0045063) |
| 0.1 | 2.2 | GO:0009083 | branched-chain amino acid catabolic process(GO:0009083) |
| 0.1 | 8.2 | GO:0032436 | positive regulation of proteasomal ubiquitin-dependent protein catabolic process(GO:0032436) |
| 0.1 | 1.0 | GO:0051256 | mitotic spindle midzone assembly(GO:0051256) |
| 0.1 | 0.3 | GO:0002326 | B cell lineage commitment(GO:0002326) |
| 0.1 | 0.7 | GO:0060576 | intestinal epithelial cell development(GO:0060576) |
| 0.1 | 4.3 | GO:0045071 | negative regulation of viral genome replication(GO:0045071) |
| 0.1 | 0.3 | GO:0060011 | Sertoli cell proliferation(GO:0060011) |
| 0.1 | 16.7 | GO:0090305 | nucleic acid phosphodiester bond hydrolysis(GO:0090305) |
| 0.0 | 2.4 | GO:0048260 | positive regulation of receptor-mediated endocytosis(GO:0048260) |
| 0.0 | 1.0 | GO:0032331 | negative regulation of chondrocyte differentiation(GO:0032331) |
| 0.0 | 2.1 | GO:0015914 | phospholipid transport(GO:0015914) |
| 0.0 | 4.1 | GO:1902476 | chloride transmembrane transport(GO:1902476) |
| 0.0 | 6.0 | GO:0060271 | cilium morphogenesis(GO:0060271) |
| 0.0 | 3.5 | GO:0051438 | regulation of ubiquitin-protein transferase activity(GO:0051438) |
| 0.0 | 1.1 | GO:1904893 | negative regulation of JAK-STAT cascade(GO:0046426) negative regulation of STAT cascade(GO:1904893) |
| 0.0 | 14.8 | GO:0007420 | brain development(GO:0007420) |
| 0.0 | 0.9 | GO:0000381 | regulation of alternative mRNA splicing, via spliceosome(GO:0000381) |
| 0.0 | 1.6 | GO:0006334 | nucleosome assembly(GO:0006334) |
Gene overrepresentation in cellular_component category:
| Log-likelihood per target | Total log-likelihood | Term | Description |
|---|---|---|---|
| 1.2 | 7.1 | GO:0065010 | extracellular membrane-bounded organelle(GO:0065010) |
| 1.1 | 4.5 | GO:0038038 | G-protein coupled receptor homodimeric complex(GO:0038038) |
| 0.8 | 6.5 | GO:0045179 | apical cortex(GO:0045179) |
| 0.6 | 3.2 | GO:0031205 | endoplasmic reticulum Sec complex(GO:0031205) |
| 0.5 | 2.2 | GO:0031838 | haptoglobin-hemoglobin complex(GO:0031838) |
| 0.4 | 2.2 | GO:0005947 | mitochondrial alpha-ketoglutarate dehydrogenase complex(GO:0005947) |
| 0.3 | 1.9 | GO:0032311 | angiogenin-PRI complex(GO:0032311) |
| 0.3 | 2.7 | GO:0005579 | membrane attack complex(GO:0005579) |
| 0.2 | 4.1 | GO:0042589 | zymogen granule membrane(GO:0042589) |
| 0.2 | 11.7 | GO:0031430 | M band(GO:0031430) |
| 0.2 | 2.2 | GO:0005577 | fibrinogen complex(GO:0005577) |
| 0.1 | 4.3 | GO:0005868 | cytoplasmic dynein complex(GO:0005868) |
| 0.1 | 1.9 | GO:0034366 | spherical high-density lipoprotein particle(GO:0034366) |
| 0.1 | 5.6 | GO:0031519 | PcG protein complex(GO:0031519) |
| 0.1 | 3.2 | GO:0032391 | photoreceptor connecting cilium(GO:0032391) |
| 0.1 | 4.1 | GO:0000786 | nucleosome(GO:0000786) |
| 0.1 | 6.3 | GO:0060170 | ciliary membrane(GO:0060170) |
| 0.1 | 1.2 | GO:0033202 | Ino80 complex(GO:0031011) DNA helicase complex(GO:0033202) |
| 0.0 | 4.4 | GO:0032580 | Golgi cisterna membrane(GO:0032580) |
| 0.0 | 2.6 | GO:0005903 | brush border(GO:0005903) |
| 0.0 | 0.6 | GO:0009925 | basal plasma membrane(GO:0009925) |
| 0.0 | 10.1 | GO:0031012 | extracellular matrix(GO:0031012) |
| 0.0 | 1.6 | GO:0005901 | caveola(GO:0005901) |
| 0.0 | 1.3 | GO:0009897 | external side of plasma membrane(GO:0009897) |
| 0.0 | 2.7 | GO:0005789 | endoplasmic reticulum membrane(GO:0005789) |
| 0.0 | 0.5 | GO:0005834 | heterotrimeric G-protein complex(GO:0005834) |
| 0.0 | 1.0 | GO:0072686 | mitotic spindle(GO:0072686) |
| 0.0 | 49.1 | GO:0016021 | integral component of membrane(GO:0016021) |
Gene overrepresentation in molecular_function category:
| Log-likelihood per target | Total log-likelihood | Term | Description |
|---|---|---|---|
| 2.8 | 11.3 | GO:0052795 | exo-alpha-(2->3)-sialidase activity(GO:0052794) exo-alpha-(2->6)-sialidase activity(GO:0052795) exo-alpha-(2->8)-sialidase activity(GO:0052796) |
| 1.1 | 3.2 | GO:0005260 | channel-conductance-controlling ATPase activity(GO:0005260) |
| 1.0 | 7.1 | GO:0004035 | alkaline phosphatase activity(GO:0004035) |
| 1.0 | 4.8 | GO:0070095 | fructose-6-phosphate binding(GO:0070095) |
| 0.9 | 6.5 | GO:0005324 | long-chain fatty acid transporter activity(GO:0005324) |
| 0.9 | 2.7 | GO:0097258 | tocopherol omega-hydroxylase activity(GO:0052870) alpha-tocopherol omega-hydroxylase activity(GO:0052871) 20-hydroxy-leukotriene B4 omega oxidase activity(GO:0097258) 20-aldehyde-leukotriene B4 20-monooxygenase activity(GO:0097259) |
| 0.8 | 4.7 | GO:0010997 | anaphase-promoting complex binding(GO:0010997) |
| 0.7 | 2.2 | GO:0003863 | alpha-ketoacid dehydrogenase activity(GO:0003826) 3-methyl-2-oxobutanoate dehydrogenase (2-methylpropanoyl-transferring) activity(GO:0003863) |
| 0.7 | 5.6 | GO:0051864 | histone demethylase activity (H3-K36 specific)(GO:0051864) |
| 0.7 | 9.2 | GO:0005132 | type I interferon receptor binding(GO:0005132) |
| 0.6 | 4.5 | GO:0099583 | neurotransmitter receptor activity involved in regulation of postsynaptic cytosolic calcium ion concentration(GO:0099583) |
| 0.5 | 1.6 | GO:0015403 | thiamine transmembrane transporter activity(GO:0015234) thiamine uptake transmembrane transporter activity(GO:0015403) |
| 0.5 | 1.9 | GO:0070653 | high-density lipoprotein particle receptor binding(GO:0070653) |
| 0.5 | 2.3 | GO:0016427 | tRNA (cytosine) methyltransferase activity(GO:0016427) |
| 0.4 | 4.3 | GO:0001730 | 2'-5'-oligoadenylate synthetase activity(GO:0001730) |
| 0.4 | 2.2 | GO:0030109 | HLA-B specific inhibitory MHC class I receptor activity(GO:0030109) |
| 0.4 | 2.2 | GO:0030492 | hemoglobin binding(GO:0030492) |
| 0.3 | 6.3 | GO:0019864 | IgG binding(GO:0019864) |
| 0.3 | 1.9 | GO:0004522 | ribonuclease A activity(GO:0004522) |
| 0.3 | 1.9 | GO:0003828 | alpha-N-acetylneuraminate alpha-2,8-sialyltransferase activity(GO:0003828) |
| 0.3 | 4.1 | GO:0005229 | intracellular calcium activated chloride channel activity(GO:0005229) |
| 0.2 | 8.2 | GO:0031624 | ubiquitin conjugating enzyme binding(GO:0031624) |
| 0.2 | 1.6 | GO:0060072 | large conductance calcium-activated potassium channel activity(GO:0060072) |
| 0.2 | 2.1 | GO:0008526 | phosphatidylinositol transporter activity(GO:0008526) |
| 0.2 | 10.3 | GO:0030507 | spectrin binding(GO:0030507) |
| 0.2 | 0.6 | GO:0008523 | sodium-dependent multivitamin transmembrane transporter activity(GO:0008523) |
| 0.2 | 2.3 | GO:0033038 | bitter taste receptor activity(GO:0033038) |
| 0.2 | 5.0 | GO:0004806 | triglyceride lipase activity(GO:0004806) |
| 0.2 | 4.6 | GO:0005086 | ARF guanyl-nucleotide exchange factor activity(GO:0005086) |
| 0.2 | 21.9 | GO:0004519 | endonuclease activity(GO:0004519) |
| 0.2 | 2.6 | GO:0038191 | neuropilin binding(GO:0038191) |
| 0.1 | 0.7 | GO:0005134 | interleukin-2 receptor binding(GO:0005134) |
| 0.1 | 2.3 | GO:0070273 | phosphatidylinositol-4-phosphate binding(GO:0070273) |
| 0.1 | 4.2 | GO:0030159 | receptor signaling complex scaffold activity(GO:0030159) |
| 0.1 | 3.4 | GO:0005212 | structural constituent of eye lens(GO:0005212) |
| 0.1 | 2.6 | GO:0043395 | heparan sulfate proteoglycan binding(GO:0043395) |
| 0.1 | 0.8 | GO:0046790 | virion binding(GO:0046790) |
| 0.1 | 4.3 | GO:0051082 | unfolded protein binding(GO:0051082) |
| 0.1 | 3.3 | GO:0005544 | calcium-dependent phospholipid binding(GO:0005544) |
| 0.1 | 1.4 | GO:0097493 | muscle alpha-actinin binding(GO:0051371) structural molecule activity conferring elasticity(GO:0097493) |
| 0.1 | 0.3 | GO:0070644 | vitamin D response element binding(GO:0070644) |
| 0.1 | 1.5 | GO:0004181 | metallocarboxypeptidase activity(GO:0004181) |
| 0.0 | 2.6 | GO:0005044 | scavenger receptor activity(GO:0005044) |
| 0.0 | 4.1 | GO:0003730 | mRNA 3'-UTR binding(GO:0003730) |
| 0.0 | 1.0 | GO:0051428 | peptide hormone receptor binding(GO:0051428) |
| 0.0 | 0.6 | GO:0004859 | phospholipase inhibitor activity(GO:0004859) |
| 0.0 | 1.0 | GO:0008138 | protein tyrosine/serine/threonine phosphatase activity(GO:0008138) |
| 0.0 | 0.5 | GO:0031683 | G-protein beta/gamma-subunit complex binding(GO:0031683) |
| 0.0 | 0.2 | GO:0005176 | ErbB-2 class receptor binding(GO:0005176) |
| 0.0 | 2.4 | GO:0008201 | heparin binding(GO:0008201) |
Gene overrepresentation in C2:CP category:
| Log-likelihood per target | Total log-likelihood | Term | Description |
|---|---|---|---|
| 0.1 | 5.7 | PID PLK1 PATHWAY | PLK1 signaling events |
| 0.1 | 2.1 | PID IL27 PATHWAY | IL27-mediated signaling events |
| 0.0 | 2.2 | PID INTEGRIN2 PATHWAY | Beta2 integrin cell surface interactions |
| 0.0 | 3.2 | PID CD8 TCR DOWNSTREAM PATHWAY | Downstream signaling in naïve CD8+ T cells |
| 0.0 | 0.5 | PID THROMBIN PAR4 PATHWAY | PAR4-mediated thrombin signaling events |
| 0.0 | 1.0 | PID HEDGEHOG 2PATHWAY | Signaling events mediated by the Hedgehog family |
| 0.0 | 2.6 | PID PTP1B PATHWAY | Signaling events mediated by PTP1B |
| 0.0 | 2.2 | PID IL4 2PATHWAY | IL4-mediated signaling events |
| 0.0 | 6.8 | NABA SECRETED FACTORS | Genes encoding secreted soluble factors |
| 0.0 | 2.2 | PID MYC ACTIV PATHWAY | Validated targets of C-MYC transcriptional activation |
| 0.0 | 2.6 | NABA ECM AFFILIATED | Genes encoding proteins affiliated structurally or functionally to extracellular matrix proteins |
| 0.0 | 3.5 | NABA ECM REGULATORS | Genes encoding enzymes and their regulators involved in the remodeling of the extracellular matrix |
Gene overrepresentation in C2:CP:REACTOME category:
| Log-likelihood per target | Total log-likelihood | Term | Description |
|---|---|---|---|
| 0.2 | 4.5 | REACTOME CLASS C 3 METABOTROPIC GLUTAMATE PHEROMONE RECEPTORS | Genes involved in Class C/3 (Metabotropic glutamate/pheromone receptors) |
| 0.2 | 11.3 | REACTOME GLYCOSPHINGOLIPID METABOLISM | Genes involved in Glycosphingolipid metabolism |
| 0.2 | 2.6 | REACTOME ACYL CHAIN REMODELLING OF PG | Genes involved in Acyl chain remodelling of PG |
| 0.1 | 2.2 | REACTOME COMMON PATHWAY | Genes involved in Common Pathway |
| 0.1 | 6.3 | REACTOME PACKAGING OF TELOMERE ENDS | Genes involved in Packaging Of Telomere Ends |
| 0.1 | 2.4 | REACTOME APOPTOSIS INDUCED DNA FRAGMENTATION | Genes involved in Apoptosis induced DNA fragmentation |
| 0.1 | 10.8 | REACTOME INTERFERON ALPHA BETA SIGNALING | Genes involved in Interferon alpha/beta signaling |
| 0.1 | 3.7 | REACTOME TRANSCRIPTIONAL REGULATION OF WHITE ADIPOCYTE DIFFERENTIATION | Genes involved in Transcriptional Regulation of White Adipocyte Differentiation |
| 0.1 | 2.6 | REACTOME OTHER SEMAPHORIN INTERACTIONS | Genes involved in Other semaphorin interactions |
| 0.1 | 4.8 | REACTOME GLYCOLYSIS | Genes involved in Glycolysis |
| 0.1 | 3.2 | REACTOME ABC FAMILY PROTEINS MEDIATED TRANSPORT | Genes involved in ABC-family proteins mediated transport |
| 0.1 | 1.9 | REACTOME CHYLOMICRON MEDIATED LIPID TRANSPORT | Genes involved in Chylomicron-mediated lipid transport |
| 0.1 | 2.2 | REACTOME BRANCHED CHAIN AMINO ACID CATABOLISM | Genes involved in Branched-chain amino acid catabolism |
| 0.1 | 1.5 | REACTOME N GLYCAN ANTENNAE ELONGATION | Genes involved in N-Glycan antennae elongation |
| 0.0 | 2.4 | REACTOME COMPLEMENT CASCADE | Genes involved in Complement cascade |
| 0.0 | 2.7 | REACTOME CYTOCHROME P450 ARRANGED BY SUBSTRATE TYPE | Genes involved in Cytochrome P450 - arranged by substrate type |
| 0.0 | 6.5 | REACTOME PPARA ACTIVATES GENE EXPRESSION | Genes involved in PPARA Activates Gene Expression |
| 0.0 | 0.5 | REACTOME REGULATION OF INSULIN SECRETION BY ACETYLCHOLINE | Genes involved in Regulation of Insulin Secretion by Acetylcholine |
| 0.0 | 2.8 | REACTOME NUCLEAR SIGNALING BY ERBB4 | Genes involved in Nuclear signaling by ERBB4 |
| 0.0 | 3.8 | REACTOME PEPTIDE CHAIN ELONGATION | Genes involved in Peptide chain elongation |
| 0.0 | 0.3 | REACTOME GLYCOPROTEIN HORMONES | Genes involved in Glycoprotein hormones |
| 0.0 | 1.1 | REACTOME AMYLOIDS | Genes involved in Amyloids |
| 0.0 | 0.7 | REACTOME IL RECEPTOR SHC SIGNALING | Genes involved in Interleukin receptor SHC signaling |
| 0.0 | 1.1 | REACTOME IMMUNOREGULATORY INTERACTIONS BETWEEN A LYMPHOID AND A NON LYMPHOID CELL | Genes involved in Immunoregulatory interactions between a Lymphoid and a non-Lymphoid cell |