Project
GNF SymAtlas + NCI-60 cancer cell lines, comparison of cancers vs non-cancers, human (Su, 2004; Ross, 2000)
Navigation
Downloads
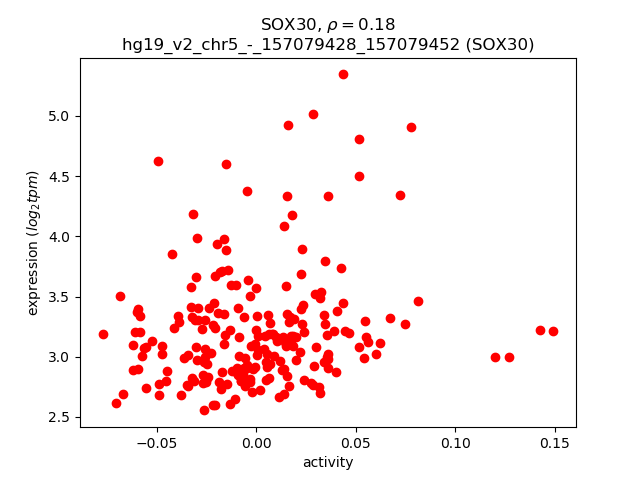
Results for SOX30
Z-value: 0.13
Motif logo

Transcription factors associated with SOX30
| Gene Symbol | Gene ID | Gene Info |
|---|---|---|
|
SOX30
|
ENSG00000039600.6 | SRY-box transcription factor 30 |
Activity-expression correlation:
| Gene | Promoter | Pearson corr. coef. | P-value | Plot |
|---|---|---|---|---|
| SOX30 | hg19_v2_chr5_-_157079428_157079452, hg19_v2_chr5_-_157079372_157079395 | 0.18 | 6.9e-03 | Click! |
Activity profile of SOX30 motif
Sorted Z-values of SOX30 motif
| Promoter | Log-likelihood | Transcript | Gene | Gene Info |
|---|---|---|---|---|
| chr12_+_11081828 | 12.48 |
ENST00000381847.3
ENST00000396400.3 |
PRH2
|
proline-rich protein HaeIII subfamily 2 |
| chr12_-_11036844 | 12.28 |
ENST00000428168.2
|
PRH1
|
proline-rich protein HaeIII subfamily 1 |
| chr12_-_11548496 | 12.25 |
ENST00000389362.4
ENST00000565533.1 ENST00000546254.1 |
PRB2
PRB1
|
proline-rich protein BstNI subfamily 2 proline-rich protein BstNI subfamily 1 |
| chr12_-_11508520 | 11.33 |
ENST00000545626.1
ENST00000500254.2 |
PRB1
|
proline-rich protein BstNI subfamily 1 |
| chr12_-_11463353 | 10.69 |
ENST00000279575.1
ENST00000535904.1 ENST00000445719.2 |
PRB4
|
proline-rich protein BstNI subfamily 4 |
| chr12_-_11002063 | 9.87 |
ENST00000544994.1
ENST00000228811.4 ENST00000540107.1 |
PRR4
|
proline rich 4 (lacrimal) |
| chr12_-_11422630 | 7.13 |
ENST00000381842.3
ENST00000538488.1 |
PRB3
|
proline-rich protein BstNI subfamily 3 |
| chr12_-_11422739 | 6.75 |
ENST00000279573.7
|
PRB3
|
proline-rich protein BstNI subfamily 3 |
| chr1_+_244998602 | 5.28 |
ENST00000411948.2
|
COX20
|
COX20 cytochrome C oxidase assembly factor |
| chr6_-_134639180 | 4.91 |
ENST00000367858.5
|
SGK1
|
serum/glucocorticoid regulated kinase 1 |
| chr5_+_140739537 | 4.79 |
ENST00000522605.1
|
PCDHGB2
|
protocadherin gamma subfamily B, 2 |
| chr5_+_140729649 | 4.59 |
ENST00000523390.1
|
PCDHGB1
|
protocadherin gamma subfamily B, 1 |
| chr5_+_140772381 | 4.28 |
ENST00000398604.2
|
PCDHGA8
|
protocadherin gamma subfamily A, 8 |
| chr1_-_201476274 | 4.01 |
ENST00000340006.2
|
CSRP1
|
cysteine and glycine-rich protein 1 |
| chr5_+_66254698 | 4.00 |
ENST00000405643.1
ENST00000407621.1 ENST00000432426.1 |
MAST4
|
microtubule associated serine/threonine kinase family member 4 |
| chr6_+_126240442 | 3.32 |
ENST00000448104.1
ENST00000438495.1 ENST00000444128.1 |
NCOA7
|
nuclear receptor coactivator 7 |
| chr10_+_35415978 | 2.61 |
ENST00000429130.3
ENST00000469949.2 ENST00000460270.1 |
CREM
|
cAMP responsive element modulator |
| chr10_+_35415719 | 2.60 |
ENST00000474362.1
ENST00000374721.3 |
CREM
|
cAMP responsive element modulator |
| chr14_+_101299520 | 2.57 |
ENST00000455531.1
|
MEG3
|
maternally expressed 3 (non-protein coding) |
| chr7_+_100770328 | 2.45 |
ENST00000223095.4
ENST00000445463.2 |
SERPINE1
|
serpin peptidase inhibitor, clade E (nexin, plasminogen activator inhibitor type 1), member 1 |
| chr4_-_176733897 | 2.44 |
ENST00000393658.2
|
GPM6A
|
glycoprotein M6A |
| chr6_-_49712123 | 2.37 |
ENST00000263045.4
|
CRISP3
|
cysteine-rich secretory protein 3 |
| chr5_-_141338627 | 2.37 |
ENST00000231484.3
|
PCDH12
|
protocadherin 12 |
| chr18_+_7946941 | 2.36 |
ENST00000444013.1
|
PTPRM
|
protein tyrosine phosphatase, receptor type, M |
| chr10_+_70480963 | 2.35 |
ENST00000265872.6
ENST00000535016.1 ENST00000538031.1 ENST00000543719.1 ENST00000539539.1 ENST00000543225.1 ENST00000536012.1 ENST00000494903.2 |
CCAR1
|
cell division cycle and apoptosis regulator 1 |
| chr11_+_125365110 | 2.13 |
ENST00000527818.1
|
AP000708.1
|
AP000708.1 |
| chr10_+_35416090 | 2.07 |
ENST00000354759.3
|
CREM
|
cAMP responsive element modulator |
| chr1_-_243418621 | 1.97 |
ENST00000366544.1
ENST00000366543.1 |
CEP170
|
centrosomal protein 170kDa |
| chr10_+_35416223 | 1.81 |
ENST00000489321.1
ENST00000427847.2 ENST00000345491.3 ENST00000395895.2 ENST00000374728.3 ENST00000487132.1 |
CREM
|
cAMP responsive element modulator |
| chr7_-_82792215 | 1.73 |
ENST00000333891.9
ENST00000423517.2 |
PCLO
|
piccolo presynaptic cytomatrix protein |
| chr5_-_160279207 | 1.67 |
ENST00000327245.5
|
ATP10B
|
ATPase, class V, type 10B |
| chr11_-_75236867 | 1.63 |
ENST00000376282.3
ENST00000336898.3 |
GDPD5
|
glycerophosphodiester phosphodiesterase domain containing 5 |
| chr22_-_43485381 | 1.60 |
ENST00000331018.7
ENST00000266254.7 ENST00000445824.1 |
TTLL1
|
tubulin tyrosine ligase-like family, member 1 |
| chr1_+_93913713 | 1.57 |
ENST00000604705.1
ENST00000370253.2 |
FNBP1L
|
formin binding protein 1-like |
| chr6_+_22146851 | 1.44 |
ENST00000606197.1
|
CASC15
|
cancer susceptibility candidate 15 (non-protein coding) |
| chr8_+_105352050 | 1.39 |
ENST00000297581.2
|
DCSTAMP
|
dendrocyte expressed seven transmembrane protein |
| chr5_+_170288856 | 1.37 |
ENST00000523189.1
|
RANBP17
|
RAN binding protein 17 |
| chr1_-_243418344 | 1.37 |
ENST00000366542.1
|
CEP170
|
centrosomal protein 170kDa |
| chr6_-_11779014 | 1.35 |
ENST00000229583.5
|
ADTRP
|
androgen-dependent TFPI-regulating protein |
| chr12_-_10251603 | 1.35 |
ENST00000457018.2
|
CLEC1A
|
C-type lectin domain family 1, member A |
| chrY_+_15016013 | 1.35 |
ENST00000360160.4
ENST00000454054.1 |
DDX3Y
|
DEAD (Asp-Glu-Ala-Asp) box helicase 3, Y-linked |
| chr10_+_35484793 | 1.34 |
ENST00000488741.1
ENST00000474931.1 ENST00000468236.1 ENST00000344351.5 ENST00000490511.1 |
CREM
|
cAMP responsive element modulator |
| chr1_-_167883327 | 1.31 |
ENST00000476818.2
ENST00000367851.4 ENST00000367848.1 |
ADCY10
|
adenylate cyclase 10 (soluble) |
| chr12_-_10251576 | 1.30 |
ENST00000315330.4
|
CLEC1A
|
C-type lectin domain family 1, member A |
| chr2_-_157198860 | 1.29 |
ENST00000409572.1
|
NR4A2
|
nuclear receptor subfamily 4, group A, member 2 |
| chr9_+_103235365 | 1.28 |
ENST00000374879.4
|
TMEFF1
|
transmembrane protein with EGF-like and two follistatin-like domains 1 |
| chr3_-_8686479 | 1.19 |
ENST00000544814.1
ENST00000427408.1 |
SSUH2
|
ssu-2 homolog (C. elegans) |
| chr4_+_144303093 | 1.18 |
ENST00000505913.1
|
GAB1
|
GRB2-associated binding protein 1 |
| chr6_+_12290586 | 1.03 |
ENST00000379375.5
|
EDN1
|
endothelin 1 |
| chr11_-_102323740 | 0.98 |
ENST00000398136.2
|
TMEM123
|
transmembrane protein 123 |
| chr3_+_181429704 | 0.98 |
ENST00000431565.2
ENST00000325404.1 |
SOX2
|
SRY (sex determining region Y)-box 2 |
| chr4_-_87028478 | 0.97 |
ENST00000515400.1
ENST00000395157.3 |
MAPK10
|
mitogen-activated protein kinase 10 |
| chr14_-_90421028 | 0.94 |
ENST00000267544.9
ENST00000316738.7 ENST00000538485.2 ENST00000556609.1 |
EFCAB11
|
EF-hand calcium binding domain 11 |
| chr12_-_10251539 | 0.93 |
ENST00000420265.2
|
CLEC1A
|
C-type lectin domain family 1, member A |
| chr6_-_11779174 | 0.91 |
ENST00000379413.2
|
ADTRP
|
androgen-dependent TFPI-regulating protein |
| chr1_-_167883353 | 0.91 |
ENST00000545172.1
|
ADCY10
|
adenylate cyclase 10 (soluble) |
| chr14_-_90420862 | 0.90 |
ENST00000556005.1
ENST00000555872.1 |
EFCAB11
|
EF-hand calcium binding domain 11 |
| chr7_-_44229022 | 0.87 |
ENST00000403799.3
|
GCK
|
glucokinase (hexokinase 4) |
| chr11_-_102323489 | 0.84 |
ENST00000361236.3
|
TMEM123
|
transmembrane protein 123 |
| chr8_-_82024290 | 0.76 |
ENST00000220597.4
|
PAG1
|
phosphoprotein associated with glycosphingolipid microdomains 1 |
| chr19_-_17375541 | 0.74 |
ENST00000252597.3
|
USHBP1
|
Usher syndrome 1C binding protein 1 |
| chr3_-_57583130 | 0.74 |
ENST00000303436.6
|
ARF4
|
ADP-ribosylation factor 4 |
| chr2_-_162931052 | 0.71 |
ENST00000360534.3
|
DPP4
|
dipeptidyl-peptidase 4 |
| chr22_-_30970560 | 0.70 |
ENST00000402369.1
ENST00000406361.1 |
GAL3ST1
|
galactose-3-O-sulfotransferase 1 |
| chr8_+_24151553 | 0.60 |
ENST00000265769.4
ENST00000540823.1 ENST00000397649.3 |
ADAM28
|
ADAM metallopeptidase domain 28 |
| chr12_-_10282742 | 0.57 |
ENST00000298523.5
ENST00000396484.2 ENST00000310002.4 |
CLEC7A
|
C-type lectin domain family 7, member A |
| chr3_-_165555200 | 0.55 |
ENST00000479451.1
ENST00000540653.1 ENST00000488954.1 ENST00000264381.3 |
BCHE
|
butyrylcholinesterase |
| chr2_-_166060552 | 0.50 |
ENST00000283254.7
ENST00000453007.1 |
SCN3A
|
sodium channel, voltage-gated, type III, alpha subunit |
| chr2_-_166060571 | 0.45 |
ENST00000360093.3
|
SCN3A
|
sodium channel, voltage-gated, type III, alpha subunit |
| chr5_-_59481406 | 0.39 |
ENST00000546160.1
|
PDE4D
|
phosphodiesterase 4D, cAMP-specific |
| chr4_+_71457970 | 0.38 |
ENST00000322937.6
|
AMBN
|
ameloblastin (enamel matrix protein) |
| chr8_+_42195972 | 0.36 |
ENST00000532157.1
ENST00000265421.4 ENST00000520008.1 |
POLB
|
polymerase (DNA directed), beta |
| chr4_-_70725856 | 0.36 |
ENST00000226444.3
|
SULT1E1
|
sulfotransferase family 1E, estrogen-preferring, member 1 |
| chr5_+_140593509 | 0.31 |
ENST00000341948.4
|
PCDHB13
|
protocadherin beta 13 |
| chr22_+_31488433 | 0.31 |
ENST00000455608.1
|
SMTN
|
smoothelin |
| chr4_+_71458012 | 0.28 |
ENST00000449493.2
|
AMBN
|
ameloblastin (enamel matrix protein) |
| chr11_+_63137251 | 0.28 |
ENST00000310969.4
ENST00000279178.3 |
SLC22A9
|
solute carrier family 22 (organic anion transporter), member 9 |
| chr16_+_87636474 | 0.27 |
ENST00000284262.2
|
JPH3
|
junctophilin 3 |
| chr5_+_135468516 | 0.27 |
ENST00000507118.1
ENST00000511116.1 ENST00000545279.1 ENST00000545620.1 |
SMAD5
|
SMAD family member 5 |
| chr5_-_146461027 | 0.23 |
ENST00000394410.2
ENST00000508267.1 ENST00000504198.1 |
PPP2R2B
|
protein phosphatase 2, regulatory subunit B, beta |
| chr11_+_46402744 | 0.23 |
ENST00000533952.1
|
MDK
|
midkine (neurite growth-promoting factor 2) |
| chr7_-_107443652 | 0.19 |
ENST00000340010.5
ENST00000422236.2 ENST00000453332.1 |
SLC26A3
|
solute carrier family 26 (anion exchanger), member 3 |
| chr3_-_167191814 | 0.18 |
ENST00000466903.1
ENST00000264677.4 |
SERPINI2
|
serpin peptidase inhibitor, clade I (pancpin), member 2 |
| chr11_-_89224638 | 0.15 |
ENST00000535633.1
ENST00000263317.4 |
NOX4
|
NADPH oxidase 4 |
| chr8_+_24151620 | 0.14 |
ENST00000437154.2
|
ADAM28
|
ADAM metallopeptidase domain 28 |
| chr8_-_141810634 | 0.12 |
ENST00000521986.1
ENST00000523539.1 ENST00000538769.1 |
PTK2
|
protein tyrosine kinase 2 |
| chr2_-_37899323 | 0.11 |
ENST00000295324.3
ENST00000457889.1 |
CDC42EP3
|
CDC42 effector protein (Rho GTPase binding) 3 |
| chr16_+_4545853 | 0.09 |
ENST00000575129.1
ENST00000398595.3 ENST00000414777.1 |
HMOX2
|
heme oxygenase (decycling) 2 |
| chr1_-_26324534 | 0.07 |
ENST00000374284.1
ENST00000441420.1 ENST00000374282.3 |
PAFAH2
|
platelet-activating factor acetylhydrolase 2, 40kDa |
| chr7_-_142176790 | 0.06 |
ENST00000390369.2
|
TRBV7-4
|
T cell receptor beta variable 7-4 (gene/pseudogene) |
| chr4_+_113152978 | 0.06 |
ENST00000309703.6
|
AP1AR
|
adaptor-related protein complex 1 associated regulatory protein |
| chr1_-_200379180 | 0.05 |
ENST00000294740.3
|
ZNF281
|
zinc finger protein 281 |
| chr1_-_200379129 | 0.02 |
ENST00000367353.1
|
ZNF281
|
zinc finger protein 281 |
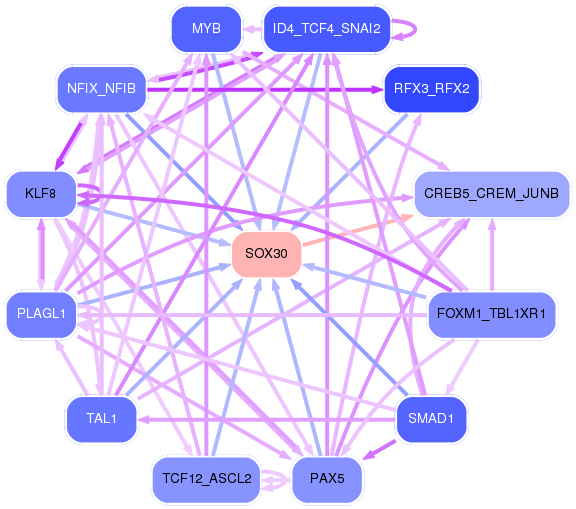
Network of associatons between targets according to the STRING database.

First level regulatory network of SOX30
Gene Ontology Analysis
Gene overrepresentation in biological_process category:
| Log-likelihood per target | Total log-likelihood | Term | Description |
|---|---|---|---|
| 0.8 | 2.4 | GO:2000097 | chronological cell aging(GO:0001300) regulation of smooth muscle cell-matrix adhesion(GO:2000097) |
| 0.7 | 4.9 | GO:0070294 | renal sodium ion absorption(GO:0070294) |
| 0.4 | 1.3 | GO:0021986 | epithalamus development(GO:0021538) habenula development(GO:0021986) |
| 0.4 | 5.3 | GO:0097034 | mitochondrial respiratory chain complex IV assembly(GO:0033617) mitochondrial respiratory chain complex IV biogenesis(GO:0097034) |
| 0.3 | 1.4 | GO:0072675 | multinuclear osteoclast differentiation(GO:0072674) osteoclast fusion(GO:0072675) |
| 0.3 | 1.0 | GO:0060585 | regulation of prostaglandin-endoperoxide synthase activity(GO:0060584) positive regulation of prostaglandin-endoperoxide synthase activity(GO:0060585) |
| 0.3 | 1.6 | GO:0018095 | protein polyglutamylation(GO:0018095) |
| 0.2 | 3.3 | GO:1902083 | negative regulation of peptidyl-cysteine S-nitrosylation(GO:1902083) |
| 0.2 | 13.9 | GO:0050829 | defense response to Gram-negative bacterium(GO:0050829) |
| 0.2 | 0.6 | GO:0014016 | neuroblast differentiation(GO:0014016) |
| 0.2 | 0.7 | GO:0036343 | psychomotor behavior(GO:0036343) |
| 0.2 | 1.0 | GO:0001714 | endodermal cell fate specification(GO:0001714) |
| 0.2 | 1.6 | GO:0048505 | regulation of development, heterochronic(GO:0040034) regulation of timing of cell differentiation(GO:0048505) |
| 0.2 | 10.4 | GO:0048384 | retinoic acid receptor signaling pathway(GO:0048384) |
| 0.1 | 9.9 | GO:0001895 | retina homeostasis(GO:0001895) |
| 0.1 | 2.2 | GO:0003351 | epithelial cilium movement(GO:0003351) |
| 0.1 | 1.6 | GO:0030050 | vesicle transport along actin filament(GO:0030050) |
| 0.1 | 0.9 | GO:0009730 | detection of carbohydrate stimulus(GO:0009730) detection of hexose stimulus(GO:0009732) detection of monosaccharide stimulus(GO:0034287) detection of glucose(GO:0051594) |
| 0.1 | 1.8 | GO:0045793 | positive regulation of cell size(GO:0045793) |
| 0.1 | 0.4 | GO:0006286 | base-excision repair, base-free sugar-phosphate removal(GO:0006286) |
| 0.1 | 1.0 | GO:0007258 | JUN phosphorylation(GO:0007258) |
| 0.1 | 0.4 | GO:0006711 | estrogen catabolic process(GO:0006711) |
| 0.1 | 16.8 | GO:0007156 | homophilic cell adhesion via plasma membrane adhesion molecules(GO:0007156) |
| 0.1 | 0.7 | GO:0045176 | apical protein localization(GO:0045176) |
| 0.1 | 0.7 | GO:0006682 | galactosylceramide biosynthetic process(GO:0006682) galactolipid biosynthetic process(GO:0019375) |
| 0.1 | 1.7 | GO:0034204 | lipid translocation(GO:0034204) phospholipid translocation(GO:0045332) |
| 0.0 | 4.0 | GO:0070527 | platelet aggregation(GO:0070527) |
| 0.0 | 2.4 | GO:0003407 | neural retina development(GO:0003407) |
| 0.0 | 0.3 | GO:0001880 | Mullerian duct regression(GO:0001880) |
| 0.0 | 0.4 | GO:0086024 | adrenergic receptor signaling pathway involved in positive regulation of heart rate(GO:0086024) |
| 0.0 | 0.2 | GO:0030421 | defecation(GO:0030421) |
| 0.0 | 1.2 | GO:0035728 | response to hepatocyte growth factor(GO:0035728) |
| 0.0 | 0.3 | GO:0015747 | urate transport(GO:0015747) |
| 0.0 | 0.1 | GO:0006788 | heme oxidation(GO:0006788) |
| 0.0 | 0.2 | GO:0019532 | oxalate transport(GO:0019532) |
| 0.0 | 1.7 | GO:0019933 | cAMP-mediated signaling(GO:0019933) |
| 0.0 | 0.1 | GO:0048203 | vesicle targeting, trans-Golgi to endosome(GO:0048203) |
| 0.0 | 1.4 | GO:0006611 | protein export from nucleus(GO:0006611) |
| 0.0 | 1.0 | GO:0019228 | neuronal action potential(GO:0019228) |
| 0.0 | 0.1 | GO:0038007 | netrin-activated signaling pathway(GO:0038007) |
| 0.0 | 0.3 | GO:0060314 | regulation of ryanodine-sensitive calcium-release channel activity(GO:0060314) |
| 0.0 | 0.2 | GO:0070262 | peptidyl-serine dephosphorylation(GO:0070262) |
| 0.0 | 1.8 | GO:0042476 | odontogenesis(GO:0042476) |
| 0.0 | 0.2 | GO:0009756 | carbohydrate mediated signaling(GO:0009756) |
| 0.0 | 4.0 | GO:0018105 | peptidyl-serine phosphorylation(GO:0018105) |
| 0.0 | 0.1 | GO:0031274 | positive regulation of pseudopodium assembly(GO:0031274) |
Gene overrepresentation in cellular_component category:
| Log-likelihood per target | Total log-likelihood | Term | Description |
|---|---|---|---|
| 0.3 | 1.0 | GO:0048237 | rough endoplasmic reticulum lumen(GO:0048237) |
| 0.1 | 2.4 | GO:0044295 | axonal growth cone(GO:0044295) |
| 0.1 | 0.7 | GO:0046581 | intercellular canaliculus(GO:0046581) |
| 0.1 | 1.6 | GO:0097038 | perinuclear endoplasmic reticulum(GO:0097038) |
| 0.1 | 0.3 | GO:0030314 | junctional membrane complex(GO:0030314) |
| 0.1 | 1.0 | GO:0001518 | voltage-gated sodium channel complex(GO:0001518) |
| 0.0 | 1.7 | GO:0099738 | cell cortex region(GO:0099738) |
| 0.0 | 0.6 | GO:0005641 | nuclear envelope lumen(GO:0005641) |
| 0.0 | 2.2 | GO:0045178 | basal part of cell(GO:0045178) |
| 0.0 | 3.3 | GO:0005814 | centriole(GO:0005814) |
| 0.0 | 2.4 | GO:1904724 | tertiary granule lumen(GO:1904724) |
| 0.0 | 2.4 | GO:0031093 | platelet alpha granule lumen(GO:0031093) |
| 0.0 | 10.1 | GO:0005667 | transcription factor complex(GO:0005667) |
| 0.0 | 2.4 | GO:0005913 | cell-cell adherens junction(GO:0005913) |
| 0.0 | 1.8 | GO:0009897 | external side of plasma membrane(GO:0009897) |
| 0.0 | 1.4 | GO:0033116 | endoplasmic reticulum-Golgi intermediate compartment membrane(GO:0033116) |
| 0.0 | 20.5 | GO:0005615 | extracellular space(GO:0005615) |
| 0.0 | 16.2 | GO:0005887 | integral component of plasma membrane(GO:0005887) |
| 0.0 | 1.4 | GO:0005643 | nuclear pore(GO:0005643) |
| 0.0 | 5.2 | GO:0016607 | nuclear speck(GO:0016607) |
| 0.0 | 0.2 | GO:0097225 | sperm midpiece(GO:0097225) |
| 0.0 | 42.1 | GO:0005576 | extracellular region(GO:0005576) |
| 0.0 | 0.4 | GO:0005891 | voltage-gated calcium channel complex(GO:0005891) |
Gene overrepresentation in molecular_function category:
| Log-likelihood per target | Total log-likelihood | Term | Description |
|---|---|---|---|
| 0.7 | 10.4 | GO:0008140 | cAMP response element binding protein binding(GO:0008140) |
| 0.4 | 1.6 | GO:0008889 | glycerophosphodiester phosphodiesterase activity(GO:0008889) |
| 0.3 | 1.6 | GO:0070740 | tubulin-glutamic acid ligase activity(GO:0070740) |
| 0.2 | 1.0 | GO:0031708 | endothelin B receptor binding(GO:0031708) |
| 0.2 | 4.9 | GO:0017081 | chloride channel regulator activity(GO:0017081) |
| 0.2 | 1.0 | GO:0016909 | JUN kinase activity(GO:0004705) SAP kinase activity(GO:0016909) |
| 0.1 | 0.6 | GO:0003990 | acetylcholinesterase activity(GO:0003990) |
| 0.1 | 1.4 | GO:0005049 | nuclear export signal receptor activity(GO:0005049) |
| 0.1 | 0.9 | GO:0004340 | glucokinase activity(GO:0004340) hexokinase activity(GO:0004396) fructokinase activity(GO:0008865) mannokinase activity(GO:0019158) |
| 0.1 | 0.7 | GO:0050694 | galactosylceramide sulfotransferase activity(GO:0001733) galactose 3-O-sulfotransferase activity(GO:0050694) |
| 0.1 | 1.7 | GO:0005522 | profilin binding(GO:0005522) |
| 0.1 | 0.7 | GO:0030021 | extracellular matrix structural constituent conferring compression resistance(GO:0030021) structural constituent of tooth enamel(GO:0030345) |
| 0.1 | 2.4 | GO:0019198 | transmembrane receptor protein tyrosine phosphatase activity(GO:0005001) transmembrane receptor protein phosphatase activity(GO:0019198) |
| 0.1 | 2.2 | GO:0004016 | adenylate cyclase activity(GO:0004016) |
| 0.1 | 5.1 | GO:0030374 | ligand-dependent nuclear receptor transcription coactivator activity(GO:0030374) |
| 0.1 | 1.7 | GO:0004012 | phospholipid-translocating ATPase activity(GO:0004012) |
| 0.1 | 1.3 | GO:0046965 | retinoid X receptor binding(GO:0046965) |
| 0.1 | 0.4 | GO:0047894 | flavonol 3-sulfotransferase activity(GO:0047894) steroid sulfotransferase activity(GO:0050294) |
| 0.0 | 1.0 | GO:0035198 | miRNA binding(GO:0035198) |
| 0.0 | 0.8 | GO:0005068 | transmembrane receptor protein tyrosine kinase adaptor activity(GO:0005068) |
| 0.0 | 1.0 | GO:0005248 | voltage-gated sodium channel activity(GO:0005248) voltage-gated ion channel activity involved in regulation of postsynaptic membrane potential(GO:1905030) |
| 0.0 | 0.7 | GO:0008239 | dipeptidyl-peptidase activity(GO:0008239) |
| 0.0 | 0.2 | GO:0019531 | oxalate transmembrane transporter activity(GO:0019531) |
| 0.0 | 0.1 | GO:0004392 | heme oxygenase (decyclizing) activity(GO:0004392) |
| 0.0 | 0.3 | GO:0015143 | urate transmembrane transporter activity(GO:0015143) salt transmembrane transporter activity(GO:1901702) |
| 0.0 | 0.7 | GO:0005086 | ARF guanyl-nucleotide exchange factor activity(GO:0005086) |
| 0.0 | 2.6 | GO:0004867 | serine-type endopeptidase inhibitor activity(GO:0004867) |
| 0.0 | 0.4 | GO:0003906 | DNA-(apurinic or apyrimidinic site) lyase activity(GO:0003906) |
| 0.0 | 1.2 | GO:0016303 | 1-phosphatidylinositol-3-kinase activity(GO:0016303) |
| 0.0 | 0.4 | GO:0031698 | beta-2 adrenergic receptor binding(GO:0031698) |
| 0.0 | 2.7 | GO:0005262 | calcium channel activity(GO:0005262) |
| 0.0 | 0.3 | GO:0030618 | transforming growth factor beta receptor, pathway-specific cytoplasmic mediator activity(GO:0030618) |
| 0.0 | 16.3 | GO:0005509 | calcium ion binding(GO:0005509) |
| 0.0 | 4.0 | GO:0000287 | magnesium ion binding(GO:0000287) |
| 0.0 | 0.7 | GO:0004222 | metalloendopeptidase activity(GO:0004222) |
| 0.0 | 0.2 | GO:0019826 | oxygen sensor activity(GO:0019826) |
| 0.0 | 0.1 | GO:0035650 | AP-1 adaptor complex binding(GO:0035650) |
Gene overrepresentation in C2:CP category:
| Log-likelihood per target | Total log-likelihood | Term | Description |
|---|---|---|---|
| 0.9 | 23.6 | SA REG CASCADE OF CYCLIN EXPR | Expression of cyclins regulates progression through the cell cycle by activating cyclin-dependent kinases. |
| 0.2 | 10.4 | PID TCR CALCIUM PATHWAY | Calcium signaling in the CD4+ TCR pathway |
| 0.1 | 5.9 | PID FOXO PATHWAY | FoxO family signaling |
| 0.1 | 2.5 | PID NECTIN PATHWAY | Nectin adhesion pathway |
| 0.0 | 2.4 | PID HIF2PATHWAY | HIF-2-alpha transcription factor network |
| 0.0 | 2.1 | ST JNK MAPK PATHWAY | JNK MAPK Pathway |
| 0.0 | 3.3 | PID ERA GENOMIC PATHWAY | Validated nuclear estrogen receptor alpha network |
| 0.0 | 3.8 | NABA ECM AFFILIATED | Genes encoding proteins affiliated structurally or functionally to extracellular matrix proteins |
| 0.0 | 0.3 | PID ALK2 PATHWAY | ALK2 signaling events |
| 0.0 | 1.0 | PID INTEGRIN A4B1 PATHWAY | Alpha4 beta1 integrin signaling events |
| 0.0 | 1.0 | PID ENDOTHELIN PATHWAY | Endothelins |
| 0.0 | 0.7 | PID SHP2 PATHWAY | SHP2 signaling |
Gene overrepresentation in C2:CP:REACTOME category:
| Log-likelihood per target | Total log-likelihood | Term | Description |
|---|---|---|---|
| 0.1 | 0.6 | REACTOME SYNTHESIS SECRETION AND DEACYLATION OF GHRELIN | Genes involved in Synthesis, Secretion, and Deacylation of Ghrelin |
| 0.0 | 1.0 | REACTOME ACTIVATION OF THE AP1 FAMILY OF TRANSCRIPTION FACTORS | Genes involved in Activation of the AP-1 family of transcription factors |
| 0.0 | 2.4 | REACTOME BMAL1 CLOCK NPAS2 ACTIVATES CIRCADIAN EXPRESSION | Genes involved in BMAL1:CLOCK/NPAS2 Activates Circadian Expression |
| 0.0 | 0.7 | REACTOME SYNTHESIS SECRETION AND INACTIVATION OF GIP | Genes involved in Synthesis, Secretion, and Inactivation of Glucose-dependent Insulinotropic Polypeptide (GIP) |
| 0.0 | 0.9 | REACTOME REGULATION OF GENE EXPRESSION IN BETA CELLS | Genes involved in Regulation of gene expression in beta cells |
| 0.0 | 1.2 | REACTOME SIGNALING BY CONSTITUTIVELY ACTIVE EGFR | Genes involved in Signaling by constitutively active EGFR |
| 0.0 | 1.7 | REACTOME ION TRANSPORT BY P TYPE ATPASES | Genes involved in Ion transport by P-type ATPases |
| 0.0 | 0.8 | REACTOME PHOSPHORYLATION OF CD3 AND TCR ZETA CHAINS | Genes involved in Phosphorylation of CD3 and TCR zeta chains |
| 0.0 | 0.4 | REACTOME BASE FREE SUGAR PHOSPHATE REMOVAL VIA THE SINGLE NUCLEOTIDE REPLACEMENT PATHWAY | Genes involved in Base-free sugar-phosphate removal via the single-nucleotide replacement pathway |
| 0.0 | 1.3 | REACTOME NUCLEAR RECEPTOR TRANSCRIPTION PATHWAY | Genes involved in Nuclear Receptor transcription pathway |
| 0.0 | 2.4 | REACTOME MRNA SPLICING | Genes involved in mRNA Splicing |
| 0.0 | 0.7 | REACTOME GLYCOSPHINGOLIPID METABOLISM | Genes involved in Glycosphingolipid metabolism |
| 0.0 | 0.4 | REACTOME CYTOSOLIC SULFONATION OF SMALL MOLECULES | Genes involved in Cytosolic sulfonation of small molecules |