Project
GNF SymAtlas + NCI-60 cancer cell lines, comparison of cancers vs non-cancers, human (Su, 2004; Ross, 2000)
Navigation
Downloads
Results for SOX3_SOX2
Z-value: 0.44
Motif logo
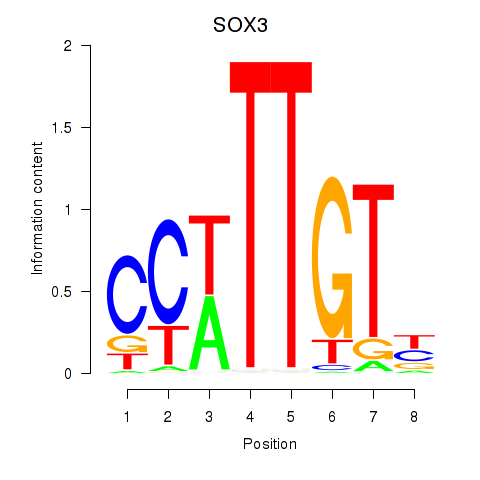
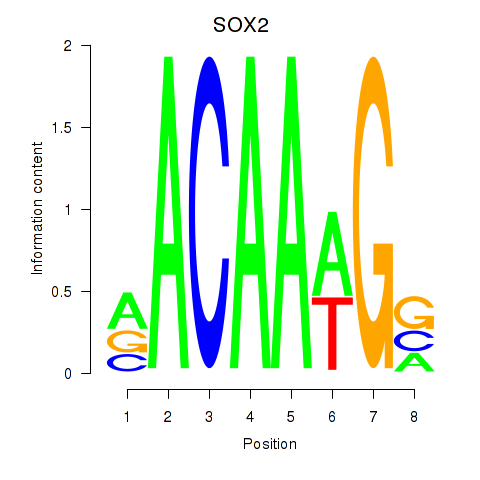
Transcription factors associated with SOX3_SOX2
| Gene Symbol | Gene ID | Gene Info |
|---|---|---|
|
SOX3
|
ENSG00000134595.6 | SRY-box transcription factor 3 |
|
SOX2
|
ENSG00000181449.2 | SRY-box transcription factor 2 |
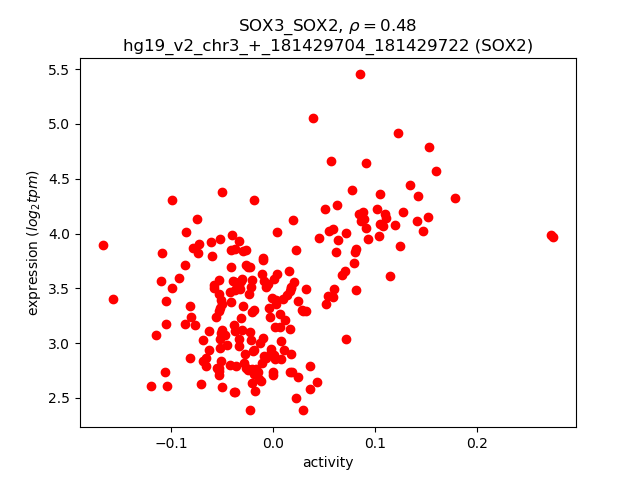
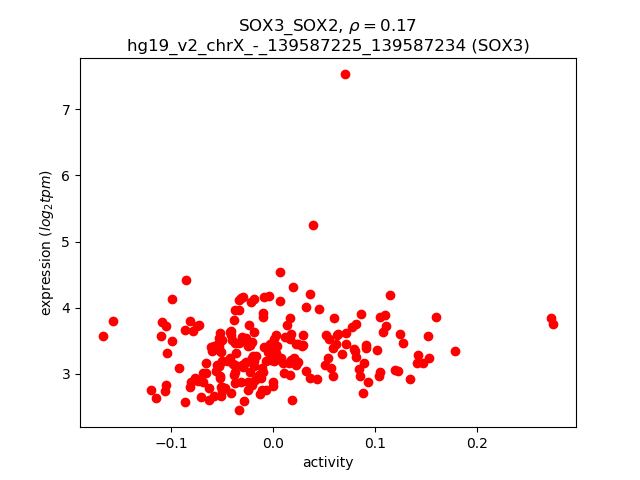
Activity-expression correlation:
| Gene | Promoter | Pearson corr. coef. | P-value | Plot |
|---|---|---|---|---|
| SOX2 | hg19_v2_chr3_+_181429704_181429722 | 0.48 | 5.6e-14 | Click! |
| SOX3 | hg19_v2_chrX_-_139587225_139587234 | 0.17 | 1.3e-02 | Click! |
Activity profile of SOX3_SOX2 motif
Sorted Z-values of SOX3_SOX2 motif
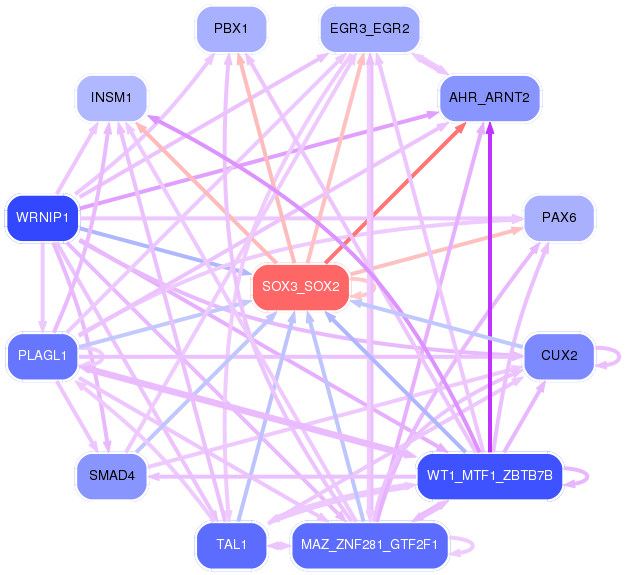
Network of associatons between targets according to the STRING database.

First level regulatory network of SOX3_SOX2
Gene Ontology Analysis
Gene overrepresentation in biological_process category:
| Log-likelihood per target | Total log-likelihood | Term | Description |
|---|---|---|---|
| 36.3 | 181.4 | GO:1904209 | regulation of chemokine (C-C motif) ligand 2 secretion(GO:1904207) positive regulation of chemokine (C-C motif) ligand 2 secretion(GO:1904209) |
| 15.9 | 63.4 | GO:0031117 | positive regulation of microtubule depolymerization(GO:0031117) |
| 12.5 | 62.6 | GO:1905098 | negative regulation of guanyl-nucleotide exchange factor activity(GO:1905098) |
| 11.8 | 47.3 | GO:0044861 | protein transport into plasma membrane raft(GO:0044861) |
| 11.4 | 113.5 | GO:0051610 | negative regulation of neurotransmitter uptake(GO:0051581) serotonin uptake(GO:0051610) regulation of serotonin uptake(GO:0051611) negative regulation of serotonin uptake(GO:0051612) |
| 10.2 | 30.6 | GO:1904530 | negative regulation of actin filament binding(GO:1904530) negative regulation of actin binding(GO:1904617) |
| 9.4 | 28.2 | GO:1904395 | retinal rod cell differentiation(GO:0060221) positive regulation of skeletal muscle acetylcholine-gated channel clustering(GO:1904395) negative regulation of neuromuscular junction development(GO:1904397) |
| 8.9 | 53.3 | GO:0061517 | macrophage proliferation(GO:0061517) microglial cell proliferation(GO:0061518) regulation of neuronal signal transduction(GO:1902847) positive regulation of neurofibrillary tangle assembly(GO:1902998) |
| 8.3 | 124.9 | GO:0030050 | vesicle transport along actin filament(GO:0030050) |
| 8.2 | 24.5 | GO:0021718 | superior olivary nucleus development(GO:0021718) superior olivary nucleus maturation(GO:0021722) |
| 7.6 | 22.7 | GO:0009258 | 10-formyltetrahydrofolate catabolic process(GO:0009258) |
| 7.3 | 36.6 | GO:0030382 | sperm mitochondrion organization(GO:0030382) |
| 7.2 | 100.2 | GO:0070050 | neuron cellular homeostasis(GO:0070050) |
| 6.9 | 20.7 | GO:0038060 | nitric oxide-cGMP-mediated signaling pathway(GO:0038060) |
| 6.4 | 25.7 | GO:2000402 | negative regulation of lymphocyte migration(GO:2000402) |
| 6.1 | 18.3 | GO:2000830 | vacuolar phosphate transport(GO:0007037) positive regulation of mitotic cell cycle DNA replication(GO:1903465) positive regulation of parathyroid hormone secretion(GO:2000830) |
| 5.9 | 23.6 | GO:0006542 | glutamine biosynthetic process(GO:0006542) |
| 5.7 | 11.5 | GO:1901628 | positive regulation of postsynaptic membrane organization(GO:1901628) |
| 5.7 | 28.7 | GO:0090258 | negative regulation of mitochondrial fission(GO:0090258) |
| 5.6 | 101.0 | GO:0007021 | tubulin complex assembly(GO:0007021) |
| 5.5 | 16.6 | GO:0007412 | axon target recognition(GO:0007412) |
| 5.4 | 16.3 | GO:0036309 | protein localization to M-band(GO:0036309) protein localization to T-tubule(GO:0036371) |
| 5.1 | 20.3 | GO:1903976 | negative regulation of glial cell migration(GO:1903976) |
| 5.1 | 20.2 | GO:0021564 | vagus nerve development(GO:0021564) |
| 4.9 | 58.4 | GO:1900028 | negative regulation of ruffle assembly(GO:1900028) |
| 4.8 | 19.1 | GO:0048698 | negative regulation of collateral sprouting in absence of injury(GO:0048698) |
| 4.7 | 109.2 | GO:0070262 | peptidyl-serine dephosphorylation(GO:0070262) |
| 4.6 | 27.7 | GO:2000324 | positive regulation of glucocorticoid receptor signaling pathway(GO:2000324) |
| 4.5 | 22.3 | GO:0008065 | establishment of blood-nerve barrier(GO:0008065) |
| 4.2 | 25.3 | GO:1904879 | positive regulation of calcium ion transmembrane transport via high voltage-gated calcium channel(GO:1904879) |
| 3.9 | 51.3 | GO:2001135 | regulation of endocytic recycling(GO:2001135) |
| 3.9 | 11.8 | GO:0003358 | noradrenergic neuron development(GO:0003358) |
| 3.9 | 30.9 | GO:0060075 | regulation of resting membrane potential(GO:0060075) |
| 3.8 | 15.1 | GO:0060392 | negative regulation of SMAD protein import into nucleus(GO:0060392) |
| 3.8 | 15.0 | GO:0072658 | positive regulation of cell communication by electrical coupling(GO:0010650) maintenance of protein location in membrane(GO:0072658) maintenance of protein location in plasma membrane(GO:0072660) positive regulation of membrane depolarization during cardiac muscle cell action potential(GO:1900827) |
| 3.8 | 7.5 | GO:1902809 | skeletal muscle fiber differentiation(GO:0098528) regulation of skeletal muscle fiber differentiation(GO:1902809) |
| 3.6 | 10.7 | GO:0072229 | carbon dioxide transmembrane transport(GO:0035378) proximal convoluted tubule development(GO:0072019) metanephric proximal convoluted tubule development(GO:0072229) |
| 3.6 | 17.8 | GO:0061107 | seminal vesicle development(GO:0061107) |
| 3.4 | 10.3 | GO:0032900 | regulation of nucleoside transport(GO:0032242) negative regulation of neurotrophin production(GO:0032900) |
| 3.4 | 27.2 | GO:0007258 | JUN phosphorylation(GO:0007258) |
| 3.3 | 9.8 | GO:0048170 | positive regulation of long-term neuronal synaptic plasticity(GO:0048170) |
| 3.2 | 45.4 | GO:0042759 | long-chain fatty acid biosynthetic process(GO:0042759) |
| 3.2 | 12.8 | GO:0035616 | histone H2B conserved C-terminal lysine deubiquitination(GO:0035616) |
| 3.2 | 63.5 | GO:0032012 | regulation of ARF protein signal transduction(GO:0032012) |
| 2.9 | 45.8 | GO:2000574 | regulation of microtubule motor activity(GO:2000574) |
| 2.8 | 42.2 | GO:0010839 | negative regulation of keratinocyte proliferation(GO:0010839) |
| 2.8 | 8.4 | GO:0043314 | negative regulation of neutrophil degranulation(GO:0043314) |
| 2.8 | 8.4 | GO:0052026 | modulation by virus of host transcription(GO:0019056) positive regulation of sprouting of injured axon(GO:0048687) positive regulation of axon extension involved in regeneration(GO:0048691) modulation by symbiont of host transcription(GO:0052026) |
| 2.8 | 14.0 | GO:0016080 | synaptic vesicle targeting(GO:0016080) |
| 2.8 | 8.3 | GO:0071557 | histone H3-K27 demethylation(GO:0071557) |
| 2.6 | 34.3 | GO:0033617 | mitochondrial respiratory chain complex IV assembly(GO:0033617) mitochondrial respiratory chain complex IV biogenesis(GO:0097034) |
| 2.6 | 5.2 | GO:0060260 | regulation of RNA polymerase II transcriptional preinitiation complex assembly(GO:0045898) regulation of transcription initiation from RNA polymerase II promoter(GO:0060260) |
| 2.6 | 10.3 | GO:0021888 | hypothalamus gonadotrophin-releasing hormone neuron differentiation(GO:0021886) hypothalamus gonadotrophin-releasing hormone neuron development(GO:0021888) |
| 2.5 | 7.5 | GO:0006419 | alanyl-tRNA aminoacylation(GO:0006419) |
| 2.5 | 7.5 | GO:0097114 | NMDA glutamate receptor clustering(GO:0097114) |
| 2.5 | 10.0 | GO:0045763 | negative regulation of cellular amino acid metabolic process(GO:0045763) regulation of glutamate metabolic process(GO:2000211) |
| 2.4 | 14.5 | GO:0061343 | cell adhesion involved in heart morphogenesis(GO:0061343) |
| 2.4 | 2.4 | GO:1901843 | positive regulation of high voltage-gated calcium channel activity(GO:1901843) |
| 2.4 | 4.7 | GO:0009256 | 10-formyltetrahydrofolate metabolic process(GO:0009256) |
| 2.3 | 37.0 | GO:0090361 | platelet-derived growth factor production(GO:0090360) regulation of platelet-derived growth factor production(GO:0090361) |
| 2.3 | 36.7 | GO:0071786 | endoplasmic reticulum tubular network organization(GO:0071786) |
| 2.3 | 38.9 | GO:0019371 | cyclooxygenase pathway(GO:0019371) |
| 2.3 | 6.8 | GO:1900220 | semaphorin-plexin signaling pathway involved in bone trabecula morphogenesis(GO:1900220) |
| 2.2 | 28.3 | GO:1902083 | negative regulation of peptidyl-cysteine S-nitrosylation(GO:1902083) |
| 2.2 | 6.5 | GO:0036058 | filtration diaphragm assembly(GO:0036058) slit diaphragm assembly(GO:0036060) |
| 2.2 | 4.3 | GO:0015670 | carbon dioxide transport(GO:0015670) |
| 2.1 | 6.4 | GO:0043153 | photoperiodism(GO:0009648) entrainment of circadian clock by photoperiod(GO:0043153) |
| 2.1 | 14.6 | GO:0071442 | positive regulation of histone H3-K14 acetylation(GO:0071442) |
| 2.1 | 22.6 | GO:0001514 | selenocysteine incorporation(GO:0001514) translational readthrough(GO:0006451) |
| 2.0 | 10.2 | GO:0045906 | negative regulation of vasoconstriction(GO:0045906) |
| 2.0 | 30.6 | GO:0007196 | adenylate cyclase-inhibiting G-protein coupled glutamate receptor signaling pathway(GO:0007196) |
| 2.0 | 16.2 | GO:0060414 | aorta smooth muscle tissue morphogenesis(GO:0060414) |
| 2.0 | 6.1 | GO:0032687 | negative regulation of interferon-alpha production(GO:0032687) |
| 1.9 | 5.8 | GO:0010643 | cell communication by chemical coupling(GO:0010643) |
| 1.9 | 17.3 | GO:0098814 | spontaneous neurotransmitter secretion(GO:0061669) spontaneous synaptic transmission(GO:0098814) |
| 1.9 | 11.3 | GO:0032468 | Golgi calcium ion homeostasis(GO:0032468) |
| 1.9 | 16.9 | GO:0019509 | L-methionine biosynthetic process from methylthioadenosine(GO:0019509) |
| 1.9 | 13.2 | GO:0060373 | regulation of ventricular cardiac muscle cell membrane depolarization(GO:0060373) |
| 1.9 | 9.3 | GO:1902951 | negative regulation of dendritic spine maintenance(GO:1902951) |
| 1.8 | 38.4 | GO:0051764 | actin crosslink formation(GO:0051764) |
| 1.8 | 7.2 | GO:0031179 | peptide amidation(GO:0001519) protein amidation(GO:0018032) peptide modification(GO:0031179) |
| 1.8 | 25.0 | GO:0021516 | dorsal spinal cord development(GO:0021516) |
| 1.8 | 14.0 | GO:0061302 | smooth muscle cell-matrix adhesion(GO:0061302) |
| 1.7 | 7.0 | GO:2000620 | positive regulation of histone H4-K16 acetylation(GO:2000620) |
| 1.7 | 8.7 | GO:0031022 | nuclear migration along microfilament(GO:0031022) |
| 1.7 | 8.6 | GO:0016476 | regulation of embryonic cell shape(GO:0016476) |
| 1.7 | 5.1 | GO:0035607 | fibroblast growth factor receptor signaling pathway involved in orbitofrontal cortex development(GO:0035607) |
| 1.7 | 1.7 | GO:0010726 | positive regulation of hydrogen peroxide metabolic process(GO:0010726) |
| 1.7 | 1.7 | GO:1900119 | positive regulation of execution phase of apoptosis(GO:1900119) |
| 1.6 | 8.2 | GO:0003322 | pancreatic A cell development(GO:0003322) |
| 1.6 | 21.3 | GO:1902669 | positive regulation of axon guidance(GO:1902669) |
| 1.6 | 24.0 | GO:0021681 | cerebellar granular layer development(GO:0021681) |
| 1.6 | 7.9 | GO:0060125 | negative regulation of growth hormone secretion(GO:0060125) |
| 1.6 | 45.3 | GO:0008045 | motor neuron axon guidance(GO:0008045) |
| 1.6 | 7.8 | GO:1903748 | negative regulation of establishment of protein localization to mitochondrion(GO:1903748) |
| 1.5 | 10.7 | GO:0002175 | protein localization to paranode region of axon(GO:0002175) |
| 1.5 | 22.2 | GO:0034638 | phosphatidylcholine catabolic process(GO:0034638) |
| 1.5 | 40.8 | GO:0045725 | positive regulation of glycogen biosynthetic process(GO:0045725) |
| 1.4 | 4.3 | GO:1903031 | regulation of microtubule plus-end binding(GO:1903031) positive regulation of microtubule plus-end binding(GO:1903033) |
| 1.4 | 5.7 | GO:1903660 | negative regulation of complement-dependent cytotoxicity(GO:1903660) |
| 1.4 | 10.0 | GO:0035726 | common myeloid progenitor cell proliferation(GO:0035726) |
| 1.4 | 14.1 | GO:0016198 | axon choice point recognition(GO:0016198) |
| 1.4 | 5.5 | GO:0061091 | regulation of phospholipid translocation(GO:0061091) positive regulation of phospholipid translocation(GO:0061092) |
| 1.4 | 2.7 | GO:0021586 | pons maturation(GO:0021586) |
| 1.3 | 4.0 | GO:1990637 | response to prolactin(GO:1990637) |
| 1.3 | 10.7 | GO:0051388 | positive regulation of neurotrophin TRK receptor signaling pathway(GO:0051388) |
| 1.3 | 6.6 | GO:0051013 | microtubule severing(GO:0051013) |
| 1.3 | 7.9 | GO:1901841 | regulation of high voltage-gated calcium channel activity(GO:1901841) |
| 1.3 | 6.6 | GO:0035900 | response to isolation stress(GO:0035900) |
| 1.3 | 35.4 | GO:2000114 | regulation of establishment of cell polarity(GO:2000114) |
| 1.3 | 5.2 | GO:0042483 | negative regulation of odontogenesis(GO:0042483) |
| 1.3 | 13.1 | GO:0031115 | negative regulation of microtubule polymerization(GO:0031115) |
| 1.3 | 11.7 | GO:2001197 | regulation of basement membrane assembly involved in embryonic body morphogenesis(GO:1904259) positive regulation of basement membrane assembly involved in embryonic body morphogenesis(GO:1904261) basement membrane assembly involved in embryonic body morphogenesis(GO:2001197) |
| 1.3 | 27.1 | GO:0032780 | negative regulation of ATPase activity(GO:0032780) |
| 1.3 | 23.1 | GO:0003351 | epithelial cilium movement(GO:0003351) |
| 1.3 | 5.1 | GO:0036515 | serotonergic neuron axon guidance(GO:0036515) |
| 1.3 | 2.5 | GO:0035948 | positive regulation of gluconeogenesis by positive regulation of transcription from RNA polymerase II promoter(GO:0035948) |
| 1.3 | 10.1 | GO:0098887 | neurotransmitter receptor transport, endosome to postsynaptic membrane(GO:0098887) |
| 1.2 | 3.7 | GO:0051036 | regulation of endosome size(GO:0051036) |
| 1.2 | 6.0 | GO:0071279 | cellular response to cobalt ion(GO:0071279) |
| 1.2 | 8.4 | GO:2001224 | positive regulation of neuron migration(GO:2001224) |
| 1.2 | 7.1 | GO:0051012 | microtubule sliding(GO:0051012) |
| 1.2 | 10.6 | GO:0035414 | negative regulation of catenin import into nucleus(GO:0035414) |
| 1.2 | 3.5 | GO:0071638 | negative regulation of monocyte chemotactic protein-1 production(GO:0071638) |
| 1.1 | 3.4 | GO:0007538 | primary sex determination(GO:0007538) |
| 1.1 | 7.9 | GO:0061577 | calcium ion transmembrane transport via high voltage-gated calcium channel(GO:0061577) |
| 1.1 | 5.6 | GO:0001957 | intramembranous ossification(GO:0001957) direct ossification(GO:0036072) |
| 1.1 | 4.5 | GO:1904491 | protein localization to ciliary transition zone(GO:1904491) |
| 1.1 | 8.8 | GO:0032790 | ribosome disassembly(GO:0032790) |
| 1.1 | 27.3 | GO:0007158 | neuron cell-cell adhesion(GO:0007158) |
| 1.1 | 3.3 | GO:0071934 | thiamine transport(GO:0015888) thiamine transmembrane transport(GO:0071934) |
| 1.1 | 7.5 | GO:1903977 | NMDA selective glutamate receptor signaling pathway(GO:0098989) positive regulation of glial cell migration(GO:1903977) |
| 1.1 | 3.2 | GO:0070213 | protein auto-ADP-ribosylation(GO:0070213) |
| 1.0 | 40.5 | GO:0086010 | membrane depolarization during action potential(GO:0086010) |
| 1.0 | 40.5 | GO:0035774 | positive regulation of insulin secretion involved in cellular response to glucose stimulus(GO:0035774) |
| 1.0 | 3.0 | GO:0006059 | hexitol metabolic process(GO:0006059) response to methylglyoxal(GO:0051595) |
| 1.0 | 2.0 | GO:1902473 | regulation of protein localization to synapse(GO:1902473) positive regulation of protein localization to synapse(GO:1902474) |
| 1.0 | 18.7 | GO:2001275 | positive regulation of glucose import in response to insulin stimulus(GO:2001275) |
| 1.0 | 9.7 | GO:0006600 | creatine metabolic process(GO:0006600) |
| 1.0 | 15.5 | GO:2000480 | negative regulation of cAMP-dependent protein kinase activity(GO:2000480) |
| 0.9 | 2.8 | GO:0035621 | ER to Golgi ceramide transport(GO:0035621) |
| 0.9 | 15.1 | GO:0030277 | maintenance of gastrointestinal epithelium(GO:0030277) |
| 0.9 | 3.7 | GO:0038155 | interleukin-23-mediated signaling pathway(GO:0038155) |
| 0.9 | 7.4 | GO:0045586 | regulation of gamma-delta T cell differentiation(GO:0045586) |
| 0.9 | 2.8 | GO:0070634 | transepithelial ammonium transport(GO:0070634) |
| 0.9 | 23.7 | GO:0036152 | phosphatidylethanolamine acyl-chain remodeling(GO:0036152) |
| 0.9 | 5.4 | GO:0017196 | N-terminal peptidyl-methionine acetylation(GO:0017196) |
| 0.9 | 8.1 | GO:0042574 | retinal metabolic process(GO:0042574) |
| 0.9 | 2.7 | GO:0010762 | regulation of fibroblast migration(GO:0010762) |
| 0.9 | 7.1 | GO:0070777 | D-aspartate transport(GO:0070777) D-aspartate import(GO:0070779) |
| 0.9 | 2.7 | GO:0043983 | histone H4-K12 acetylation(GO:0043983) |
| 0.9 | 6.2 | GO:0051967 | negative regulation of synaptic transmission, glutamatergic(GO:0051967) |
| 0.9 | 3.5 | GO:0061762 | CAMKK-AMPK signaling cascade(GO:0061762) |
| 0.9 | 2.6 | GO:1902714 | negative regulation of interferon-gamma secretion(GO:1902714) |
| 0.9 | 4.3 | GO:1900736 | minus-end-directed organelle transport along microtubule(GO:0072385) regulation of phospholipase C-activating G-protein coupled receptor signaling pathway(GO:1900736) |
| 0.9 | 12.9 | GO:0032196 | transposition(GO:0032196) |
| 0.9 | 8.6 | GO:0009249 | protein lipoylation(GO:0009249) |
| 0.9 | 5.1 | GO:0006003 | fructose 2,6-bisphosphate metabolic process(GO:0006003) |
| 0.8 | 4.2 | GO:0007197 | adenylate cyclase-inhibiting G-protein coupled acetylcholine receptor signaling pathway(GO:0007197) |
| 0.8 | 6.7 | GO:2000790 | regulation of mesenchymal cell proliferation involved in lung development(GO:2000790) negative regulation of mesenchymal cell proliferation involved in lung development(GO:2000791) |
| 0.8 | 2.5 | GO:0019896 | axonal transport of mitochondrion(GO:0019896) |
| 0.8 | 9.8 | GO:1901223 | negative regulation of NIK/NF-kappaB signaling(GO:1901223) |
| 0.8 | 10.6 | GO:0090527 | actin filament reorganization(GO:0090527) |
| 0.8 | 2.4 | GO:0006420 | arginyl-tRNA aminoacylation(GO:0006420) |
| 0.8 | 1.6 | GO:0090394 | negative regulation of excitatory postsynaptic potential(GO:0090394) |
| 0.8 | 5.6 | GO:0009597 | detection of virus(GO:0009597) |
| 0.8 | 9.5 | GO:0060134 | prepulse inhibition(GO:0060134) |
| 0.8 | 2.4 | GO:0045875 | negative regulation of sister chromatid cohesion(GO:0045875) |
| 0.8 | 6.2 | GO:1900227 | positive regulation of NLRP3 inflammasome complex assembly(GO:1900227) |
| 0.8 | 9.9 | GO:0017121 | phospholipid scrambling(GO:0017121) |
| 0.8 | 1.5 | GO:2000525 | regulation of T cell costimulation(GO:2000523) positive regulation of T cell costimulation(GO:2000525) |
| 0.8 | 3.8 | GO:0034587 | piRNA metabolic process(GO:0034587) |
| 0.8 | 1.5 | GO:0060129 | thyroid-stimulating hormone-secreting cell differentiation(GO:0060129) |
| 0.7 | 3.0 | GO:0071802 | negative regulation of podosome assembly(GO:0071802) |
| 0.7 | 3.6 | GO:0071286 | cellular response to magnesium ion(GO:0071286) |
| 0.7 | 114.0 | GO:0007156 | homophilic cell adhesion via plasma membrane adhesion molecules(GO:0007156) |
| 0.7 | 2.2 | GO:0010644 | cell communication by electrical coupling(GO:0010644) |
| 0.7 | 10.0 | GO:0048245 | eosinophil chemotaxis(GO:0048245) |
| 0.7 | 1.4 | GO:0007161 | calcium-independent cell-matrix adhesion(GO:0007161) |
| 0.7 | 5.6 | GO:0034983 | peptidyl-lysine deacetylation(GO:0034983) |
| 0.7 | 3.5 | GO:0070966 | nuclear-transcribed mRNA catabolic process, no-go decay(GO:0070966) |
| 0.7 | 8.3 | GO:0010962 | regulation of glycogen biosynthetic process(GO:0005979) regulation of glucan biosynthetic process(GO:0010962) |
| 0.7 | 4.8 | GO:1990253 | cellular response to leucine starvation(GO:1990253) |
| 0.7 | 4.8 | GO:0003096 | renal sodium ion transport(GO:0003096) renal sodium ion absorption(GO:0070294) |
| 0.7 | 29.2 | GO:0051489 | regulation of filopodium assembly(GO:0051489) |
| 0.7 | 8.1 | GO:0006776 | vitamin A metabolic process(GO:0006776) |
| 0.7 | 5.3 | GO:0019375 | galactosylceramide biosynthetic process(GO:0006682) galactolipid biosynthetic process(GO:0019375) |
| 0.7 | 2.0 | GO:1900244 | positive regulation of synaptic vesicle endocytosis(GO:1900244) positive regulation of synaptic vesicle recycling(GO:1903423) |
| 0.7 | 2.0 | GO:0032229 | negative regulation of synaptic transmission, GABAergic(GO:0032229) |
| 0.6 | 5.8 | GO:0015747 | urate transport(GO:0015747) |
| 0.6 | 14.6 | GO:0048665 | neuron fate specification(GO:0048665) |
| 0.6 | 1.3 | GO:0051045 | negative regulation of membrane protein ectodomain proteolysis(GO:0051045) |
| 0.6 | 1.9 | GO:0021781 | glial cell fate commitment(GO:0021781) |
| 0.6 | 5.6 | GO:0030091 | protein repair(GO:0030091) |
| 0.6 | 2.5 | GO:1902731 | negative regulation of chondrocyte proliferation(GO:1902731) |
| 0.6 | 3.1 | GO:0097498 | endothelial tube lumen extension(GO:0097498) |
| 0.6 | 3.7 | GO:0051970 | negative regulation of transmission of nerve impulse(GO:0051970) |
| 0.6 | 1.2 | GO:0021538 | epithalamus development(GO:0021538) habenula development(GO:0021986) |
| 0.6 | 23.3 | GO:0043268 | positive regulation of potassium ion transport(GO:0043268) |
| 0.6 | 14.3 | GO:0006833 | water transport(GO:0006833) |
| 0.6 | 8.9 | GO:0034063 | stress granule assembly(GO:0034063) |
| 0.6 | 28.8 | GO:0015701 | bicarbonate transport(GO:0015701) |
| 0.6 | 11.9 | GO:0019800 | peptide cross-linking via chondroitin 4-sulfate glycosaminoglycan(GO:0019800) |
| 0.6 | 4.5 | GO:0046477 | glycosylceramide catabolic process(GO:0046477) |
| 0.6 | 2.2 | GO:0014053 | negative regulation of gamma-aminobutyric acid secretion(GO:0014053) aspartate secretion(GO:0061528) regulation of aspartate secretion(GO:1904448) positive regulation of aspartate secretion(GO:1904450) |
| 0.5 | 1.1 | GO:0015791 | polyol transport(GO:0015791) |
| 0.5 | 14.2 | GO:0070884 | regulation of calcineurin-NFAT signaling cascade(GO:0070884) |
| 0.5 | 2.0 | GO:0018094 | protein polyglycylation(GO:0018094) |
| 0.5 | 3.0 | GO:0099624 | membrane repolarization during atrial cardiac muscle cell action potential(GO:0098914) atrial cardiac muscle cell membrane repolarization(GO:0099624) |
| 0.5 | 5.4 | GO:0045721 | negative regulation of gluconeogenesis(GO:0045721) |
| 0.5 | 1.9 | GO:1900245 | positive regulation of MDA-5 signaling pathway(GO:1900245) |
| 0.5 | 4.9 | GO:0030509 | BMP signaling pathway(GO:0030509) |
| 0.5 | 27.5 | GO:0072384 | organelle transport along microtubule(GO:0072384) |
| 0.5 | 1.4 | GO:0032252 | secretory granule localization(GO:0032252) |
| 0.5 | 3.8 | GO:1902260 | negative regulation of delayed rectifier potassium channel activity(GO:1902260) |
| 0.5 | 1.9 | GO:1901187 | regulation of ephrin receptor signaling pathway(GO:1901187) |
| 0.5 | 19.3 | GO:2000649 | regulation of sodium ion transmembrane transporter activity(GO:2000649) |
| 0.5 | 1.9 | GO:0060605 | tube lumen cavitation(GO:0060605) salivary gland cavitation(GO:0060662) |
| 0.5 | 3.2 | GO:0032760 | positive regulation of tumor necrosis factor production(GO:0032760) positive regulation of tumor necrosis factor superfamily cytokine production(GO:1903557) |
| 0.5 | 1.9 | GO:0015705 | iodide transport(GO:0015705) |
| 0.5 | 8.7 | GO:0006068 | ethanol catabolic process(GO:0006068) |
| 0.5 | 5.9 | GO:0033623 | regulation of integrin activation(GO:0033623) |
| 0.4 | 4.0 | GO:0001973 | adenosine receptor signaling pathway(GO:0001973) |
| 0.4 | 7.6 | GO:0002467 | germinal center formation(GO:0002467) |
| 0.4 | 7.1 | GO:0010457 | centriole-centriole cohesion(GO:0010457) |
| 0.4 | 1.3 | GO:1901621 | negative regulation of smoothened signaling pathway involved in dorsal/ventral neural tube patterning(GO:1901621) |
| 0.4 | 3.1 | GO:0017185 | peptidyl-lysine hydroxylation(GO:0017185) |
| 0.4 | 6.6 | GO:0034497 | protein localization to pre-autophagosomal structure(GO:0034497) |
| 0.4 | 1.3 | GO:0014807 | regulation of somitogenesis(GO:0014807) |
| 0.4 | 10.9 | GO:0048488 | synaptic vesicle endocytosis(GO:0048488) |
| 0.4 | 2.2 | GO:0061511 | centriole elongation(GO:0061511) |
| 0.4 | 1.7 | GO:2000662 | interleukin-5 secretion(GO:0072603) regulation of interleukin-5 secretion(GO:2000662) |
| 0.4 | 0.9 | GO:0006438 | valyl-tRNA aminoacylation(GO:0006438) |
| 0.4 | 1.3 | GO:0050717 | positive regulation of interleukin-1 alpha secretion(GO:0050717) |
| 0.4 | 1.3 | GO:0070945 | neutrophil mediated killing of gram-negative bacterium(GO:0070945) |
| 0.4 | 5.1 | GO:0030213 | hyaluronan biosynthetic process(GO:0030213) |
| 0.4 | 2.1 | GO:0048505 | regulation of development, heterochronic(GO:0040034) regulation of timing of cell differentiation(GO:0048505) |
| 0.4 | 4.6 | GO:0007182 | common-partner SMAD protein phosphorylation(GO:0007182) |
| 0.4 | 4.5 | GO:0001886 | endothelial cell morphogenesis(GO:0001886) |
| 0.4 | 1.2 | GO:0005988 | lactose metabolic process(GO:0005988) lactose biosynthetic process(GO:0005989) |
| 0.4 | 8.1 | GO:0022011 | myelination in peripheral nervous system(GO:0022011) peripheral nervous system axon ensheathment(GO:0032292) |
| 0.4 | 9.2 | GO:0002028 | regulation of sodium ion transport(GO:0002028) |
| 0.4 | 1.2 | GO:0035425 | autocrine signaling(GO:0035425) |
| 0.4 | 8.7 | GO:0050901 | leukocyte tethering or rolling(GO:0050901) |
| 0.4 | 31.0 | GO:0030010 | establishment of cell polarity(GO:0030010) |
| 0.4 | 5.0 | GO:0042475 | odontogenesis of dentin-containing tooth(GO:0042475) |
| 0.4 | 6.9 | GO:0016540 | protein autoprocessing(GO:0016540) |
| 0.4 | 13.0 | GO:0035249 | synaptic transmission, glutamatergic(GO:0035249) |
| 0.4 | 1.9 | GO:0006127 | glycerophosphate shuttle(GO:0006127) |
| 0.4 | 3.4 | GO:0071803 | positive regulation of podosome assembly(GO:0071803) |
| 0.4 | 2.6 | GO:1902746 | regulation of lens fiber cell differentiation(GO:1902746) |
| 0.4 | 4.8 | GO:0090084 | negative regulation of inclusion body assembly(GO:0090084) |
| 0.4 | 1.1 | GO:1901491 | negative regulation of lymphangiogenesis(GO:1901491) |
| 0.4 | 4.3 | GO:0097011 | cellular response to granulocyte macrophage colony-stimulating factor stimulus(GO:0097011) response to granulocyte macrophage colony-stimulating factor(GO:0097012) |
| 0.4 | 0.7 | GO:0051799 | negative regulation of hair follicle development(GO:0051799) |
| 0.3 | 5.9 | GO:0007130 | synaptonemal complex assembly(GO:0007130) |
| 0.3 | 1.0 | GO:0042270 | protection from natural killer cell mediated cytotoxicity(GO:0042270) |
| 0.3 | 2.4 | GO:0014059 | dopamine secretion(GO:0014046) regulation of dopamine secretion(GO:0014059) |
| 0.3 | 8.5 | GO:0050982 | detection of mechanical stimulus(GO:0050982) |
| 0.3 | 6.5 | GO:0019228 | neuronal action potential(GO:0019228) |
| 0.3 | 5.8 | GO:0097150 | neuronal stem cell population maintenance(GO:0097150) |
| 0.3 | 6.1 | GO:0050812 | regulation of acetyl-CoA biosynthetic process from pyruvate(GO:0010510) regulation of acyl-CoA biosynthetic process(GO:0050812) |
| 0.3 | 46.4 | GO:0006805 | xenobiotic metabolic process(GO:0006805) |
| 0.3 | 4.0 | GO:0060004 | reflex(GO:0060004) |
| 0.3 | 11.5 | GO:0035115 | embryonic forelimb morphogenesis(GO:0035115) |
| 0.3 | 1.6 | GO:0048105 | establishment of body hair or bristle planar orientation(GO:0048104) establishment of body hair planar orientation(GO:0048105) |
| 0.3 | 2.9 | GO:0021902 | commitment of neuronal cell to specific neuron type in forebrain(GO:0021902) |
| 0.3 | 5.4 | GO:1901385 | regulation of voltage-gated calcium channel activity(GO:1901385) |
| 0.3 | 6.0 | GO:0016242 | negative regulation of macroautophagy(GO:0016242) |
| 0.3 | 0.3 | GO:0014028 | notochord formation(GO:0014028) |
| 0.3 | 1.6 | GO:0034128 | negative regulation of MyD88-independent toll-like receptor signaling pathway(GO:0034128) |
| 0.3 | 3.4 | GO:2000251 | positive regulation of actin cytoskeleton reorganization(GO:2000251) |
| 0.3 | 4.6 | GO:0031111 | negative regulation of microtubule polymerization or depolymerization(GO:0031111) |
| 0.3 | 1.2 | GO:0021626 | hindbrain maturation(GO:0021578) central nervous system maturation(GO:0021626) |
| 0.3 | 0.9 | GO:0043137 | DNA replication, removal of RNA primer(GO:0043137) |
| 0.3 | 3.0 | GO:0015865 | purine nucleotide transport(GO:0015865) purine ribonucleotide transport(GO:0015868) |
| 0.3 | 2.4 | GO:0071447 | cellular response to hydroperoxide(GO:0071447) |
| 0.3 | 2.7 | GO:1900016 | negative regulation of cytokine production involved in inflammatory response(GO:1900016) |
| 0.3 | 7.1 | GO:0015695 | organic cation transport(GO:0015695) |
| 0.3 | 3.2 | GO:0009303 | rRNA transcription(GO:0009303) |
| 0.3 | 0.3 | GO:0099552 | trans-synaptic signaling by lipid, modulating synaptic transmission(GO:0099552) trans-synaptic signaling by endocannabinoid, modulating synaptic transmission(GO:0099553) |
| 0.3 | 1.7 | GO:0051694 | pointed-end actin filament capping(GO:0051694) |
| 0.3 | 4.8 | GO:0007191 | adenylate cyclase-activating dopamine receptor signaling pathway(GO:0007191) |
| 0.3 | 7.3 | GO:0070498 | interleukin-1-mediated signaling pathway(GO:0070498) |
| 0.3 | 1.1 | GO:0030259 | lipid glycosylation(GO:0030259) |
| 0.3 | 0.3 | GO:0014016 | neuroblast differentiation(GO:0014016) |
| 0.3 | 4.1 | GO:0010992 | ubiquitin homeostasis(GO:0010992) |
| 0.3 | 51.1 | GO:0007411 | axon guidance(GO:0007411) |
| 0.3 | 1.4 | GO:0044800 | fusion of virus membrane with host plasma membrane(GO:0019064) membrane fusion involved in viral entry into host cell(GO:0039663) multi-organism membrane fusion(GO:0044800) |
| 0.3 | 1.6 | GO:0032275 | luteinizing hormone secretion(GO:0032275) |
| 0.3 | 0.8 | GO:2000328 | negative regulation of T-helper 17 type immune response(GO:2000317) negative regulation of T-helper 17 cell differentiation(GO:2000320) regulation of T-helper 17 cell lineage commitment(GO:2000328) |
| 0.3 | 1.5 | GO:0097033 | respiratory chain complex III assembly(GO:0017062) mitochondrial respiratory chain complex III assembly(GO:0034551) mitochondrial respiratory chain complex III biogenesis(GO:0097033) |
| 0.2 | 15.2 | GO:0000381 | regulation of alternative mRNA splicing, via spliceosome(GO:0000381) |
| 0.2 | 3.2 | GO:1901687 | glutathione derivative metabolic process(GO:1901685) glutathione derivative biosynthetic process(GO:1901687) |
| 0.2 | 17.2 | GO:0030705 | cytoskeleton-dependent intracellular transport(GO:0030705) |
| 0.2 | 1.2 | GO:0042364 | water-soluble vitamin biosynthetic process(GO:0042364) vitamin B6 metabolic process(GO:0042816) |
| 0.2 | 1.2 | GO:0036438 | maintenance of lens transparency(GO:0036438) |
| 0.2 | 1.2 | GO:0032808 | lacrimal gland development(GO:0032808) |
| 0.2 | 2.8 | GO:0051382 | kinetochore assembly(GO:0051382) |
| 0.2 | 0.9 | GO:0090074 | negative regulation of protein homodimerization activity(GO:0090074) |
| 0.2 | 3.7 | GO:0034766 | negative regulation of ion transmembrane transport(GO:0034766) |
| 0.2 | 0.6 | GO:0034443 | regulation of lipoprotein oxidation(GO:0034442) negative regulation of lipoprotein oxidation(GO:0034443) |
| 0.2 | 4.3 | GO:0060292 | long term synaptic depression(GO:0060292) |
| 0.2 | 2.7 | GO:2000194 | regulation of female gonad development(GO:2000194) |
| 0.2 | 13.7 | GO:0035308 | negative regulation of protein dephosphorylation(GO:0035308) |
| 0.2 | 0.4 | GO:0038163 | thrombopoietin-mediated signaling pathway(GO:0038163) |
| 0.2 | 2.0 | GO:0010265 | SCF complex assembly(GO:0010265) |
| 0.2 | 3.4 | GO:0036295 | cellular response to increased oxygen levels(GO:0036295) |
| 0.2 | 8.2 | GO:0000413 | protein peptidyl-prolyl isomerization(GO:0000413) |
| 0.2 | 1.0 | GO:0033274 | response to vitamin B2(GO:0033274) heterochromatin maintenance(GO:0070829) |
| 0.2 | 1.6 | GO:0035542 | regulation of SNARE complex assembly(GO:0035542) |
| 0.2 | 4.8 | GO:0007095 | mitotic G2 DNA damage checkpoint(GO:0007095) |
| 0.2 | 2.1 | GO:1903522 | regulation of blood circulation(GO:1903522) |
| 0.2 | 0.6 | GO:0043651 | linoleic acid metabolic process(GO:0043651) |
| 0.2 | 1.5 | GO:0007598 | blood coagulation, extrinsic pathway(GO:0007598) |
| 0.2 | 6.3 | GO:0046329 | negative regulation of JNK cascade(GO:0046329) |
| 0.2 | 0.6 | GO:0017158 | regulation of calcium ion-dependent exocytosis(GO:0017158) |
| 0.2 | 10.4 | GO:0006826 | iron ion transport(GO:0006826) |
| 0.2 | 5.0 | GO:1901379 | regulation of potassium ion transmembrane transport(GO:1901379) |
| 0.2 | 6.2 | GO:0021510 | spinal cord development(GO:0021510) |
| 0.2 | 1.1 | GO:0097428 | protein maturation by iron-sulfur cluster transfer(GO:0097428) |
| 0.2 | 1.4 | GO:0000733 | DNA strand renaturation(GO:0000733) |
| 0.2 | 2.7 | GO:0016024 | CDP-diacylglycerol biosynthetic process(GO:0016024) |
| 0.2 | 3.4 | GO:0035162 | embryonic hemopoiesis(GO:0035162) |
| 0.2 | 2.5 | GO:0060716 | labyrinthine layer blood vessel development(GO:0060716) |
| 0.2 | 12.3 | GO:0021987 | cerebral cortex development(GO:0021987) |
| 0.2 | 0.7 | GO:0010814 | substance P catabolic process(GO:0010814) calcitonin catabolic process(GO:0010816) endothelin maturation(GO:0034959) |
| 0.2 | 0.5 | GO:1990086 | lens fiber cell apoptotic process(GO:1990086) |
| 0.2 | 6.3 | GO:0046949 | fatty-acyl-CoA biosynthetic process(GO:0046949) |
| 0.2 | 6.0 | GO:0006893 | Golgi to plasma membrane transport(GO:0006893) |
| 0.2 | 1.0 | GO:2000288 | positive regulation of myoblast proliferation(GO:2000288) |
| 0.2 | 3.6 | GO:0006825 | copper ion transport(GO:0006825) |
| 0.1 | 1.8 | GO:0019317 | fucose catabolic process(GO:0019317) L-fucose metabolic process(GO:0042354) L-fucose catabolic process(GO:0042355) |
| 0.1 | 1.9 | GO:1903861 | positive regulation of dendrite extension(GO:1903861) |
| 0.1 | 1.5 | GO:0006621 | protein retention in ER lumen(GO:0006621) maintenance of protein localization in endoplasmic reticulum(GO:0035437) |
| 0.1 | 1.6 | GO:0048251 | elastic fiber assembly(GO:0048251) |
| 0.1 | 0.6 | GO:0048286 | lung alveolus development(GO:0048286) |
| 0.1 | 1.1 | GO:0036123 | histone H3-K9 dimethylation(GO:0036123) |
| 0.1 | 5.3 | GO:0071377 | cellular response to glucagon stimulus(GO:0071377) |
| 0.1 | 1.0 | GO:0051418 | interphase microtubule nucleation by interphase microtubule organizing center(GO:0051415) microtubule nucleation by microtubule organizing center(GO:0051418) |
| 0.1 | 1.9 | GO:0033539 | fatty acid beta-oxidation using acyl-CoA dehydrogenase(GO:0033539) |
| 0.1 | 1.2 | GO:0002098 | tRNA wobble uridine modification(GO:0002098) |
| 0.1 | 8.9 | GO:0031338 | regulation of vesicle fusion(GO:0031338) |
| 0.1 | 0.5 | GO:0006408 | snRNA export from nucleus(GO:0006408) |
| 0.1 | 1.1 | GO:0090169 | regulation of spindle assembly(GO:0090169) regulation of mitotic spindle assembly(GO:1901673) |
| 0.1 | 1.2 | GO:0089711 | L-glutamate transmembrane transport(GO:0089711) |
| 0.1 | 4.5 | GO:0010811 | positive regulation of cell-substrate adhesion(GO:0010811) |
| 0.1 | 2.3 | GO:0035435 | phosphate ion transmembrane transport(GO:0035435) |
| 0.1 | 0.4 | GO:0019464 | glycine catabolic process(GO:0006546) glycine decarboxylation via glycine cleavage system(GO:0019464) |
| 0.1 | 0.6 | GO:0035063 | nuclear speck organization(GO:0035063) |
| 0.1 | 1.4 | GO:0051256 | mitotic spindle midzone assembly(GO:0051256) |
| 0.1 | 2.0 | GO:0002089 | lens morphogenesis in camera-type eye(GO:0002089) |
| 0.1 | 2.2 | GO:0007131 | reciprocal meiotic recombination(GO:0007131) reciprocal DNA recombination(GO:0035825) |
| 0.1 | 2.1 | GO:0007597 | blood coagulation, intrinsic pathway(GO:0007597) |
| 0.1 | 3.0 | GO:0007340 | acrosome reaction(GO:0007340) |
| 0.1 | 0.2 | GO:1903336 | negative regulation of vacuolar transport(GO:1903336) |
| 0.1 | 0.7 | GO:0000707 | meiotic DNA recombinase assembly(GO:0000707) |
| 0.1 | 0.6 | GO:0010133 | proline catabolic process to glutamate(GO:0010133) |
| 0.1 | 0.7 | GO:0001574 | ganglioside biosynthetic process(GO:0001574) |
| 0.1 | 1.6 | GO:0006020 | inositol metabolic process(GO:0006020) |
| 0.1 | 1.5 | GO:0046069 | cGMP catabolic process(GO:0046069) |
| 0.1 | 1.3 | GO:0042059 | negative regulation of epidermal growth factor receptor signaling pathway(GO:0042059) |
| 0.1 | 0.5 | GO:0061635 | regulation of protein complex stability(GO:0061635) |
| 0.1 | 3.7 | GO:0000462 | maturation of SSU-rRNA from tricistronic rRNA transcript (SSU-rRNA, 5.8S rRNA, LSU-rRNA)(GO:0000462) |
| 0.1 | 0.5 | GO:0002315 | marginal zone B cell differentiation(GO:0002315) |
| 0.1 | 1.0 | GO:0006002 | fructose 6-phosphate metabolic process(GO:0006002) |
| 0.1 | 0.8 | GO:0048262 | determination of dorsal/ventral asymmetry(GO:0048262) determination of dorsal identity(GO:0048263) |
| 0.1 | 0.7 | GO:0090128 | regulation of synapse maturation(GO:0090128) |
| 0.1 | 2.2 | GO:0046513 | ceramide biosynthetic process(GO:0046513) |
| 0.1 | 0.6 | GO:0046475 | glycerophospholipid catabolic process(GO:0046475) |
| 0.1 | 1.1 | GO:0046320 | regulation of fatty acid oxidation(GO:0046320) |
| 0.1 | 4.1 | GO:0000045 | autophagosome assembly(GO:0000045) |
| 0.1 | 0.6 | GO:0043031 | negative regulation of macrophage activation(GO:0043031) |
| 0.1 | 0.6 | GO:2000311 | regulation of alpha-amino-3-hydroxy-5-methyl-4-isoxazole propionate selective glutamate receptor activity(GO:2000311) |
| 0.1 | 5.3 | GO:0006501 | C-terminal protein lipidation(GO:0006501) |
| 0.1 | 1.2 | GO:0043552 | positive regulation of phosphatidylinositol 3-kinase activity(GO:0043552) |
| 0.1 | 0.9 | GO:0007212 | dopamine receptor signaling pathway(GO:0007212) |
| 0.1 | 3.8 | GO:0050911 | detection of chemical stimulus involved in sensory perception of smell(GO:0050911) |
| 0.1 | 0.1 | GO:0042938 | dipeptide transport(GO:0042938) |
| 0.1 | 1.0 | GO:0051683 | establishment of Golgi localization(GO:0051683) |
| 0.1 | 1.8 | GO:0045599 | negative regulation of fat cell differentiation(GO:0045599) |
| 0.1 | 4.3 | GO:0007041 | lysosomal transport(GO:0007041) |
| 0.1 | 4.1 | GO:0006749 | glutathione metabolic process(GO:0006749) |
| 0.1 | 4.2 | GO:0007272 | ensheathment of neurons(GO:0007272) axon ensheathment(GO:0008366) |
| 0.1 | 0.2 | GO:0002949 | tRNA threonylcarbamoyladenosine modification(GO:0002949) |
| 0.1 | 0.9 | GO:0071985 | multivesicular body sorting pathway(GO:0071985) |
| 0.1 | 1.3 | GO:0001658 | branching involved in ureteric bud morphogenesis(GO:0001658) |
| 0.1 | 2.0 | GO:0061014 | positive regulation of mRNA catabolic process(GO:0061014) |
| 0.1 | 5.1 | GO:1903955 | positive regulation of protein targeting to mitochondrion(GO:1903955) |
| 0.1 | 0.6 | GO:0006482 | protein demethylation(GO:0006482) protein dealkylation(GO:0008214) |
| 0.1 | 1.1 | GO:0010107 | potassium ion import(GO:0010107) |
| 0.1 | 1.5 | GO:1904659 | hexose transmembrane transport(GO:0035428) glucose transmembrane transport(GO:1904659) |
| 0.1 | 0.7 | GO:0018298 | protein-chromophore linkage(GO:0018298) |
| 0.1 | 0.8 | GO:0002430 | complement receptor mediated signaling pathway(GO:0002430) |
| 0.1 | 1.6 | GO:0034308 | primary alcohol metabolic process(GO:0034308) |
| 0.1 | 0.2 | GO:0006004 | fucose metabolic process(GO:0006004) |
| 0.0 | 1.5 | GO:0042490 | mechanoreceptor differentiation(GO:0042490) |
| 0.0 | 0.5 | GO:2000427 | positive regulation of apoptotic cell clearance(GO:2000427) |
| 0.0 | 2.4 | GO:0061337 | cardiac conduction(GO:0061337) |
| 0.0 | 0.6 | GO:0030220 | platelet formation(GO:0030220) |
| 0.0 | 0.3 | GO:2001054 | regulation of mesenchymal cell apoptotic process(GO:2001053) negative regulation of mesenchymal cell apoptotic process(GO:2001054) |
| 0.0 | 0.4 | GO:0042632 | cholesterol homeostasis(GO:0042632) sterol homeostasis(GO:0055092) |
| 0.0 | 0.3 | GO:0035520 | monoubiquitinated protein deubiquitination(GO:0035520) |
| 0.0 | 0.1 | GO:0035754 | B cell chemotaxis(GO:0035754) |
| 0.0 | 1.2 | GO:0007029 | endoplasmic reticulum organization(GO:0007029) |
| 0.0 | 0.7 | GO:0000729 | DNA double-strand break processing(GO:0000729) |
| 0.0 | 0.3 | GO:1900181 | negative regulation of protein localization to nucleus(GO:1900181) |
| 0.0 | 0.7 | GO:0045026 | plasma membrane fusion(GO:0045026) |
| 0.0 | 0.4 | GO:0015937 | coenzyme A biosynthetic process(GO:0015937) |
| 0.0 | 0.6 | GO:1904037 | positive regulation of epithelial cell apoptotic process(GO:1904037) |
| 0.0 | 0.6 | GO:0002042 | cell migration involved in sprouting angiogenesis(GO:0002042) |
| 0.0 | 1.0 | GO:0014047 | glutamate secretion(GO:0014047) |
| 0.0 | 0.2 | GO:0044245 | polysaccharide digestion(GO:0044245) |
| 0.0 | 1.3 | GO:1903169 | regulation of calcium ion transmembrane transport(GO:1903169) |
| 0.0 | 0.8 | GO:0006904 | vesicle docking involved in exocytosis(GO:0006904) |
| 0.0 | 0.1 | GO:0046440 | L-lysine catabolic process to acetyl-CoA(GO:0019474) L-lysine catabolic process(GO:0019477) L-lysine metabolic process(GO:0046440) |
| 0.0 | 0.7 | GO:0060261 | positive regulation of transcription initiation from RNA polymerase II promoter(GO:0060261) |
| 0.0 | 0.3 | GO:0001508 | action potential(GO:0001508) |
| 0.0 | 1.0 | GO:0032480 | negative regulation of type I interferon production(GO:0032480) |
| 0.0 | 0.3 | GO:0034656 | nucleobase-containing small molecule catabolic process(GO:0034656) |
| 0.0 | 0.3 | GO:0046135 | pyrimidine nucleoside catabolic process(GO:0046135) |
| 0.0 | 0.0 | GO:0042487 | regulation of odontogenesis of dentin-containing tooth(GO:0042487) |
| 0.0 | 0.4 | GO:0043968 | histone H2A acetylation(GO:0043968) |
| 0.0 | 0.1 | GO:0010727 | negative regulation of hydrogen peroxide metabolic process(GO:0010727) |
| 0.0 | 1.1 | GO:0061025 | membrane fusion(GO:0061025) |
| 0.0 | 0.2 | GO:0014029 | neural crest formation(GO:0014029) |
| 0.0 | 0.2 | GO:0006768 | biotin metabolic process(GO:0006768) |
| 0.0 | 0.2 | GO:0040015 | negative regulation of multicellular organism growth(GO:0040015) |
Gene overrepresentation in cellular_component category:
| Log-likelihood per target | Total log-likelihood | Term | Description |
|---|---|---|---|
| 27.3 | 191.1 | GO:0033269 | internode region of axon(GO:0033269) |
| 9.2 | 45.8 | GO:0005899 | insulin receptor complex(GO:0005899) |
| 6.6 | 33.0 | GO:0045298 | tubulin complex(GO:0045298) |
| 6.5 | 104.0 | GO:0097512 | cardiac myofibril(GO:0097512) |
| 6.1 | 24.5 | GO:0016533 | cyclin-dependent protein kinase 5 holoenzyme complex(GO:0016533) |
| 5.2 | 36.3 | GO:0044326 | dendritic spine neck(GO:0044326) |
| 4.8 | 14.4 | GO:0060053 | neurofilament cytoskeleton(GO:0060053) |
| 4.1 | 53.3 | GO:0097418 | neurofibrillary tangle(GO:0097418) |
| 4.0 | 12.1 | GO:0034365 | discoidal high-density lipoprotein particle(GO:0034365) |
| 3.6 | 21.5 | GO:0097442 | CA3 pyramidal cell dendrite(GO:0097442) |
| 3.6 | 10.7 | GO:0020005 | symbiont-containing vacuole(GO:0020003) symbiont-containing vacuole membrane(GO:0020005) |
| 3.2 | 45.3 | GO:0097227 | sperm annulus(GO:0097227) |
| 3.2 | 54.8 | GO:0001518 | voltage-gated sodium channel complex(GO:0001518) |
| 3.1 | 105.7 | GO:0000159 | protein phosphatase type 2A complex(GO:0000159) |
| 3.0 | 17.8 | GO:0031232 | extrinsic component of external side of plasma membrane(GO:0031232) |
| 2.9 | 2.9 | GO:0044393 | microspike(GO:0044393) |
| 2.9 | 31.4 | GO:0035686 | sperm fibrous sheath(GO:0035686) |
| 2.5 | 33.1 | GO:1990454 | L-type voltage-gated calcium channel complex(GO:1990454) |
| 2.5 | 27.8 | GO:0005614 | interstitial matrix(GO:0005614) |
| 2.5 | 45.5 | GO:0005890 | sodium:potassium-exchanging ATPase complex(GO:0005890) |
| 2.2 | 6.6 | GO:0044609 | DBIRD complex(GO:0044609) |
| 2.1 | 42.7 | GO:0071782 | endoplasmic reticulum tubular network(GO:0071782) |
| 1.8 | 10.9 | GO:1990769 | proximal neuron projection(GO:1990769) |
| 1.7 | 26.2 | GO:0032433 | filopodium tip(GO:0032433) |
| 1.6 | 8.0 | GO:0005594 | collagen type IX trimer(GO:0005594) |
| 1.6 | 3.1 | GO:0008275 | gamma-tubulin small complex(GO:0008275) |
| 1.6 | 10.9 | GO:0043240 | Fanconi anaemia nuclear complex(GO:0043240) |
| 1.5 | 29.3 | GO:0097386 | glial cell projection(GO:0097386) |
| 1.5 | 55.8 | GO:1990752 | microtubule end(GO:1990752) |
| 1.5 | 11.7 | GO:0045180 | basal cortex(GO:0045180) |
| 1.4 | 5.7 | GO:0034751 | aryl hydrocarbon receptor complex(GO:0034751) |
| 1.4 | 8.3 | GO:0002116 | semaphorin receptor complex(GO:0002116) |
| 1.4 | 5.4 | GO:0031417 | NatC complex(GO:0031417) |
| 1.3 | 10.1 | GO:0098845 | postsynaptic endosome(GO:0098845) |
| 1.3 | 5.0 | GO:1990578 | perinuclear endoplasmic reticulum membrane(GO:1990578) |
| 1.3 | 15.0 | GO:0043194 | axon initial segment(GO:0043194) |
| 1.3 | 12.5 | GO:0031045 | dense core granule(GO:0031045) |
| 1.2 | 123.9 | GO:0030864 | cortical actin cytoskeleton(GO:0030864) |
| 1.2 | 219.5 | GO:0030426 | growth cone(GO:0030426) |
| 1.1 | 7.9 | GO:0030427 | site of polarized growth(GO:0030427) |
| 1.1 | 89.7 | GO:0043195 | terminal bouton(GO:0043195) |
| 1.0 | 31.4 | GO:0005868 | cytoplasmic dynein complex(GO:0005868) |
| 1.0 | 36.3 | GO:0097542 | ciliary tip(GO:0097542) |
| 1.0 | 22.9 | GO:0005686 | U2 snRNP(GO:0005686) |
| 1.0 | 5.9 | GO:0030893 | meiotic cohesin complex(GO:0030893) |
| 1.0 | 46.0 | GO:0005881 | cytoplasmic microtubule(GO:0005881) |
| 1.0 | 10.7 | GO:0033270 | paranode region of axon(GO:0033270) |
| 0.9 | 6.6 | GO:0005869 | dynactin complex(GO:0005869) |
| 0.9 | 3.7 | GO:0072536 | interleukin-23 receptor complex(GO:0072536) |
| 0.9 | 6.2 | GO:0097427 | microtubule bundle(GO:0097427) |
| 0.9 | 13.3 | GO:0043073 | germ cell nucleus(GO:0043073) |
| 0.9 | 17.2 | GO:0005942 | phosphatidylinositol 3-kinase complex(GO:0005942) |
| 0.8 | 10.1 | GO:0033093 | Weibel-Palade body(GO:0033093) |
| 0.8 | 126.1 | GO:0030176 | integral component of endoplasmic reticulum membrane(GO:0030176) |
| 0.8 | 20.7 | GO:0008074 | guanylate cyclase complex, soluble(GO:0008074) |
| 0.8 | 8.3 | GO:0042587 | glycogen granule(GO:0042587) |
| 0.8 | 5.8 | GO:0032580 | Golgi cisterna membrane(GO:0032580) |
| 0.8 | 16.9 | GO:0000812 | Swr1 complex(GO:0000812) |
| 0.8 | 4.8 | GO:0034448 | EGO complex(GO:0034448) Gtr1-Gtr2 GTPase complex(GO:1990131) |
| 0.8 | 3.8 | GO:0071546 | pi-body(GO:0071546) |
| 0.7 | 6.0 | GO:0043203 | axon hillock(GO:0043203) |
| 0.7 | 2.2 | GO:0005960 | glycine cleavage complex(GO:0005960) |
| 0.7 | 36.3 | GO:0044306 | neuron projection terminus(GO:0044306) |
| 0.7 | 4.8 | GO:0070852 | cell body fiber(GO:0070852) |
| 0.7 | 8.7 | GO:0034993 | microtubule organizing center attachment site(GO:0034992) LINC complex(GO:0034993) |
| 0.6 | 4.5 | GO:0044300 | cerebellar mossy fiber(GO:0044300) |
| 0.6 | 12.1 | GO:0005862 | muscle thin filament tropomyosin(GO:0005862) |
| 0.6 | 156.6 | GO:0099572 | postsynaptic density(GO:0014069) postsynaptic specialization(GO:0099572) |
| 0.6 | 3.1 | GO:0014731 | spectrin-associated cytoskeleton(GO:0014731) |
| 0.6 | 38.2 | GO:0099501 | synaptic vesicle membrane(GO:0030672) exocytic vesicle membrane(GO:0099501) |
| 0.6 | 39.2 | GO:0005791 | rough endoplasmic reticulum(GO:0005791) |
| 0.6 | 1.7 | GO:0044423 | virion(GO:0019012) virion part(GO:0044423) |
| 0.6 | 2.2 | GO:0032144 | 4-aminobutyrate transaminase complex(GO:0032144) |
| 0.5 | 3.8 | GO:1990635 | proximal dendrite(GO:1990635) |
| 0.5 | 1.6 | GO:0060187 | cell pole(GO:0060187) |
| 0.5 | 5.8 | GO:0044666 | MLL3/4 complex(GO:0044666) |
| 0.5 | 5.1 | GO:0060076 | excitatory synapse(GO:0060076) |
| 0.5 | 2.5 | GO:0030061 | mitochondrial crista(GO:0030061) |
| 0.5 | 14.5 | GO:0044322 | endoplasmic reticulum quality control compartment(GO:0044322) |
| 0.5 | 10.6 | GO:0042629 | mast cell granule(GO:0042629) |
| 0.5 | 12.9 | GO:0048786 | presynaptic active zone(GO:0048786) |
| 0.5 | 19.7 | GO:0030315 | T-tubule(GO:0030315) |
| 0.4 | 33.8 | GO:0001750 | photoreceptor outer segment(GO:0001750) |
| 0.4 | 13.3 | GO:0090568 | nuclear transcriptional repressor complex(GO:0090568) |
| 0.4 | 82.6 | GO:0005802 | trans-Golgi network(GO:0005802) |
| 0.3 | 13.6 | GO:0005834 | heterotrimeric G-protein complex(GO:0005834) |
| 0.3 | 4.1 | GO:0008385 | IkappaB kinase complex(GO:0008385) |
| 0.3 | 4.5 | GO:0034518 | mRNA cap binding complex(GO:0005845) RNA cap binding complex(GO:0034518) |
| 0.3 | 5.1 | GO:0016580 | Sin3 complex(GO:0016580) |
| 0.3 | 4.9 | GO:0000780 | condensed nuclear chromosome, centromeric region(GO:0000780) |
| 0.3 | 32.0 | GO:0005604 | basement membrane(GO:0005604) |
| 0.3 | 2.5 | GO:0000125 | PCAF complex(GO:0000125) |
| 0.3 | 1.9 | GO:0009331 | glycerol-3-phosphate dehydrogenase complex(GO:0009331) |
| 0.3 | 3.1 | GO:0030897 | HOPS complex(GO:0030897) |
| 0.3 | 33.2 | GO:0030496 | midbody(GO:0030496) |
| 0.3 | 23.1 | GO:0005811 | lipid particle(GO:0005811) |
| 0.3 | 7.1 | GO:0035869 | ciliary transition zone(GO:0035869) |
| 0.3 | 89.2 | GO:0005874 | microtubule(GO:0005874) |
| 0.3 | 16.0 | GO:0019005 | SCF ubiquitin ligase complex(GO:0019005) |
| 0.3 | 4.0 | GO:0005662 | DNA replication factor A complex(GO:0005662) |
| 0.3 | 2.6 | GO:0016602 | CCAAT-binding factor complex(GO:0016602) |
| 0.3 | 29.3 | GO:0031901 | early endosome membrane(GO:0031901) |
| 0.3 | 1.4 | GO:0060091 | kinocilium(GO:0060091) |
| 0.3 | 2.5 | GO:1990712 | HFE-transferrin receptor complex(GO:1990712) |
| 0.3 | 11.4 | GO:0030670 | phagocytic vesicle membrane(GO:0030670) |
| 0.2 | 0.7 | GO:0031372 | UBC13-MMS2 complex(GO:0031372) |
| 0.2 | 4.3 | GO:0005922 | connexon complex(GO:0005922) |
| 0.2 | 0.7 | GO:0005674 | transcription factor TFIIF complex(GO:0005674) |
| 0.2 | 3.7 | GO:0030673 | axolemma(GO:0030673) |
| 0.2 | 6.1 | GO:0035327 | transcriptionally active chromatin(GO:0035327) |
| 0.2 | 11.4 | GO:0008076 | voltage-gated potassium channel complex(GO:0008076) potassium channel complex(GO:0034705) |
| 0.2 | 1.3 | GO:0005921 | gap junction(GO:0005921) |
| 0.2 | 12.3 | GO:0043204 | perikaryon(GO:0043204) |
| 0.2 | 15.8 | GO:0032432 | actin filament bundle(GO:0032432) |
| 0.2 | 3.1 | GO:0005875 | microtubule associated complex(GO:0005875) |
| 0.2 | 1.0 | GO:0045272 | plasma membrane respiratory chain complex I(GO:0045272) |
| 0.2 | 1.9 | GO:0030877 | beta-catenin destruction complex(GO:0030877) |
| 0.2 | 3.1 | GO:0032420 | stereocilium(GO:0032420) |
| 0.2 | 45.3 | GO:0098857 | membrane microdomain(GO:0098857) |
| 0.2 | 4.8 | GO:0030118 | clathrin coat(GO:0030118) |
| 0.2 | 1.3 | GO:0016012 | dystroglycan complex(GO:0016011) sarcoglycan complex(GO:0016012) |
| 0.2 | 21.3 | GO:0043209 | myelin sheath(GO:0043209) |
| 0.2 | 0.9 | GO:0016589 | NURF complex(GO:0016589) |
| 0.2 | 10.0 | GO:0036477 | somatodendritic compartment(GO:0036477) |
| 0.2 | 21.3 | GO:0030424 | axon(GO:0030424) |
| 0.2 | 40.0 | GO:0016323 | basolateral plasma membrane(GO:0016323) |
| 0.2 | 6.0 | GO:0016324 | apical plasma membrane(GO:0016324) |
| 0.2 | 1.6 | GO:0005847 | mRNA cleavage and polyadenylation specificity factor complex(GO:0005847) |
| 0.2 | 15.9 | GO:0030139 | endocytic vesicle(GO:0030139) |
| 0.2 | 43.4 | GO:0005578 | proteinaceous extracellular matrix(GO:0005578) |
| 0.2 | 1.8 | GO:0097225 | sperm midpiece(GO:0097225) |
| 0.1 | 1.1 | GO:0097486 | multivesicular body lumen(GO:0097486) |
| 0.1 | 0.8 | GO:0008537 | proteasome activator complex(GO:0008537) |
| 0.1 | 2.4 | GO:0005892 | acetylcholine-gated channel complex(GO:0005892) |
| 0.1 | 3.7 | GO:0080008 | Cul4-RING E3 ubiquitin ligase complex(GO:0080008) |
| 0.1 | 0.9 | GO:0099738 | cell cortex region(GO:0099738) |
| 0.1 | 1.5 | GO:0005671 | Ada2/Gcn5/Ada3 transcription activator complex(GO:0005671) |
| 0.1 | 5.8 | GO:0001669 | acrosomal vesicle(GO:0001669) |
| 0.1 | 1.1 | GO:0045177 | apical part of cell(GO:0045177) |
| 0.1 | 0.7 | GO:0033063 | DNA recombinase mediator complex(GO:0033061) Rad51B-Rad51C-Rad51D-XRCC2 complex(GO:0033063) |
| 0.1 | 4.5 | GO:0031514 | motile cilium(GO:0031514) |
| 0.1 | 5.2 | GO:0034702 | ion channel complex(GO:0034702) |
| 0.1 | 6.8 | GO:0005938 | cell cortex(GO:0005938) |
| 0.1 | 0.3 | GO:0005641 | nuclear envelope lumen(GO:0005641) |
| 0.1 | 0.8 | GO:0032391 | photoreceptor connecting cilium(GO:0032391) |
| 0.1 | 0.9 | GO:0042575 | DNA polymerase complex(GO:0042575) |
| 0.1 | 5.7 | GO:0005758 | mitochondrial intermembrane space(GO:0005758) organelle envelope lumen(GO:0031970) |
| 0.1 | 1.9 | GO:0031304 | intrinsic component of mitochondrial inner membrane(GO:0031304) integral component of mitochondrial inner membrane(GO:0031305) |
| 0.1 | 2.5 | GO:0033017 | sarcoplasmic reticulum membrane(GO:0033017) |
| 0.1 | 111.0 | GO:0005887 | integral component of plasma membrane(GO:0005887) |
| 0.1 | 6.9 | GO:0031225 | anchored component of membrane(GO:0031225) |
| 0.1 | 1.1 | GO:0031588 | nucleotide-activated protein kinase complex(GO:0031588) |
| 0.1 | 4.2 | GO:0000922 | spindle pole(GO:0000922) |
| 0.0 | 0.5 | GO:0030008 | TRAPP complex(GO:0030008) |
| 0.0 | 3.7 | GO:0043202 | lysosomal lumen(GO:0043202) |
| 0.0 | 8.2 | GO:0005788 | endoplasmic reticulum lumen(GO:0005788) |
| 0.0 | 1.3 | GO:0030173 | integral component of Golgi membrane(GO:0030173) |
| 0.0 | 5.8 | GO:0005741 | mitochondrial outer membrane(GO:0005741) |
| 0.0 | 5.5 | GO:0043005 | neuron projection(GO:0043005) |
| 0.0 | 9.6 | GO:0044429 | mitochondrial part(GO:0044429) |
| 0.0 | 0.1 | GO:0005968 | Rab-protein geranylgeranyltransferase complex(GO:0005968) |
Gene overrepresentation in molecular_function category:
| Log-likelihood per target | Total log-likelihood | Term | Description |
|---|---|---|---|
| 28.6 | 343.7 | GO:0019911 | structural constituent of myelin sheath(GO:0019911) |
| 13.9 | 41.7 | GO:0004157 | dihydropyrimidinase activity(GO:0004157) |
| 11.5 | 46.1 | GO:0004667 | prostaglandin-D synthase activity(GO:0004667) |
| 8.2 | 24.5 | GO:0016534 | cyclin-dependent protein kinase 5 activator activity(GO:0016534) |
| 7.6 | 22.7 | GO:0016155 | formyltetrahydrofolate dehydrogenase activity(GO:0016155) |
| 7.3 | 58.7 | GO:0035374 | chondroitin sulfate binding(GO:0035374) |
| 7.2 | 28.7 | GO:0099609 | microtubule lateral binding(GO:0099609) |
| 6.2 | 31.1 | GO:0001641 | group II metabotropic glutamate receptor activity(GO:0001641) |
| 6.1 | 18.3 | GO:0070326 | very-low-density lipoprotein particle receptor binding(GO:0070326) |
| 6.0 | 18.1 | GO:0030350 | iron-responsive element binding(GO:0030350) |
| 5.9 | 23.6 | GO:0004356 | glutamate-ammonia ligase activity(GO:0004356) ammonia ligase activity(GO:0016211) acid-ammonia (or amide) ligase activity(GO:0016880) |
| 5.6 | 22.2 | GO:0047391 | alkylglycerophosphoethanolamine phosphodiesterase activity(GO:0047391) |
| 4.8 | 76.4 | GO:0005391 | sodium:potassium-exchanging ATPase activity(GO:0005391) |
| 4.5 | 27.2 | GO:0016909 | JUN kinase activity(GO:0004705) SAP kinase activity(GO:0016909) |
| 4.1 | 16.6 | GO:0031694 | alpha-2A adrenergic receptor binding(GO:0031694) |
| 3.9 | 54.2 | GO:0017162 | aryl hydrocarbon receptor binding(GO:0017162) |
| 3.8 | 18.8 | GO:0004687 | myosin light chain kinase activity(GO:0004687) |
| 3.6 | 21.5 | GO:0035368 | selenocysteine insertion sequence binding(GO:0035368) |
| 3.6 | 10.7 | GO:0035379 | carbon dioxide transmembrane transporter activity(GO:0035379) |
| 3.3 | 29.8 | GO:0060002 | plus-end directed microfilament motor activity(GO:0060002) |
| 3.3 | 6.6 | GO:0051538 | 3 iron, 4 sulfur cluster binding(GO:0051538) |
| 3.2 | 25.3 | GO:0086056 | voltage-gated calcium channel activity involved in AV node cell action potential(GO:0086056) |
| 3.1 | 9.4 | GO:0050211 | procollagen galactosyltransferase activity(GO:0050211) |
| 2.9 | 90.1 | GO:0005212 | structural constituent of eye lens(GO:0005212) |
| 2.8 | 14.0 | GO:0038062 | protein tyrosine kinase collagen receptor activity(GO:0038062) |
| 2.8 | 8.3 | GO:0071558 | histone demethylase activity (H3-K27 specific)(GO:0071558) |
| 2.8 | 13.9 | GO:0060961 | phospholipase D inhibitor activity(GO:0060961) |
| 2.6 | 13.2 | GO:0086006 | voltage-gated sodium channel activity involved in cardiac muscle cell action potential(GO:0086006) |
| 2.6 | 52.5 | GO:0051787 | misfolded protein binding(GO:0051787) |
| 2.5 | 7.6 | GO:0070052 | collagen V binding(GO:0070052) |
| 2.5 | 7.5 | GO:0004813 | alanine-tRNA ligase activity(GO:0004813) |
| 2.3 | 23.4 | GO:0005007 | fibroblast growth factor-activated receptor activity(GO:0005007) |
| 2.3 | 40.5 | GO:1905030 | voltage-gated sodium channel activity(GO:0005248) voltage-gated ion channel activity involved in regulation of postsynaptic membrane potential(GO:1905030) |
| 2.1 | 36.4 | GO:0031005 | filamin binding(GO:0031005) |
| 2.1 | 6.3 | GO:0047192 | 1-alkylglycerophosphocholine O-acetyltransferase activity(GO:0047192) |
| 2.1 | 12.5 | GO:0008597 | calcium-dependent protein serine/threonine phosphatase regulator activity(GO:0008597) |
| 2.1 | 10.3 | GO:0032795 | heterotrimeric G-protein binding(GO:0032795) |
| 2.0 | 10.2 | GO:0004668 | protein-arginine deiminase activity(GO:0004668) |
| 2.0 | 90.2 | GO:0030507 | spectrin binding(GO:0030507) |
| 1.9 | 9.7 | GO:0047144 | 2-acylglycerol-3-phosphate O-acyltransferase activity(GO:0047144) |
| 1.9 | 5.7 | GO:0001884 | pyrimidine nucleoside binding(GO:0001884) UTP binding(GO:0002134) sulfonylurea receptor binding(GO:0017098) pyrimidine ribonucleoside binding(GO:0032551) |
| 1.9 | 20.8 | GO:0046935 | 1-phosphatidylinositol-3-kinase regulator activity(GO:0046935) |
| 1.8 | 7.2 | GO:0004598 | peptidylglycine monooxygenase activity(GO:0004504) peptidylamidoglycolate lyase activity(GO:0004598) |
| 1.8 | 7.1 | GO:0005502 | 11-cis retinal binding(GO:0005502) |
| 1.8 | 8.8 | GO:0004468 | lysine N-acetyltransferase activity, acting on acetyl phosphate as donor(GO:0004468) |
| 1.7 | 43.0 | GO:0005086 | ARF guanyl-nucleotide exchange factor activity(GO:0005086) |
| 1.6 | 43.7 | GO:0005001 | transmembrane receptor protein tyrosine phosphatase activity(GO:0005001) transmembrane receptor protein phosphatase activity(GO:0019198) |
| 1.6 | 6.3 | GO:0004140 | dephospho-CoA kinase activity(GO:0004140) |
| 1.6 | 4.7 | GO:0004477 | methenyltetrahydrofolate cyclohydrolase activity(GO:0004477) methylenetetrahydrofolate dehydrogenase (NAD+) activity(GO:0004487) methylenetetrahydrofolate dehydrogenase (NADP+) activity(GO:0004488) |
| 1.5 | 4.5 | GO:0016215 | stearoyl-CoA 9-desaturase activity(GO:0004768) acyl-CoA desaturase activity(GO:0016215) |
| 1.5 | 25.5 | GO:0004089 | carbonate dehydratase activity(GO:0004089) |
| 1.4 | 52.2 | GO:0017091 | AU-rich element binding(GO:0017091) |
| 1.4 | 6.9 | GO:0070097 | delta-catenin binding(GO:0070097) |
| 1.4 | 17.8 | GO:0017034 | Rap guanyl-nucleotide exchange factor activity(GO:0017034) |
| 1.4 | 8.1 | GO:0008440 | inositol-1,4,5-trisphosphate 3-kinase activity(GO:0008440) |
| 1.4 | 5.4 | GO:0008889 | glycerophosphodiester phosphodiesterase activity(GO:0008889) |
| 1.3 | 3.9 | GO:0047275 | glucosaminylgalactosylglucosylceramide beta-galactosyltransferase activity(GO:0047275) |
| 1.3 | 28.8 | GO:0002162 | dystroglycan binding(GO:0002162) |
| 1.2 | 3.6 | GO:0048763 | calcium-induced calcium release activity(GO:0048763) |
| 1.2 | 9.3 | GO:0031802 | type 5 metabotropic glutamate receptor binding(GO:0031802) |
| 1.2 | 23.3 | GO:0051010 | microtubule plus-end binding(GO:0051010) |
| 1.1 | 3.4 | GO:0005137 | interleukin-5 receptor binding(GO:0005137) |
| 1.1 | 8.0 | GO:0030020 | extracellular matrix structural constituent conferring tensile strength(GO:0030020) |
| 1.1 | 134.0 | GO:0005070 | SH3/SH2 adaptor activity(GO:0005070) |
| 1.1 | 16.9 | GO:0004887 | thyroid hormone receptor activity(GO:0004887) |
| 1.1 | 10.1 | GO:0032051 | clathrin light chain binding(GO:0032051) |
| 1.1 | 8.9 | GO:0070181 | small ribosomal subunit rRNA binding(GO:0070181) |
| 1.1 | 29.9 | GO:0098641 | cadherin binding involved in cell-cell adhesion(GO:0098641) |
| 1.1 | 6.6 | GO:0008568 | microtubule-severing ATPase activity(GO:0008568) |
| 1.1 | 3.3 | GO:0015234 | thiamine transmembrane transporter activity(GO:0015234) thiamine uptake transmembrane transporter activity(GO:0015403) |
| 1.1 | 4.3 | GO:0031871 | proteinase activated receptor binding(GO:0031871) |
| 1.1 | 3.2 | GO:0008431 | vitamin E binding(GO:0008431) |
| 1.0 | 106.2 | GO:0019888 | protein phosphatase regulator activity(GO:0019888) |
| 1.0 | 14.3 | GO:0015250 | water channel activity(GO:0015250) |
| 1.0 | 7.1 | GO:0015501 | glutamate:sodium symporter activity(GO:0015501) |
| 1.0 | 6.1 | GO:0004741 | [pyruvate dehydrogenase (lipoamide)] phosphatase activity(GO:0004741) |
| 1.0 | 4.0 | GO:0001609 | G-protein coupled adenosine receptor activity(GO:0001609) |
| 1.0 | 3.0 | GO:0004719 | protein-L-isoaspartate (D-aspartate) O-methyltransferase activity(GO:0004719) |
| 1.0 | 11.0 | GO:0017128 | phospholipid scramblase activity(GO:0017128) |
| 1.0 | 6.0 | GO:0036312 | phosphatidylinositol 3-kinase regulatory subunit binding(GO:0036312) |
| 1.0 | 5.8 | GO:0003998 | acylphosphatase activity(GO:0003998) |
| 1.0 | 1.0 | GO:0047498 | calcium-dependent phospholipase A2 activity(GO:0047498) |
| 0.9 | 3.7 | GO:0042019 | interleukin-23 binding(GO:0042019) interleukin-23 receptor activity(GO:0042020) |
| 0.9 | 23.3 | GO:0005521 | lamin binding(GO:0005521) |
| 0.9 | 20.6 | GO:0030676 | Rac guanyl-nucleotide exchange factor activity(GO:0030676) |
| 0.9 | 17.9 | GO:0004862 | cAMP-dependent protein kinase inhibitor activity(GO:0004862) |
| 0.9 | 4.5 | GO:0008174 | mRNA methyltransferase activity(GO:0008174) |
| 0.9 | 21.8 | GO:0043014 | alpha-tubulin binding(GO:0043014) |
| 0.9 | 5.1 | GO:0003873 | 6-phosphofructo-2-kinase activity(GO:0003873) fructose-2,6-bisphosphate 2-phosphatase activity(GO:0004331) |
| 0.8 | 4.2 | GO:0016907 | G-protein coupled acetylcholine receptor activity(GO:0016907) |
| 0.8 | 11.0 | GO:0001087 | transcription factor activity, sequence-specific DNA binding, RNA polymerase recruiting(GO:0001011) transcription factor activity, TFIIB-class binding(GO:0001087) |
| 0.8 | 57.4 | GO:0005546 | phosphatidylinositol-4,5-bisphosphate binding(GO:0005546) |
| 0.8 | 20.7 | GO:0004383 | guanylate cyclase activity(GO:0004383) |
| 0.8 | 9.1 | GO:0016918 | retinal binding(GO:0016918) |
| 0.8 | 2.4 | GO:0004814 | arginine-tRNA ligase activity(GO:0004814) |
| 0.8 | 10.4 | GO:0008331 | high voltage-gated calcium channel activity(GO:0008331) |
| 0.8 | 8.7 | GO:0004030 | aldehyde dehydrogenase [NAD(P)+] activity(GO:0004030) |
| 0.8 | 7.7 | GO:0005225 | volume-sensitive anion channel activity(GO:0005225) |
| 0.8 | 25.7 | GO:0005452 | inorganic anion exchanger activity(GO:0005452) |
| 0.7 | 3.0 | GO:0004032 | alditol:NADP+ 1-oxidoreductase activity(GO:0004032) |
| 0.7 | 9.0 | GO:0008157 | protein phosphatase 1 binding(GO:0008157) |
| 0.7 | 2.8 | GO:0017089 | glycolipid transporter activity(GO:0017089) ceramide binding(GO:0097001) |
| 0.7 | 8.4 | GO:0005004 | GPI-linked ephrin receptor activity(GO:0005004) |
| 0.7 | 31.5 | GO:0017080 | sodium channel regulator activity(GO:0017080) |
| 0.7 | 10.9 | GO:0045499 | chemorepellent activity(GO:0045499) |
| 0.7 | 2.6 | GO:0004803 | transposase activity(GO:0004803) |
| 0.7 | 2.0 | GO:0004983 | neuropeptide Y receptor activity(GO:0004983) |
| 0.6 | 9.7 | GO:0004716 | receptor signaling protein tyrosine kinase activity(GO:0004716) |
| 0.6 | 183.7 | GO:0015631 | tubulin binding(GO:0015631) |
| 0.6 | 30.3 | GO:0004364 | glutathione transferase activity(GO:0004364) |
| 0.6 | 81.9 | GO:0005200 | structural constituent of cytoskeleton(GO:0005200) |
| 0.6 | 4.3 | GO:0030160 | GKAP/Homer scaffold activity(GO:0030160) |
| 0.6 | 1.2 | GO:0004016 | adenylate cyclase activity(GO:0004016) |
| 0.6 | 4.0 | GO:0015277 | kainate selective glutamate receptor activity(GO:0015277) |
| 0.6 | 3.4 | GO:0008553 | hydrogen-exporting ATPase activity, phosphorylative mechanism(GO:0008553) |
| 0.6 | 14.1 | GO:0008191 | metalloendopeptidase inhibitor activity(GO:0008191) |
| 0.6 | 2.2 | GO:0032145 | 4-aminobutyrate transaminase activity(GO:0003867) succinate-semialdehyde dehydrogenase binding(GO:0032145) (S)-3-amino-2-methylpropionate transaminase activity(GO:0047298) |
| 0.5 | 72.7 | GO:0005496 | steroid binding(GO:0005496) |
| 0.5 | 2.7 | GO:0004652 | polynucleotide adenylyltransferase activity(GO:0004652) |
| 0.5 | 2.6 | GO:0008113 | peptide-methionine (S)-S-oxide reductase activity(GO:0008113) |
| 0.5 | 6.8 | GO:0030215 | semaphorin receptor binding(GO:0030215) |
| 0.5 | 4.6 | GO:0043225 | anion transmembrane-transporting ATPase activity(GO:0043225) |
| 0.5 | 3.6 | GO:0035591 | signaling adaptor activity(GO:0035591) |
| 0.5 | 4.5 | GO:0051425 | PTB domain binding(GO:0051425) |
| 0.5 | 10.8 | GO:0008239 | dipeptidyl-peptidase activity(GO:0008239) |
| 0.5 | 1.9 | GO:0052590 | sn-glycerol-3-phosphate:ubiquinone oxidoreductase activity(GO:0052590) sn-glycerol-3-phosphate:ubiquinone-8 oxidoreductase activity(GO:0052591) |
| 0.5 | 2.3 | GO:0005315 | inorganic phosphate transmembrane transporter activity(GO:0005315) |
| 0.4 | 10.0 | GO:0031489 | myosin V binding(GO:0031489) |
| 0.4 | 10.5 | GO:0004622 | lysophospholipase activity(GO:0004622) |
| 0.4 | 11.3 | GO:0005388 | calcium-transporting ATPase activity(GO:0005388) |
| 0.4 | 5.1 | GO:0022889 | L-serine transmembrane transporter activity(GO:0015194) serine transmembrane transporter activity(GO:0022889) |
| 0.4 | 3.0 | GO:0050733 | RS domain binding(GO:0050733) |
| 0.4 | 7.9 | GO:0016769 | transferase activity, transferring nitrogenous groups(GO:0016769) |
| 0.4 | 0.4 | GO:0034056 | estrogen response element binding(GO:0034056) |
| 0.4 | 1.2 | GO:0008267 | poly-glutamine tract binding(GO:0008267) |
| 0.4 | 10.0 | GO:0005523 | tropomyosin binding(GO:0005523) |
| 0.4 | 2.0 | GO:0019869 | chloride channel inhibitor activity(GO:0019869) |
| 0.4 | 2.8 | GO:0030506 | ankyrin binding(GO:0030506) |
| 0.4 | 3.6 | GO:0004322 | ferroxidase activity(GO:0004322) oxidoreductase activity, oxidizing metal ions, oxygen as acceptor(GO:0016724) |
| 0.4 | 5.1 | GO:0038132 | neuregulin binding(GO:0038132) |
| 0.4 | 2.4 | GO:0070087 | chromo shadow domain binding(GO:0070087) |
| 0.4 | 299.8 | GO:0005509 | calcium ion binding(GO:0005509) |
| 0.4 | 1.9 | GO:0048039 | ubiquinone binding(GO:0048039) |
| 0.4 | 7.3 | GO:0016805 | dipeptidase activity(GO:0016805) |
| 0.4 | 1.5 | GO:0019211 | phosphatase activator activity(GO:0019211) |
| 0.4 | 5.6 | GO:0005243 | gap junction channel activity(GO:0005243) |
| 0.4 | 14.1 | GO:0030544 | Hsp70 protein binding(GO:0030544) |
| 0.4 | 2.2 | GO:0050291 | sphingosine N-acyltransferase activity(GO:0050291) |
| 0.4 | 1.8 | GO:0017060 | 3-galactosyl-N-acetylglucosaminide 4-alpha-L-fucosyltransferase activity(GO:0017060) |
| 0.4 | 6.4 | GO:0050321 | tau-protein kinase activity(GO:0050321) |
| 0.3 | 15.0 | GO:0008307 | structural constituent of muscle(GO:0008307) |
| 0.3 | 9.4 | GO:0019865 | immunoglobulin binding(GO:0019865) |
| 0.3 | 1.6 | GO:0052724 | inositol-1,3,4,5,6-pentakisphosphate kinase activity(GO:0000827) inositol hexakisphosphate kinase activity(GO:0000828) inositol heptakisphosphate kinase activity(GO:0000829) inositol hexakisphosphate 5-kinase activity(GO:0000832) diphosphoinositol-pentakisphosphate kinase activity(GO:0033857) inositol hexakisphosphate 1-kinase activity(GO:0052723) inositol hexakisphosphate 3-kinase activity(GO:0052724) |
| 0.3 | 2.2 | GO:0010314 | phosphatidylinositol-5-phosphate binding(GO:0010314) |
| 0.3 | 4.1 | GO:0008574 | ATP-dependent microtubule motor activity, plus-end-directed(GO:0008574) |
| 0.3 | 11.3 | GO:0005227 | calcium activated cation channel activity(GO:0005227) |
| 0.3 | 6.9 | GO:0001784 | phosphotyrosine binding(GO:0001784) |
| 0.3 | 0.9 | GO:0017108 | 5'-flap endonuclease activity(GO:0017108) |
| 0.3 | 1.5 | GO:0046923 | ER retention sequence binding(GO:0046923) |
| 0.3 | 0.6 | GO:0016717 | oxidoreductase activity, acting on paired donors, with oxidation of a pair of donors resulting in the reduction of molecular oxygen to two molecules of water(GO:0016717) |
| 0.3 | 4.6 | GO:0004861 | cyclin-dependent protein serine/threonine kinase inhibitor activity(GO:0004861) |
| 0.3 | 0.9 | GO:0004832 | valine-tRNA ligase activity(GO:0004832) |
| 0.3 | 3.9 | GO:0017151 | DEAD/H-box RNA helicase binding(GO:0017151) |
| 0.3 | 8.6 | GO:0005246 | calcium channel regulator activity(GO:0005246) |
| 0.3 | 1.1 | GO:1904047 | S-adenosyl-L-methionine binding(GO:1904047) |
| 0.3 | 2.5 | GO:0005025 | transforming growth factor beta receptor activity, type I(GO:0005025) |
| 0.3 | 1.6 | GO:0003886 | DNA (cytosine-5-)-methyltransferase activity(GO:0003886) |
| 0.3 | 5.3 | GO:0003746 | translation elongation factor activity(GO:0003746) |
| 0.3 | 56.5 | GO:0000287 | magnesium ion binding(GO:0000287) |
| 0.3 | 3.0 | GO:0004017 | adenylate kinase activity(GO:0004017) |
| 0.2 | 9.2 | GO:0003755 | peptidyl-prolyl cis-trans isomerase activity(GO:0003755) |
| 0.2 | 2.2 | GO:0020037 | heme binding(GO:0020037) |
| 0.2 | 1.2 | GO:0016300 | tRNA (uracil) methyltransferase activity(GO:0016300) |
| 0.2 | 2.8 | GO:0031386 | protein tag(GO:0031386) |
| 0.2 | 1.1 | GO:0008376 | acetylgalactosaminyltransferase activity(GO:0008376) |
| 0.2 | 1.5 | GO:0008121 | ubiquinol-cytochrome-c reductase activity(GO:0008121) oxidoreductase activity, acting on diphenols and related substances as donors, cytochrome as acceptor(GO:0016681) |
| 0.2 | 1.7 | GO:0099583 | neurotransmitter receptor activity involved in regulation of postsynaptic cytosolic calcium ion concentration(GO:0099583) |
| 0.2 | 3.5 | GO:0017136 | NAD-dependent histone deacetylase activity(GO:0017136) |
| 0.2 | 0.8 | GO:0061628 | H3K27me3 modified histone binding(GO:0061628) |
| 0.2 | 1.2 | GO:0015172 | L-glutamate transmembrane transporter activity(GO:0005313) acidic amino acid transmembrane transporter activity(GO:0015172) |
| 0.2 | 1.4 | GO:0035005 | 1-phosphatidylinositol-4-phosphate 3-kinase activity(GO:0035005) |
| 0.2 | 1.2 | GO:0004118 | cGMP-stimulated cyclic-nucleotide phosphodiesterase activity(GO:0004118) |
| 0.2 | 6.2 | GO:0005031 | tumor necrosis factor-activated receptor activity(GO:0005031) death receptor activity(GO:0005035) |
| 0.2 | 1.4 | GO:0050694 | galactosylceramide sulfotransferase activity(GO:0001733) galactose 3-O-sulfotransferase activity(GO:0050694) |
| 0.2 | 1.0 | GO:0004489 | methylenetetrahydrofolate reductase (NAD(P)H) activity(GO:0004489) |
| 0.2 | 2.7 | GO:0003841 | 1-acylglycerol-3-phosphate O-acyltransferase activity(GO:0003841) |
| 0.2 | 5.3 | GO:0005080 | protein kinase C binding(GO:0005080) |
| 0.2 | 1.3 | GO:0042910 | xenobiotic transporter activity(GO:0042910) |
| 0.2 | 2.8 | GO:0005402 | sugar:proton symporter activity(GO:0005351) cation:sugar symporter activity(GO:0005402) |
| 0.2 | 2.0 | GO:0097016 | L27 domain binding(GO:0097016) |
| 0.2 | 1.1 | GO:0004800 | thyroxine 5'-deiodinase activity(GO:0004800) |
| 0.2 | 4.1 | GO:0008266 | poly(U) RNA binding(GO:0008266) |
| 0.2 | 1.6 | GO:0005229 | intracellular calcium activated chloride channel activity(GO:0005229) |
| 0.2 | 24.5 | GO:0017137 | Rab GTPase binding(GO:0017137) |
| 0.2 | 3.2 | GO:0005149 | interleukin-1 receptor binding(GO:0005149) |
| 0.2 | 8.7 | GO:0001618 | virus receptor activity(GO:0001618) |
| 0.2 | 3.5 | GO:0005154 | epidermal growth factor receptor binding(GO:0005154) |
| 0.2 | 1.2 | GO:0008109 | N-acetyllactosaminide beta-1,6-N-acetylglucosaminyltransferase activity(GO:0008109) |
| 0.2 | 1.2 | GO:0016167 | glial cell-derived neurotrophic factor receptor activity(GO:0016167) |
| 0.2 | 5.0 | GO:0036002 | pre-mRNA binding(GO:0036002) |
| 0.2 | 1.9 | GO:0005021 | vascular endothelial growth factor-activated receptor activity(GO:0005021) |
| 0.2 | 16.9 | GO:0004222 | metalloendopeptidase activity(GO:0004222) |
| 0.2 | 11.6 | GO:0030165 | PDZ domain binding(GO:0030165) |
| 0.2 | 1.0 | GO:1990829 | C-rich single-stranded DNA binding(GO:1990829) |
| 0.2 | 0.6 | GO:0004657 | proline dehydrogenase activity(GO:0004657) |
| 0.2 | 1.4 | GO:0036310 | annealing helicase activity(GO:0036310) |
| 0.2 | 0.6 | GO:0004530 | ribonuclease III activity(GO:0004525) deoxyribonuclease I activity(GO:0004530) double-stranded RNA-specific ribonuclease activity(GO:0032296) |
| 0.2 | 0.8 | GO:0004982 | N-formyl peptide receptor activity(GO:0004982) |
| 0.2 | 3.7 | GO:0071855 | neuropeptide receptor binding(GO:0071855) |
| 0.1 | 0.6 | GO:0001588 | dopamine neurotransmitter receptor activity, coupled via Gs(GO:0001588) |
| 0.1 | 0.7 | GO:0005113 | patched binding(GO:0005113) |
| 0.1 | 3.6 | GO:0031683 | G-protein beta/gamma-subunit complex binding(GO:0031683) |
| 0.1 | 1.9 | GO:0030742 | GTP-dependent protein binding(GO:0030742) |
| 0.1 | 2.2 | GO:0001671 | ATPase activator activity(GO:0001671) |
| 0.1 | 0.5 | GO:0015643 | toxic substance binding(GO:0015643) |
| 0.1 | 3.6 | GO:0043539 | protein serine/threonine kinase activator activity(GO:0043539) |
| 0.1 | 16.1 | GO:0008201 | heparin binding(GO:0008201) |
| 0.1 | 0.5 | GO:0033829 | O-fucosylpeptide 3-beta-N-acetylglucosaminyltransferase activity(GO:0033829) |
| 0.1 | 52.4 | GO:0008289 | lipid binding(GO:0008289) |
| 0.1 | 1.8 | GO:0016638 | oxidoreductase activity, acting on the CH-NH2 group of donors(GO:0016638) |
| 0.1 | 0.8 | GO:0061133 | endopeptidase activator activity(GO:0061133) |
| 0.1 | 0.9 | GO:0070840 | dynein complex binding(GO:0070840) |
| 0.1 | 0.7 | GO:0003828 | alpha-N-acetylneuraminate alpha-2,8-sialyltransferase activity(GO:0003828) |
| 0.1 | 0.7 | GO:0000990 | transcription factor activity, core RNA polymerase binding(GO:0000990) |
| 0.1 | 1.6 | GO:0015467 | G-protein activated inward rectifier potassium channel activity(GO:0015467) |
| 0.1 | 1.2 | GO:0032454 | histone demethylase activity (H3-K9 specific)(GO:0032454) |
| 0.1 | 5.0 | GO:0002020 | protease binding(GO:0002020) |
| 0.1 | 1.9 | GO:0004033 | aldo-keto reductase (NADP) activity(GO:0004033) |
| 0.1 | 1.7 | GO:0004993 | G-protein coupled serotonin receptor activity(GO:0004993) |
| 0.1 | 8.1 | GO:0004197 | cysteine-type endopeptidase activity(GO:0004197) |
| 0.1 | 2.8 | GO:0005109 | frizzled binding(GO:0005109) |
| 0.1 | 0.2 | GO:0008422 | beta-glucosidase activity(GO:0008422) |
| 0.1 | 1.5 | GO:0017075 | syntaxin-1 binding(GO:0017075) |
| 0.1 | 1.8 | GO:0035255 | ionotropic glutamate receptor binding(GO:0035255) |
| 0.1 | 0.3 | GO:0005412 | glucose:sodium symporter activity(GO:0005412) |
| 0.1 | 0.7 | GO:0008020 | G-protein coupled photoreceptor activity(GO:0008020) |
| 0.1 | 0.3 | GO:0033265 | acetylcholinesterase activity(GO:0003990) choline binding(GO:0033265) |
| 0.1 | 4.1 | GO:0051117 | ATPase binding(GO:0051117) |
| 0.1 | 3.9 | GO:0044325 | ion channel binding(GO:0044325) |
| 0.1 | 1.8 | GO:0019894 | kinesin binding(GO:0019894) |
| 0.1 | 2.9 | GO:0030374 | ligand-dependent nuclear receptor transcription coactivator activity(GO:0030374) |
| 0.1 | 0.2 | GO:0003989 | acetyl-CoA carboxylase activity(GO:0003989) |
| 0.1 | 0.6 | GO:0005245 | voltage-gated calcium channel activity(GO:0005245) |
| 0.1 | 0.2 | GO:0047708 | biotinidase activity(GO:0047708) |
| 0.1 | 0.3 | GO:0019103 | pyrimidine nucleotide binding(GO:0019103) |
| 0.1 | 0.3 | GO:0001075 | transcription factor activity, RNA polymerase II core promoter sequence-specific binding involved in preinitiation complex assembly(GO:0001075) |
| 0.1 | 0.7 | GO:0005132 | type I interferon receptor binding(GO:0005132) |
| 0.0 | 1.0 | GO:0016702 | oxidoreductase activity, acting on single donors with incorporation of molecular oxygen(GO:0016701) oxidoreductase activity, acting on single donors with incorporation of molecular oxygen, incorporation of two atoms of oxygen(GO:0016702) |
| 0.0 | 0.3 | GO:0031681 | thrombin receptor activity(GO:0015057) G-protein beta-subunit binding(GO:0031681) |
| 0.0 | 2.0 | GO:0004984 | olfactory receptor activity(GO:0004984) |
| 0.0 | 0.1 | GO:0035673 | oligopeptide transmembrane transporter activity(GO:0035673) |
| 0.0 | 12.9 | GO:0004842 | ubiquitin-protein transferase activity(GO:0004842) |
| 0.0 | 4.5 | GO:0008022 | protein C-terminus binding(GO:0008022) |
| 0.0 | 0.1 | GO:0008046 | axon guidance receptor activity(GO:0008046) |
| 0.0 | 0.2 | GO:0008417 | fucosyltransferase activity(GO:0008417) |
| 0.0 | 0.5 | GO:0042166 | acetylcholine binding(GO:0042166) |
| 0.0 | 0.3 | GO:0030553 | cGMP binding(GO:0030553) |
| 0.0 | 0.1 | GO:0016647 | oxidoreductase activity, acting on the CH-NH group of donors, oxygen as acceptor(GO:0016647) |
| 0.0 | 0.8 | GO:0035064 | methylated histone binding(GO:0035064) |
Gene overrepresentation in C2:CP category:
| Log-likelihood per target | Total log-likelihood | Term | Description |
|---|---|---|---|
| 5.2 | 93.4 | PID P38 GAMMA DELTA PATHWAY | Signaling mediated by p38-gamma and p38-delta |
| 3.8 | 7.5 | SA REG CASCADE OF CYCLIN EXPR | Expression of cyclins regulates progression through the cell cycle by activating cyclin-dependent kinases. |
| 2.7 | 8.1 | ST PAC1 RECEPTOR PATHWAY | PAC1 Receptor Pathway |
| 1.3 | 89.7 | ST DIFFERENTIATION PATHWAY IN PC12 CELLS | Differentiation Pathway in PC12 Cells; this is a specific case of PAC1 Receptor Pathway. |
| 1.2 | 37.6 | PID SYNDECAN 3 PATHWAY | Syndecan-3-mediated signaling events |
| 1.1 | 70.6 | PID ATR PATHWAY | ATR signaling pathway |
| 1.0 | 71.3 | PID RAC1 REG PATHWAY | Regulation of RAC1 activity |
| 0.8 | 1.6 | PID S1P S1P2 PATHWAY | S1P2 pathway |
| 0.7 | 42.4 | SIG REGULATION OF THE ACTIN CYTOSKELETON BY RHO GTPASES | Genes related to regulation of the actin cytoskeleton |
| 0.6 | 5.5 | PID ERBB1 RECEPTOR PROXIMAL PATHWAY | EGF receptor (ErbB1) signaling pathway |
| 0.6 | 20.1 | PID NETRIN PATHWAY | Netrin-mediated signaling events |
| 0.6 | 32.5 | PID ALPHA SYNUCLEIN PATHWAY | Alpha-synuclein signaling |
| 0.6 | 31.7 | PID FAS PATHWAY | FAS (CD95) signaling pathway |
| 0.6 | 31.7 | PID INSULIN PATHWAY | Insulin Pathway |
| 0.5 | 11.7 | PID RETINOIC ACID PATHWAY | Retinoic acid receptors-mediated signaling |
| 0.4 | 28.7 | PID FGF PATHWAY | FGF signaling pathway |
| 0.4 | 24.4 | NABA PROTEOGLYCANS | Genes encoding proteoglycans |
| 0.4 | 11.3 | ST ERK1 ERK2 MAPK PATHWAY | ERK1/ERK2 MAPK Pathway |
| 0.4 | 13.2 | PID LIS1 PATHWAY | Lissencephaly gene (LIS1) in neuronal migration and development |
| 0.4 | 26.1 | PID LKB1 PATHWAY | LKB1 signaling events |
| 0.3 | 41.2 | PID MYC REPRESS PATHWAY | Validated targets of C-MYC transcriptional repression |
| 0.3 | 11.7 | PID ECADHERIN NASCENT AJ PATHWAY | E-cadherin signaling in the nascent adherens junction |
| 0.3 | 9.1 | PID FANCONI PATHWAY | Fanconi anemia pathway |
| 0.3 | 25.0 | PID ERA GENOMIC PATHWAY | Validated nuclear estrogen receptor alpha network |
| 0.3 | 62.5 | NABA ECM GLYCOPROTEINS | Genes encoding structural ECM glycoproteins |
| 0.3 | 8.2 | PID INTEGRIN A4B1 PATHWAY | Alpha4 beta1 integrin signaling events |
| 0.3 | 17.9 | PID P75 NTR PATHWAY | p75(NTR)-mediated signaling |
| 0.2 | 3.4 | PID NECTIN PATHWAY | Nectin adhesion pathway |
| 0.2 | 8.8 | PID CDC42 PATHWAY | CDC42 signaling events |
| 0.2 | 10.8 | PID PDGFRB PATHWAY | PDGFR-beta signaling pathway |
| 0.2 | 5.5 | PID HIV NEF PATHWAY | HIV-1 Nef: Negative effector of Fas and TNF-alpha |
| 0.2 | 9.2 | PID VEGFR1 2 PATHWAY | Signaling events mediated by VEGFR1 and VEGFR2 |
| 0.2 | 4.5 | PID ERBB2 ERBB3 PATHWAY | ErbB2/ErbB3 signaling events |
| 0.2 | 6.7 | PID ARF6 TRAFFICKING PATHWAY | Arf6 trafficking events |
| 0.2 | 4.8 | PID ER NONGENOMIC PATHWAY | Plasma membrane estrogen receptor signaling |
| 0.2 | 6.9 | PID KIT PATHWAY | Signaling events mediated by Stem cell factor receptor (c-Kit) |
| 0.1 | 2.7 | PID RAC1 PATHWAY | RAC1 signaling pathway |
| 0.1 | 5.1 | PID TRKR PATHWAY | Neurotrophic factor-mediated Trk receptor signaling |
| 0.1 | 2.5 | PID CDC42 REG PATHWAY | Regulation of CDC42 activity |
| 0.1 | 1.7 | PID ARF 3PATHWAY | Arf1 pathway |
| 0.1 | 3.1 | PID MTOR 4PATHWAY | mTOR signaling pathway |
| 0.1 | 2.8 | PID TCR CALCIUM PATHWAY | Calcium signaling in the CD4+ TCR pathway |
| 0.1 | 2.2 | PID IL23 PATHWAY | IL23-mediated signaling events |
| 0.1 | 0.3 | PID THROMBIN PAR1 PATHWAY | PAR1-mediated thrombin signaling events |
| 0.1 | 3.2 | PID BMP PATHWAY | BMP receptor signaling |
| 0.1 | 2.6 | PID TELOMERASE PATHWAY | Regulation of Telomerase |
| 0.1 | 1.9 | ST INTEGRIN SIGNALING PATHWAY | Integrin Signaling Pathway |
| 0.0 | 0.8 | PID UPA UPAR PATHWAY | Urokinase-type plasminogen activator (uPA) and uPAR-mediated signaling |
| 0.0 | 10.0 | NABA ECM REGULATORS | Genes encoding enzymes and their regulators involved in the remodeling of the extracellular matrix |
| 0.0 | 0.3 | PID SHP2 PATHWAY | SHP2 signaling |
| 0.0 | 0.7 | PID ATM PATHWAY | ATM pathway |
| 0.0 | 0.3 | PID SYNDECAN 4 PATHWAY | Syndecan-4-mediated signaling events |
| 0.0 | 0.4 | PID EPHB FWD PATHWAY | EPHB forward signaling |
| 0.0 | 1.1 | PID TCR PATHWAY | TCR signaling in naïve CD4+ T cells |
| 0.0 | 0.7 | PID CD8 TCR DOWNSTREAM PATHWAY | Downstream signaling in naïve CD8+ T cells |
| 0.0 | 0.3 | PID SYNDECAN 2 PATHWAY | Syndecan-2-mediated signaling events |
| 0.0 | 0.3 | PID AJDISS 2PATHWAY | Posttranslational regulation of adherens junction stability and dissassembly |
| 0.0 | 0.4 | PID RHODOPSIN PATHWAY | Visual signal transduction: Rods |
Gene overrepresentation in C2:CP:REACTOME category:
| Log-likelihood per target | Total log-likelihood | Term | Description |
|---|---|---|---|
| 5.0 | 138.6 | REACTOME CRMPS IN SEMA3A SIGNALING | Genes involved in CRMPs in Sema3A signaling |
| 4.3 | 117.3 | REACTOME POST CHAPERONIN TUBULIN FOLDING PATHWAY | Genes involved in Post-chaperonin tubulin folding pathway |
| 1.8 | 32.8 | REACTOME CLASS C 3 METABOTROPIC GLUTAMATE PHEROMONE RECEPTORS | Genes involved in Class C/3 (Metabotropic glutamate/pheromone receptors) |
| 1.8 | 25.0 | REACTOME PASSIVE TRANSPORT BY AQUAPORINS | Genes involved in Passive Transport by Aquaporins |
| 1.7 | 91.9 | REACTOME ION TRANSPORT BY P TYPE ATPASES | Genes involved in Ion transport by P-type ATPases |
| 1.7 | 25.5 | REACTOME REVERSIBLE HYDRATION OF CARBON DIOXIDE | Genes involved in Reversible Hydration of Carbon Dioxide |
| 1.5 | 93.2 | REACTOME SMOOTH MUSCLE CONTRACTION | Genes involved in Smooth Muscle Contraction |
| 1.3 | 5.1 | REACTOME FGFR2C LIGAND BINDING AND ACTIVATION | Genes involved in FGFR2c ligand binding and activation |
| 1.3 | 41.9 | REACTOME INHIBITION OF INSULIN SECRETION BY ADRENALINE NORADRENALINE | Genes involved in Inhibition of Insulin Secretion by Adrenaline/Noradrenaline |
| 1.2 | 27.2 | REACTOME JNK C JUN KINASES PHOSPHORYLATION AND ACTIVATION MEDIATED BY ACTIVATED HUMAN TAK1 | Genes involved in JNK (c-Jun kinases) phosphorylation and activation mediated by activated human TAK1 |
| 1.2 | 18.3 | REACTOME SIGNALING BY ACTIVATED POINT MUTANTS OF FGFR1 | Genes involved in Signaling by activated point mutants of FGFR1 |
| 1.2 | 13.3 | REACTOME REGULATION OF INSULIN SECRETION BY ACETYLCHOLINE | Genes involved in Regulation of Insulin Secretion by Acetylcholine |
| 1.1 | 8.7 | REACTOME ETHANOL OXIDATION | Genes involved in Ethanol oxidation |
| 1.1 | 36.5 | REACTOME INTERACTION BETWEEN L1 AND ANKYRINS | Genes involved in Interaction between L1 and Ankyrins |
| 1.0 | 28.2 | REACTOME AMINO ACID SYNTHESIS AND INTERCONVERSION TRANSAMINATION | Genes involved in Amino acid synthesis and interconversion (transamination) |
| 1.0 | 23.7 | REACTOME ACYL CHAIN REMODELLING OF PE | Genes involved in Acyl chain remodelling of PE |
| 0.9 | 18.7 | REACTOME IL 7 SIGNALING | Genes involved in Interleukin-7 signaling |
| 0.8 | 43.1 | REACTOME SIGNALING BY ROBO RECEPTOR | Genes involved in Signaling by Robo receptor |
| 0.6 | 11.5 | REACTOME THE NLRP3 INFLAMMASOME | Genes involved in The NLRP3 inflammasome |
| 0.6 | 19.8 | REACTOME CASPASE MEDIATED CLEAVAGE OF CYTOSKELETAL PROTEINS | Genes involved in Caspase-mediated cleavage of cytoskeletal proteins |
| 0.5 | 14.2 | REACTOME P75 NTR RECEPTOR MEDIATED SIGNALLING | Genes involved in p75 NTR receptor-mediated signalling |
| 0.5 | 28.7 | REACTOME NITRIC OXIDE STIMULATES GUANYLATE CYCLASE | Genes involved in Nitric oxide stimulates guanylate cyclase |
| 0.5 | 6.8 | REACTOME G ALPHA1213 SIGNALLING EVENTS | Genes involved in G alpha (12/13) signalling events |
| 0.5 | 3.5 | REACTOME SIGNALING BY FGFR IN DISEASE | Genes involved in Signaling by FGFR in disease |
| 0.5 | 10.9 | REACTOME FANCONI ANEMIA PATHWAY | Genes involved in Fanconi Anemia pathway |
| 0.5 | 34.6 | REACTOME CELL DEATH SIGNALLING VIA NRAGE NRIF AND NADE | Genes involved in Cell death signalling via NRAGE, NRIF and NADE |
| 0.5 | 11.5 | REACTOME HDL MEDIATED LIPID TRANSPORT | Genes involved in HDL-mediated lipid transport |
| 0.5 | 5.1 | REACTOME ROLE OF DCC IN REGULATING APOPTOSIS | Genes involved in Role of DCC in regulating apoptosis |
| 0.5 | 8.2 | REACTOME SYNTHESIS SECRETION AND INACTIVATION OF GIP | Genes involved in Synthesis, Secretion, and Inactivation of Glucose-dependent Insulinotropic Polypeptide (GIP) |
| 0.4 | 4.8 | REACTOME ADENYLATE CYCLASE ACTIVATING PATHWAY | Genes involved in Adenylate cyclase activating pathway |
| 0.4 | 9.7 | REACTOME NUCLEOTIDE LIKE PURINERGIC RECEPTORS | Genes involved in Nucleotide-like (purinergic) receptors |
| 0.4 | 6.7 | REACTOME ACTIVATION OF KAINATE RECEPTORS UPON GLUTAMATE BINDING | Genes involved in Activation of Kainate Receptors upon glutamate binding |
| 0.4 | 7.1 | REACTOME SIGNAL ATTENUATION | Genes involved in Signal attenuation |
| 0.4 | 43.6 | REACTOME SIGNALING BY RHO GTPASES | Genes involved in Signaling by Rho GTPases |
| 0.4 | 6.1 | REACTOME REGULATION OF PYRUVATE DEHYDROGENASE PDH COMPLEX | Genes involved in Regulation of pyruvate dehydrogenase (PDH) complex |
| 0.4 | 1.4 | REACTOME CONVERSION FROM APC C CDC20 TO APC C CDH1 IN LATE ANAPHASE | Genes involved in Conversion from APC/C:Cdc20 to APC/C:Cdh1 in late anaphase |
| 0.3 | 7.5 | REACTOME MITOCHONDRIAL TRNA AMINOACYLATION | Genes involved in Mitochondrial tRNA aminoacylation |
| 0.3 | 10.0 | REACTOME GLUTATHIONE CONJUGATION | Genes involved in Glutathione conjugation |
| 0.3 | 8.0 | REACTOME ACTIVATION OF GENES BY ATF4 | Genes involved in Activation of Genes by ATF4 |
| 0.3 | 5.9 | REACTOME CELL EXTRACELLULAR MATRIX INTERACTIONS | Genes involved in Cell-extracellular matrix interactions |
| 0.3 | 1.4 | REACTOME BINDING AND ENTRY OF HIV VIRION | Genes involved in Binding and entry of HIV virion |
| 0.3 | 3.8 | REACTOME NEF MEDIATED DOWNREGULATION OF MHC CLASS I COMPLEX CELL SURFACE EXPRESSION | Genes involved in Nef mediated downregulation of MHC class I complex cell surface expression |
| 0.3 | 9.7 | REACTOME ERK MAPK TARGETS | Genes involved in ERK/MAPK targets |
| 0.3 | 33.0 | REACTOME RESPONSE TO ELEVATED PLATELET CYTOSOLIC CA2 | Genes involved in Response to elevated platelet cytosolic Ca2+ |
| 0.2 | 1.4 | REACTOME G PROTEIN BETA GAMMA SIGNALLING | Genes involved in G-protein beta:gamma signalling |
| 0.2 | 4.3 | REACTOME GAP JUNCTION ASSEMBLY | Genes involved in Gap junction assembly |
| 0.2 | 4.5 | REACTOME DOWNREGULATION OF ERBB2 ERBB3 SIGNALING | Genes involved in Downregulation of ERBB2:ERBB3 signaling |
| 0.2 | 3.4 | REACTOME EGFR DOWNREGULATION | Genes involved in EGFR downregulation |
| 0.2 | 4.8 | REACTOME DARPP 32 EVENTS | Genes involved in DARPP-32 events |
| 0.2 | 6.6 | REACTOME SULFUR AMINO ACID METABOLISM | Genes involved in Sulfur amino acid metabolism |
| 0.2 | 6.6 | REACTOME REGULATION OF BETA CELL DEVELOPMENT | Genes involved in Regulation of beta-cell development |
| 0.2 | 1.3 | REACTOME INCRETIN SYNTHESIS SECRETION AND INACTIVATION | Genes involved in Incretin Synthesis, Secretion, and Inactivation |
| 0.2 | 1.0 | REACTOME PKA MEDIATED PHOSPHORYLATION OF CREB | Genes involved in PKA-mediated phosphorylation of CREB |
| 0.2 | 10.6 | REACTOME REGULATION OF INSULIN SECRETION | Genes involved in Regulation of Insulin Secretion |
| 0.2 | 7.9 | REACTOME NETRIN1 SIGNALING | Genes involved in Netrin-1 signaling |
| 0.2 | 5.1 | REACTOME GLYCOLYSIS | Genes involved in Glycolysis |
| 0.2 | 3.6 | REACTOME PROLACTIN RECEPTOR SIGNALING | Genes involved in Prolactin receptor signaling |
| 0.2 | 6.2 | REACTOME SIGNALING BY BMP | Genes involved in Signaling by BMP |
| 0.1 | 2.7 | REACTOME SYNTHESIS OF PA | Genes involved in Synthesis of PA |
| 0.1 | 1.0 | REACTOME DESTABILIZATION OF MRNA BY KSRP | Genes involved in Destabilization of mRNA by KSRP |
| 0.1 | 2.8 | REACTOME FACILITATIVE NA INDEPENDENT GLUCOSE TRANSPORTERS | Genes involved in Facilitative Na+-independent glucose transporters |
| 0.1 | 3.4 | REACTOME IL RECEPTOR SHC SIGNALING | Genes involved in Interleukin receptor SHC signaling |
| 0.1 | 2.4 | REACTOME PRESYNAPTIC NICOTINIC ACETYLCHOLINE RECEPTORS | Genes involved in Presynaptic nicotinic acetylcholine receptors |
| 0.1 | 5.9 | REACTOME GLYCOSPHINGOLIPID METABOLISM | Genes involved in Glycosphingolipid metabolism |
| 0.1 | 3.4 | REACTOME INSULIN RECEPTOR RECYCLING | Genes involved in Insulin receptor recycling |
| 0.1 | 0.7 | REACTOME IRAK1 RECRUITS IKK COMPLEX | Genes involved in IRAK1 recruits IKK complex |
| 0.1 | 1.7 | REACTOME REGULATION OF KIT SIGNALING | Genes involved in Regulation of KIT signaling |
| 0.1 | 9.1 | REACTOME LOSS OF NLP FROM MITOTIC CENTROSOMES | Genes involved in Loss of Nlp from mitotic centrosomes |
| 0.1 | 4.2 | REACTOME AMINE LIGAND BINDING RECEPTORS | Genes involved in Amine ligand-binding receptors |
| 0.1 | 7.0 | REACTOME PI3K CASCADE | Genes involved in PI3K Cascade |
| 0.1 | 4.4 | REACTOME OLFACTORY SIGNALING PATHWAY | Genes involved in Olfactory Signaling Pathway |
| 0.1 | 1.5 | REACTOME CD28 CO STIMULATION | Genes involved in CD28 co-stimulation |
| 0.1 | 2.0 | REACTOME PROTEOLYTIC CLEAVAGE OF SNARE COMPLEX PROTEINS | Genes involved in Proteolytic cleavage of SNARE complex proteins |
| 0.1 | 1.6 | REACTOME INHIBITION OF VOLTAGE GATED CA2 CHANNELS VIA GBETA GAMMA SUBUNITS | Genes involved in Inhibition of voltage gated Ca2+ channels via Gbeta/gamma subunits |
| 0.1 | 0.6 | REACTOME MICRORNA MIRNA BIOGENESIS | Genes involved in MicroRNA (miRNA) Biogenesis |
| 0.1 | 0.9 | REACTOME REMOVAL OF THE FLAP INTERMEDIATE FROM THE C STRAND | Genes involved in Removal of the Flap Intermediate from the C-strand |
| 0.1 | 1.6 | REACTOME SYNTHESIS OF VERY LONG CHAIN FATTY ACYL COAS | Genes involved in Synthesis of very long-chain fatty acyl-CoAs |
| 0.1 | 1.0 | REACTOME RECRUITMENT OF MITOTIC CENTROSOME PROTEINS AND COMPLEXES | Genes involved in Recruitment of mitotic centrosome proteins and complexes |
| 0.1 | 3.2 | REACTOME VOLTAGE GATED POTASSIUM CHANNELS | Genes involved in Voltage gated Potassium channels |
| 0.1 | 0.3 | REACTOME SYNTHESIS SECRETION AND DEACYLATION OF GHRELIN | Genes involved in Synthesis, Secretion, and Deacylation of Ghrelin |
| 0.1 | 0.4 | REACTOME PLATELET AGGREGATION PLUG FORMATION | Genes involved in Platelet Aggregation (Plug Formation) |
| 0.1 | 0.7 | REACTOME OPSINS | Genes involved in Opsins |
| 0.1 | 2.2 | REACTOME SPHINGOLIPID DE NOVO BIOSYNTHESIS | Genes involved in Sphingolipid de novo biosynthesis |
| 0.1 | 1.0 | REACTOME SYNTHESIS OF SUBSTRATES IN N GLYCAN BIOSYTHESIS | Genes involved in Synthesis of substrates in N-glycan biosythesis |
| 0.1 | 5.4 | REACTOME NUCLEAR RECEPTOR TRANSCRIPTION PATHWAY | Genes involved in Nuclear Receptor transcription pathway |
| 0.1 | 1.0 | REACTOME OTHER SEMAPHORIN INTERACTIONS | Genes involved in Other semaphorin interactions |
| 0.1 | 1.5 | REACTOME FORMATION OF FIBRIN CLOT CLOTTING CASCADE | Genes involved in Formation of Fibrin Clot (Clotting Cascade) |
| 0.1 | 1.5 | REACTOME REGULATION OF COMPLEMENT CASCADE | Genes involved in Regulation of Complement cascade |
| 0.1 | 1.6 | REACTOME EFFECTS OF PIP2 HYDROLYSIS | Genes involved in Effects of PIP2 hydrolysis |
| 0.0 | 0.5 | REACTOME BETA DEFENSINS | Genes involved in Beta defensins |
| 0.0 | 1.0 | REACTOME ORGANIC CATION ANION ZWITTERION TRANSPORT | Genes involved in Organic cation/anion/zwitterion transport |
| 0.0 | 1.5 | REACTOME ABC FAMILY PROTEINS MEDIATED TRANSPORT | Genes involved in ABC-family proteins mediated transport |
| 0.0 | 0.6 | REACTOME ALPHA LINOLENIC ACID ALA METABOLISM | Genes involved in alpha-linolenic acid (ALA) metabolism |
| 0.0 | 0.7 | REACTOME ANTIGEN ACTIVATES B CELL RECEPTOR LEADING TO GENERATION OF SECOND MESSENGERS | Genes involved in Antigen Activates B Cell Receptor Leading to Generation of Second Messengers |
| 0.0 | 1.1 | REACTOME POST TRANSLATIONAL MODIFICATION SYNTHESIS OF GPI ANCHORED PROTEINS | Genes involved in Post-translational modification: synthesis of GPI-anchored proteins |
| 0.0 | 1.3 | REACTOME STEROID HORMONES | Genes involved in Steroid hormones |
| 0.0 | 0.2 | REACTOME PRE NOTCH EXPRESSION AND PROCESSING | Genes involved in Pre-NOTCH Expression and Processing |
| 0.0 | 2.0 | REACTOME NCAM1 INTERACTIONS | Genes involved in NCAM1 interactions |
| 0.0 | 0.7 | REACTOME VIRAL MESSENGER RNA SYNTHESIS | Genes involved in Viral Messenger RNA Synthesis |
| 0.0 | 0.6 | REACTOME RNA POL III TRANSCRIPTION TERMINATION | Genes involved in RNA Polymerase III Transcription Termination |
| 0.0 | 0.5 | REACTOME PRE NOTCH PROCESSING IN GOLGI | Genes involved in Pre-NOTCH Processing in Golgi |
| 0.0 | 0.9 | REACTOME CYTOSOLIC TRNA AMINOACYLATION | Genes involved in Cytosolic tRNA aminoacylation |
| 0.0 | 0.3 | REACTOME PYRIMIDINE CATABOLISM | Genes involved in Pyrimidine catabolism |
| 0.0 | 0.2 | REACTOME CDC6 ASSOCIATION WITH THE ORC ORIGIN COMPLEX | Genes involved in CDC6 association with the ORC:origin complex |
| 0.0 | 0.2 | REACTOME INTEGRATION OF ENERGY METABOLISM | Genes involved in Integration of energy metabolism |
| 0.0 | 0.1 | REACTOME GASTRIN CREB SIGNALLING PATHWAY VIA PKC AND MAPK | Genes involved in Gastrin-CREB signalling pathway via PKC and MAPK |
| 0.0 | 0.6 | REACTOME TRAFFICKING OF AMPA RECEPTORS | Genes involved in Trafficking of AMPA receptors |
| 0.0 | 4.0 | REACTOME CLASS A1 RHODOPSIN LIKE RECEPTORS | Genes involved in Class A/1 (Rhodopsin-like receptors) |
| 0.0 | 0.2 | REACTOME YAP1 AND WWTR1 TAZ STIMULATED GENE EXPRESSION | Genes involved in YAP1- and WWTR1 (TAZ)-stimulated gene expression |
| 0.0 | 0.6 | REACTOME TRAF6 MEDIATED IRF7 ACTIVATION | Genes involved in TRAF6 mediated IRF7 activation |