Project
GNF SymAtlas + NCI-60 cancer cell lines, comparison of cancers vs non-cancers, human (Su, 2004; Ross, 2000)
Navigation
Downloads
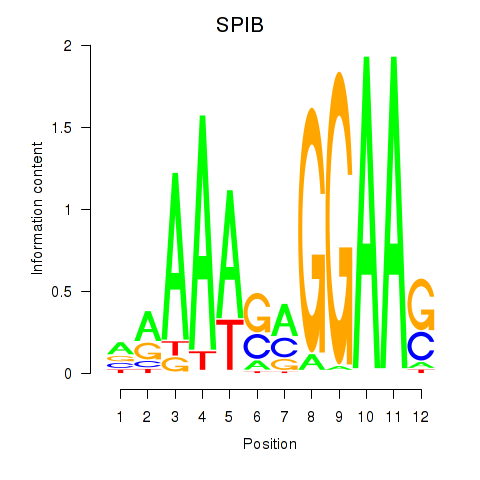
Results for SPIB
Z-value: 0.36
Motif logo
Transcription factors associated with SPIB
| Gene Symbol | Gene ID | Gene Info |
|---|---|---|
|
SPIB
|
ENSG00000269404.2 | Spi-B transcription factor |
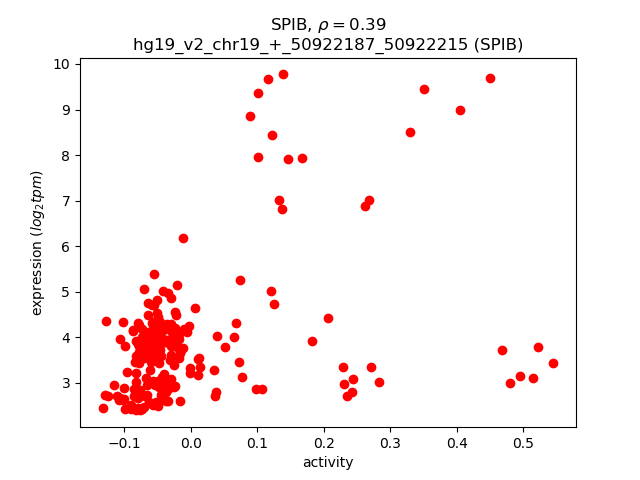
Activity-expression correlation:
| Gene | Promoter | Pearson corr. coef. | P-value | Plot |
|---|---|---|---|---|
| SPIB | hg19_v2_chr19_+_50922187_50922215 | 0.39 | 2.1e-09 | Click! |
Activity profile of SPIB motif
Sorted Z-values of SPIB motif
| Promoter | Log-likelihood | Transcript | Gene | Gene Info |
|---|---|---|---|---|
| chr12_-_15114492 | 143.03 |
ENST00000541546.1
|
ARHGDIB
|
Rho GDP dissociation inhibitor (GDI) beta |
| chr1_-_160681593 | 122.48 |
ENST00000368045.3
ENST00000368046.3 |
CD48
|
CD48 molecule |
| chr12_-_15114603 | 91.99 |
ENST00000228945.4
|
ARHGDIB
|
Rho GDP dissociation inhibitor (GDI) beta |
| chr1_-_31230650 | 90.05 |
ENST00000294507.3
|
LAPTM5
|
lysosomal protein transmembrane 5 |
| chr16_+_30194916 | 88.03 |
ENST00000570045.1
ENST00000565497.1 ENST00000570244.1 |
CORO1A
|
coronin, actin binding protein, 1A |
| chr3_-_121379739 | 82.42 |
ENST00000428394.2
ENST00000314583.3 |
HCLS1
|
hematopoietic cell-specific Lyn substrate 1 |
| chr5_+_169064245 | 75.38 |
ENST00000256935.8
|
DOCK2
|
dedicator of cytokinesis 2 |
| chr13_+_31309645 | 67.19 |
ENST00000380490.3
|
ALOX5AP
|
arachidonate 5-lipoxygenase-activating protein |
| chr7_+_74188309 | 65.58 |
ENST00000289473.4
ENST00000433458.1 |
NCF1
|
neutrophil cytosolic factor 1 |
| chr22_+_37309662 | 60.36 |
ENST00000403662.3
ENST00000262825.5 |
CSF2RB
|
colony stimulating factor 2 receptor, beta, low-affinity (granulocyte-macrophage) |
| chrX_-_47489244 | 56.72 |
ENST00000469388.1
ENST00000396992.3 ENST00000377005.2 |
CFP
|
complement factor properdin |
| chr17_-_29641104 | 54.46 |
ENST00000577894.1
ENST00000330927.4 |
EVI2B
|
ecotropic viral integration site 2B |
| chr1_+_209941827 | 53.50 |
ENST00000367023.1
|
TRAF3IP3
|
TRAF3 interacting protein 3 |
| chr21_-_46340884 | 51.10 |
ENST00000302347.5
ENST00000517819.1 |
ITGB2
|
integrin, beta 2 (complement component 3 receptor 3 and 4 subunit) |
| chr2_+_68592305 | 50.58 |
ENST00000234313.7
|
PLEK
|
pleckstrin |
| chr21_-_46340770 | 49.91 |
ENST00000397854.3
|
ITGB2
|
integrin, beta 2 (complement component 3 receptor 3 and 4 subunit) |
| chr2_+_143886877 | 49.82 |
ENST00000295095.6
|
ARHGAP15
|
Rho GTPase activating protein 15 |
| chr6_+_31582961 | 49.20 |
ENST00000376059.3
ENST00000337917.7 |
AIF1
|
allograft inflammatory factor 1 |
| chr22_-_37640277 | 47.13 |
ENST00000401529.3
ENST00000249071.6 |
RAC2
|
ras-related C3 botulinum toxin substrate 2 (rho family, small GTP binding protein Rac2) |
| chr1_+_26644441 | 46.98 |
ENST00000374213.2
|
CD52
|
CD52 molecule |
| chr11_-_64512803 | 45.05 |
ENST00000377489.1
ENST00000354024.3 |
RASGRP2
|
RAS guanyl releasing protein 2 (calcium and DAG-regulated) |
| chr12_+_54891495 | 43.91 |
ENST00000293373.6
|
NCKAP1L
|
NCK-associated protein 1-like |
| chr19_+_48828788 | 43.84 |
ENST00000594198.1
ENST00000597279.1 ENST00000593437.1 |
EMP3
|
epithelial membrane protein 3 |
| chr20_-_62710832 | 43.76 |
ENST00000395042.1
|
RGS19
|
regulator of G-protein signaling 19 |
| chr19_+_49838653 | 43.25 |
ENST00000598095.1
ENST00000426897.2 ENST00000323906.4 ENST00000535669.2 ENST00000597602.1 ENST00000595660.1 |
CD37
|
CD37 molecule |
| chr6_+_31554779 | 41.35 |
ENST00000376090.2
|
LST1
|
leukocyte specific transcript 1 |
| chr12_+_25205666 | 40.57 |
ENST00000547044.1
|
LRMP
|
lymphoid-restricted membrane protein |
| chr20_-_62711259 | 40.56 |
ENST00000332298.5
|
RGS19
|
regulator of G-protein signaling 19 |
| chr11_-_64512273 | 40.06 |
ENST00000377497.3
ENST00000377487.1 ENST00000430645.1 |
RASGRP2
|
RAS guanyl releasing protein 2 (calcium and DAG-regulated) |
| chr19_+_48828582 | 40.01 |
ENST00000270221.6
ENST00000596315.1 |
EMP3
|
epithelial membrane protein 3 |
| chr10_-_121302195 | 39.68 |
ENST00000369103.2
|
RGS10
|
regulator of G-protein signaling 10 |
| chr19_-_10446449 | 39.56 |
ENST00000592439.1
|
ICAM3
|
intercellular adhesion molecule 3 |
| chr6_-_24936170 | 39.48 |
ENST00000538035.1
|
FAM65B
|
family with sequence similarity 65, member B |
| chr17_-_29641084 | 39.27 |
ENST00000544462.1
|
EVI2B
|
ecotropic viral integration site 2B |
| chr11_-_3859089 | 38.94 |
ENST00000396979.1
|
RHOG
|
ras homolog family member G |
| chr2_-_231084820 | 38.27 |
ENST00000258382.5
ENST00000338556.3 |
SP110
|
SP110 nuclear body protein |
| chr1_-_153919128 | 37.99 |
ENST00000361217.4
|
DENND4B
|
DENN/MADD domain containing 4B |
| chr12_+_7060432 | 36.86 |
ENST00000318974.9
ENST00000456013.1 |
PTPN6
|
protein tyrosine phosphatase, non-receptor type 6 |
| chr12_+_8276433 | 36.39 |
ENST00000345999.3
ENST00000352620.3 ENST00000360500.3 |
CLEC4A
|
C-type lectin domain family 4, member A |
| chr7_-_36764004 | 36.19 |
ENST00000431169.1
|
AOAH
|
acyloxyacyl hydrolase (neutrophil) |
| chr11_+_65408273 | 35.74 |
ENST00000394227.3
|
SIPA1
|
signal-induced proliferation-associated 1 |
| chr22_-_37640456 | 35.56 |
ENST00000405484.1
ENST00000441619.1 ENST00000406508.1 |
RAC2
|
ras-related C3 botulinum toxin substrate 2 (rho family, small GTP binding protein Rac2) |
| chr7_-_36764142 | 34.98 |
ENST00000258749.5
ENST00000535891.1 |
AOAH
|
acyloxyacyl hydrolase (neutrophil) |
| chr10_+_11207438 | 34.27 |
ENST00000609692.1
ENST00000354897.3 |
CELF2
|
CUGBP, Elav-like family member 2 |
| chr4_+_103423055 | 34.01 |
ENST00000505458.1
|
NFKB1
|
nuclear factor of kappa light polypeptide gene enhancer in B-cells 1 |
| chr12_+_25205568 | 33.97 |
ENST00000548766.1
ENST00000556887.1 |
LRMP
|
lymphoid-restricted membrane protein |
| chr6_+_31553901 | 32.32 |
ENST00000418507.2
ENST00000438075.2 ENST00000376100.3 ENST00000376111.4 |
LST1
|
leukocyte specific transcript 1 |
| chr7_+_139528952 | 32.16 |
ENST00000416849.2
ENST00000436047.2 ENST00000414508.2 ENST00000448866.1 |
TBXAS1
|
thromboxane A synthase 1 (platelet) |
| chr20_+_30640004 | 32.12 |
ENST00000520553.1
ENST00000518730.1 ENST00000375852.2 |
HCK
|
hemopoietic cell kinase |
| chr3_-_151047327 | 32.08 |
ENST00000325602.5
|
P2RY13
|
purinergic receptor P2Y, G-protein coupled, 13 |
| chr6_+_31553978 | 30.48 |
ENST00000376096.1
ENST00000376099.1 ENST00000376110.3 |
LST1
|
leukocyte specific transcript 1 |
| chr2_-_231084659 | 30.36 |
ENST00000258381.6
ENST00000358662.4 ENST00000455674.1 ENST00000392048.3 |
SP110
|
SP110 nuclear body protein |
| chr12_+_25205446 | 30.36 |
ENST00000557489.1
ENST00000354454.3 ENST00000536173.1 |
LRMP
|
lymphoid-restricted membrane protein |
| chr12_+_8276224 | 30.21 |
ENST00000229332.5
|
CLEC4A
|
C-type lectin domain family 4, member A |
| chr14_-_23288930 | 30.16 |
ENST00000554517.1
ENST00000285850.7 ENST00000397529.2 ENST00000555702.1 |
SLC7A7
|
solute carrier family 7 (amino acid transporter light chain, y+L system), member 7 |
| chr2_-_231084617 | 29.93 |
ENST00000409815.2
|
SP110
|
SP110 nuclear body protein |
| chr7_+_139529040 | 29.64 |
ENST00000455353.1
ENST00000458722.1 ENST00000411653.1 |
TBXAS1
|
thromboxane A synthase 1 (platelet) |
| chr11_-_64512469 | 29.52 |
ENST00000377485.1
|
RASGRP2
|
RAS guanyl releasing protein 2 (calcium and DAG-regulated) |
| chr1_+_161475208 | 29.39 |
ENST00000367972.4
ENST00000271450.6 |
FCGR2A
|
Fc fragment of IgG, low affinity IIa, receptor (CD32) |
| chr19_+_6772710 | 28.86 |
ENST00000304076.2
ENST00000602142.1 ENST00000596764.1 |
VAV1
|
vav 1 guanine nucleotide exchange factor |
| chr12_+_8276495 | 28.31 |
ENST00000546339.1
|
CLEC4A
|
C-type lectin domain family 4, member A |
| chr17_+_7462103 | 27.74 |
ENST00000396545.4
|
TNFSF13
|
tumor necrosis factor (ligand) superfamily, member 13 |
| chr6_-_133079022 | 27.71 |
ENST00000525289.1
ENST00000326499.6 |
VNN2
|
vanin 2 |
| chr17_-_73389854 | 26.85 |
ENST00000578961.1
ENST00000392564.1 ENST00000582582.1 |
GRB2
|
growth factor receptor-bound protein 2 |
| chr11_-_33891362 | 26.30 |
ENST00000395833.3
|
LMO2
|
LIM domain only 2 (rhombotin-like 1) |
| chr6_+_31554826 | 26.27 |
ENST00000376089.2
ENST00000396112.2 |
LST1
|
leukocyte specific transcript 1 |
| chr8_-_101734308 | 25.85 |
ENST00000519004.1
ENST00000519363.1 ENST00000520142.1 |
PABPC1
|
poly(A) binding protein, cytoplasmic 1 |
| chr7_+_50344289 | 25.45 |
ENST00000413698.1
ENST00000359197.5 ENST00000331340.3 ENST00000357364.4 ENST00000343574.5 ENST00000349824.4 ENST00000346667.4 ENST00000440768.2 |
IKZF1
|
IKAROS family zinc finger 1 (Ikaros) |
| chr19_+_42381337 | 25.42 |
ENST00000597454.1
ENST00000444740.2 |
CD79A
|
CD79a molecule, immunoglobulin-associated alpha |
| chr8_-_101734170 | 25.35 |
ENST00000522387.1
ENST00000518196.1 |
PABPC1
|
poly(A) binding protein, cytoplasmic 1 |
| chr2_+_233925064 | 25.28 |
ENST00000359570.5
ENST00000538935.1 |
INPP5D
|
inositol polyphosphate-5-phosphatase, 145kDa |
| chr1_+_161632937 | 24.85 |
ENST00000236937.9
ENST00000367961.4 ENST00000358671.5 |
FCGR2B
|
Fc fragment of IgG, low affinity IIb, receptor (CD32) |
| chr9_+_93564191 | 24.73 |
ENST00000375747.1
|
SYK
|
spleen tyrosine kinase |
| chr19_-_13213662 | 24.72 |
ENST00000264824.4
|
LYL1
|
lymphoblastic leukemia derived sequence 1 |
| chr17_-_73389737 | 24.62 |
ENST00000392563.1
|
GRB2
|
growth factor receptor-bound protein 2 |
| chr9_+_93564039 | 24.42 |
ENST00000375754.4
ENST00000375751.4 |
SYK
|
spleen tyrosine kinase |
| chrX_+_11777671 | 24.40 |
ENST00000380693.3
ENST00000380692.2 |
MSL3
|
male-specific lethal 3 homolog (Drosophila) |
| chr8_+_74903580 | 24.03 |
ENST00000284818.2
ENST00000518893.1 |
LY96
|
lymphocyte antigen 96 |
| chr14_+_88471468 | 23.91 |
ENST00000267549.3
|
GPR65
|
G protein-coupled receptor 65 |
| chr10_+_11206925 | 23.83 |
ENST00000354440.2
ENST00000315874.4 ENST00000427450.1 |
CELF2
|
CUGBP, Elav-like family member 2 |
| chr5_-_140013275 | 23.72 |
ENST00000512545.1
ENST00000302014.6 ENST00000401743.2 |
CD14
|
CD14 molecule |
| chr11_-_47399942 | 23.35 |
ENST00000227163.4
|
SPI1
|
spleen focus forming virus (SFFV) proviral integration oncogene |
| chr12_-_7656357 | 22.76 |
ENST00000396620.3
ENST00000432237.2 ENST00000359156.4 |
CD163
|
CD163 molecule |
| chr17_+_7461781 | 22.36 |
ENST00000349228.4
|
TNFSF13
|
tumor necrosis factor (ligand) superfamily, member 13 |
| chr3_+_16926441 | 22.34 |
ENST00000418129.2
ENST00000396755.2 |
PLCL2
|
phospholipase C-like 2 |
| chr3_+_121774202 | 22.07 |
ENST00000469710.1
ENST00000493101.1 ENST00000330540.2 ENST00000264468.5 |
CD86
|
CD86 molecule |
| chr15_+_77287426 | 21.77 |
ENST00000558012.1
ENST00000267939.5 ENST00000379595.3 |
PSTPIP1
|
proline-serine-threonine phosphatase interacting protein 1 |
| chr17_+_7461849 | 21.43 |
ENST00000338784.4
|
TNFSF13
|
tumor necrosis factor (ligand) superfamily, member 13 |
| chr3_-_16555150 | 21.13 |
ENST00000334133.4
|
RFTN1
|
raftlin, lipid raft linker 1 |
| chr11_-_47400078 | 20.96 |
ENST00000378538.3
|
SPI1
|
spleen focus forming virus (SFFV) proviral integration oncogene |
| chr5_+_54398463 | 20.88 |
ENST00000274306.6
|
GZMA
|
granzyme A (granzyme 1, cytotoxic T-lymphocyte-associated serine esterase 3) |
| chr15_+_91427642 | 20.64 |
ENST00000328850.3
ENST00000414248.2 |
FES
|
feline sarcoma oncogene |
| chr19_-_10230562 | 20.39 |
ENST00000587146.1
ENST00000588709.1 ENST00000253108.4 |
EIF3G
|
eukaryotic translation initiation factor 3, subunit G |
| chr14_+_102228123 | 20.37 |
ENST00000422945.2
ENST00000554442.1 ENST00000556260.2 ENST00000328724.5 ENST00000557268.1 |
PPP2R5C
|
protein phosphatase 2, regulatory subunit B', gamma |
| chrX_+_24072833 | 20.07 |
ENST00000253039.4
|
EIF2S3
|
eukaryotic translation initiation factor 2, subunit 3 gamma, 52kDa |
| chr1_+_15736359 | 20.05 |
ENST00000375980.4
|
EFHD2
|
EF-hand domain family, member D2 |
| chr9_+_93589734 | 19.49 |
ENST00000375746.1
|
SYK
|
spleen tyrosine kinase |
| chr3_+_46395219 | 19.23 |
ENST00000445132.2
ENST00000292301.4 |
CCR2
|
chemokine (C-C motif) receptor 2 |
| chr1_+_149754227 | 19.12 |
ENST00000444948.1
ENST00000369168.4 |
FCGR1A
|
Fc fragment of IgG, high affinity Ia, receptor (CD64) |
| chr15_-_65809991 | 18.99 |
ENST00000559526.1
ENST00000358939.4 ENST00000560665.1 ENST00000321118.7 ENST00000339244.5 ENST00000300141.6 |
DPP8
|
dipeptidyl-peptidase 8 |
| chr15_-_65810042 | 18.70 |
ENST00000321147.6
|
DPP8
|
dipeptidyl-peptidase 8 |
| chr1_+_90287480 | 18.47 |
ENST00000394593.3
|
LRRC8D
|
leucine rich repeat containing 8 family, member D |
| chr2_+_162087577 | 18.42 |
ENST00000439442.1
|
TANK
|
TRAF family member-associated NFKB activator |
| chr22_-_37880543 | 18.40 |
ENST00000442496.1
|
MFNG
|
MFNG O-fucosylpeptide 3-beta-N-acetylglucosaminyltransferase |
| chr8_+_98656693 | 18.08 |
ENST00000519934.1
|
MTDH
|
metadherin |
| chr1_-_159893507 | 17.88 |
ENST00000368096.1
|
TAGLN2
|
transgelin 2 |
| chr2_-_74405929 | 17.82 |
ENST00000396049.4
|
MOB1A
|
MOB kinase activator 1A |
| chr3_-_52273098 | 17.72 |
ENST00000499914.2
ENST00000305533.5 ENST00000597542.1 |
TWF2
TLR9
|
twinfilin actin-binding protein 2 toll-like receptor 9 |
| chr15_-_65809581 | 17.39 |
ENST00000341861.5
|
DPP8
|
dipeptidyl-peptidase 8 |
| chrX_+_11776701 | 17.34 |
ENST00000476743.1
ENST00000421368.2 ENST00000398527.2 |
MSL3
|
male-specific lethal 3 homolog (Drosophila) |
| chr17_+_7462031 | 17.15 |
ENST00000380535.4
|
TNFSF13
|
tumor necrosis factor (ligand) superfamily, member 13 |
| chr19_-_18391708 | 17.14 |
ENST00000600972.1
|
JUND
|
jun D proto-oncogene |
| chr20_+_2821340 | 17.06 |
ENST00000380445.3
ENST00000380469.3 |
VPS16
|
vacuolar protein sorting 16 homolog (S. cerevisiae) |
| chr10_-_98031310 | 16.85 |
ENST00000427367.2
ENST00000413476.2 |
BLNK
|
B-cell linker |
| chr1_-_120935894 | 16.69 |
ENST00000369383.4
ENST00000369384.4 |
FCGR1B
|
Fc fragment of IgG, high affinity Ib, receptor (CD64) |
| chr19_-_10230540 | 16.48 |
ENST00000589454.1
|
EIF3G
|
eukaryotic translation initiation factor 3, subunit G |
| chrX_+_109246285 | 16.25 |
ENST00000372073.1
ENST00000372068.2 ENST00000288381.4 |
TMEM164
|
transmembrane protein 164 |
| chr6_+_15246501 | 16.05 |
ENST00000341776.2
|
JARID2
|
jumonji, AT rich interactive domain 2 |
| chr6_+_31554456 | 15.97 |
ENST00000339530.4
|
LST1
|
leukocyte specific transcript 1 |
| chr11_-_47400062 | 15.79 |
ENST00000533030.1
|
SPI1
|
spleen focus forming virus (SFFV) proviral integration oncogene |
| chr6_+_31554612 | 15.74 |
ENST00000211921.7
|
LST1
|
leukocyte specific transcript 1 |
| chr17_+_7461580 | 15.70 |
ENST00000483039.1
ENST00000396542.1 |
TNFSF13
|
tumor necrosis factor (ligand) superfamily, member 13 |
| chrX_+_123094672 | 15.47 |
ENST00000354548.5
ENST00000458700.1 |
STAG2
|
stromal antigen 2 |
| chr11_+_46366918 | 15.28 |
ENST00000528615.1
ENST00000395574.3 |
DGKZ
|
diacylglycerol kinase, zeta |
| chr3_+_121796697 | 15.24 |
ENST00000482356.1
ENST00000393627.2 |
CD86
|
CD86 molecule |
| chr1_+_44440575 | 15.24 |
ENST00000532642.1
ENST00000236067.4 ENST00000471859.2 |
ATP6V0B
|
ATPase, H+ transporting, lysosomal 21kDa, V0 subunit b |
| chr18_-_47813940 | 15.20 |
ENST00000586837.1
ENST00000412036.2 ENST00000589940.1 |
CXXC1
|
CXXC finger protein 1 |
| chr6_-_132834184 | 15.02 |
ENST00000367941.2
ENST00000367937.4 |
STX7
|
syntaxin 7 |
| chr17_+_65373531 | 14.86 |
ENST00000580974.1
|
PITPNC1
|
phosphatidylinositol transfer protein, cytoplasmic 1 |
| chr11_-_64889529 | 14.85 |
ENST00000531743.1
ENST00000527548.1 ENST00000526555.1 ENST00000279259.3 |
FAU
|
Finkel-Biskis-Reilly murine sarcoma virus (FBR-MuSV) ubiquitously expressed |
| chr11_-_60719213 | 14.16 |
ENST00000227880.3
|
SLC15A3
|
solute carrier family 15 (oligopeptide transporter), member 3 |
| chr15_+_91427691 | 14.01 |
ENST00000559355.1
ENST00000394302.1 |
FES
|
feline sarcoma oncogene |
| chr19_+_3136115 | 13.98 |
ENST00000262958.3
|
GNA15
|
guanine nucleotide binding protein (G protein), alpha 15 (Gq class) |
| chr19_-_54746600 | 13.93 |
ENST00000245621.5
ENST00000270464.5 ENST00000419410.2 ENST00000391735.3 ENST00000396365.2 ENST00000440558.2 ENST00000407860.2 |
LILRA6
LILRB3
|
leukocyte immunoglobulin-like receptor, subfamily A (with TM domain), member 6 leukocyte immunoglobulin-like receptor, subfamily B (with TM and ITIM domains), member 3 |
| chr10_-_98031265 | 13.88 |
ENST00000224337.5
ENST00000371176.2 |
BLNK
|
B-cell linker |
| chr11_-_64889252 | 13.77 |
ENST00000525297.1
ENST00000529259.1 |
FAU
|
Finkel-Biskis-Reilly murine sarcoma virus (FBR-MuSV) ubiquitously expressed |
| chrX_-_74376108 | 13.74 |
ENST00000339447.4
ENST00000373394.3 ENST00000529949.1 ENST00000534524.1 ENST00000253577.3 |
ABCB7
|
ATP-binding cassette, sub-family B (MDR/TAP), member 7 |
| chr17_+_7461613 | 13.69 |
ENST00000438470.1
ENST00000436057.1 |
TNFSF13
|
tumor necrosis factor (ligand) superfamily, member 13 |
| chr18_-_47018769 | 13.40 |
ENST00000583637.1
ENST00000578528.1 ENST00000578532.1 ENST00000580387.1 ENST00000579248.1 ENST00000581373.1 |
RPL17
|
ribosomal protein L17 |
| chr5_+_112312416 | 13.38 |
ENST00000389063.2
|
DCP2
|
decapping mRNA 2 |
| chr5_+_35856951 | 13.36 |
ENST00000303115.3
ENST00000343305.4 ENST00000506850.1 ENST00000511982.1 |
IL7R
|
interleukin 7 receptor |
| chr19_+_2476116 | 13.12 |
ENST00000215631.4
ENST00000587345.1 |
GADD45B
|
growth arrest and DNA-damage-inducible, beta |
| chr1_+_39456895 | 13.12 |
ENST00000432648.3
ENST00000446189.2 ENST00000372984.4 |
AKIRIN1
|
akirin 1 |
| chr17_+_65374075 | 12.81 |
ENST00000581322.1
|
PITPNC1
|
phosphatidylinositol transfer protein, cytoplasmic 1 |
| chr11_-_64546202 | 12.58 |
ENST00000377390.3
ENST00000227503.9 ENST00000377394.3 ENST00000422298.2 ENST00000334944.5 |
SF1
|
splicing factor 1 |
| chr6_-_41254403 | 12.49 |
ENST00000589614.1
ENST00000334475.6 ENST00000591620.1 ENST00000244709.4 |
TREM1
|
triggering receptor expressed on myeloid cells 1 |
| chr2_+_113931513 | 12.48 |
ENST00000245796.6
ENST00000441564.3 |
PSD4
|
pleckstrin and Sec7 domain containing 4 |
| chr12_-_9102549 | 12.46 |
ENST00000000412.3
|
M6PR
|
mannose-6-phosphate receptor (cation dependent) |
| chr2_+_202125219 | 12.28 |
ENST00000323492.7
|
CASP8
|
caspase 8, apoptosis-related cysteine peptidase |
| chr11_-_64889649 | 12.10 |
ENST00000434372.2
|
FAU
|
Finkel-Biskis-Reilly murine sarcoma virus (FBR-MuSV) ubiquitously expressed |
| chr1_+_159272111 | 12.01 |
ENST00000368114.1
|
FCER1A
|
Fc fragment of IgE, high affinity I, receptor for; alpha polypeptide |
| chr2_+_127413677 | 11.99 |
ENST00000356887.7
|
GYPC
|
glycophorin C (Gerbich blood group) |
| chr9_+_82186872 | 11.89 |
ENST00000376544.3
ENST00000376520.4 |
TLE4
|
transducin-like enhancer of split 4 (E(sp1) homolog, Drosophila) |
| chr10_+_114133773 | 11.80 |
ENST00000354655.4
|
ACSL5
|
acyl-CoA synthetase long-chain family member 5 |
| chr10_-_65028817 | 11.70 |
ENST00000542921.1
|
JMJD1C
|
jumonji domain containing 1C |
| chr1_+_32757668 | 11.35 |
ENST00000373548.3
|
HDAC1
|
histone deacetylase 1 |
| chr7_-_37488834 | 11.26 |
ENST00000310758.4
|
ELMO1
|
engulfment and cell motility 1 |
| chr11_-_67120974 | 11.13 |
ENST00000539074.1
ENST00000312419.3 |
POLD4
|
polymerase (DNA-directed), delta 4, accessory subunit |
| chr2_+_127413704 | 10.95 |
ENST00000409836.3
|
GYPC
|
glycophorin C (Gerbich blood group) |
| chr15_+_59279851 | 10.93 |
ENST00000348370.4
ENST00000434298.1 ENST00000559160.1 |
RNF111
|
ring finger protein 111 |
| chr9_-_35618364 | 10.84 |
ENST00000378431.1
ENST00000378430.3 ENST00000259633.4 |
CD72
|
CD72 molecule |
| chr9_+_127624387 | 10.79 |
ENST00000353214.2
|
ARPC5L
|
actin related protein 2/3 complex, subunit 5-like |
| chr1_+_40505891 | 10.65 |
ENST00000372797.3
ENST00000372802.1 ENST00000449311.1 |
CAP1
|
CAP, adenylate cyclase-associated protein 1 (yeast) |
| chr16_+_30960375 | 10.59 |
ENST00000318663.4
ENST00000566237.1 ENST00000562699.1 |
ORAI3
|
ORAI calcium release-activated calcium modulator 3 |
| chrX_+_11776410 | 10.52 |
ENST00000361672.2
|
MSL3
|
male-specific lethal 3 homolog (Drosophila) |
| chr19_+_51728316 | 10.41 |
ENST00000436584.2
ENST00000421133.2 ENST00000391796.3 ENST00000262262.4 |
CD33
|
CD33 molecule |
| chr20_-_33732952 | 10.24 |
ENST00000541621.1
|
EDEM2
|
ER degradation enhancer, mannosidase alpha-like 2 |
| chr19_-_54726850 | 10.18 |
ENST00000245620.9
ENST00000346401.6 ENST00000424807.1 ENST00000445347.1 |
LILRB3
|
leukocyte immunoglobulin-like receptor, subfamily B (with TM and ITIM domains), member 3 |
| chr2_+_3622795 | 10.18 |
ENST00000304921.5
|
RPS7
|
ribosomal protein S7 |
| chr14_+_102276132 | 10.14 |
ENST00000350249.3
ENST00000557621.1 ENST00000556946.1 |
PPP2R5C
|
protein phosphatase 2, regulatory subunit B', gamma |
| chr14_+_102276209 | 10.05 |
ENST00000445439.3
ENST00000334743.5 ENST00000557095.1 |
PPP2R5C
|
protein phosphatase 2, regulatory subunit B', gamma |
| chr22_-_32026810 | 9.86 |
ENST00000266095.5
ENST00000397500.1 |
PISD
|
phosphatidylserine decarboxylase |
| chr1_-_47069955 | 9.74 |
ENST00000341183.5
ENST00000496619.1 |
MKNK1
|
MAP kinase interacting serine/threonine kinase 1 |
| chr14_+_102276192 | 9.64 |
ENST00000557714.1
|
PPP2R5C
|
protein phosphatase 2, regulatory subunit B', gamma |
| chr4_+_68424434 | 9.60 |
ENST00000265404.2
ENST00000396225.1 |
STAP1
|
signal transducing adaptor family member 1 |
| chr2_-_161350305 | 9.59 |
ENST00000348849.3
|
RBMS1
|
RNA binding motif, single stranded interacting protein 1 |
| chr2_-_208031943 | 9.46 |
ENST00000421199.1
ENST00000457962.1 |
KLF7
|
Kruppel-like factor 7 (ubiquitous) |
| chr19_-_3786253 | 9.44 |
ENST00000585778.1
|
MATK
|
megakaryocyte-associated tyrosine kinase |
| chrX_+_123094369 | 9.40 |
ENST00000455404.1
ENST00000218089.9 |
STAG2
|
stromal antigen 2 |
| chr5_-_39270725 | 9.34 |
ENST00000512138.1
ENST00000512982.1 ENST00000540520.1 |
FYB
|
FYN binding protein |
| chr4_+_113568207 | 9.25 |
ENST00000511529.1
|
LARP7
|
La ribonucleoprotein domain family, member 7 |
| chr17_-_8868991 | 9.22 |
ENST00000447110.1
|
PIK3R5
|
phosphoinositide-3-kinase, regulatory subunit 5 |
| chr21_+_34638656 | 9.05 |
ENST00000290200.2
|
IL10RB
|
interleukin 10 receptor, beta |
| chr12_-_8218997 | 9.05 |
ENST00000307637.4
|
C3AR1
|
complement component 3a receptor 1 |
| chr17_-_61819229 | 9.00 |
ENST00000447001.3
ENST00000392950.4 |
STRADA
|
STE20-related kinase adaptor alpha |
| chr12_-_51785182 | 8.96 |
ENST00000356317.3
ENST00000603188.1 ENST00000604847.1 ENST00000604506.1 |
GALNT6
|
UDP-N-acetyl-alpha-D-galactosamine:polypeptide N-acetylgalactosaminyltransferase 6 (GalNAc-T6) |
| chr14_-_74417096 | 8.95 |
ENST00000286544.3
|
FAM161B
|
family with sequence similarity 161, member B |
| chr7_-_102213030 | 8.95 |
ENST00000511313.1
ENST00000513438.1 ENST00000513506.1 |
POLR2J3
|
polymerase (RNA) II (DNA directed) polypeptide J3 |
| chr5_-_66492562 | 8.84 |
ENST00000256447.4
|
CD180
|
CD180 molecule |
| chr1_+_41174988 | 8.80 |
ENST00000372652.1
|
NFYC
|
nuclear transcription factor Y, gamma |
| chr1_+_14075865 | 8.75 |
ENST00000413440.1
|
PRDM2
|
PR domain containing 2, with ZNF domain |
| chr1_+_161551101 | 8.75 |
ENST00000367962.4
ENST00000367960.5 ENST00000403078.3 ENST00000428605.2 |
FCGR2B
|
Fc fragment of IgG, low affinity IIb, receptor (CD32) |
| chr18_-_32924372 | 8.40 |
ENST00000261332.6
ENST00000399061.3 |
ZNF24
|
zinc finger protein 24 |
| chr19_+_14551066 | 8.31 |
ENST00000342216.4
|
PKN1
|
protein kinase N1 |
| chr2_+_3622932 | 8.14 |
ENST00000406376.1
|
RPS7
|
ribosomal protein S7 |
| chr2_-_242089677 | 8.10 |
ENST00000405260.1
|
PASK
|
PAS domain containing serine/threonine kinase |
| chr1_-_47069886 | 7.98 |
ENST00000371946.4
ENST00000371945.4 ENST00000428112.2 ENST00000529170.1 |
MKNK1
|
MAP kinase interacting serine/threonine kinase 1 |
| chr17_+_75137034 | 7.80 |
ENST00000436233.4
ENST00000443798.4 |
SEC14L1
|
SEC14-like 1 (S. cerevisiae) |
| chr11_+_75110530 | 7.78 |
ENST00000531188.1
ENST00000530164.1 ENST00000422465.2 ENST00000278572.6 ENST00000534440.1 ENST00000527446.1 ENST00000526608.1 ENST00000527273.1 ENST00000524851.1 |
RPS3
|
ribosomal protein S3 |
| chr10_+_104503727 | 7.68 |
ENST00000448841.1
|
WBP1L
|
WW domain binding protein 1-like |
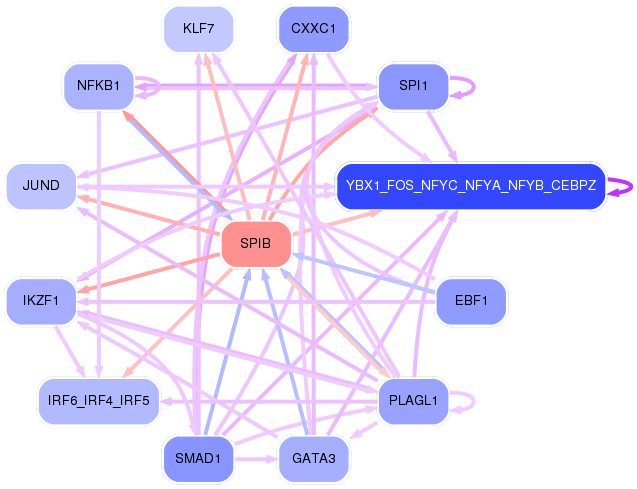
Network of associatons between targets according to the STRING database.

First level regulatory network of SPIB
Gene Ontology Analysis
Gene overrepresentation in biological_process category:
| Log-likelihood per target | Total log-likelihood | Term | Description |
|---|---|---|---|
| 58.8 | 235.0 | GO:0071461 | cellular response to redox state(GO:0071461) |
| 22.0 | 88.0 | GO:0031339 | negative regulation of vesicle fusion(GO:0031339) |
| 20.2 | 60.7 | GO:0038043 | interleukin-5-mediated signaling pathway(GO:0038043) |
| 20.2 | 80.6 | GO:0032672 | regulation of interleukin-3 production(GO:0032672) positive regulation of interleukin-3 production(GO:0032752) interleukin-3 biosynthetic process(GO:0042223) regulation of interleukin-3 biosynthetic process(GO:0045399) positive regulation of interleukin-3 biosynthetic process(GO:0045401) |
| 15.0 | 60.1 | GO:0044027 | hypermethylation of CpG island(GO:0044027) |
| 15.0 | 45.0 | GO:0042097 | interleukin-4 biosynthetic process(GO:0042097) regulation of interleukin-4 biosynthetic process(GO:0045402) positive regulation of interleukin-4 biosynthetic process(GO:0045404) |
| 14.6 | 43.9 | GO:0045588 | positive regulation of gamma-delta T cell differentiation(GO:0045588) |
| 13.2 | 52.8 | GO:0002434 | immune complex clearance(GO:0002434) immune complex clearance by monocytes and macrophages(GO:0002436) regulation of immune complex clearance by monocytes and macrophages(GO:0090264) |
| 10.7 | 32.1 | GO:0002522 | leukocyte migration involved in immune response(GO:0002522) |
| 9.8 | 49.2 | GO:0014738 | regulation of muscle hyperplasia(GO:0014738) |
| 9.8 | 118.1 | GO:0048298 | positive regulation of isotype switching to IgA isotypes(GO:0048298) |
| 9.4 | 75.4 | GO:0044351 | macropinocytosis(GO:0044351) |
| 9.2 | 36.9 | GO:0033277 | abortive mitotic cell cycle(GO:0033277) |
| 8.4 | 50.6 | GO:0070560 | protein secretion by platelet(GO:0070560) |
| 8.4 | 25.3 | GO:0045658 | regulation of neutrophil differentiation(GO:0045658) negative regulation of neutrophil differentiation(GO:0045659) |
| 7.6 | 128.6 | GO:2000251 | positive regulation of actin cytoskeleton reorganization(GO:2000251) |
| 7.5 | 82.7 | GO:0060753 | regulation of mast cell chemotaxis(GO:0060753) |
| 7.5 | 67.2 | GO:2001300 | lipoxin metabolic process(GO:2001300) |
| 7.4 | 22.3 | GO:0001923 | B-1 B cell differentiation(GO:0001923) |
| 7.1 | 35.7 | GO:0042631 | cellular response to water deprivation(GO:0042631) |
| 6.8 | 34.0 | GO:0010956 | negative regulation of calcidiol 1-monooxygenase activity(GO:0010956) |
| 6.2 | 36.9 | GO:0032483 | regulation of Rab protein signal transduction(GO:0032483) |
| 5.9 | 23.7 | GO:0071725 | toll-like receptor TLR1:TLR2 signaling pathway(GO:0038123) response to triacyl bacterial lipopeptide(GO:0071725) cellular response to triacyl bacterial lipopeptide(GO:0071727) |
| 5.7 | 51.2 | GO:2000623 | regulation of nuclear-transcribed mRNA catabolic process, nonsense-mediated decay(GO:2000622) negative regulation of nuclear-transcribed mRNA catabolic process, nonsense-mediated decay(GO:2000623) |
| 5.7 | 56.7 | GO:0036066 | protein O-linked fucosylation(GO:0036066) |
| 5.0 | 30.2 | GO:0000821 | regulation of arginine metabolic process(GO:0000821) basic amino acid transmembrane transport(GO:1990822) |
| 4.9 | 98.6 | GO:0002523 | leukocyte migration involved in inflammatory response(GO:0002523) |
| 4.6 | 36.9 | GO:0075525 | viral translational termination-reinitiation(GO:0075525) |
| 4.4 | 17.7 | GO:0032661 | regulation of interleukin-18 production(GO:0032661) positive regulation of interferon-alpha biosynthetic process(GO:0045356) negative regulation of calcium-transporting ATPase activity(GO:1901895) |
| 4.2 | 20.8 | GO:1904154 | positive regulation of retrograde protein transport, ER to cytosol(GO:1904154) |
| 4.1 | 24.9 | GO:0032876 | negative regulation of DNA endoreduplication(GO:0032876) |
| 4.1 | 12.3 | GO:0052056 | modulation by virus of host molecular function(GO:0039506) suppression by virus of host molecular function(GO:0039507) suppression by virus of host catalytic activity(GO:0039513) modulation by virus of host catalytic activity(GO:0039516) suppression by virus of host cysteine-type endopeptidase activity involved in apoptotic process(GO:0039650) negative regulation by symbiont of host catalytic activity(GO:0052053) negative regulation by symbiont of host molecular function(GO:0052056) modulation by symbiont of host catalytic activity(GO:0052148) |
| 3.9 | 66.6 | GO:0045741 | positive regulation of epidermal growth factor-activated receptor activity(GO:0045741) |
| 3.8 | 76.3 | GO:0032060 | bleb assembly(GO:0032060) |
| 3.7 | 32.9 | GO:0031666 | positive regulation of lipopolysaccharide-mediated signaling pathway(GO:0031666) |
| 3.4 | 61.8 | GO:0019371 | cyclooxygenase pathway(GO:0019371) |
| 3.2 | 25.8 | GO:1902255 | positive regulation of intrinsic apoptotic signaling pathway by p53 class mediator(GO:1902255) |
| 3.2 | 54.1 | GO:0060670 | branching involved in labyrinthine layer morphogenesis(GO:0060670) |
| 3.1 | 12.5 | GO:0070945 | neutrophil mediated killing of gram-negative bacterium(GO:0070945) |
| 3.1 | 18.4 | GO:2000158 | positive regulation of ubiquitin-specific protease activity(GO:2000158) |
| 3.0 | 21.1 | GO:0032594 | protein transport within lipid bilayer(GO:0032594) protein transport into membrane raft(GO:0032596) |
| 3.0 | 12.0 | GO:0071894 | histone H2B conserved C-terminal lysine ubiquitination(GO:0071894) |
| 3.0 | 53.7 | GO:0007213 | G-protein coupled acetylcholine receptor signaling pathway(GO:0007213) |
| 2.8 | 27.7 | GO:0015939 | pantothenate metabolic process(GO:0015939) |
| 2.5 | 12.6 | GO:0000389 | mRNA 3'-splice site recognition(GO:0000389) |
| 2.5 | 24.7 | GO:0001955 | blood vessel maturation(GO:0001955) |
| 2.4 | 17.1 | GO:0035542 | regulation of SNARE complex assembly(GO:0035542) |
| 2.4 | 28.7 | GO:0032071 | regulation of endodeoxyribonuclease activity(GO:0032071) |
| 2.3 | 11.4 | GO:0061198 | fungiform papilla formation(GO:0061198) |
| 2.2 | 43.4 | GO:0035589 | G-protein coupled purinergic nucleotide receptor signaling pathway(GO:0035589) |
| 1.9 | 13.4 | GO:0000290 | deadenylation-dependent decapping of nuclear-transcribed mRNA(GO:0000290) |
| 1.8 | 59.0 | GO:0043984 | histone H4-K16 acetylation(GO:0043984) |
| 1.8 | 58.1 | GO:0006376 | mRNA splice site selection(GO:0006376) |
| 1.7 | 5.2 | GO:1905205 | positive regulation of connective tissue replacement(GO:1905205) |
| 1.7 | 13.4 | GO:2000400 | positive regulation of T cell differentiation in thymus(GO:0033089) positive regulation of thymocyte aggregation(GO:2000400) |
| 1.7 | 15.0 | GO:1902474 | positive regulation of protein localization to synapse(GO:1902474) |
| 1.6 | 164.2 | GO:0032945 | negative regulation of mononuclear cell proliferation(GO:0032945) negative regulation of lymphocyte proliferation(GO:0050672) |
| 1.6 | 1.6 | GO:1901668 | regulation of superoxide dismutase activity(GO:1901668) |
| 1.6 | 16.0 | GO:0051574 | positive regulation of histone H3-K9 methylation(GO:0051574) |
| 1.5 | 18.4 | GO:0002315 | marginal zone B cell differentiation(GO:0002315) |
| 1.5 | 124.8 | GO:0071277 | cellular response to calcium ion(GO:0071277) |
| 1.4 | 50.2 | GO:0016601 | Rac protein signal transduction(GO:0016601) |
| 1.4 | 5.7 | GO:0018094 | protein polyglycylation(GO:0018094) |
| 1.4 | 7.1 | GO:0010637 | negative regulation of mitochondrial fusion(GO:0010637) |
| 1.4 | 10.9 | GO:0030579 | ubiquitin-dependent SMAD protein catabolic process(GO:0030579) |
| 1.3 | 8.1 | GO:0070092 | regulation of glucagon secretion(GO:0070092) |
| 1.3 | 14.6 | GO:0039536 | negative regulation of RIG-I signaling pathway(GO:0039536) |
| 1.3 | 5.2 | GO:0045591 | positive regulation of regulatory T cell differentiation(GO:0045591) |
| 1.3 | 3.9 | GO:0000354 | cis assembly of pre-catalytic spliceosome(GO:0000354) |
| 1.2 | 13.7 | GO:0015886 | heme transport(GO:0015886) |
| 1.2 | 5.0 | GO:0050928 | negative regulation of positive chemotaxis(GO:0050928) |
| 1.2 | 12.5 | GO:0033299 | secretion of lysosomal enzymes(GO:0033299) |
| 1.1 | 6.9 | GO:2000568 | memory T cell activation(GO:0035709) regulation of memory T cell activation(GO:2000567) positive regulation of memory T cell activation(GO:2000568) |
| 1.1 | 33.1 | GO:0002479 | antigen processing and presentation of exogenous peptide antigen via MHC class I, TAP-dependent(GO:0002479) |
| 1.1 | 5.5 | GO:0006620 | posttranslational protein targeting to membrane(GO:0006620) |
| 1.1 | 26.3 | GO:0042789 | mRNA transcription from RNA polymerase II promoter(GO:0042789) |
| 1.1 | 10.6 | GO:0002115 | store-operated calcium entry(GO:0002115) |
| 1.1 | 22.1 | GO:0045954 | positive regulation of natural killer cell mediated cytotoxicity(GO:0045954) |
| 1.1 | 8.4 | GO:0042552 | myelination(GO:0042552) |
| 1.0 | 27.7 | GO:0045730 | respiratory burst(GO:0045730) |
| 1.0 | 4.0 | GO:2000434 | regulation of protein neddylation(GO:2000434) negative regulation of protein neddylation(GO:2000435) |
| 1.0 | 3.9 | GO:0090038 | negative regulation of protein kinase C signaling(GO:0090038) |
| 1.0 | 6.7 | GO:0031642 | negative regulation of myelination(GO:0031642) |
| 1.0 | 23.9 | GO:0035025 | positive regulation of Rho protein signal transduction(GO:0035025) |
| 0.9 | 108.2 | GO:0002819 | regulation of adaptive immune response(GO:0002819) |
| 0.9 | 9.0 | GO:0002430 | complement receptor mediated signaling pathway(GO:0002430) |
| 0.8 | 108.2 | GO:1990823 | response to leukemia inhibitory factor(GO:1990823) cellular response to leukemia inhibitory factor(GO:1990830) |
| 0.8 | 13.1 | GO:1900745 | positive regulation of p38MAPK cascade(GO:1900745) |
| 0.7 | 17.9 | GO:0030855 | epithelial cell differentiation(GO:0030855) |
| 0.7 | 4.5 | GO:0043402 | glucocorticoid mediated signaling pathway(GO:0043402) |
| 0.7 | 7.3 | GO:0071763 | nuclear membrane organization(GO:0071763) |
| 0.7 | 2.9 | GO:0046671 | negative regulation of cellular pH reduction(GO:0032848) CD8-positive, alpha-beta T cell lineage commitment(GO:0043375) negative regulation of retinal cell programmed cell death(GO:0046671) |
| 0.7 | 5.1 | GO:1904153 | negative regulation of protein exit from endoplasmic reticulum(GO:0070862) negative regulation of retrograde protein transport, ER to cytosol(GO:1904153) |
| 0.7 | 4.3 | GO:0051342 | regulation of cyclic-nucleotide phosphodiesterase activity(GO:0051342) negative regulation of cyclic-nucleotide phosphodiesterase activity(GO:0051344) |
| 0.7 | 19.1 | GO:0045671 | negative regulation of osteoclast differentiation(GO:0045671) |
| 0.7 | 8.9 | GO:2000675 | negative regulation of type B pancreatic cell apoptotic process(GO:2000675) |
| 0.7 | 110.9 | GO:0002223 | stimulatory C-type lectin receptor signaling pathway(GO:0002223) |
| 0.6 | 15.3 | GO:0046339 | diacylglycerol metabolic process(GO:0046339) |
| 0.6 | 12.5 | GO:0032012 | regulation of ARF protein signal transduction(GO:0032012) |
| 0.6 | 11.7 | GO:0033169 | histone H3-K9 demethylation(GO:0033169) |
| 0.6 | 57.8 | GO:0030183 | B cell differentiation(GO:0030183) |
| 0.6 | 78.1 | GO:0007338 | single fertilization(GO:0007338) |
| 0.6 | 15.2 | GO:0007035 | vacuolar acidification(GO:0007035) |
| 0.5 | 3.8 | GO:0018401 | peptidyl-proline hydroxylation to 4-hydroxy-L-proline(GO:0018401) |
| 0.5 | 5.9 | GO:0090168 | Golgi reassembly(GO:0090168) |
| 0.5 | 23.9 | GO:0007157 | heterophilic cell-cell adhesion via plasma membrane cell adhesion molecules(GO:0007157) |
| 0.5 | 1.5 | GO:2000397 | ubiquitin-dependent endocytosis(GO:0070086) regulation of ubiquitin-dependent endocytosis(GO:2000395) positive regulation of ubiquitin-dependent endocytosis(GO:2000397) |
| 0.5 | 18.1 | GO:0031663 | lipopolysaccharide-mediated signaling pathway(GO:0031663) |
| 0.5 | 3.2 | GO:1990564 | protein polyufmylation(GO:1990564) protein K69-linked ufmylation(GO:1990592) |
| 0.4 | 27.7 | GO:0015914 | phospholipid transport(GO:0015914) |
| 0.4 | 4.7 | GO:0051168 | nuclear export(GO:0051168) |
| 0.4 | 11.1 | GO:0006297 | nucleotide-excision repair, DNA gap filling(GO:0006297) |
| 0.4 | 13.9 | GO:0002260 | lymphocyte homeostasis(GO:0002260) |
| 0.4 | 15.6 | GO:0035329 | hippo signaling(GO:0035329) |
| 0.4 | 5.5 | GO:0006044 | N-acetylglucosamine metabolic process(GO:0006044) |
| 0.4 | 4.1 | GO:0008340 | determination of adult lifespan(GO:0008340) |
| 0.4 | 2.9 | GO:0032020 | ISG15-protein conjugation(GO:0032020) |
| 0.4 | 4.6 | GO:0034244 | negative regulation of transcription elongation from RNA polymerase II promoter(GO:0034244) |
| 0.3 | 2.4 | GO:0090043 | regulation of tubulin deacetylation(GO:0090043) |
| 0.3 | 17.1 | GO:0038128 | ERBB2 signaling pathway(GO:0038128) |
| 0.3 | 0.7 | GO:0031630 | regulation of synaptic vesicle fusion to presynaptic membrane(GO:0031630) |
| 0.3 | 11.5 | GO:0051568 | histone H3-K4 methylation(GO:0051568) |
| 0.3 | 11.1 | GO:0006607 | NLS-bearing protein import into nucleus(GO:0006607) |
| 0.3 | 18.2 | GO:0006953 | acute-phase response(GO:0006953) |
| 0.3 | 4.4 | GO:0015671 | oxygen transport(GO:0015671) |
| 0.3 | 25.5 | GO:0030218 | erythrocyte differentiation(GO:0030218) |
| 0.3 | 10.6 | GO:0007190 | activation of adenylate cyclase activity(GO:0007190) |
| 0.3 | 39.9 | GO:0014065 | phosphatidylinositol 3-kinase signaling(GO:0014065) |
| 0.3 | 1.6 | GO:0035655 | interleukin-18-mediated signaling pathway(GO:0035655) cellular response to interleukin-18(GO:0071351) |
| 0.3 | 6.0 | GO:0035338 | long-chain fatty-acyl-CoA biosynthetic process(GO:0035338) |
| 0.2 | 15.8 | GO:0006611 | protein export from nucleus(GO:0006611) |
| 0.2 | 5.1 | GO:0015991 | energy coupled proton transmembrane transport, against electrochemical gradient(GO:0015988) ATP hydrolysis coupled proton transport(GO:0015991) |
| 0.2 | 4.3 | GO:0071108 | protein K48-linked deubiquitination(GO:0071108) |
| 0.2 | 8.2 | GO:0034314 | Arp2/3 complex-mediated actin nucleation(GO:0034314) |
| 0.2 | 9.0 | GO:0016266 | O-glycan processing(GO:0016266) |
| 0.2 | 24.8 | GO:0038096 | immune response-regulating cell surface receptor signaling pathway involved in phagocytosis(GO:0002433) Fc-gamma receptor signaling pathway involved in phagocytosis(GO:0038096) |
| 0.2 | 30.2 | GO:0045047 | protein targeting to ER(GO:0045047) |
| 0.2 | 2.7 | GO:1904896 | ESCRT complex disassembly(GO:1904896) ESCRT III complex disassembly(GO:1904903) |
| 0.2 | 3.4 | GO:0016445 | somatic diversification of immunoglobulins(GO:0016445) |
| 0.2 | 6.4 | GO:0000186 | activation of MAPKK activity(GO:0000186) |
| 0.2 | 8.8 | GO:0045540 | regulation of cholesterol biosynthetic process(GO:0045540) |
| 0.2 | 10.4 | GO:0043312 | neutrophil activation involved in immune response(GO:0002283) neutrophil degranulation(GO:0043312) |
| 0.2 | 96.4 | GO:0043547 | positive regulation of GTPase activity(GO:0043547) |
| 0.1 | 18.5 | GO:0044070 | regulation of anion transport(GO:0044070) |
| 0.1 | 2.9 | GO:0030225 | macrophage differentiation(GO:0030225) |
| 0.1 | 4.0 | GO:0006308 | DNA catabolic process(GO:0006308) |
| 0.1 | 0.5 | GO:0003219 | cardiac right ventricle formation(GO:0003219) |
| 0.1 | 4.6 | GO:0046686 | response to cadmium ion(GO:0046686) |
| 0.1 | 5.2 | GO:0000413 | protein peptidyl-prolyl isomerization(GO:0000413) |
| 0.1 | 1.5 | GO:0035641 | locomotory exploration behavior(GO:0035641) |
| 0.1 | 5.1 | GO:0042795 | snRNA transcription(GO:0009301) snRNA transcription from RNA polymerase II promoter(GO:0042795) |
| 0.1 | 14.1 | GO:0006413 | translational initiation(GO:0006413) |
| 0.1 | 3.1 | GO:0007566 | embryo implantation(GO:0007566) |
| 0.1 | 1.5 | GO:0003094 | glomerular filtration(GO:0003094) |
| 0.1 | 40.3 | GO:0006954 | inflammatory response(GO:0006954) |
| 0.1 | 41.2 | GO:0016032 | viral process(GO:0016032) |
| 0.1 | 4.5 | GO:0006120 | mitochondrial electron transport, NADH to ubiquinone(GO:0006120) |
| 0.1 | 3.9 | GO:0008625 | extrinsic apoptotic signaling pathway via death domain receptors(GO:0008625) |
| 0.1 | 3.4 | GO:0006468 | protein phosphorylation(GO:0006468) |
| 0.0 | 6.1 | GO:0018105 | peptidyl-serine phosphorylation(GO:0018105) |
| 0.0 | 0.1 | GO:0038018 | Wnt receptor catabolic process(GO:0038018) |
| 0.0 | 3.1 | GO:0015992 | proton transport(GO:0015992) |
| 0.0 | 0.4 | GO:0006359 | regulation of transcription from RNA polymerase III promoter(GO:0006359) |
| 0.0 | 0.3 | GO:0051091 | positive regulation of sequence-specific DNA binding transcription factor activity(GO:0051091) |
| 0.0 | 2.5 | GO:0002250 | adaptive immune response(GO:0002250) |
Gene overrepresentation in cellular_component category:
| Log-likelihood per target | Total log-likelihood | Term | Description |
|---|---|---|---|
| 20.2 | 101.0 | GO:0034688 | integrin alphaM-beta2 complex(GO:0034688) |
| 13.4 | 94.1 | GO:0019815 | B cell receptor complex(GO:0019815) |
| 8.5 | 42.7 | GO:0046696 | lipopolysaccharide receptor complex(GO:0046696) |
| 8.4 | 59.0 | GO:0072487 | MSL complex(GO:0072487) |
| 8.2 | 65.6 | GO:0032010 | phagolysosome(GO:0032010) |
| 7.8 | 7.8 | GO:0071159 | NF-kappaB complex(GO:0071159) |
| 7.5 | 45.0 | GO:0070436 | Grb2-EGFR complex(GO:0070436) |
| 6.9 | 137.2 | GO:0001891 | phagocytic cup(GO:0001891) |
| 4.7 | 14.1 | GO:0005850 | eukaryotic translation initiation factor 2 complex(GO:0005850) |
| 3.5 | 17.7 | GO:0032009 | early phagosome(GO:0032009) |
| 3.4 | 36.9 | GO:0042105 | alpha-beta T cell receptor complex(GO:0042105) |
| 3.1 | 43.9 | GO:0031209 | SCAR complex(GO:0031209) |
| 2.8 | 34.0 | GO:0033256 | I-kappaB/NF-kappaB complex(GO:0033256) |
| 2.8 | 11.1 | GO:0043625 | delta DNA polymerase complex(GO:0043625) |
| 2.7 | 51.2 | GO:1990124 | messenger ribonucleoprotein complex(GO:1990124) |
| 2.6 | 18.1 | GO:0046581 | intercellular canaliculus(GO:0046581) |
| 2.1 | 17.1 | GO:0035976 | AP1 complex(GO:0035976) |
| 1.8 | 98.3 | GO:0005834 | heterotrimeric G-protein complex(GO:0005834) |
| 1.8 | 25.5 | GO:0031618 | nuclear pericentric heterochromatin(GO:0031618) |
| 1.8 | 10.5 | GO:0005784 | Sec61 translocon complex(GO:0005784) translocon complex(GO:0071256) |
| 1.7 | 15.2 | GO:0000220 | vacuolar proton-transporting V-type ATPase, V0 domain(GO:0000220) |
| 1.5 | 36.9 | GO:0005852 | eukaryotic translation initiation factor 3 complex(GO:0005852) |
| 1.4 | 125.8 | GO:0035580 | specific granule lumen(GO:0035580) |
| 1.4 | 75.2 | GO:0001772 | immunological synapse(GO:0001772) |
| 1.3 | 3.9 | GO:0034657 | GID complex(GO:0034657) |
| 1.3 | 3.8 | GO:0016222 | procollagen-proline 4-dioxygenase complex(GO:0016222) |
| 1.2 | 17.1 | GO:0030897 | HOPS complex(GO:0030897) |
| 1.2 | 21.8 | GO:0031254 | uropod(GO:0001931) cell trailing edge(GO:0031254) |
| 1.2 | 15.2 | GO:0048188 | Set1C/COMPASS complex(GO:0048188) |
| 1.2 | 4.6 | GO:0032044 | DSIF complex(GO:0032044) |
| 1.2 | 163.6 | GO:0032587 | ruffle membrane(GO:0032587) |
| 1.1 | 37.4 | GO:0000159 | protein phosphatase type 2A complex(GO:0000159) |
| 1.1 | 78.9 | GO:0030670 | phagocytic vesicle membrane(GO:0030670) |
| 1.1 | 4.3 | GO:0031313 | extrinsic component of endosome membrane(GO:0031313) |
| 1.1 | 74.8 | GO:0035577 | azurophil granule membrane(GO:0035577) |
| 1.0 | 5.1 | GO:0000836 | Hrd1p ubiquitin ligase complex(GO:0000836) |
| 1.0 | 154.6 | GO:0031225 | anchored component of membrane(GO:0031225) |
| 1.0 | 5.9 | GO:0008537 | proteasome activator complex(GO:0008537) |
| 0.9 | 11.3 | GO:0032045 | guanyl-nucleotide exchange factor complex(GO:0032045) |
| 0.9 | 6.2 | GO:0030121 | AP-1 adaptor complex(GO:0030121) |
| 0.9 | 3.6 | GO:0034751 | aryl hydrocarbon receptor complex(GO:0034751) |
| 0.9 | 16.5 | GO:0005885 | Arp2/3 protein complex(GO:0005885) |
| 0.8 | 13.4 | GO:0016442 | RISC complex(GO:0016442) RNAi effector complex(GO:0031332) |
| 0.8 | 25.8 | GO:0030686 | 90S preribosome(GO:0030686) |
| 0.8 | 8.8 | GO:0016602 | CCAAT-binding factor complex(GO:0016602) |
| 0.7 | 5.1 | GO:0005787 | signal peptidase complex(GO:0005787) |
| 0.7 | 5.6 | GO:0008250 | oligosaccharyltransferase complex(GO:0008250) |
| 0.7 | 77.1 | GO:0031234 | extrinsic component of cytoplasmic side of plasma membrane(GO:0031234) |
| 0.7 | 12.3 | GO:0097342 | ripoptosome(GO:0097342) |
| 0.6 | 11.4 | GO:0016580 | Sin3 complex(GO:0016580) |
| 0.6 | 16.0 | GO:0035098 | ESC/E(Z) complex(GO:0035098) |
| 0.5 | 33.1 | GO:0030669 | clathrin-coated endocytic vesicle membrane(GO:0030669) |
| 0.5 | 18.4 | GO:0030173 | integral component of Golgi membrane(GO:0030173) |
| 0.5 | 9.4 | GO:0030904 | retromer complex(GO:0030904) |
| 0.4 | 5.4 | GO:0000788 | nuclear nucleosome(GO:0000788) |
| 0.4 | 115.2 | GO:0009897 | external side of plasma membrane(GO:0009897) |
| 0.4 | 7.1 | GO:0031932 | TORC2 complex(GO:0031932) |
| 0.4 | 3.4 | GO:0005955 | calcineurin complex(GO:0005955) |
| 0.4 | 60.7 | GO:0098802 | plasma membrane receptor complex(GO:0098802) |
| 0.3 | 82.7 | GO:0030667 | secretory granule membrane(GO:0030667) |
| 0.3 | 80.3 | GO:0005765 | lysosomal membrane(GO:0005765) lytic vacuole membrane(GO:0098852) |
| 0.3 | 8.7 | GO:0005665 | DNA-directed RNA polymerase II, core complex(GO:0005665) |
| 0.3 | 70.3 | GO:0045121 | membrane raft(GO:0045121) membrane microdomain(GO:0098857) |
| 0.3 | 32.8 | GO:0043679 | axon terminus(GO:0043679) |
| 0.3 | 2.7 | GO:0000815 | ESCRT III complex(GO:0000815) |
| 0.3 | 7.1 | GO:0031307 | integral component of mitochondrial outer membrane(GO:0031307) |
| 0.3 | 5.5 | GO:0005791 | rough endoplasmic reticulum(GO:0005791) |
| 0.3 | 22.9 | GO:0005913 | cell-cell adherens junction(GO:0005913) |
| 0.2 | 103.8 | GO:0005667 | transcription factor complex(GO:0005667) |
| 0.2 | 60.3 | GO:0000790 | nuclear chromatin(GO:0000790) |
| 0.2 | 72.7 | GO:0031965 | nuclear membrane(GO:0031965) |
| 0.2 | 2.8 | GO:0044322 | endoplasmic reticulum quality control compartment(GO:0044322) |
| 0.2 | 19.2 | GO:0043204 | perikaryon(GO:0043204) |
| 0.2 | 3.9 | GO:0097225 | sperm midpiece(GO:0097225) |
| 0.2 | 1.5 | GO:0000813 | ESCRT I complex(GO:0000813) |
| 0.2 | 2.1 | GO:0002199 | zona pellucida receptor complex(GO:0002199) |
| 0.2 | 2.5 | GO:0000974 | Prp19 complex(GO:0000974) |
| 0.2 | 15.4 | GO:0019867 | mitochondrial outer membrane(GO:0005741) outer membrane(GO:0019867) organelle outer membrane(GO:0031968) |
| 0.2 | 110.3 | GO:0000139 | Golgi membrane(GO:0000139) |
| 0.2 | 17.2 | GO:0022625 | cytosolic large ribosomal subunit(GO:0022625) |
| 0.2 | 213.0 | GO:0005887 | integral component of plasma membrane(GO:0005887) |
| 0.1 | 8.3 | GO:0032154 | cleavage furrow(GO:0032154) cell surface furrow(GO:0097610) |
| 0.1 | 3.9 | GO:0005682 | U5 snRNP(GO:0005682) |
| 0.1 | 10.6 | GO:0035578 | azurophil granule lumen(GO:0035578) |
| 0.1 | 0.4 | GO:0045261 | mitochondrial proton-transporting ATP synthase complex, catalytic core F(1)(GO:0000275) proton-transporting ATP synthase complex, catalytic core F(1)(GO:0045261) |
| 0.1 | 17.5 | GO:0005681 | spliceosomal complex(GO:0005681) |
| 0.1 | 22.4 | GO:0005911 | cell-cell junction(GO:0005911) |
| 0.1 | 14.7 | GO:0000775 | chromosome, centromeric region(GO:0000775) |
| 0.1 | 28.2 | GO:0048471 | perinuclear region of cytoplasm(GO:0048471) |
| 0.1 | 3.5 | GO:0005882 | intermediate filament(GO:0005882) |
| 0.1 | 4.5 | GO:0045271 | mitochondrial respiratory chain complex I(GO:0005747) NADH dehydrogenase complex(GO:0030964) respiratory chain complex I(GO:0045271) |
| 0.1 | 4.8 | GO:0022627 | cytosolic small ribosomal subunit(GO:0022627) |
| 0.1 | 5.4 | GO:0016605 | PML body(GO:0016605) |
| 0.1 | 121.2 | GO:0070062 | extracellular exosome(GO:0070062) |
| 0.0 | 82.9 | GO:0016021 | integral component of membrane(GO:0016021) |
| 0.0 | 0.3 | GO:0033588 | Elongator holoenzyme complex(GO:0033588) |
| 0.0 | 1.8 | GO:0030027 | lamellipodium(GO:0030027) |
Gene overrepresentation in molecular_function category:
| Log-likelihood per target | Total log-likelihood | Term | Description |
|---|---|---|---|
| 23.7 | 71.2 | GO:0050528 | acyloxyacyl hydrolase activity(GO:0050528) |
| 23.5 | 235.0 | GO:0005094 | Rho GDP-dissociation inhibitor activity(GO:0005094) |
| 22.4 | 67.2 | GO:0004464 | leukotriene-C4 synthase activity(GO:0004464) |
| 20.6 | 61.8 | GO:0036134 | thromboxane-A synthase activity(GO:0004796) 12-hydroxyheptadecatrienoic acid synthase activity(GO:0036134) |
| 20.2 | 60.7 | GO:0004914 | interleukin-5 receptor activity(GO:0004914) |
| 14.4 | 101.0 | GO:0030369 | ICAM-3 receptor activity(GO:0030369) |
| 11.0 | 32.9 | GO:0045322 | unmethylated CpG binding(GO:0045322) |
| 8.4 | 25.3 | GO:0016314 | phosphatidylinositol-3,4,5-trisphosphate 3-phosphatase activity(GO:0016314) |
| 8.4 | 33.6 | GO:0019770 | IgG receptor activity(GO:0019770) |
| 7.9 | 23.7 | GO:0016019 | peptidoglycan receptor activity(GO:0016019) |
| 7.2 | 28.7 | GO:0019763 | immunoglobulin receptor activity(GO:0019763) |
| 6.6 | 65.6 | GO:0016176 | superoxide-generating NADPH oxidase activator activity(GO:0016176) |
| 6.4 | 19.2 | GO:0031727 | CCR2 chemokine receptor binding(GO:0031727) |
| 6.4 | 114.6 | GO:0019992 | diacylglycerol binding(GO:0019992) |
| 5.8 | 75.4 | GO:0042608 | T cell receptor binding(GO:0042608) |
| 5.5 | 27.7 | GO:0017159 | pantetheine hydrolase activity(GO:0017159) |
| 5.5 | 88.0 | GO:0032036 | myosin heavy chain binding(GO:0032036) |
| 5.5 | 60.1 | GO:0051525 | NFAT protein binding(GO:0051525) |
| 4.7 | 14.2 | GO:0015333 | peptide:proton symporter activity(GO:0015333) proton-dependent peptide secondary active transmembrane transporter activity(GO:0022897) |
| 4.6 | 18.4 | GO:0033829 | O-fucosylpeptide 3-beta-N-acetylglucosaminyltransferase activity(GO:0033829) |
| 4.5 | 13.4 | GO:0004917 | interleukin-7 receptor activity(GO:0004917) |
| 4.0 | 48.5 | GO:0019864 | IgG binding(GO:0019864) |
| 4.0 | 68.6 | GO:0035325 | receptor signaling protein tyrosine kinase activity(GO:0004716) Toll-like receptor binding(GO:0035325) |
| 3.8 | 116.4 | GO:0001965 | G-protein alpha-subunit binding(GO:0001965) |
| 3.7 | 51.5 | GO:0005168 | neurotrophin TRKA receptor binding(GO:0005168) |
| 3.7 | 40.3 | GO:0005068 | transmembrane receptor protein tyrosine kinase adaptor activity(GO:0005068) |
| 3.6 | 10.9 | GO:0032184 | SUMO polymer binding(GO:0032184) |
| 3.3 | 9.9 | GO:0004609 | phosphatidylserine decarboxylase activity(GO:0004609) |
| 3.1 | 27.7 | GO:0008526 | phosphatidylinositol transporter activity(GO:0008526) |
| 3.1 | 9.2 | GO:0046935 | 1-phosphatidylinositol-3-kinase regulator activity(GO:0046935) |
| 3.1 | 18.4 | GO:0035800 | deubiquitinase activator activity(GO:0035800) |
| 3.0 | 51.2 | GO:0008494 | translation activator activity(GO:0008494) |
| 2.7 | 30.2 | GO:0015174 | basic amino acid transmembrane transporter activity(GO:0015174) |
| 2.7 | 27.3 | GO:1990948 | ligase inhibitor activity(GO:0055104) ubiquitin ligase inhibitor activity(GO:1990948) |
| 2.7 | 130.3 | GO:0005164 | tumor necrosis factor receptor binding(GO:0005164) |
| 2.6 | 43.4 | GO:0001608 | G-protein coupled nucleotide receptor activity(GO:0001608) G-protein coupled purinergic nucleotide receptor activity(GO:0045028) |
| 2.5 | 55.1 | GO:0008239 | dipeptidyl-peptidase activity(GO:0008239) |
| 2.4 | 14.6 | GO:0039552 | RIG-I binding(GO:0039552) |
| 2.4 | 19.0 | GO:0001875 | lipopolysaccharide receptor activity(GO:0001875) |
| 2.3 | 100.4 | GO:0001784 | phosphotyrosine binding(GO:0001784) |
| 2.3 | 50.6 | GO:0043325 | phosphatidylinositol-3,4-bisphosphate binding(GO:0043325) |
| 1.8 | 18.5 | GO:0005225 | volume-sensitive anion channel activity(GO:0005225) |
| 1.7 | 6.7 | GO:0043812 | phosphatidylinositol-4-phosphate phosphatase activity(GO:0043812) |
| 1.5 | 70.7 | GO:0036002 | pre-mRNA binding(GO:0036002) |
| 1.5 | 15.0 | GO:0019869 | chloride channel inhibitor activity(GO:0019869) |
| 1.5 | 13.4 | GO:0050072 | m7G(5')pppN diphosphatase activity(GO:0050072) |
| 1.5 | 8.9 | GO:0010859 | calcium-dependent cysteine-type endopeptidase inhibitor activity(GO:0010859) |
| 1.4 | 5.7 | GO:0070735 | protein-glycine ligase activity(GO:0070735) |
| 1.4 | 8.3 | GO:0035402 | histone kinase activity (H3-T11 specific)(GO:0035402) |
| 1.4 | 13.7 | GO:0015232 | heme transporter activity(GO:0015232) |
| 1.3 | 9.0 | GO:0004920 | interleukin-10 receptor activity(GO:0004920) |
| 1.1 | 6.9 | GO:0023030 | MHC class Ib protein complex binding(GO:0023025) MHC class Ib protein binding, via antigen binding groove(GO:0023030) |
| 1.0 | 7.8 | GO:0070181 | small ribosomal subunit rRNA binding(GO:0070181) |
| 0.9 | 17.7 | GO:0009931 | calcium-dependent protein serine/threonine kinase activity(GO:0009931) |
| 0.9 | 10.2 | GO:0004571 | mannosyl-oligosaccharide 1,2-alpha-mannosidase activity(GO:0004571) |
| 0.9 | 4.5 | GO:0004883 | glucocorticoid receptor activity(GO:0004883) glucocorticoid-activated RNA polymerase II transcription factor binding transcription factor activity(GO:0038051) |
| 0.9 | 15.4 | GO:0102391 | decanoate--CoA ligase activity(GO:0102391) |
| 0.8 | 5.1 | GO:0008553 | hydrogen-exporting ATPase activity, phosphorylative mechanism(GO:0008553) |
| 0.8 | 23.5 | GO:0032452 | histone demethylase activity(GO:0032452) |
| 0.8 | 5.9 | GO:0061133 | endopeptidase activator activity(GO:0061133) |
| 0.8 | 59.0 | GO:0035064 | methylated histone binding(GO:0035064) |
| 0.8 | 10.6 | GO:0015279 | store-operated calcium channel activity(GO:0015279) |
| 0.8 | 11.4 | GO:0032041 | histone deacetylase activity (H3-K14 specific)(GO:0031078) NAD-dependent histone deacetylase activity (H3-K14 specific)(GO:0032041) |
| 0.8 | 20.6 | GO:0004435 | phosphatidylinositol phospholipase C activity(GO:0004435) |
| 0.8 | 3.8 | GO:0019798 | procollagen-proline 4-dioxygenase activity(GO:0004656) procollagen-proline dioxygenase activity(GO:0019798) |
| 0.8 | 15.8 | GO:0001055 | RNA polymerase II activity(GO:0001055) |
| 0.7 | 134.0 | GO:0001085 | RNA polymerase II transcription factor binding(GO:0001085) |
| 0.7 | 19.6 | GO:0016922 | ligand-dependent nuclear receptor binding(GO:0016922) |
| 0.7 | 35.6 | GO:0015026 | coreceptor activity(GO:0015026) |
| 0.7 | 5.5 | GO:0004563 | beta-N-acetylhexosaminidase activity(GO:0004563) |
| 0.7 | 50.9 | GO:0003743 | translation initiation factor activity(GO:0003743) |
| 0.7 | 10.6 | GO:0008179 | adenylate cyclase binding(GO:0008179) |
| 0.7 | 15.2 | GO:0036442 | hydrogen-exporting ATPase activity(GO:0036442) proton-transporting ATPase activity, rotational mechanism(GO:0046961) |
| 0.7 | 34.6 | GO:0034987 | immunoglobulin receptor binding(GO:0034987) |
| 0.6 | 9.0 | GO:0004875 | complement receptor activity(GO:0004875) |
| 0.6 | 10.3 | GO:0004143 | diacylglycerol kinase activity(GO:0004143) |
| 0.6 | 34.7 | GO:0017112 | Rab guanyl-nucleotide exchange factor activity(GO:0017112) |
| 0.6 | 24.6 | GO:0001205 | transcriptional activator activity, RNA polymerase II distal enhancer sequence-specific binding(GO:0001205) |
| 0.6 | 9.0 | GO:0004653 | polypeptide N-acetylgalactosaminyltransferase activity(GO:0004653) |
| 0.6 | 58.5 | GO:0030295 | protein kinase activator activity(GO:0030295) |
| 0.6 | 18.2 | GO:0070491 | repressing transcription factor binding(GO:0070491) |
| 0.6 | 17.0 | GO:0000993 | RNA polymerase II core binding(GO:0000993) |
| 0.6 | 5.6 | GO:0004579 | dolichyl-diphosphooligosaccharide-protein glycotransferase activity(GO:0004579) |
| 0.5 | 9.8 | GO:0005537 | mannose binding(GO:0005537) |
| 0.5 | 5.2 | GO:0033192 | calmodulin-dependent protein phosphatase activity(GO:0033192) |
| 0.5 | 12.5 | GO:0005086 | ARF guanyl-nucleotide exchange factor activity(GO:0005086) |
| 0.5 | 2.9 | GO:0042296 | ISG15 transferase activity(GO:0042296) |
| 0.4 | 14.0 | GO:0031683 | G-protein beta/gamma-subunit complex binding(GO:0031683) |
| 0.4 | 22.8 | GO:0005044 | scavenger receptor activity(GO:0005044) |
| 0.4 | 2.1 | GO:0031681 | G-protein beta-subunit binding(GO:0031681) |
| 0.4 | 11.1 | GO:0003887 | DNA-directed DNA polymerase activity(GO:0003887) |
| 0.4 | 117.1 | GO:0003924 | GTPase activity(GO:0003924) |
| 0.4 | 10.5 | GO:0042288 | MHC class I protein binding(GO:0042288) |
| 0.4 | 7.1 | GO:0019789 | SUMO transferase activity(GO:0019789) |
| 0.4 | 3.6 | GO:0017162 | aryl hydrocarbon receptor binding(GO:0017162) |
| 0.3 | 4.4 | GO:0005344 | oxygen transporter activity(GO:0005344) |
| 0.3 | 37.0 | GO:0019888 | protein phosphatase regulator activity(GO:0019888) |
| 0.3 | 1.5 | GO:0046790 | virion binding(GO:0046790) |
| 0.3 | 15.3 | GO:0016278 | lysine N-methyltransferase activity(GO:0016278) protein-lysine N-methyltransferase activity(GO:0016279) |
| 0.3 | 7.3 | GO:0005521 | lamin binding(GO:0005521) |
| 0.3 | 2.9 | GO:0051434 | BH3 domain binding(GO:0051434) |
| 0.3 | 68.6 | GO:0030246 | carbohydrate binding(GO:0030246) |
| 0.2 | 12.8 | GO:0019843 | rRNA binding(GO:0019843) |
| 0.2 | 21.1 | GO:0003725 | double-stranded RNA binding(GO:0003725) |
| 0.2 | 5.1 | GO:0000983 | transcription factor activity, RNA polymerase II core promoter sequence-specific(GO:0000983) |
| 0.2 | 6.4 | GO:0031434 | mitogen-activated protein kinase kinase binding(GO:0031434) |
| 0.2 | 48.0 | GO:0051015 | actin filament binding(GO:0051015) |
| 0.2 | 60.4 | GO:0005096 | GTPase activator activity(GO:0005096) |
| 0.2 | 5.1 | GO:0035035 | histone acetyltransferase binding(GO:0035035) |
| 0.2 | 8.8 | GO:0000980 | RNA polymerase II distal enhancer sequence-specific DNA binding(GO:0000980) |
| 0.1 | 1.9 | GO:0005030 | GPI-linked ephrin receptor activity(GO:0005004) neurotrophin receptor activity(GO:0005030) |
| 0.1 | 8.8 | GO:0003735 | structural constituent of ribosome(GO:0003735) |
| 0.1 | 5.0 | GO:0030971 | receptor tyrosine kinase binding(GO:0030971) |
| 0.1 | 8.3 | GO:0097110 | scaffold protein binding(GO:0097110) |
| 0.1 | 5.5 | GO:0043022 | ribosome binding(GO:0043022) |
| 0.1 | 5.2 | GO:0003755 | peptidyl-prolyl cis-trans isomerase activity(GO:0003755) |
| 0.1 | 139.9 | GO:0004872 | receptor activity(GO:0004872) molecular transducer activity(GO:0060089) |
| 0.1 | 0.4 | GO:0001016 | RNA polymerase III regulatory region DNA binding(GO:0001016) |
| 0.1 | 9.6 | GO:0003697 | single-stranded DNA binding(GO:0003697) |
| 0.1 | 29.5 | GO:0045296 | cadherin binding(GO:0045296) |
| 0.1 | 4.5 | GO:0008137 | NADH dehydrogenase (ubiquinone) activity(GO:0008137) NADH dehydrogenase (quinone) activity(GO:0050136) |
| 0.1 | 3.9 | GO:0008186 | ATP-dependent RNA helicase activity(GO:0004004) RNA-dependent ATPase activity(GO:0008186) |
| 0.1 | 3.4 | GO:0004693 | cyclin-dependent protein serine/threonine kinase activity(GO:0004693) |
| 0.1 | 3.9 | GO:0004715 | non-membrane spanning protein tyrosine kinase activity(GO:0004715) |
| 0.1 | 11.3 | GO:0005085 | guanyl-nucleotide exchange factor activity(GO:0005085) |
| 0.1 | 1.8 | GO:0008139 | nuclear localization sequence binding(GO:0008139) |
| 0.0 | 5.2 | GO:0005198 | structural molecule activity(GO:0005198) |
| 0.0 | 6.4 | GO:0035091 | phosphatidylinositol binding(GO:0035091) |
| 0.0 | 1.7 | GO:0004177 | aminopeptidase activity(GO:0004177) |
| 0.0 | 10.3 | GO:0004871 | signal transducer activity(GO:0004871) |
| 0.0 | 1.7 | GO:0000979 | RNA polymerase II core promoter sequence-specific DNA binding(GO:0000979) |
| 0.0 | 4.3 | GO:0001077 | transcriptional activator activity, RNA polymerase II core promoter proximal region sequence-specific binding(GO:0001077) |
| 0.0 | 0.3 | GO:0004115 | 3',5'-cyclic-AMP phosphodiesterase activity(GO:0004115) |
Gene overrepresentation in C2:CP category:
| Log-likelihood per target | Total log-likelihood | Term | Description |
|---|---|---|---|
| 4.7 | 112.2 | PID IL5 PATHWAY | IL5-mediated signaling events |
| 3.7 | 128.2 | SA B CELL RECEPTOR COMPLEXES | Antigen binding to B cell receptors activates protein tyrosine kinases, such as the Src family, which ultimate activate MAP kinases. |
| 3.5 | 187.0 | PID IL8 CXCR2 PATHWAY | IL8- and CXCR2-mediated signaling events |
| 3.3 | 170.0 | PID INTEGRIN2 PATHWAY | Beta2 integrin cell surface interactions |
| 3.1 | 235.0 | PID RHOA REG PATHWAY | Regulation of RhoA activity |
| 2.8 | 114.6 | PID RAS PATHWAY | Regulation of Ras family activation |
| 2.6 | 186.1 | PID FCER1 PATHWAY | Fc-epsilon receptor I signaling in mast cells |
| 2.0 | 142.2 | PID TRKR PATHWAY | Neurotrophic factor-mediated Trk receptor signaling |
| 1.8 | 141.9 | PID IL4 2PATHWAY | IL4-mediated signaling events |
| 1.6 | 42.7 | PID TOLL ENDOGENOUS PATHWAY | Endogenous TLR signaling |
| 1.0 | 45.5 | PID IL12 STAT4 PATHWAY | IL12 signaling mediated by STAT4 |
| 1.0 | 63.7 | PID RAC1 PATHWAY | RAC1 signaling pathway |
| 0.8 | 11.4 | PID RANBP2 PATHWAY | Sumoylation by RanBP2 regulates transcriptional repression |
| 0.8 | 36.3 | PID BCR 5PATHWAY | BCR signaling pathway |
| 0.7 | 24.2 | ST ERK1 ERK2 MAPK PATHWAY | ERK1/ERK2 MAPK Pathway |
| 0.6 | 8.3 | PID P38 GAMMA DELTA PATHWAY | Signaling mediated by p38-gamma and p38-delta |
| 0.6 | 27.3 | PID IL12 2PATHWAY | IL12-mediated signaling events |
| 0.6 | 15.2 | SA FAS SIGNALING | The TNF-type receptor Fas induces apoptosis on ligand binding. |
| 0.6 | 54.5 | PID PDGFRB PATHWAY | PDGFR-beta signaling pathway |
| 0.6 | 34.9 | PID NFAT TFPATHWAY | Calcineurin-regulated NFAT-dependent transcription in lymphocytes |
| 0.5 | 10.6 | SIG INSULIN RECEPTOR PATHWAY IN CARDIAC MYOCYTES | Genes related to the insulin receptor pathway |
| 0.4 | 24.9 | PID PLK1 PATHWAY | PLK1 signaling events |
| 0.4 | 5.1 | PID HIF1A PATHWAY | Hypoxic and oxygen homeostasis regulation of HIF-1-alpha |
| 0.3 | 53.1 | NABA ECM AFFILIATED | Genes encoding proteins affiliated structurally or functionally to extracellular matrix proteins |
| 0.3 | 9.3 | PID KIT PATHWAY | Signaling events mediated by Stem cell factor receptor (c-Kit) |
| 0.3 | 110.1 | NABA SECRETED FACTORS | Genes encoding secreted soluble factors |
| 0.2 | 4.3 | PID ERBB2 ERBB3 PATHWAY | ErbB2/ErbB3 signaling events |
| 0.2 | 2.5 | SA PTEN PATHWAY | PTEN is a tumor suppressor that dephosphorylates the lipid messenger phosphatidylinositol triphosphate. |
| 0.2 | 11.1 | PID LKB1 PATHWAY | LKB1 signaling events |
| 0.2 | 10.9 | PID TGFBR PATHWAY | TGF-beta receptor signaling |
| 0.2 | 9.9 | PID HNF3A PATHWAY | FOXA1 transcription factor network |
| 0.1 | 16.1 | PID MYC ACTIV PATHWAY | Validated targets of C-MYC transcriptional activation |
| 0.1 | 4.5 | PID HDAC CLASSII PATHWAY | Signaling events mediated by HDAC Class II |
| 0.1 | 8.8 | PID MYC REPRESS PATHWAY | Validated targets of C-MYC transcriptional repression |
| 0.1 | 3.7 | SIG REGULATION OF THE ACTIN CYTOSKELETON BY RHO GTPASES | Genes related to regulation of the actin cytoskeleton |
| 0.1 | 1.4 | PID TCR PATHWAY | TCR signaling in naïve CD4+ T cells |
| 0.0 | 1.5 | PID ERBB1 INTERNALIZATION PATHWAY | Internalization of ErbB1 |
| 0.0 | 1.7 | PID TELOMERASE PATHWAY | Regulation of Telomerase |
| 0.0 | 1.0 | PID ILK PATHWAY | Integrin-linked kinase signaling |
| 0.0 | 0.7 | PID HIF1 TFPATHWAY | HIF-1-alpha transcription factor network |
Gene overrepresentation in C2:CP:REACTOME category:
| Log-likelihood per target | Total log-likelihood | Term | Description |
|---|---|---|---|
| 5.9 | 211.8 | REACTOME REGULATION OF SIGNALING BY CBL | Genes involved in Regulation of signaling by CBL |
| 5.5 | 33.1 | REACTOME CROSS PRESENTATION OF SOLUBLE EXOGENOUS ANTIGENS ENDOSOMES | Genes involved in Cross-presentation of soluble exogenous antigens (endosomes) |
| 3.6 | 42.7 | REACTOME IKK COMPLEX RECRUITMENT MEDIATED BY RIP1 | Genes involved in IKK complex recruitment mediated by RIP1 |
| 3.6 | 74.7 | REACTOME CTLA4 INHIBITORY SIGNALING | Genes involved in CTLA4 inhibitory signaling |
| 3.4 | 156.2 | REACTOME RAP1 SIGNALLING | Genes involved in Rap1 signalling |
| 3.1 | 36.9 | REACTOME PECAM1 INTERACTIONS | Genes involved in PECAM1 interactions |
| 2.9 | 109.6 | REACTOME GPVI MEDIATED ACTIVATION CASCADE | Genes involved in GPVI-mediated activation cascade |
| 2.5 | 271.1 | REACTOME CELL SURFACE INTERACTIONS AT THE VASCULAR WALL | Genes involved in Cell surface interactions at the vascular wall |
| 2.5 | 60.7 | REACTOME IL RECEPTOR SHC SIGNALING | Genes involved in Interleukin receptor SHC signaling |
| 2.3 | 43.4 | REACTOME P2Y RECEPTORS | Genes involved in P2Y receptors |
| 2.2 | 86.6 | REACTOME THE ROLE OF NEF IN HIV1 REPLICATION AND DISEASE PATHOGENESIS | Genes involved in The role of Nef in HIV-1 replication and disease pathogenesis |
| 2.1 | 33.0 | REACTOME SEMA3A PLEXIN REPULSION SIGNALING BY INHIBITING INTEGRIN ADHESION | Genes involved in SEMA3A-Plexin repulsion signaling by inhibiting Integrin adhesion |
| 1.9 | 19.2 | REACTOME BETA DEFENSINS | Genes involved in Beta defensins |
| 1.8 | 181.2 | REACTOME ACTIVATION OF THE MRNA UPON BINDING OF THE CAP BINDING COMPLEX AND EIFS AND SUBSEQUENT BINDING TO 43S | Genes involved in Activation of the mRNA upon binding of the cap-binding complex and eIFs, and subsequent binding to 43S |
| 1.7 | 13.4 | REACTOME IL 7 SIGNALING | Genes involved in Interleukin-7 signaling |
| 1.6 | 267.7 | REACTOME SIGNALING BY RHO GTPASES | Genes involved in Signaling by Rho GTPases |
| 1.6 | 17.7 | REACTOME SPRY REGULATION OF FGF SIGNALING | Genes involved in Spry regulation of FGF signaling |
| 1.4 | 17.7 | REACTOME TRAFFICKING AND PROCESSING OF ENDOSOMAL TLR | Genes involved in Trafficking and processing of endosomal TLR |
| 1.3 | 14.0 | REACTOME REGULATION OF INSULIN SECRETION BY ACETYLCHOLINE | Genes involved in Regulation of Insulin Secretion by Acetylcholine |
| 1.2 | 71.1 | REACTOME G ALPHA Z SIGNALLING EVENTS | Genes involved in G alpha (z) signalling events |
| 1.2 | 135.1 | REACTOME REGULATION OF MRNA STABILITY BY PROTEINS THAT BIND AU RICH ELEMENTS | Genes involved in Regulation of mRNA Stability by Proteins that Bind AU-rich Elements |
| 1.1 | 21.8 | REACTOME THE NLRP3 INFLAMMASOME | Genes involved in The NLRP3 inflammasome |
| 1.1 | 25.4 | REACTOME ANTIGEN ACTIVATES B CELL RECEPTOR LEADING TO GENERATION OF SECOND MESSENGERS | Genes involved in Antigen Activates B Cell Receptor Leading to Generation of Second Messengers |
| 1.1 | 88.2 | REACTOME IMMUNOREGULATORY INTERACTIONS BETWEEN A LYMPHOID AND A NON LYMPHOID CELL | Genes involved in Immunoregulatory interactions between a Lymphoid and a non-Lymphoid cell |
| 1.0 | 12.3 | REACTOME NFKB ACTIVATION THROUGH FADD RIP1 PATHWAY MEDIATED BY CASPASE 8 AND10 | Genes involved in NF-kB activation through FADD/RIP-1 pathway mediated by caspase-8 and -10 |
| 1.0 | 61.8 | REACTOME CYTOCHROME P450 ARRANGED BY SUBSTRATE TYPE | Genes involved in Cytochrome P450 - arranged by substrate type |
| 0.9 | 11.1 | REACTOME REMOVAL OF THE FLAP INTERMEDIATE FROM THE C STRAND | Genes involved in Removal of the Flap Intermediate from the C-strand |
| 0.6 | 15.6 | REACTOME SIGNALING BY HIPPO | Genes involved in Signaling by Hippo |
| 0.6 | 17.7 | REACTOME TRAF6 MEDIATED IRF7 ACTIVATION | Genes involved in TRAF6 mediated IRF7 activation |
| 0.5 | 9.3 | REACTOME SIGNAL REGULATORY PROTEIN SIRP FAMILY INTERACTIONS | Genes involved in Signal regulatory protein (SIRP) family interactions |
| 0.5 | 15.0 | REACTOME PROTEOLYTIC CLEAVAGE OF SNARE COMPLEX PROTEINS | Genes involved in Proteolytic cleavage of SNARE complex proteins |
| 0.5 | 10.8 | REACTOME REGULATION OF AMPK ACTIVITY VIA LKB1 | Genes involved in Regulation of AMPK activity via LKB1 |
| 0.4 | 5.5 | REACTOME ER PHAGOSOME PATHWAY | Genes involved in ER-Phagosome pathway |
| 0.4 | 11.4 | REACTOME G0 AND EARLY G1 | Genes involved in G0 and Early G1 |
| 0.4 | 10.8 | REACTOME SEMA4D IN SEMAPHORIN SIGNALING | Genes involved in Sema4D in semaphorin signaling |
| 0.4 | 9.4 | REACTOME INSULIN RECEPTOR RECYCLING | Genes involved in Insulin receptor recycling |
| 0.3 | 5.1 | REACTOME SYNTHESIS SECRETION AND DEACYLATION OF GHRELIN | Genes involved in Synthesis, Secretion, and Deacylation of Ghrelin |
| 0.3 | 4.3 | REACTOME DOWNREGULATION OF ERBB2 ERBB3 SIGNALING | Genes involved in Downregulation of ERBB2:ERBB3 signaling |
| 0.3 | 6.0 | REACTOME SYNTHESIS OF VERY LONG CHAIN FATTY ACYL COAS | Genes involved in Synthesis of very long-chain fatty acyl-CoAs |
| 0.3 | 10.6 | REACTOME SIGNALING BY ROBO RECEPTOR | Genes involved in Signaling by Robo receptor |
| 0.2 | 24.3 | REACTOME 3 UTR MEDIATED TRANSLATIONAL REGULATION | Genes involved in 3' -UTR-mediated translational regulation |
| 0.2 | 1.5 | REACTOME MEMBRANE BINDING AND TARGETTING OF GAG PROTEINS | Genes involved in Membrane binding and targetting of GAG proteins |
| 0.2 | 2.9 | REACTOME INFLAMMASOMES | Genes involved in Inflammasomes |
| 0.2 | 15.2 | REACTOME ACTIVATION OF CHAPERONE GENES BY XBP1S | Genes involved in Activation of Chaperone Genes by XBP1(S) |
| 0.2 | 20.2 | REACTOME MEIOTIC SYNAPSIS | Genes involved in Meiotic Synapsis |
| 0.2 | 9.0 | REACTOME O LINKED GLYCOSYLATION OF MUCINS | Genes involved in O-linked glycosylation of mucins |
| 0.2 | 2.6 | REACTOME IL 6 SIGNALING | Genes involved in Interleukin-6 signaling |
| 0.2 | 8.3 | REACTOME AMINO ACID AND OLIGOPEPTIDE SLC TRANSPORTERS | Genes involved in Amino acid and oligopeptide SLC transporters |
| 0.2 | 10.5 | REACTOME NOTCH1 INTRACELLULAR DOMAIN REGULATES TRANSCRIPTION | Genes involved in NOTCH1 Intracellular Domain Regulates Transcription |
| 0.2 | 1.0 | REACTOME SHC1 EVENTS IN EGFR SIGNALING | Genes involved in SHC1 events in EGFR signaling |
| 0.2 | 7.2 | REACTOME MYOGENESIS | Genes involved in Myogenesis |
| 0.2 | 7.6 | REACTOME INTERFERON ALPHA BETA SIGNALING | Genes involved in Interferon alpha/beta signaling |
| 0.1 | 1.9 | REACTOME CALNEXIN CALRETICULIN CYCLE | Genes involved in Calnexin/calreticulin cycle |
| 0.1 | 10.7 | REACTOME SIGNALING BY ERBB2 | Genes involved in Signaling by ERBB2 |
| 0.1 | 4.6 | REACTOME ABORTIVE ELONGATION OF HIV1 TRANSCRIPT IN THE ABSENCE OF TAT | Genes involved in Abortive elongation of HIV-1 transcript in the absence of Tat |
| 0.1 | 3.9 | REACTOME MRNA SPLICING MINOR PATHWAY | Genes involved in mRNA Splicing - Minor Pathway |
| 0.1 | 2.9 | REACTOME AUTODEGRADATION OF CDH1 BY CDH1 APC C | Genes involved in Autodegradation of Cdh1 by Cdh1:APC/C |
| 0.1 | 4.7 | REACTOME BMAL1 CLOCK NPAS2 ACTIVATES CIRCADIAN EXPRESSION | Genes involved in BMAL1:CLOCK/NPAS2 Activates Circadian Expression |
| 0.1 | 11.7 | REACTOME FACTORS INVOLVED IN MEGAKARYOCYTE DEVELOPMENT AND PLATELET PRODUCTION | Genes involved in Factors involved in megakaryocyte development and platelet production |
| 0.1 | 2.1 | REACTOME PRE NOTCH PROCESSING IN GOLGI | Genes involved in Pre-NOTCH Processing in Golgi |
| 0.1 | 2.1 | REACTOME FORMATION OF TUBULIN FOLDING INTERMEDIATES BY CCT TRIC | Genes involved in Formation of tubulin folding intermediates by CCT/TriC |
| 0.1 | 1.2 | REACTOME SIGNALING BY SCF KIT | Genes involved in Signaling by SCF-KIT |
| 0.0 | 1.0 | REACTOME DARPP 32 EVENTS | Genes involved in DARPP-32 events |
| 0.0 | 1.0 | REACTOME CELL EXTRACELLULAR MATRIX INTERACTIONS | Genes involved in Cell-extracellular matrix interactions |
| 0.0 | 0.7 | REACTOME ACTIVATION OF KAINATE RECEPTORS UPON GLUTAMATE BINDING | Genes involved in Activation of Kainate Receptors upon glutamate binding |
| 0.0 | 1.8 | REACTOME ANTIVIRAL MECHANISM BY IFN STIMULATED GENES | Genes involved in Antiviral mechanism by IFN-stimulated genes |
| 0.0 | 0.7 | REACTOME OXYGEN DEPENDENT PROLINE HYDROXYLATION OF HYPOXIA INDUCIBLE FACTOR ALPHA | Genes involved in Oxygen-dependent Proline Hydroxylation of Hypoxia-inducible Factor Alpha |