Project
GNF SymAtlas + NCI-60 cancer cell lines, comparison of cancers vs non-cancers, human (Su, 2004; Ross, 2000)
Navigation
Downloads
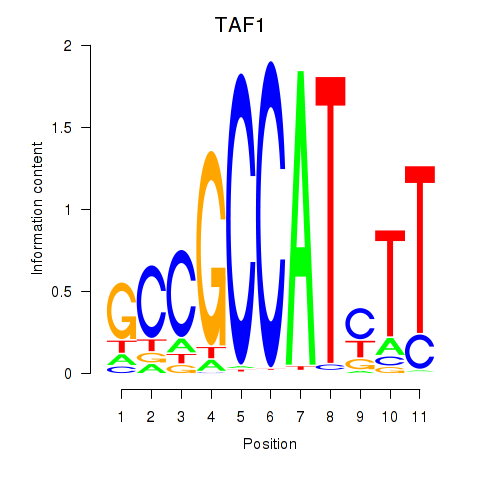
Results for TAF1
Z-value: 1.07
Motif logo
Transcription factors associated with TAF1
| Gene Symbol | Gene ID | Gene Info |
|---|---|---|
|
TAF1
|
ENSG00000147133.11 | TATA-box binding protein associated factor 1 |
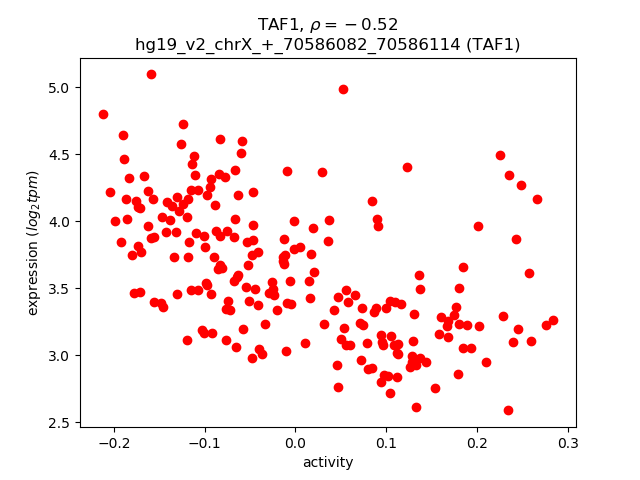
Activity-expression correlation:
| Gene | Promoter | Pearson corr. coef. | P-value | Plot |
|---|---|---|---|---|
| TAF1 | hg19_v2_chrX_+_70586082_70586114 | -0.52 | 2.9e-16 | Click! |
Activity profile of TAF1 motif
Sorted Z-values of TAF1 motif
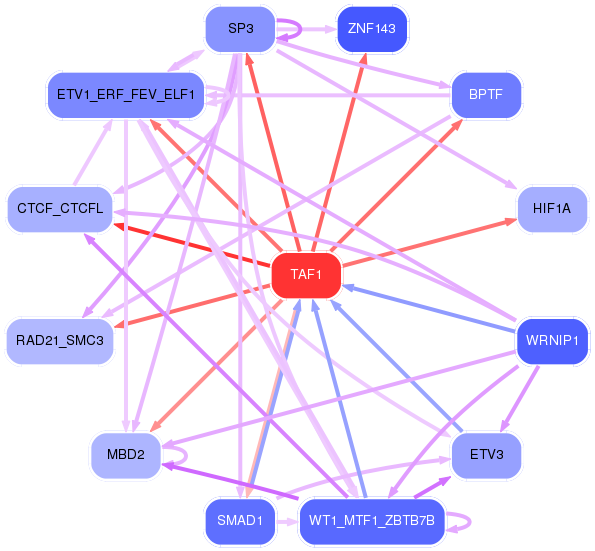
Network of associatons between targets according to the STRING database.

First level regulatory network of TAF1
Gene Ontology Analysis
Gene overrepresentation in biological_process category:
| Log-likelihood per target | Total log-likelihood | Term | Description |
|---|---|---|---|
| 44.7 | 44.7 | GO:0018171 | peptidyl-cysteine oxidation(GO:0018171) |
| 34.1 | 102.2 | GO:0016344 | meiotic chromosome movement towards spindle pole(GO:0016344) |
| 31.8 | 95.4 | GO:0051086 | chaperone mediated protein folding independent of cofactor(GO:0051086) |
| 29.1 | 116.6 | GO:0006432 | phenylalanyl-tRNA aminoacylation(GO:0006432) |
| 27.2 | 81.6 | GO:0070901 | mitochondrial tRNA methylation(GO:0070901) |
| 27.0 | 80.9 | GO:1904247 | positive regulation of polynucleotide adenylyltransferase activity(GO:1904247) |
| 26.8 | 80.3 | GO:0045900 | negative regulation of translational elongation(GO:0045900) |
| 26.6 | 79.8 | GO:0070602 | regulation of centromeric sister chromatid cohesion(GO:0070602) |
| 26.3 | 183.9 | GO:0033484 | nitric oxide homeostasis(GO:0033484) |
| 26.1 | 78.2 | GO:2000681 | negative regulation of rubidium ion transport(GO:2000681) negative regulation of rubidium ion transmembrane transporter activity(GO:2000687) |
| 25.6 | 76.8 | GO:0044209 | AMP salvage(GO:0044209) |
| 24.4 | 24.4 | GO:0080182 | histone H3-K4 trimethylation(GO:0080182) |
| 23.7 | 142.2 | GO:0043981 | histone H4-K5 acetylation(GO:0043981) histone H4-K8 acetylation(GO:0043982) |
| 23.6 | 94.5 | GO:0000960 | mitochondrial RNA catabolic process(GO:0000957) regulation of mitochondrial RNA catabolic process(GO:0000960) |
| 23.4 | 117.0 | GO:1902904 | negative regulation of fibril organization(GO:1902904) chaperone-mediated autophagy translocation complex disassembly(GO:1904764) |
| 23.2 | 69.7 | GO:0006425 | glutaminyl-tRNA aminoacylation(GO:0006425) |
| 22.7 | 68.2 | GO:0097212 | lysosomal membrane organization(GO:0097212) regulation of late endosome to lysosome transport(GO:1902822) |
| 22.6 | 181.0 | GO:0010032 | meiotic chromosome condensation(GO:0010032) |
| 22.6 | 67.8 | GO:0070272 | proton-transporting ATP synthase complex assembly(GO:0043461) proton-transporting ATP synthase complex biogenesis(GO:0070272) |
| 22.5 | 180.1 | GO:0061087 | positive regulation of histone H3-K27 methylation(GO:0061087) |
| 22.2 | 133.4 | GO:1903377 | negative regulation of oxidative stress-induced neuron intrinsic apoptotic signaling pathway(GO:1903377) |
| 22.1 | 66.2 | GO:0006121 | mitochondrial electron transport, succinate to ubiquinone(GO:0006121) |
| 21.5 | 64.5 | GO:1902309 | regulation of heart rate by hormone(GO:0003064) negative regulation of peptidyl-serine dephosphorylation(GO:1902309) |
| 21.1 | 147.9 | GO:1902915 | negative regulation of histone ubiquitination(GO:0033183) negative regulation of protein K63-linked ubiquitination(GO:1900045) regulation of histone H2A K63-linked ubiquitination(GO:1901314) negative regulation of histone H2A K63-linked ubiquitination(GO:1901315) negative regulation of protein polyubiquitination(GO:1902915) |
| 20.2 | 221.9 | GO:0032876 | negative regulation of DNA endoreduplication(GO:0032876) |
| 19.7 | 98.4 | GO:0000389 | mRNA 3'-splice site recognition(GO:0000389) |
| 19.0 | 76.0 | GO:0071894 | histone H2B conserved C-terminal lysine ubiquitination(GO:0071894) |
| 18.7 | 187.4 | GO:0051096 | positive regulation of helicase activity(GO:0051096) |
| 18.6 | 55.9 | GO:0051697 | protein delipidation(GO:0051697) |
| 18.2 | 90.9 | GO:0006167 | AMP biosynthetic process(GO:0006167) |
| 17.7 | 53.0 | GO:0002276 | basophil activation involved in immune response(GO:0002276) |
| 17.6 | 70.2 | GO:0006382 | adenosine to inosine editing(GO:0006382) |
| 17.0 | 51.1 | GO:1990022 | RNA polymerase II complex import to nucleus(GO:0044376) RNA polymerase III complex localization to nucleus(GO:1990022) |
| 16.8 | 151.6 | GO:0061732 | mitochondrial acetyl-CoA biosynthetic process from pyruvate(GO:0061732) |
| 16.4 | 98.2 | GO:0071046 | nuclear ncRNA surveillance(GO:0071029) nuclear polyadenylation-dependent rRNA catabolic process(GO:0071035) nuclear polyadenylation-dependent ncRNA catabolic process(GO:0071046) |
| 16.1 | 161.1 | GO:0034723 | DNA replication-dependent nucleosome assembly(GO:0006335) DNA replication-dependent nucleosome organization(GO:0034723) |
| 15.9 | 111.2 | GO:0070934 | CRD-mediated mRNA stabilization(GO:0070934) |
| 15.4 | 46.2 | GO:1900060 | negative regulation of sphingolipid biosynthetic process(GO:0090155) negative regulation of ceramide biosynthetic process(GO:1900060) |
| 15.3 | 183.4 | GO:0035520 | monoubiquitinated protein deubiquitination(GO:0035520) |
| 15.3 | 259.7 | GO:0075522 | IRES-dependent viral translational initiation(GO:0075522) |
| 15.1 | 15.1 | GO:0042953 | lipoprotein transport(GO:0042953) lipoprotein localization(GO:0044872) |
| 14.7 | 58.8 | GO:0048200 | COPI-coated vesicle budding(GO:0035964) Golgi transport vesicle coating(GO:0048200) COPI coating of Golgi vesicle(GO:0048205) |
| 14.6 | 29.2 | GO:1903862 | positive regulation of oxidative phosphorylation(GO:1903862) |
| 14.6 | 87.6 | GO:0035965 | cardiolipin acyl-chain remodeling(GO:0035965) |
| 14.6 | 87.4 | GO:0070966 | nuclear-transcribed mRNA catabolic process, no-go decay(GO:0070966) |
| 14.4 | 57.5 | GO:0090385 | phagosome-lysosome fusion(GO:0090385) |
| 14.2 | 99.7 | GO:1902416 | positive regulation of mRNA binding(GO:1902416) |
| 14.2 | 71.0 | GO:0006104 | succinyl-CoA metabolic process(GO:0006104) |
| 14.1 | 197.5 | GO:0006122 | mitochondrial electron transport, ubiquinol to cytochrome c(GO:0006122) |
| 14.0 | 41.9 | GO:0070632 | spindle pole body duplication(GO:0030474) spindle pole body organization(GO:0051300) spindle pole body localization(GO:0070631) establishment of spindle pole body localization(GO:0070632) spindle pole body localization to nuclear envelope(GO:0071789) establishment of spindle pole body localization to nuclear envelope(GO:0071790) |
| 13.6 | 27.1 | GO:1903376 | neuron intrinsic apoptotic signaling pathway in response to oxidative stress(GO:0036480) regulation of oxidative stress-induced neuron intrinsic apoptotic signaling pathway(GO:1903376) |
| 13.2 | 211.5 | GO:0043517 | positive regulation of DNA damage response, signal transduction by p53 class mediator(GO:0043517) |
| 12.9 | 90.5 | GO:0070269 | pyroptosis(GO:0070269) |
| 12.9 | 939.0 | GO:0070125 | mitochondrial translational elongation(GO:0070125) mitochondrial translational termination(GO:0070126) |
| 12.7 | 89.2 | GO:1902047 | polyamine transmembrane transport(GO:1902047) regulation of polyamine transmembrane transport(GO:1902267) |
| 12.7 | 51.0 | GO:1904798 | positive regulation of core promoter binding(GO:1904798) |
| 12.7 | 50.9 | GO:0043555 | regulation of translation in response to stress(GO:0043555) |
| 12.7 | 76.1 | GO:0043144 | snoRNA processing(GO:0043144) |
| 12.7 | 88.7 | GO:0001731 | formation of translation preinitiation complex(GO:0001731) |
| 12.5 | 87.6 | GO:0007221 | positive regulation of transcription of Notch receptor target(GO:0007221) |
| 12.2 | 73.1 | GO:0032077 | positive regulation of deoxyribonuclease activity(GO:0032077) |
| 12.2 | 12.2 | GO:0097695 | establishment of RNA localization to telomere(GO:0097694) establishment of macromolecular complex localization to telomere(GO:0097695) |
| 12.1 | 193.4 | GO:0043248 | proteasome assembly(GO:0043248) |
| 11.9 | 35.6 | GO:0061198 | fungiform papilla formation(GO:0061198) |
| 11.8 | 23.5 | GO:1902415 | regulation of mRNA binding(GO:1902415) |
| 11.6 | 46.5 | GO:0033184 | positive regulation of histone ubiquitination(GO:0033184) |
| 11.5 | 92.3 | GO:0033523 | histone H2B ubiquitination(GO:0033523) |
| 11.3 | 33.9 | GO:0006617 | SRP-dependent cotranslational protein targeting to membrane, signal sequence recognition(GO:0006617) |
| 11.2 | 347.3 | GO:0042776 | mitochondrial ATP synthesis coupled proton transport(GO:0042776) |
| 11.2 | 156.3 | GO:0070389 | chaperone cofactor-dependent protein refolding(GO:0070389) |
| 11.1 | 66.7 | GO:0045876 | positive regulation of sister chromatid cohesion(GO:0045876) |
| 11.0 | 44.2 | GO:0019918 | peptidyl-arginine methylation, to symmetrical-dimethyl arginine(GO:0019918) |
| 11.0 | 11.0 | GO:0040031 | snRNA modification(GO:0040031) |
| 10.9 | 54.4 | GO:0070370 | heat acclimation(GO:0010286) cellular heat acclimation(GO:0070370) |
| 10.9 | 43.5 | GO:0043335 | protein unfolding(GO:0043335) |
| 10.8 | 54.2 | GO:0019348 | dolichol metabolic process(GO:0019348) |
| 10.8 | 54.2 | GO:0010606 | positive regulation of cytoplasmic mRNA processing body assembly(GO:0010606) |
| 10.8 | 75.8 | GO:0000056 | ribosomal small subunit export from nucleus(GO:0000056) |
| 10.7 | 32.0 | GO:0046294 | formaldehyde catabolic process(GO:0046294) |
| 10.2 | 30.7 | GO:1902499 | positive regulation of protein autoubiquitination(GO:1902499) |
| 10.2 | 40.8 | GO:0019747 | regulation of isoprenoid metabolic process(GO:0019747) |
| 10.1 | 161.7 | GO:0048026 | positive regulation of mRNA splicing, via spliceosome(GO:0048026) |
| 10.0 | 79.7 | GO:0050859 | negative regulation of B cell receptor signaling pathway(GO:0050859) |
| 9.8 | 68.8 | GO:1901838 | positive regulation of transcription of nuclear large rRNA transcript from RNA polymerase I promoter(GO:1901838) |
| 9.7 | 48.6 | GO:0006999 | nuclear pore organization(GO:0006999) |
| 9.3 | 149.3 | GO:0000338 | protein deneddylation(GO:0000338) |
| 9.3 | 55.6 | GO:1903608 | protein localization to cytoplasmic stress granule(GO:1903608) |
| 9.2 | 73.8 | GO:0043353 | enucleate erythrocyte differentiation(GO:0043353) |
| 9.0 | 582.9 | GO:0006120 | mitochondrial electron transport, NADH to ubiquinone(GO:0006120) |
| 8.9 | 133.1 | GO:0000244 | spliceosomal tri-snRNP complex assembly(GO:0000244) |
| 8.8 | 26.5 | GO:1901503 | ether lipid biosynthetic process(GO:0008611) glycerol ether biosynthetic process(GO:0046504) ether biosynthetic process(GO:1901503) |
| 8.8 | 35.2 | GO:0002192 | IRES-dependent translational initiation(GO:0002192) |
| 8.3 | 16.6 | GO:1902966 | regulation of protein localization to early endosome(GO:1902965) positive regulation of protein localization to early endosome(GO:1902966) |
| 8.0 | 79.6 | GO:0010265 | SCF complex assembly(GO:0010265) |
| 8.0 | 15.9 | GO:0070213 | protein auto-ADP-ribosylation(GO:0070213) |
| 7.8 | 78.0 | GO:0045654 | positive regulation of megakaryocyte differentiation(GO:0045654) |
| 7.8 | 54.5 | GO:0032071 | regulation of endodeoxyribonuclease activity(GO:0032071) |
| 7.8 | 15.5 | GO:0034227 | tRNA thio-modification(GO:0034227) |
| 7.7 | 31.0 | GO:0051754 | meiotic sister chromatid cohesion, centromeric(GO:0051754) |
| 7.7 | 30.7 | GO:0090646 | mitochondrial tRNA processing(GO:0090646) |
| 7.6 | 53.3 | GO:1903265 | positive regulation of tumor necrosis factor-mediated signaling pathway(GO:1903265) |
| 7.6 | 15.2 | GO:0045736 | negative regulation of cyclin-dependent protein serine/threonine kinase activity(GO:0045736) negative regulation of cyclin-dependent protein kinase activity(GO:1904030) |
| 7.6 | 75.6 | GO:0042532 | negative regulation of tyrosine phosphorylation of STAT protein(GO:0042532) |
| 7.6 | 22.7 | GO:0007057 | spindle assembly involved in female meiosis I(GO:0007057) |
| 7.5 | 30.2 | GO:0001845 | phagolysosome assembly(GO:0001845) |
| 7.5 | 60.0 | GO:0045040 | protein import into mitochondrial outer membrane(GO:0045040) |
| 7.4 | 22.3 | GO:0070541 | response to platinum ion(GO:0070541) |
| 7.4 | 37.1 | GO:0035617 | stress granule disassembly(GO:0035617) |
| 7.3 | 58.8 | GO:0070475 | rRNA base methylation(GO:0070475) |
| 7.2 | 50.4 | GO:0070900 | mitochondrial tRNA modification(GO:0070900) mitochondrial RNA modification(GO:1900864) |
| 7.2 | 151.1 | GO:0009263 | deoxyribonucleotide biosynthetic process(GO:0009263) |
| 7.0 | 20.9 | GO:0051685 | maintenance of ER location(GO:0051685) |
| 6.9 | 27.5 | GO:0007538 | primary sex determination(GO:0007538) |
| 6.8 | 41.0 | GO:0033133 | positive regulation of glucokinase activity(GO:0033133) positive regulation of hexokinase activity(GO:1903301) |
| 6.8 | 67.8 | GO:0071550 | death-inducing signaling complex assembly(GO:0071550) |
| 6.7 | 33.5 | GO:1900041 | negative regulation of interleukin-2 secretion(GO:1900041) |
| 6.6 | 91.8 | GO:0060628 | regulation of ER to Golgi vesicle-mediated transport(GO:0060628) |
| 6.5 | 51.7 | GO:0000395 | mRNA 5'-splice site recognition(GO:0000395) |
| 6.4 | 89.8 | GO:0006610 | ribosomal protein import into nucleus(GO:0006610) |
| 6.4 | 19.1 | GO:0010693 | negative regulation of alkaline phosphatase activity(GO:0010693) semaphorin-plexin signaling pathway involved in bone trabecula morphogenesis(GO:1900220) |
| 6.2 | 18.7 | GO:0090234 | regulation of kinetochore assembly(GO:0090234) |
| 6.2 | 80.4 | GO:0034498 | early endosome to Golgi transport(GO:0034498) |
| 6.2 | 37.0 | GO:0031087 | deadenylation-independent decapping of nuclear-transcribed mRNA(GO:0031087) |
| 6.2 | 18.5 | GO:0006627 | protein processing involved in protein targeting to mitochondrion(GO:0006627) |
| 6.1 | 55.1 | GO:0071763 | nuclear membrane organization(GO:0071763) |
| 6.1 | 159.0 | GO:0048024 | regulation of mRNA splicing, via spliceosome(GO:0048024) |
| 6.1 | 30.4 | GO:0016476 | regulation of embryonic cell shape(GO:0016476) |
| 6.0 | 18.0 | GO:0006427 | histidyl-tRNA aminoacylation(GO:0006427) |
| 6.0 | 6.0 | GO:1902954 | regulation of early endosome to recycling endosome transport(GO:1902954) |
| 5.9 | 70.6 | GO:0018206 | peptidyl-methionine modification(GO:0018206) |
| 5.8 | 151.3 | GO:0006337 | nucleosome disassembly(GO:0006337) |
| 5.7 | 137.4 | GO:0045899 | positive regulation of RNA polymerase II transcriptional preinitiation complex assembly(GO:0045899) |
| 5.7 | 22.9 | GO:0051534 | negative regulation of NFAT protein import into nucleus(GO:0051534) |
| 5.7 | 51.4 | GO:2000622 | regulation of nuclear-transcribed mRNA catabolic process, nonsense-mediated decay(GO:2000622) negative regulation of nuclear-transcribed mRNA catabolic process, nonsense-mediated decay(GO:2000623) |
| 5.7 | 34.2 | GO:0006488 | dolichol-linked oligosaccharide biosynthetic process(GO:0006488) |
| 5.6 | 16.9 | GO:0019254 | carnitine metabolic process, CoA-linked(GO:0019254) |
| 5.6 | 67.7 | GO:0045835 | negative regulation of meiotic nuclear division(GO:0045835) |
| 5.6 | 16.7 | GO:0031536 | positive regulation of exit from mitosis(GO:0031536) |
| 5.6 | 88.9 | GO:0034134 | toll-like receptor 2 signaling pathway(GO:0034134) |
| 5.5 | 27.7 | GO:1900063 | regulation of peroxisome organization(GO:1900063) |
| 5.5 | 16.6 | GO:0000354 | cis assembly of pre-catalytic spliceosome(GO:0000354) |
| 5.5 | 93.8 | GO:0046931 | pore complex assembly(GO:0046931) |
| 5.4 | 21.8 | GO:0072369 | regulation of lipid transport by positive regulation of transcription from RNA polymerase II promoter(GO:0072369) |
| 5.4 | 43.5 | GO:0031936 | negative regulation of chromatin silencing(GO:0031936) |
| 5.4 | 21.6 | GO:2001178 | mediator complex assembly(GO:0036034) regulation of mediator complex assembly(GO:2001176) positive regulation of mediator complex assembly(GO:2001178) |
| 5.4 | 21.5 | GO:1904046 | negative regulation of vascular endothelial growth factor production(GO:1904046) |
| 5.3 | 5.3 | GO:0045053 | protein retention in Golgi apparatus(GO:0045053) |
| 5.3 | 154.5 | GO:0000460 | maturation of 5.8S rRNA(GO:0000460) |
| 5.3 | 117.1 | GO:2000637 | positive regulation of posttranscriptional gene silencing(GO:0060148) positive regulation of gene silencing by miRNA(GO:2000637) |
| 5.3 | 5.3 | GO:1901090 | regulation of protein tetramerization(GO:1901090) negative regulation of protein tetramerization(GO:1901091) regulation of protein homotetramerization(GO:1901093) negative regulation of protein homotetramerization(GO:1901094) |
| 5.3 | 36.8 | GO:0070863 | positive regulation of protein exit from endoplasmic reticulum(GO:0070863) |
| 5.2 | 20.7 | GO:0070131 | positive regulation of mitochondrial translation(GO:0070131) |
| 5.0 | 231.3 | GO:0070979 | protein K11-linked ubiquitination(GO:0070979) |
| 5.0 | 40.2 | GO:0006189 | 'de novo' IMP biosynthetic process(GO:0006189) |
| 5.0 | 24.9 | GO:0006620 | posttranslational protein targeting to membrane(GO:0006620) |
| 4.9 | 93.2 | GO:0033689 | negative regulation of osteoblast proliferation(GO:0033689) |
| 4.9 | 29.2 | GO:0051661 | maintenance of centrosome location(GO:0051661) |
| 4.8 | 38.7 | GO:0002759 | regulation of antimicrobial humoral response(GO:0002759) |
| 4.8 | 38.6 | GO:0045292 | mRNA cis splicing, via spliceosome(GO:0045292) |
| 4.8 | 48.3 | GO:0015939 | pantothenate metabolic process(GO:0015939) |
| 4.8 | 14.4 | GO:0035621 | ER to Golgi ceramide transport(GO:0035621) |
| 4.7 | 18.9 | GO:0021691 | cerebellar Purkinje cell layer maturation(GO:0021691) |
| 4.7 | 14.2 | GO:1902396 | protein localization to bicellular tight junction(GO:1902396) |
| 4.7 | 23.3 | GO:0002084 | protein depalmitoylation(GO:0002084) |
| 4.7 | 139.7 | GO:0070534 | protein K63-linked ubiquitination(GO:0070534) |
| 4.6 | 9.2 | GO:2000234 | positive regulation of ribosome biogenesis(GO:0090070) positive regulation of rRNA processing(GO:2000234) |
| 4.5 | 27.1 | GO:0015742 | alpha-ketoglutarate transport(GO:0015742) |
| 4.4 | 128.1 | GO:0006221 | pyrimidine nucleotide biosynthetic process(GO:0006221) |
| 4.4 | 48.5 | GO:0006621 | protein retention in ER lumen(GO:0006621) |
| 4.4 | 17.6 | GO:1903660 | negative regulation of complement-dependent cytotoxicity(GO:1903660) |
| 4.4 | 65.6 | GO:0000027 | ribosomal large subunit assembly(GO:0000027) |
| 4.3 | 73.0 | GO:0000715 | nucleotide-excision repair, DNA damage recognition(GO:0000715) |
| 4.3 | 42.8 | GO:0061179 | negative regulation of insulin secretion involved in cellular response to glucose stimulus(GO:0061179) |
| 4.3 | 123.9 | GO:0043968 | histone H2A acetylation(GO:0043968) |
| 4.2 | 227.6 | GO:0000380 | alternative mRNA splicing, via spliceosome(GO:0000380) |
| 4.2 | 29.3 | GO:1990592 | protein polyufmylation(GO:1990564) protein K69-linked ufmylation(GO:1990592) |
| 4.2 | 138.0 | GO:0051016 | barbed-end actin filament capping(GO:0051016) |
| 4.2 | 12.5 | GO:0002913 | positive regulation of T cell anergy(GO:0002669) positive regulation of lymphocyte anergy(GO:0002913) |
| 4.1 | 32.9 | GO:0090043 | regulation of tubulin deacetylation(GO:0090043) |
| 4.1 | 16.2 | GO:0048496 | maintenance of organ identity(GO:0048496) |
| 4.1 | 32.5 | GO:0009838 | abscission(GO:0009838) |
| 4.0 | 71.8 | GO:0007021 | tubulin complex assembly(GO:0007021) |
| 4.0 | 27.8 | GO:1902746 | regulation of lens fiber cell differentiation(GO:1902746) |
| 4.0 | 63.6 | GO:0042276 | error-prone translesion synthesis(GO:0042276) |
| 4.0 | 115.2 | GO:0006491 | N-glycan processing(GO:0006491) |
| 3.9 | 47.1 | GO:0051151 | negative regulation of smooth muscle cell differentiation(GO:0051151) |
| 3.9 | 27.4 | GO:0007076 | mitotic chromosome condensation(GO:0007076) |
| 3.9 | 11.7 | GO:0043490 | malate-aspartate shuttle(GO:0043490) |
| 3.9 | 3.9 | GO:0090316 | positive regulation of intracellular protein transport(GO:0090316) |
| 3.9 | 31.0 | GO:0045722 | positive regulation of gluconeogenesis(GO:0045722) |
| 3.9 | 100.8 | GO:0009235 | cobalamin metabolic process(GO:0009235) |
| 3.8 | 3.8 | GO:0032707 | negative regulation of interleukin-23 production(GO:0032707) |
| 3.8 | 38.0 | GO:0051383 | kinetochore organization(GO:0051383) |
| 3.8 | 34.0 | GO:0048262 | determination of dorsal/ventral asymmetry(GO:0048262) |
| 3.7 | 15.0 | GO:1902963 | regulation of metalloendopeptidase activity involved in amyloid precursor protein catabolic process(GO:1902962) negative regulation of metalloendopeptidase activity involved in amyloid precursor protein catabolic process(GO:1902963) |
| 3.7 | 33.7 | GO:1901977 | negative regulation of cell cycle checkpoint(GO:1901977) negative regulation of DNA damage checkpoint(GO:2000002) |
| 3.7 | 11.2 | GO:0048250 | mitochondrial iron ion transport(GO:0048250) |
| 3.7 | 265.1 | GO:0006521 | regulation of cellular amino acid metabolic process(GO:0006521) |
| 3.6 | 7.3 | GO:0014878 | response to electrical stimulus involved in regulation of muscle adaptation(GO:0014878) |
| 3.6 | 10.9 | GO:0015680 | intracellular copper ion transport(GO:0015680) |
| 3.6 | 54.3 | GO:0000920 | cell separation after cytokinesis(GO:0000920) |
| 3.6 | 32.5 | GO:0042255 | ribosome assembly(GO:0042255) |
| 3.6 | 10.8 | GO:0002585 | positive regulation of antigen processing and presentation of peptide or polysaccharide antigen via MHC class II(GO:0002582) positive regulation of antigen processing and presentation of peptide antigen(GO:0002585) positive regulation of antigen processing and presentation of peptide antigen via MHC class II(GO:0002588) |
| 3.6 | 46.3 | GO:0060261 | positive regulation of transcription initiation from RNA polymerase II promoter(GO:0060261) |
| 3.5 | 74.1 | GO:0042178 | xenobiotic catabolic process(GO:0042178) |
| 3.5 | 3.5 | GO:0060767 | epithelial cell proliferation involved in prostate gland development(GO:0060767) regulation of epithelial cell proliferation involved in prostate gland development(GO:0060768) |
| 3.5 | 20.8 | GO:0097428 | protein maturation by iron-sulfur cluster transfer(GO:0097428) |
| 3.4 | 10.3 | GO:0006333 | chromatin assembly or disassembly(GO:0006333) |
| 3.4 | 20.7 | GO:1900223 | positive regulation of beta-amyloid clearance(GO:1900223) |
| 3.4 | 30.9 | GO:0044341 | sodium-dependent phosphate transport(GO:0044341) |
| 3.4 | 41.2 | GO:0006782 | protoporphyrinogen IX biosynthetic process(GO:0006782) |
| 3.4 | 87.8 | GO:0030033 | microvillus assembly(GO:0030033) |
| 3.4 | 13.5 | GO:0071233 | cellular response to leucine(GO:0071233) |
| 3.4 | 507.3 | GO:0045047 | protein targeting to ER(GO:0045047) |
| 3.3 | 13.2 | GO:0009048 | dosage compensation by inactivation of X chromosome(GO:0009048) |
| 3.3 | 78.6 | GO:0070536 | protein K63-linked deubiquitination(GO:0070536) |
| 3.3 | 35.8 | GO:0060340 | positive regulation of type I interferon-mediated signaling pathway(GO:0060340) |
| 3.3 | 6.5 | GO:0009298 | GDP-mannose biosynthetic process(GO:0009298) |
| 3.2 | 22.3 | GO:0035507 | regulation of myosin-light-chain-phosphatase activity(GO:0035507) |
| 3.2 | 12.7 | GO:2001206 | positive regulation of osteoclast development(GO:2001206) |
| 3.1 | 75.3 | GO:0031468 | nuclear envelope reassembly(GO:0031468) |
| 3.1 | 40.6 | GO:0034975 | protein folding in endoplasmic reticulum(GO:0034975) |
| 3.0 | 6.1 | GO:0019626 | short-chain fatty acid catabolic process(GO:0019626) |
| 3.0 | 11.8 | GO:0034398 | telomere tethering at nuclear periphery(GO:0034398) meiotic telomere tethering at nuclear periphery(GO:0044821) meiotic attachment of telomere to nuclear envelope(GO:0070197) chromosome attachment to the nuclear envelope(GO:0097240) |
| 2.9 | 26.4 | GO:0031053 | primary miRNA processing(GO:0031053) |
| 2.9 | 174.8 | GO:0031663 | lipopolysaccharide-mediated signaling pathway(GO:0031663) |
| 2.9 | 8.7 | GO:0090283 | regulation of protein glycosylation in Golgi(GO:0090283) |
| 2.8 | 42.3 | GO:0006449 | regulation of translational termination(GO:0006449) |
| 2.8 | 181.2 | GO:0071349 | interleukin-12-mediated signaling pathway(GO:0035722) cellular response to interleukin-12(GO:0071349) |
| 2.8 | 52.9 | GO:0030488 | tRNA methylation(GO:0030488) |
| 2.8 | 11.1 | GO:0075525 | viral translational termination-reinitiation(GO:0075525) |
| 2.7 | 27.2 | GO:1904424 | regulation of GTP binding(GO:1904424) |
| 2.7 | 43.6 | GO:0072321 | chaperone-mediated protein transport(GO:0072321) |
| 2.7 | 10.7 | GO:0022027 | interkinetic nuclear migration(GO:0022027) |
| 2.7 | 21.5 | GO:0071108 | protein K48-linked deubiquitination(GO:0071108) |
| 2.7 | 8.0 | GO:2000173 | negative regulation of dendrite extension(GO:1903860) regulation of neuron remodeling(GO:1904799) negative regulation of neuron remodeling(GO:1904800) negative regulation of branching morphogenesis of a nerve(GO:2000173) |
| 2.7 | 8.0 | GO:0002101 | tRNA wobble cytosine modification(GO:0002101) |
| 2.7 | 42.8 | GO:0016226 | iron-sulfur cluster assembly(GO:0016226) metallo-sulfur cluster assembly(GO:0031163) |
| 2.7 | 21.2 | GO:2000270 | negative regulation of fibroblast apoptotic process(GO:2000270) |
| 2.6 | 39.7 | GO:0000154 | rRNA modification(GO:0000154) |
| 2.6 | 89.1 | GO:0045841 | negative regulation of mitotic metaphase/anaphase transition(GO:0045841) mitotic spindle checkpoint(GO:0071174) negative regulation of metaphase/anaphase transition of cell cycle(GO:1902100) |
| 2.6 | 7.8 | GO:1902902 | negative regulation of autophagosome assembly(GO:1902902) |
| 2.6 | 28.5 | GO:0030150 | protein import into mitochondrial matrix(GO:0030150) |
| 2.6 | 7.8 | GO:0018201 | N-terminal peptidyl-glycine N-myristoylation(GO:0018008) peptidyl-glycine modification(GO:0018201) |
| 2.6 | 23.2 | GO:1990416 | cellular response to brain-derived neurotrophic factor stimulus(GO:1990416) |
| 2.6 | 141.7 | GO:0007157 | heterophilic cell-cell adhesion via plasma membrane cell adhesion molecules(GO:0007157) |
| 2.6 | 12.8 | GO:0006436 | tryptophanyl-tRNA aminoacylation(GO:0006436) |
| 2.5 | 20.3 | GO:0046826 | negative regulation of protein export from nucleus(GO:0046826) |
| 2.5 | 15.1 | GO:0017182 | peptidyl-diphthamide metabolic process(GO:0017182) peptidyl-diphthamide biosynthetic process from peptidyl-histidine(GO:0017183) |
| 2.5 | 32.6 | GO:0010592 | positive regulation of lamellipodium assembly(GO:0010592) |
| 2.4 | 24.1 | GO:0072015 | glomerular visceral epithelial cell development(GO:0072015) |
| 2.4 | 16.8 | GO:0001675 | acrosome assembly(GO:0001675) |
| 2.4 | 18.9 | GO:0061469 | regulation of type B pancreatic cell proliferation(GO:0061469) |
| 2.4 | 11.8 | GO:0046203 | spermidine catabolic process(GO:0046203) |
| 2.3 | 48.7 | GO:0001921 | positive regulation of receptor recycling(GO:0001921) |
| 2.3 | 6.9 | GO:0006970 | response to osmotic stress(GO:0006970) |
| 2.3 | 59.5 | GO:0000387 | spliceosomal snRNP assembly(GO:0000387) |
| 2.3 | 9.1 | GO:0030242 | pexophagy(GO:0030242) |
| 2.3 | 11.4 | GO:0016240 | autophagosome docking(GO:0016240) |
| 2.3 | 15.9 | GO:0060576 | intestinal epithelial cell development(GO:0060576) |
| 2.3 | 13.6 | GO:0051152 | positive regulation of smooth muscle cell differentiation(GO:0051152) |
| 2.2 | 11.2 | GO:0031063 | regulation of histone deacetylation(GO:0031063) |
| 2.2 | 108.8 | GO:0018279 | protein N-linked glycosylation via asparagine(GO:0018279) |
| 2.2 | 454.4 | GO:0000377 | RNA splicing, via transesterification reactions with bulged adenosine as nucleophile(GO:0000377) mRNA splicing, via spliceosome(GO:0000398) |
| 2.1 | 15.0 | GO:0031340 | positive regulation of vesicle fusion(GO:0031340) |
| 2.1 | 6.4 | GO:0065001 | specification of axis polarity(GO:0065001) negative regulation of tooth mineralization(GO:0070171) |
| 2.1 | 258.6 | GO:0008380 | RNA splicing(GO:0008380) |
| 2.1 | 25.5 | GO:1901407 | regulation of phosphorylation of RNA polymerase II C-terminal domain(GO:1901407) |
| 2.1 | 12.6 | GO:0016255 | attachment of GPI anchor to protein(GO:0016255) |
| 2.1 | 12.5 | GO:0035407 | histone H3-T11 phosphorylation(GO:0035407) |
| 2.1 | 56.3 | GO:0006359 | regulation of transcription from RNA polymerase III promoter(GO:0006359) |
| 2.0 | 20.5 | GO:0060124 | positive regulation of growth hormone secretion(GO:0060124) |
| 2.0 | 8.2 | GO:0032417 | positive regulation of sodium:proton antiporter activity(GO:0032417) |
| 2.0 | 18.3 | GO:0042182 | ketone catabolic process(GO:0042182) |
| 2.0 | 8.1 | GO:0032929 | negative regulation of superoxide anion generation(GO:0032929) |
| 2.0 | 20.0 | GO:0006105 | succinate metabolic process(GO:0006105) |
| 2.0 | 21.5 | GO:0033148 | positive regulation of intracellular estrogen receptor signaling pathway(GO:0033148) |
| 2.0 | 11.7 | GO:0016560 | protein import into peroxisome matrix, docking(GO:0016560) |
| 1.9 | 7.8 | GO:0090235 | regulation of metaphase plate congression(GO:0090235) |
| 1.9 | 7.5 | GO:0090245 | axis elongation involved in somitogenesis(GO:0090245) |
| 1.8 | 16.6 | GO:0006682 | galactosylceramide biosynthetic process(GO:0006682) galactolipid biosynthetic process(GO:0019375) |
| 1.8 | 16.6 | GO:0005981 | regulation of glycogen catabolic process(GO:0005981) |
| 1.8 | 5.5 | GO:0070940 | dephosphorylation of RNA polymerase II C-terminal domain(GO:0070940) |
| 1.8 | 51.0 | GO:0070897 | DNA-templated transcriptional preinitiation complex assembly(GO:0070897) |
| 1.8 | 17.8 | GO:0044458 | motile cilium assembly(GO:0044458) |
| 1.8 | 5.3 | GO:0072553 | terminal button organization(GO:0072553) |
| 1.7 | 8.7 | GO:0022615 | protein to membrane docking(GO:0022615) |
| 1.7 | 17.3 | GO:0008635 | activation of cysteine-type endopeptidase activity involved in apoptotic process by cytochrome c(GO:0008635) |
| 1.7 | 13.6 | GO:0001672 | regulation of chromatin assembly or disassembly(GO:0001672) |
| 1.7 | 5.1 | GO:0002184 | cytoplasmic translational termination(GO:0002184) |
| 1.7 | 18.2 | GO:0031935 | regulation of chromatin silencing(GO:0031935) |
| 1.7 | 18.2 | GO:0015886 | heme transport(GO:0015886) |
| 1.7 | 5.0 | GO:0001544 | initiation of primordial ovarian follicle growth(GO:0001544) |
| 1.6 | 44.5 | GO:0090140 | regulation of mitochondrial fission(GO:0090140) |
| 1.6 | 27.5 | GO:0032981 | NADH dehydrogenase complex assembly(GO:0010257) mitochondrial respiratory chain complex I assembly(GO:0032981) mitochondrial respiratory chain complex I biogenesis(GO:0097031) |
| 1.6 | 12.9 | GO:0071421 | manganese ion transmembrane transport(GO:0071421) |
| 1.6 | 46.6 | GO:0006378 | mRNA polyadenylation(GO:0006378) |
| 1.6 | 110.3 | GO:0045454 | cell redox homeostasis(GO:0045454) |
| 1.6 | 7.9 | GO:0070987 | error-free translesion synthesis(GO:0070987) |
| 1.6 | 37.8 | GO:0000060 | protein import into nucleus, translocation(GO:0000060) |
| 1.6 | 22.0 | GO:0043153 | entrainment of circadian clock by photoperiod(GO:0043153) |
| 1.6 | 57.9 | GO:0071549 | cellular response to dexamethasone stimulus(GO:0071549) |
| 1.6 | 6.2 | GO:0070459 | prolactin secretion(GO:0070459) |
| 1.5 | 26.3 | GO:0006995 | cellular response to nitrogen starvation(GO:0006995) cellular response to nitrogen levels(GO:0043562) |
| 1.5 | 21.6 | GO:0031958 | corticosteroid receptor signaling pathway(GO:0031958) glucocorticoid receptor signaling pathway(GO:0042921) |
| 1.5 | 29.0 | GO:0006367 | transcription initiation from RNA polymerase II promoter(GO:0006367) |
| 1.5 | 7.6 | GO:0072583 | clathrin-mediated endocytosis(GO:0072583) |
| 1.5 | 42.5 | GO:0030262 | apoptotic nuclear changes(GO:0030262) |
| 1.5 | 15.1 | GO:0097500 | receptor localization to nonmotile primary cilium(GO:0097500) |
| 1.5 | 130.7 | GO:0048199 | vesicle targeting, to, from or within Golgi(GO:0048199) |
| 1.5 | 3.0 | GO:2000645 | negative regulation of receptor catabolic process(GO:2000645) |
| 1.5 | 212.5 | GO:0000910 | cytokinesis(GO:0000910) |
| 1.4 | 14.5 | GO:0051451 | myoblast migration(GO:0051451) |
| 1.4 | 52.2 | GO:1990090 | cellular response to nerve growth factor stimulus(GO:1990090) |
| 1.4 | 61.8 | GO:0043488 | regulation of mRNA stability(GO:0043488) |
| 1.4 | 50.8 | GO:0090382 | phagosome maturation(GO:0090382) |
| 1.4 | 15.5 | GO:0045008 | depyrimidination(GO:0045008) |
| 1.4 | 4.2 | GO:0034497 | protein localization to pre-autophagosomal structure(GO:0034497) |
| 1.4 | 18.0 | GO:0044804 | nucleophagy(GO:0044804) |
| 1.4 | 16.4 | GO:0000462 | maturation of SSU-rRNA from tricistronic rRNA transcript (SSU-rRNA, 5.8S rRNA, LSU-rRNA)(GO:0000462) |
| 1.4 | 2.7 | GO:0009794 | regulation of mitotic cell cycle, embryonic(GO:0009794) mitotic cell cycle, embryonic(GO:0045448) |
| 1.3 | 2.6 | GO:0060789 | hair follicle placode formation(GO:0060789) |
| 1.3 | 8.9 | GO:0006264 | mitochondrial DNA replication(GO:0006264) |
| 1.2 | 2.5 | GO:0051461 | positive regulation of corticotropin secretion(GO:0051461) |
| 1.2 | 8.7 | GO:0034244 | negative regulation of transcription elongation from RNA polymerase II promoter(GO:0034244) |
| 1.2 | 22.4 | GO:0006817 | phosphate ion transport(GO:0006817) |
| 1.2 | 10.4 | GO:0042659 | regulation of cell fate specification(GO:0042659) |
| 1.1 | 25.8 | GO:0032008 | positive regulation of TOR signaling(GO:0032008) |
| 1.1 | 5.6 | GO:0014886 | transition between slow and fast fiber(GO:0014886) |
| 1.1 | 21.1 | GO:0098779 | mitophagy in response to mitochondrial depolarization(GO:0098779) |
| 1.1 | 8.9 | GO:0061101 | neuroendocrine cell differentiation(GO:0061101) |
| 1.1 | 3.2 | GO:0060316 | positive regulation of ryanodine-sensitive calcium-release channel activity(GO:0060316) |
| 1.1 | 6.4 | GO:1901164 | negative regulation of trophoblast cell migration(GO:1901164) |
| 1.1 | 20.1 | GO:0006261 | DNA-dependent DNA replication(GO:0006261) |
| 1.1 | 59.9 | GO:0006413 | translational initiation(GO:0006413) |
| 1.0 | 37.4 | GO:0014003 | oligodendrocyte development(GO:0014003) |
| 1.0 | 15.5 | GO:0050858 | negative regulation of antigen receptor-mediated signaling pathway(GO:0050858) negative regulation of T cell receptor signaling pathway(GO:0050860) |
| 1.0 | 2.1 | GO:1903371 | regulation of endoplasmic reticulum tubular network organization(GO:1903371) |
| 1.0 | 44.3 | GO:1900740 | regulation of protein insertion into mitochondrial membrane involved in apoptotic signaling pathway(GO:1900739) positive regulation of protein insertion into mitochondrial membrane involved in apoptotic signaling pathway(GO:1900740) |
| 1.0 | 6.1 | GO:0016584 | nucleosome positioning(GO:0016584) |
| 1.0 | 21.2 | GO:1901998 | toxin transport(GO:1901998) |
| 1.0 | 79.5 | GO:0070527 | platelet aggregation(GO:0070527) |
| 1.0 | 6.0 | GO:0034243 | regulation of transcription elongation from RNA polymerase II promoter(GO:0034243) |
| 1.0 | 6.9 | GO:1903760 | regulation of voltage-gated potassium channel activity involved in ventricular cardiac muscle cell action potential repolarization(GO:1903760) |
| 1.0 | 3.9 | GO:0016127 | cholesterol catabolic process(GO:0006707) sterol catabolic process(GO:0016127) |
| 1.0 | 11.7 | GO:0032780 | negative regulation of ATPase activity(GO:0032780) |
| 1.0 | 14.5 | GO:0001881 | receptor recycling(GO:0001881) |
| 1.0 | 3.8 | GO:0060071 | Wnt signaling pathway, planar cell polarity pathway(GO:0060071) regulation of establishment of planar polarity(GO:0090175) |
| 1.0 | 10.5 | GO:0045116 | protein neddylation(GO:0045116) |
| 1.0 | 10.5 | GO:0045618 | positive regulation of keratinocyte differentiation(GO:0045618) |
| 0.9 | 36.8 | GO:0006699 | bile acid biosynthetic process(GO:0006699) |
| 0.9 | 2.8 | GO:0048213 | Golgi vesicle prefusion complex stabilization(GO:0048213) |
| 0.9 | 2.8 | GO:0072221 | distal convoluted tubule development(GO:0072025) metanephric distal convoluted tubule development(GO:0072221) |
| 0.9 | 11.1 | GO:0043247 | telomere maintenance in response to DNA damage(GO:0043247) |
| 0.9 | 38.4 | GO:0006891 | intra-Golgi vesicle-mediated transport(GO:0006891) |
| 0.9 | 9.1 | GO:0034453 | microtubule anchoring(GO:0034453) |
| 0.9 | 10.7 | GO:0033539 | fatty acid beta-oxidation using acyl-CoA dehydrogenase(GO:0033539) |
| 0.9 | 10.5 | GO:0071481 | cellular response to X-ray(GO:0071481) |
| 0.9 | 3.5 | GO:0030901 | midbrain development(GO:0030901) |
| 0.9 | 32.7 | GO:0000413 | protein peptidyl-prolyl isomerization(GO:0000413) |
| 0.9 | 12.9 | GO:0042769 | DNA damage response, detection of DNA damage(GO:0042769) |
| 0.8 | 3.3 | GO:0071352 | interleukin-2-mediated signaling pathway(GO:0038110) cellular response to interleukin-2(GO:0071352) |
| 0.8 | 13.8 | GO:0032012 | regulation of ARF protein signal transduction(GO:0032012) |
| 0.8 | 4.8 | GO:0072711 | cellular response to hydroxyurea(GO:0072711) |
| 0.8 | 1.6 | GO:0010936 | negative regulation of macrophage cytokine production(GO:0010936) |
| 0.8 | 12.7 | GO:0002643 | regulation of tolerance induction(GO:0002643) |
| 0.8 | 42.9 | GO:0006635 | fatty acid beta-oxidation(GO:0006635) |
| 0.8 | 15.0 | GO:0007020 | microtubule nucleation(GO:0007020) |
| 0.8 | 13.4 | GO:0070911 | global genome nucleotide-excision repair(GO:0070911) |
| 0.8 | 7.1 | GO:0007097 | nuclear migration(GO:0007097) |
| 0.8 | 12.5 | GO:0009650 | UV protection(GO:0009650) |
| 0.8 | 8.4 | GO:0071340 | skeletal muscle acetylcholine-gated channel clustering(GO:0071340) |
| 0.8 | 46.9 | GO:0045071 | negative regulation of viral genome replication(GO:0045071) |
| 0.8 | 22.6 | GO:0071526 | semaphorin-plexin signaling pathway(GO:0071526) |
| 0.7 | 3.0 | GO:0007185 | transmembrane receptor protein tyrosine phosphatase signaling pathway(GO:0007185) |
| 0.7 | 5.2 | GO:0043161 | proteasome-mediated ubiquitin-dependent protein catabolic process(GO:0043161) |
| 0.7 | 8.8 | GO:0072332 | intrinsic apoptotic signaling pathway by p53 class mediator(GO:0072332) |
| 0.7 | 2.8 | GO:0070584 | mitochondrion morphogenesis(GO:0070584) |
| 0.7 | 33.9 | GO:0046579 | positive regulation of Ras protein signal transduction(GO:0046579) |
| 0.7 | 2.8 | GO:0070874 | negative regulation of glycogen biosynthetic process(GO:0045719) glucagon secretion(GO:0070091) regulation of glucagon secretion(GO:0070092) negative regulation of glycogen metabolic process(GO:0070874) |
| 0.7 | 13.2 | GO:0036120 | cellular response to platelet-derived growth factor stimulus(GO:0036120) |
| 0.7 | 10.2 | GO:0006851 | mitochondrial calcium ion transport(GO:0006851) |
| 0.7 | 22.3 | GO:0032508 | DNA duplex unwinding(GO:0032508) |
| 0.7 | 21.4 | GO:0017145 | stem cell division(GO:0017145) |
| 0.7 | 33.4 | GO:0050766 | positive regulation of phagocytosis(GO:0050766) |
| 0.6 | 13.6 | GO:0071542 | dopaminergic neuron differentiation(GO:0071542) |
| 0.6 | 14.0 | GO:0046856 | phosphatidylinositol dephosphorylation(GO:0046856) |
| 0.6 | 92.7 | GO:0006457 | protein folding(GO:0006457) |
| 0.6 | 6.7 | GO:0030970 | retrograde protein transport, ER to cytosol(GO:0030970) |
| 0.6 | 7.3 | GO:0009303 | rRNA transcription(GO:0009303) |
| 0.6 | 12.6 | GO:0046475 | glycerophospholipid catabolic process(GO:0046475) |
| 0.6 | 10.6 | GO:0006903 | vesicle targeting(GO:0006903) |
| 0.6 | 12.3 | GO:0046339 | diacylglycerol metabolic process(GO:0046339) |
| 0.6 | 90.6 | GO:0008360 | regulation of cell shape(GO:0008360) |
| 0.6 | 5.2 | GO:0035860 | glial cell-derived neurotrophic factor receptor signaling pathway(GO:0035860) |
| 0.6 | 8.6 | GO:2000147 | positive regulation of cell migration(GO:0030335) positive regulation of locomotion(GO:0040017) positive regulation of cellular component movement(GO:0051272) positive regulation of cell motility(GO:2000147) |
| 0.5 | 10.0 | GO:0006012 | galactose metabolic process(GO:0006012) |
| 0.5 | 5.2 | GO:0007080 | mitotic metaphase plate congression(GO:0007080) |
| 0.5 | 38.0 | GO:0045727 | positive regulation of translation(GO:0045727) |
| 0.5 | 6.7 | GO:0048268 | clathrin coat assembly(GO:0048268) |
| 0.5 | 29.5 | GO:2001243 | negative regulation of intrinsic apoptotic signaling pathway(GO:2001243) |
| 0.5 | 5.6 | GO:0007265 | Ras protein signal transduction(GO:0007265) |
| 0.5 | 2.0 | GO:0032096 | negative regulation of response to food(GO:0032096) negative regulation of appetite(GO:0032099) |
| 0.5 | 14.0 | GO:1904837 | beta-catenin-TCF complex assembly(GO:1904837) |
| 0.5 | 20.1 | GO:0006611 | protein export from nucleus(GO:0006611) |
| 0.5 | 0.5 | GO:0061035 | regulation of cartilage development(GO:0061035) |
| 0.5 | 15.7 | GO:0051603 | proteolysis involved in cellular protein catabolic process(GO:0051603) |
| 0.5 | 12.5 | GO:2000272 | negative regulation of receptor activity(GO:2000272) |
| 0.5 | 12.3 | GO:0016339 | calcium-dependent cell-cell adhesion via plasma membrane cell adhesion molecules(GO:0016339) |
| 0.5 | 1.4 | GO:2000672 | cellular response to sorbitol(GO:0072709) negative regulation of motor neuron apoptotic process(GO:2000672) |
| 0.4 | 3.1 | GO:0016973 | poly(A)+ mRNA export from nucleus(GO:0016973) |
| 0.4 | 40.3 | GO:0045471 | response to ethanol(GO:0045471) |
| 0.4 | 13.3 | GO:0006893 | Golgi to plasma membrane transport(GO:0006893) |
| 0.4 | 11.0 | GO:0030514 | negative regulation of BMP signaling pathway(GO:0030514) |
| 0.4 | 5.8 | GO:0021697 | cell differentiation in hindbrain(GO:0021533) cerebellar Purkinje cell layer formation(GO:0021694) cerebellar cortex formation(GO:0021697) cerebellar Purkinje cell differentiation(GO:0021702) |
| 0.4 | 2.0 | GO:0051090 | regulation of sequence-specific DNA binding transcription factor activity(GO:0051090) |
| 0.4 | 7.1 | GO:0006487 | protein N-linked glycosylation(GO:0006487) |
| 0.4 | 5.9 | GO:0099514 | anterograde synaptic vesicle transport(GO:0048490) synaptic vesicle cytoskeletal transport(GO:0099514) synaptic vesicle transport along microtubule(GO:0099517) |
| 0.4 | 24.5 | GO:0001909 | leukocyte mediated cytotoxicity(GO:0001909) |
| 0.3 | 25.4 | GO:0019886 | antigen processing and presentation of exogenous peptide antigen via MHC class II(GO:0019886) |
| 0.3 | 8.3 | GO:0070207 | protein homotrimerization(GO:0070207) |
| 0.3 | 12.5 | GO:0010595 | positive regulation of endothelial cell migration(GO:0010595) |
| 0.3 | 7.4 | GO:0006582 | melanin metabolic process(GO:0006582) melanin biosynthetic process(GO:0042438) |
| 0.3 | 16.4 | GO:0006968 | cellular defense response(GO:0006968) |
| 0.2 | 0.7 | GO:1904016 | response to Thyroglobulin triiodothyronine(GO:1904016) |
| 0.2 | 7.0 | GO:0007566 | embryo implantation(GO:0007566) |
| 0.2 | 4.4 | GO:0002076 | osteoblast development(GO:0002076) |
| 0.2 | 8.5 | GO:0006397 | mRNA processing(GO:0006397) |
| 0.2 | 2.7 | GO:0006622 | protein targeting to lysosome(GO:0006622) |
| 0.2 | 1.1 | GO:1900017 | positive regulation of cytokine production involved in inflammatory response(GO:1900017) |
| 0.2 | 10.5 | GO:0006910 | phagocytosis, recognition(GO:0006910) |
| 0.2 | 0.9 | GO:0071545 | diadenosine polyphosphate catabolic process(GO:0015961) diphosphoinositol polyphosphate metabolic process(GO:0071543) inositol phosphate catabolic process(GO:0071545) diadenosine pentaphosphate metabolic process(GO:1901906) diadenosine pentaphosphate catabolic process(GO:1901907) diadenosine hexaphosphate metabolic process(GO:1901908) diadenosine hexaphosphate catabolic process(GO:1901909) adenosine 5'-(hexahydrogen pentaphosphate) metabolic process(GO:1901910) adenosine 5'-(hexahydrogen pentaphosphate) catabolic process(GO:1901911) |
| 0.2 | 4.8 | GO:0030206 | chondroitin sulfate biosynthetic process(GO:0030206) |
| 0.2 | 12.6 | GO:0048675 | axon extension(GO:0048675) |
| 0.2 | 2.2 | GO:0060445 | branching involved in salivary gland morphogenesis(GO:0060445) |
| 0.2 | 1.9 | GO:0061014 | positive regulation of mRNA catabolic process(GO:0061014) |
| 0.2 | 3.9 | GO:0032922 | circadian regulation of gene expression(GO:0032922) |
| 0.2 | 0.5 | GO:0072205 | metanephric collecting duct development(GO:0072205) |
| 0.2 | 4.8 | GO:0035987 | endodermal cell differentiation(GO:0035987) |
| 0.1 | 0.9 | GO:0070544 | histone H3-K36 demethylation(GO:0070544) |
| 0.1 | 0.7 | GO:0044728 | DNA methylation or demethylation(GO:0044728) |
| 0.1 | 1.2 | GO:0045070 | positive regulation of viral genome replication(GO:0045070) |
| 0.1 | 4.4 | GO:0071377 | cellular response to glucagon stimulus(GO:0071377) |
| 0.1 | 1.0 | GO:0043966 | histone H3 acetylation(GO:0043966) |
| 0.1 | 13.7 | GO:0060348 | bone development(GO:0060348) |
| 0.1 | 1.2 | GO:0016578 | histone deubiquitination(GO:0016578) |
| 0.1 | 1.5 | GO:0002576 | platelet degranulation(GO:0002576) |
| 0.1 | 0.6 | GO:0034314 | Arp2/3 complex-mediated actin nucleation(GO:0034314) |
| 0.1 | 1.3 | GO:0035601 | protein deacylation(GO:0035601) |
| 0.1 | 3.6 | GO:0038128 | ERBB2 signaling pathway(GO:0038128) |
| 0.1 | 0.6 | GO:0042481 | regulation of odontogenesis(GO:0042481) |
| 0.1 | 1.7 | GO:0030397 | membrane disassembly(GO:0030397) nuclear envelope disassembly(GO:0051081) |
| 0.1 | 1.0 | GO:0045668 | negative regulation of osteoblast differentiation(GO:0045668) |
| 0.1 | 0.6 | GO:0015825 | L-serine transport(GO:0015825) |
| 0.0 | 0.2 | GO:0060356 | leucine import(GO:0060356) |
| 0.0 | 1.0 | GO:0070228 | regulation of lymphocyte apoptotic process(GO:0070228) |
| 0.0 | 1.4 | GO:0030521 | androgen receptor signaling pathway(GO:0030521) |
| 0.0 | 4.1 | GO:0042113 | B cell activation(GO:0042113) |
| 0.0 | 0.7 | GO:0090398 | cellular senescence(GO:0090398) |
| 0.0 | 0.5 | GO:0007229 | integrin-mediated signaling pathway(GO:0007229) |
| 0.0 | 2.4 | GO:0070374 | positive regulation of ERK1 and ERK2 cascade(GO:0070374) |
| 0.0 | 0.1 | GO:1902659 | regulation of glucose mediated signaling pathway(GO:1902659) |
| 0.0 | 1.0 | GO:0001649 | osteoblast differentiation(GO:0001649) |
| 0.0 | 0.4 | GO:0022900 | electron transport chain(GO:0022900) |
Gene overrepresentation in cellular_component category:
| Log-likelihood per target | Total log-likelihood | Term | Description |
|---|---|---|---|
| 37.8 | 302.1 | GO:0042382 | paraspeckles(GO:0042382) |
| 32.0 | 128.1 | GO:0005971 | ribonucleoside-diphosphate reductase complex(GO:0005971) |
| 30.4 | 30.4 | GO:0031372 | UBC13-MMS2 complex(GO:0031372) |
| 26.9 | 188.1 | GO:0016589 | NURF complex(GO:0016589) |
| 25.4 | 177.8 | GO:0046581 | intercellular canaliculus(GO:0046581) |
| 22.9 | 68.8 | GO:0034455 | t-UTP complex(GO:0034455) |
| 22.5 | 112.3 | GO:0030678 | mitochondrial ribonuclease P complex(GO:0030678) |
| 21.8 | 87.1 | GO:0002189 | ribose phosphate diphosphokinase complex(GO:0002189) |
| 21.7 | 151.9 | GO:0016272 | prefoldin complex(GO:0016272) |
| 21.5 | 86.2 | GO:0045257 | mitochondrial respiratory chain complex II, succinate dehydrogenase complex (ubiquinone)(GO:0005749) succinate dehydrogenase complex (ubiquinone)(GO:0045257) respiratory chain complex II(GO:0045273) succinate dehydrogenase complex(GO:0045281) fumarate reductase complex(GO:0045283) |
| 20.0 | 541.3 | GO:0000314 | organellar small ribosomal subunit(GO:0000314) mitochondrial small ribosomal subunit(GO:0005763) |
| 19.5 | 214.3 | GO:0045275 | mitochondrial respiratory chain complex III(GO:0005750) respiratory chain complex III(GO:0045275) |
| 19.2 | 57.5 | GO:0032302 | MutSbeta complex(GO:0032302) |
| 19.1 | 76.5 | GO:0071001 | U4/U6 snRNP(GO:0071001) |
| 18.1 | 181.0 | GO:0000796 | condensin complex(GO:0000796) |
| 17.8 | 88.9 | GO:0045323 | interleukin-1 receptor complex(GO:0045323) |
| 16.7 | 117.0 | GO:0098575 | lumenal side of lysosomal membrane(GO:0098575) |
| 15.7 | 283.1 | GO:0000276 | mitochondrial proton-transporting ATP synthase complex, coupling factor F(o)(GO:0000276) |
| 15.7 | 78.6 | GO:0044530 | supraspliceosomal complex(GO:0044530) |
| 15.7 | 156.9 | GO:0070937 | CRD-mediated mRNA stability complex(GO:0070937) |
| 15.5 | 62.2 | GO:0000798 | nuclear cohesin complex(GO:0000798) |
| 15.2 | 242.8 | GO:0019774 | proteasome core complex, beta-subunit complex(GO:0019774) |
| 14.6 | 43.7 | GO:0005850 | eukaryotic translation initiation factor 2 complex(GO:0005850) |
| 14.5 | 43.6 | GO:0045293 | MIS complex(GO:0036396) mRNA editing complex(GO:0045293) |
| 14.2 | 99.5 | GO:0005854 | nascent polypeptide-associated complex(GO:0005854) |
| 14.1 | 42.4 | GO:0030289 | protein phosphatase 4 complex(GO:0030289) |
| 14.0 | 41.9 | GO:0070762 | nuclear pore transmembrane ring(GO:0070762) |
| 13.8 | 55.4 | GO:0017059 | serine C-palmitoyltransferase complex(GO:0017059) endoplasmic reticulum palmitoyltransferase complex(GO:0031211) |
| 13.4 | 134.5 | GO:0008541 | proteasome regulatory particle, lid subcomplex(GO:0008541) |
| 13.0 | 38.9 | GO:0070557 | PCNA-p21 complex(GO:0070557) |
| 12.6 | 189.1 | GO:0005689 | U12-type spliceosomal complex(GO:0005689) |
| 12.6 | 126.0 | GO:0045254 | pyruvate dehydrogenase complex(GO:0045254) |
| 12.5 | 62.6 | GO:0035061 | interchromatin granule(GO:0035061) |
| 12.4 | 62.1 | GO:0035370 | UBC13-UEV1A complex(GO:0035370) |
| 12.2 | 134.5 | GO:0000176 | nuclear exosome (RNase complex)(GO:0000176) |
| 12.2 | 36.6 | GO:1990246 | uniplex complex(GO:1990246) |
| 11.9 | 35.8 | GO:0005873 | plus-end kinesin complex(GO:0005873) |
| 11.7 | 93.3 | GO:0070552 | BRISC complex(GO:0070552) |
| 11.7 | 116.6 | GO:0072357 | PTW/PP1 phosphatase complex(GO:0072357) |
| 11.4 | 34.2 | GO:0071159 | NF-kappaB complex(GO:0071159) |
| 11.3 | 170.2 | GO:0000346 | transcription export complex(GO:0000346) |
| 11.3 | 124.3 | GO:0031595 | nuclear proteasome complex(GO:0031595) |
| 11.2 | 235.8 | GO:0017101 | aminoacyl-tRNA synthetase multienzyme complex(GO:0017101) |
| 11.2 | 55.8 | GO:0034457 | Mpp10 complex(GO:0034457) |
| 10.9 | 32.6 | GO:0036194 | muscle cell projection(GO:0036194) muscle cell projection membrane(GO:0036195) |
| 10.8 | 270.0 | GO:0005852 | eukaryotic translation initiation factor 3 complex(GO:0005852) |
| 10.7 | 193.3 | GO:0034709 | methylosome(GO:0034709) |
| 10.6 | 74.4 | GO:0061700 | GATOR2 complex(GO:0061700) |
| 10.5 | 52.3 | GO:0002193 | MAML1-RBP-Jkappa- ICN1 complex(GO:0002193) |
| 10.4 | 72.6 | GO:1990452 | Parkin-FBXW7-Cul1 ubiquitin ligase complex(GO:1990452) |
| 10.0 | 129.9 | GO:0002199 | zona pellucida receptor complex(GO:0002199) |
| 9.8 | 39.0 | GO:1990730 | VCP-NSFL1C complex(GO:1990730) |
| 9.7 | 58.0 | GO:0030905 | retromer, tubulation complex(GO:0030905) |
| 9.6 | 48.0 | GO:0070470 | plasma membrane respiratory chain complex I(GO:0045272) plasma membrane respiratory chain(GO:0070470) |
| 9.3 | 74.3 | GO:0005786 | signal recognition particle, endoplasmic reticulum targeting(GO:0005786) |
| 9.2 | 138.0 | GO:0008290 | F-actin capping protein complex(GO:0008290) |
| 9.1 | 91.2 | GO:0000778 | condensed nuclear chromosome kinetochore(GO:0000778) |
| 9.0 | 27.1 | GO:0005826 | actomyosin contractile ring(GO:0005826) GID complex(GO:0034657) |
| 8.9 | 35.4 | GO:0044611 | nuclear pore inner ring(GO:0044611) |
| 8.8 | 123.1 | GO:0097227 | sperm annulus(GO:0097227) |
| 8.5 | 521.5 | GO:0045271 | mitochondrial respiratory chain complex I(GO:0005747) NADH dehydrogenase complex(GO:0030964) respiratory chain complex I(GO:0045271) |
| 8.5 | 67.7 | GO:0031465 | Cul4B-RING E3 ubiquitin ligase complex(GO:0031465) |
| 8.2 | 40.8 | GO:0000444 | MIS12/MIND type complex(GO:0000444) |
| 8.0 | 192.4 | GO:0035098 | ESC/E(Z) complex(GO:0035098) |
| 8.0 | 55.7 | GO:0005956 | protein kinase CK2 complex(GO:0005956) |
| 7.9 | 165.5 | GO:0000812 | Swr1 complex(GO:0000812) |
| 7.4 | 44.3 | GO:0072588 | box H/ACA snoRNP complex(GO:0031429) box H/ACA RNP complex(GO:0072588) box H/ACA scaRNP complex(GO:0072589) box H/ACA telomerase RNP complex(GO:0090661) |
| 7.1 | 50.0 | GO:0005787 | signal peptidase complex(GO:0005787) |
| 6.8 | 20.3 | GO:0044614 | nuclear pore cytoplasmic filaments(GO:0044614) |
| 6.6 | 79.2 | GO:0008250 | oligosaccharyltransferase complex(GO:0008250) |
| 6.5 | 91.6 | GO:0042405 | nuclear inclusion body(GO:0042405) |
| 6.5 | 267.3 | GO:0005761 | organellar ribosome(GO:0000313) mitochondrial ribosome(GO:0005761) |
| 6.4 | 45.0 | GO:0031415 | NatA complex(GO:0031415) |
| 6.3 | 25.1 | GO:0005797 | Golgi medial cisterna(GO:0005797) |
| 6.2 | 67.8 | GO:0097550 | transcriptional preinitiation complex(GO:0097550) |
| 6.1 | 61.4 | GO:0090543 | Flemming body(GO:0090543) |
| 6.1 | 152.4 | GO:0035145 | exon-exon junction complex(GO:0035145) |
| 6.0 | 102.8 | GO:0005885 | Arp2/3 protein complex(GO:0005885) |
| 6.0 | 6.0 | GO:0071203 | WASH complex(GO:0071203) |
| 5.9 | 17.8 | GO:0044393 | microspike(GO:0044393) |
| 5.9 | 23.5 | GO:0005965 | protein farnesyltransferase complex(GO:0005965) |
| 5.8 | 23.1 | GO:0089701 | U2AF(GO:0089701) |
| 5.6 | 128.3 | GO:0071141 | SMAD protein complex(GO:0071141) |
| 5.4 | 16.2 | GO:1903349 | omegasome membrane(GO:1903349) |
| 5.4 | 16.1 | GO:0070939 | Dsl1p complex(GO:0070939) |
| 5.3 | 37.4 | GO:0005851 | eukaryotic translation initiation factor 2B complex(GO:0005851) |
| 5.2 | 10.5 | GO:0000836 | Hrd1p ubiquitin ligase complex(GO:0000836) |
| 5.2 | 67.7 | GO:0097433 | dense body(GO:0097433) |
| 5.2 | 20.7 | GO:0048237 | rough endoplasmic reticulum lumen(GO:0048237) |
| 5.1 | 56.4 | GO:0098799 | outer mitochondrial membrane protein complex(GO:0098799) |
| 5.1 | 56.4 | GO:0036513 | Derlin-1 retrotranslocation complex(GO:0036513) |
| 5.1 | 40.5 | GO:0097208 | alveolar lamellar body(GO:0097208) |
| 5.0 | 50.5 | GO:0016593 | Cdc73/Paf1 complex(GO:0016593) |
| 4.9 | 64.3 | GO:0042555 | MCM complex(GO:0042555) |
| 4.8 | 14.3 | GO:0071595 | Nem1-Spo7 phosphatase complex(GO:0071595) |
| 4.7 | 28.2 | GO:0005784 | Sec61 translocon complex(GO:0005784) translocon complex(GO:0071256) |
| 4.7 | 75.0 | GO:0000178 | exosome (RNase complex)(GO:0000178) |
| 4.6 | 64.2 | GO:0005753 | mitochondrial proton-transporting ATP synthase complex(GO:0005753) |
| 4.5 | 17.9 | GO:0034751 | aryl hydrocarbon receptor complex(GO:0034751) |
| 4.4 | 13.2 | GO:0001740 | Barr body(GO:0001740) |
| 4.3 | 12.8 | GO:0097134 | cyclin E1-CDK2 complex(GO:0097134) |
| 4.3 | 55.5 | GO:0008385 | IkappaB kinase complex(GO:0008385) |
| 4.3 | 93.7 | GO:0016281 | eukaryotic translation initiation factor 4F complex(GO:0016281) |
| 4.2 | 21.2 | GO:0031371 | ubiquitin conjugating enzyme complex(GO:0031371) |
| 4.2 | 12.6 | GO:0042765 | GPI-anchor transamidase complex(GO:0042765) |
| 4.1 | 32.6 | GO:0042719 | mitochondrial intermembrane space protein transporter complex(GO:0042719) |
| 4.1 | 12.2 | GO:0072487 | MSL complex(GO:0072487) |
| 4.1 | 20.3 | GO:0030532 | small nuclear ribonucleoprotein complex(GO:0030532) |
| 4.0 | 68.2 | GO:0031616 | spindle pole centrosome(GO:0031616) |
| 4.0 | 40.0 | GO:0005732 | small nucleolar ribonucleoprotein complex(GO:0005732) |
| 4.0 | 431.0 | GO:0015934 | large ribosomal subunit(GO:0015934) |
| 3.9 | 89.0 | GO:0005746 | mitochondrial respiratory chain(GO:0005746) |
| 3.8 | 60.7 | GO:0031011 | Ino80 complex(GO:0031011) DNA helicase complex(GO:0033202) |
| 3.8 | 22.6 | GO:0005798 | Golgi-associated vesicle(GO:0005798) |
| 3.7 | 52.5 | GO:0017119 | Golgi transport complex(GO:0017119) |
| 3.7 | 242.6 | GO:0005637 | nuclear inner membrane(GO:0005637) |
| 3.6 | 14.2 | GO:0030686 | 90S preribosome(GO:0030686) |
| 3.5 | 108.6 | GO:0030687 | preribosome, large subunit precursor(GO:0030687) |
| 3.5 | 17.4 | GO:0034750 | Scrib-APC-beta-catenin complex(GO:0034750) |
| 3.5 | 27.8 | GO:0031464 | Cul4A-RING E3 ubiquitin ligase complex(GO:0031464) |
| 3.4 | 17.2 | GO:0034098 | VCP-NPL4-UFD1 AAA ATPase complex(GO:0034098) |
| 3.4 | 34.4 | GO:0030015 | CCR4-NOT core complex(GO:0030015) |
| 3.4 | 91.8 | GO:0032040 | small-subunit processome(GO:0032040) |
| 3.3 | 157.1 | GO:0042645 | nucleoid(GO:0009295) mitochondrial nucleoid(GO:0042645) |
| 3.3 | 20.0 | GO:0032039 | integrator complex(GO:0032039) |
| 3.3 | 39.8 | GO:0005686 | U2 snRNP(GO:0005686) |
| 3.3 | 56.1 | GO:0010369 | chromocenter(GO:0010369) |
| 3.2 | 38.8 | GO:0030008 | TRAPP complex(GO:0030008) |
| 3.2 | 76.8 | GO:0030137 | COPI-coated vesicle(GO:0030137) |
| 3.2 | 171.5 | GO:0000502 | proteasome complex(GO:0000502) |
| 3.2 | 19.1 | GO:0051286 | cell tip(GO:0051286) |
| 3.1 | 28.3 | GO:0019907 | cyclin-dependent protein kinase activating kinase holoenzyme complex(GO:0019907) |
| 3.0 | 24.4 | GO:0072546 | ER membrane protein complex(GO:0072546) |
| 3.0 | 304.6 | GO:0005840 | ribosome(GO:0005840) |
| 3.0 | 24.1 | GO:0036056 | filtration diaphragm(GO:0036056) slit diaphragm(GO:0036057) |
| 3.0 | 18.0 | GO:0034274 | Atg12-Atg5-Atg16 complex(GO:0034274) |
| 3.0 | 59.5 | GO:0005952 | cAMP-dependent protein kinase complex(GO:0005952) |
| 2.8 | 120.6 | GO:0008180 | COP9 signalosome(GO:0008180) |
| 2.8 | 52.9 | GO:0033276 | transcription factor TFTC complex(GO:0033276) |
| 2.7 | 144.3 | GO:0010494 | cytoplasmic stress granule(GO:0010494) |
| 2.7 | 18.7 | GO:0070187 | telosome(GO:0070187) |
| 2.6 | 49.9 | GO:0001891 | phagocytic cup(GO:0001891) |
| 2.6 | 33.9 | GO:0033180 | proton-transporting V-type ATPase, V1 domain(GO:0033180) |
| 2.6 | 138.6 | GO:0005871 | kinesin complex(GO:0005871) |
| 2.5 | 15.0 | GO:0070381 | endosome to plasma membrane transport vesicle(GO:0070381) |
| 2.5 | 61.3 | GO:0005666 | DNA-directed RNA polymerase III complex(GO:0005666) |
| 2.4 | 59.7 | GO:0045111 | intermediate filament cytoskeleton(GO:0045111) |
| 2.4 | 356.7 | GO:0005681 | spliceosomal complex(GO:0005681) |
| 2.3 | 25.7 | GO:0042575 | DNA polymerase complex(GO:0042575) |
| 2.3 | 4.6 | GO:0000974 | Prp19 complex(GO:0000974) |
| 2.3 | 11.4 | GO:0020018 | ciliary pocket(GO:0020016) ciliary pocket membrane(GO:0020018) |
| 2.2 | 8.7 | GO:0032021 | NELF complex(GO:0032021) |
| 2.1 | 34.1 | GO:1902562 | NuA4 histone acetyltransferase complex(GO:0035267) H4/H2A histone acetyltransferase complex(GO:0043189) H4 histone acetyltransferase complex(GO:1902562) |
| 2.1 | 53.7 | GO:0031304 | intrinsic component of mitochondrial inner membrane(GO:0031304) integral component of mitochondrial inner membrane(GO:0031305) |
| 2.0 | 18.4 | GO:0000220 | vacuolar proton-transporting V-type ATPase, V0 domain(GO:0000220) |
| 2.0 | 57.3 | GO:0031143 | pseudopodium(GO:0031143) |
| 2.0 | 158.5 | GO:0005811 | lipid particle(GO:0005811) |
| 2.0 | 8.1 | GO:0032044 | DSIF complex(GO:0032044) |
| 1.9 | 79.7 | GO:0002102 | podosome(GO:0002102) |
| 1.9 | 32.1 | GO:0030904 | retromer complex(GO:0030904) |
| 1.9 | 63.9 | GO:0000159 | protein phosphatase type 2A complex(GO:0000159) |
| 1.9 | 5.6 | GO:1990423 | RZZ complex(GO:1990423) |
| 1.9 | 35.3 | GO:0090545 | NuRD complex(GO:0016581) CHD-type complex(GO:0090545) |
| 1.8 | 11.0 | GO:0000322 | storage vacuole(GO:0000322) |
| 1.8 | 91.1 | GO:0043034 | costamere(GO:0043034) |
| 1.8 | 19.7 | GO:0035631 | CD40 receptor complex(GO:0035631) |
| 1.7 | 60.7 | GO:0016592 | mediator complex(GO:0016592) |
| 1.7 | 5.1 | GO:0018444 | translation release factor complex(GO:0018444) |
| 1.7 | 15.0 | GO:0005827 | polar microtubule(GO:0005827) |
| 1.6 | 4.8 | GO:0000780 | condensed nuclear chromosome, centromeric region(GO:0000780) |
| 1.6 | 43.5 | GO:0071682 | endocytic vesicle lumen(GO:0071682) |
| 1.5 | 3.0 | GO:0031213 | RSF complex(GO:0031213) |
| 1.5 | 42.3 | GO:1904115 | axon cytoplasm(GO:1904115) |
| 1.5 | 7.5 | GO:0044327 | dendritic spine head(GO:0044327) |
| 1.5 | 4.4 | GO:0035976 | AP1 complex(GO:0035976) |
| 1.4 | 40.0 | GO:0005719 | nuclear euchromatin(GO:0005719) |
| 1.4 | 44.8 | GO:0005758 | mitochondrial intermembrane space(GO:0005758) |
| 1.4 | 2.7 | GO:0001940 | male pronucleus(GO:0001940) |
| 1.3 | 47.2 | GO:0005876 | spindle microtubule(GO:0005876) |
| 1.3 | 1.3 | GO:0000806 | Y chromosome(GO:0000806) |
| 1.3 | 12.5 | GO:0000506 | glycosylphosphatidylinositol-N-acetylglucosaminyltransferase (GPI-GnT) complex(GO:0000506) |
| 1.2 | 13.6 | GO:0042105 | alpha-beta T cell receptor complex(GO:0042105) |
| 1.2 | 35.7 | GO:0005680 | anaphase-promoting complex(GO:0005680) |
| 1.2 | 7.3 | GO:0030014 | CCR4-NOT complex(GO:0030014) |
| 1.2 | 8.4 | GO:0000110 | nucleotide-excision repair factor 1 complex(GO:0000110) |
| 1.2 | 74.3 | GO:0033116 | endoplasmic reticulum-Golgi intermediate compartment membrane(GO:0033116) |
| 1.1 | 20.6 | GO:0071782 | endoplasmic reticulum tubular network(GO:0071782) |
| 1.1 | 10.3 | GO:0005869 | dynactin complex(GO:0005869) |
| 1.1 | 68.1 | GO:0030670 | phagocytic vesicle membrane(GO:0030670) |
| 1.1 | 31.9 | GO:0098573 | intrinsic component of mitochondrial membrane(GO:0098573) |
| 1.1 | 54.9 | GO:0005801 | cis-Golgi network(GO:0005801) |
| 1.1 | 18.4 | GO:0030867 | rough endoplasmic reticulum membrane(GO:0030867) |
| 1.0 | 8.2 | GO:0005641 | nuclear envelope lumen(GO:0005641) |
| 1.0 | 3.0 | GO:0005879 | axonemal microtubule(GO:0005879) |
| 1.0 | 66.4 | GO:0000784 | nuclear chromosome, telomeric region(GO:0000784) |
| 1.0 | 81.1 | GO:0035578 | azurophil granule lumen(GO:0035578) |
| 1.0 | 9.5 | GO:0030127 | COPII vesicle coat(GO:0030127) |
| 0.9 | 50.1 | GO:0005793 | endoplasmic reticulum-Golgi intermediate compartment(GO:0005793) |
| 0.9 | 20.0 | GO:0031264 | death-inducing signaling complex(GO:0031264) |
| 0.9 | 7.0 | GO:0005642 | annulate lamellae(GO:0005642) |
| 0.9 | 6.9 | GO:0035748 | myelin sheath abaxonal region(GO:0035748) |
| 0.9 | 19.6 | GO:0071564 | npBAF complex(GO:0071564) |
| 0.8 | 202.0 | GO:0005743 | mitochondrial inner membrane(GO:0005743) |
| 0.8 | 109.3 | GO:0042579 | peroxisome(GO:0005777) microbody(GO:0042579) |
| 0.8 | 26.6 | GO:0030125 | clathrin vesicle coat(GO:0030125) |
| 0.8 | 34.4 | GO:0005791 | rough endoplasmic reticulum(GO:0005791) |
| 0.8 | 3.2 | GO:0030314 | junctional membrane complex(GO:0030314) |
| 0.8 | 318.7 | GO:0005635 | nuclear envelope(GO:0005635) |
| 0.8 | 3.1 | GO:0044194 | cytolytic granule(GO:0044194) |
| 0.8 | 6.8 | GO:0033588 | Elongator holoenzyme complex(GO:0033588) |
| 0.7 | 57.7 | GO:0000932 | cytoplasmic mRNA processing body(GO:0000932) |
| 0.7 | 3.6 | GO:0031466 | Cul5-RING ubiquitin ligase complex(GO:0031466) |
| 0.7 | 7.1 | GO:0000788 | nuclear nucleosome(GO:0000788) |
| 0.7 | 17.0 | GO:0000421 | autophagosome membrane(GO:0000421) |
| 0.7 | 51.8 | GO:0001669 | acrosomal vesicle(GO:0001669) |
| 0.7 | 4.0 | GO:0001520 | outer dense fiber(GO:0001520) |
| 0.6 | 31.1 | GO:0032154 | cleavage furrow(GO:0032154) cell surface furrow(GO:0097610) |
| 0.6 | 41.7 | GO:0101003 | ficolin-1-rich granule membrane(GO:0101003) |
| 0.6 | 6.1 | GO:0033256 | I-kappaB/NF-kappaB complex(GO:0033256) |
| 0.6 | 68.0 | GO:0005795 | Golgi stack(GO:0005795) |
| 0.6 | 19.1 | GO:0000307 | cyclin-dependent protein kinase holoenzyme complex(GO:0000307) |
| 0.6 | 12.1 | GO:0070971 | endoplasmic reticulum exit site(GO:0070971) |
| 0.6 | 1.7 | GO:0061574 | ASAP complex(GO:0061574) |
| 0.6 | 2.2 | GO:0043259 | laminin-10 complex(GO:0043259) laminin-11 complex(GO:0043260) |
| 0.5 | 12.7 | GO:0032281 | AMPA glutamate receptor complex(GO:0032281) |
| 0.5 | 8.9 | GO:0019897 | extrinsic component of plasma membrane(GO:0019897) |
| 0.5 | 105.7 | GO:0009898 | cytoplasmic side of plasma membrane(GO:0009898) |
| 0.5 | 2.5 | GO:0097136 | Bcl-2 family protein complex(GO:0097136) |
| 0.5 | 141.1 | GO:0005788 | endoplasmic reticulum lumen(GO:0005788) |
| 0.4 | 16.3 | GO:0045095 | keratin filament(GO:0045095) |
| 0.4 | 2.7 | GO:0070382 | synaptic vesicle(GO:0008021) exocytic vesicle(GO:0070382) |
| 0.4 | 5.0 | GO:0030131 | clathrin adaptor complex(GO:0030131) |
| 0.3 | 6.0 | GO:0044295 | axonal growth cone(GO:0044295) |
| 0.3 | 31.6 | GO:1904813 | ficolin-1-rich granule(GO:0101002) ficolin-1-rich granule lumen(GO:1904813) |
| 0.3 | 14.7 | GO:0031526 | brush border membrane(GO:0031526) |
| 0.3 | 79.7 | GO:0016607 | nuclear speck(GO:0016607) |
| 0.2 | 6.6 | GO:0042581 | specific granule(GO:0042581) |
| 0.2 | 20.2 | GO:0000775 | chromosome, centromeric region(GO:0000775) |
| 0.2 | 10.5 | GO:0042571 | immunoglobulin complex, circulating(GO:0042571) |
| 0.2 | 7.3 | GO:0000794 | condensed nuclear chromosome(GO:0000794) |
| 0.2 | 14.9 | GO:0031968 | mitochondrial outer membrane(GO:0005741) organelle outer membrane(GO:0031968) |
| 0.2 | 17.4 | GO:0031091 | platelet alpha granule(GO:0031091) |
| 0.2 | 11.6 | GO:0030496 | midbody(GO:0030496) |
| 0.2 | 12.5 | GO:0005796 | Golgi lumen(GO:0005796) |
| 0.1 | 25.3 | GO:0000151 | ubiquitin ligase complex(GO:0000151) |
| 0.1 | 105.9 | GO:0005615 | extracellular space(GO:0005615) |
| 0.1 | 7.1 | GO:0005667 | transcription factor complex(GO:0005667) |
| 0.1 | 11.9 | GO:0042470 | melanosome(GO:0042470) pigment granule(GO:0048770) |
| 0.1 | 0.7 | GO:0005955 | calcineurin complex(GO:0005955) |
| 0.1 | 9.5 | GO:0072562 | blood microparticle(GO:0072562) |
| 0.1 | 0.6 | GO:0031931 | TORC1 complex(GO:0031931) |
| 0.1 | 1.4 | GO:0032839 | dendrite cytoplasm(GO:0032839) |
| 0.1 | 3.0 | GO:0005881 | cytoplasmic microtubule(GO:0005881) |
| 0.1 | 0.2 | GO:0031258 | lamellipodium membrane(GO:0031258) |
| 0.1 | 173.6 | GO:0070062 | extracellular exosome(GO:0070062) |
| 0.1 | 2.7 | GO:0017053 | transcriptional repressor complex(GO:0017053) |
| 0.1 | 12.1 | GO:0005759 | mitochondrial matrix(GO:0005759) |
| 0.0 | 0.2 | GO:0035032 | phosphatidylinositol 3-kinase complex, class III(GO:0035032) |
| 0.0 | 0.8 | GO:0015030 | Cajal body(GO:0015030) |
Gene overrepresentation in molecular_function category:
| Log-likelihood per target | Total log-likelihood | Term | Description |
|---|---|---|---|
| 32.0 | 128.1 | GO:0016728 | ribonucleoside-diphosphate reductase activity, thioredoxin disulfide as acceptor(GO:0004748) oxidoreductase activity, acting on CH or CH2 groups, disulfide as acceptor(GO:0016728) ribonucleoside-diphosphate reductase activity(GO:0061731) |
| 29.1 | 116.6 | GO:0004826 | phenylalanine-tRNA ligase activity(GO:0004826) |
| 23.2 | 69.7 | GO:0004819 | glutamine-tRNA ligase activity(GO:0004819) |
| 22.3 | 89.2 | GO:0004739 | pyruvate dehydrogenase (acetyl-transferring) activity(GO:0004739) |
| 21.5 | 86.2 | GO:0000104 | succinate dehydrogenase activity(GO:0000104) |
| 20.5 | 102.3 | GO:0071074 | eukaryotic initiation factor eIF2 binding(GO:0071074) |
| 20.0 | 140.2 | GO:0016681 | ubiquinol-cytochrome-c reductase activity(GO:0008121) oxidoreductase activity, acting on diphenols and related substances as donors, cytochrome as acceptor(GO:0016681) |
| 19.5 | 78.0 | GO:0044378 | non-sequence-specific DNA binding, bending(GO:0044378) |
| 19.3 | 96.4 | GO:0032139 | dinucleotide insertion or deletion binding(GO:0032139) |
| 19.1 | 57.4 | GO:0000033 | alpha-1,3-mannosyltransferase activity(GO:0000033) |
| 18.5 | 184.8 | GO:0019784 | NEDD8-specific protease activity(GO:0019784) |
| 18.0 | 108.1 | GO:0004749 | ribose phosphate diphosphokinase activity(GO:0004749) |
| 17.7 | 71.0 | GO:0004774 | succinate-CoA ligase activity(GO:0004774) |
| 17.5 | 87.6 | GO:0016509 | long-chain-3-hydroxyacyl-CoA dehydrogenase activity(GO:0016509) |
| 17.4 | 121.7 | GO:0050733 | RS domain binding(GO:0050733) |
| 17.2 | 34.3 | GO:0016422 | mRNA (2'-O-methyladenosine-N6-)-methyltransferase activity(GO:0016422) |
| 16.4 | 49.3 | GO:0003976 | UDP-N-acetylglucosamine-lysosomal-enzyme N-acetylglucosaminephosphotransferase activity(GO:0003976) |
| 16.4 | 98.4 | GO:0035500 | MH2 domain binding(GO:0035500) |
| 16.0 | 64.2 | GO:0004809 | tRNA (guanine-N2-)-methyltransferase activity(GO:0004809) |
| 15.7 | 110.2 | GO:0030621 | U4 snRNA binding(GO:0030621) |
| 15.7 | 47.1 | GO:0042134 | rRNA primary transcript binding(GO:0042134) |
| 15.6 | 46.9 | GO:0004853 | uroporphyrinogen decarboxylase activity(GO:0004853) |
| 15.4 | 46.2 | GO:0016262 | protein N-acetylglucosaminyltransferase activity(GO:0016262) |
| 15.2 | 45.5 | GO:0045155 | electron transporter, transferring electrons from CoQH2-cytochrome c reductase complex and cytochrome c oxidase complex activity(GO:0045155) |
| 14.8 | 74.1 | GO:0070404 | NADH binding(GO:0070404) |
| 14.7 | 117.8 | GO:0043024 | ribosomal small subunit binding(GO:0043024) |
| 13.9 | 125.5 | GO:0033592 | RNA strand annealing activity(GO:0033592) |
| 13.6 | 40.9 | GO:0033867 | Fas-activated serine/threonine kinase activity(GO:0033867) |
| 13.5 | 40.4 | GO:0005047 | signal recognition particle binding(GO:0005047) |
| 13.2 | 39.7 | GO:0004609 | phosphatidylserine decarboxylase activity(GO:0004609) |
| 13.0 | 181.6 | GO:1990825 | sequence-specific mRNA binding(GO:1990825) |
| 12.7 | 88.9 | GO:0004704 | NF-kappaB-inducing kinase activity(GO:0004704) |
| 12.7 | 50.6 | GO:0005046 | KDEL sequence binding(GO:0005046) |
| 12.6 | 37.9 | GO:0030628 | pre-mRNA 3'-splice site binding(GO:0030628) |
| 11.7 | 35.2 | GO:0097158 | pre-mRNA intronic pyrimidine-rich binding(GO:0097158) |
| 11.7 | 58.3 | GO:1990460 | leptin receptor binding(GO:1990460) |
| 11.3 | 124.3 | GO:0036402 | proteasome-activating ATPase activity(GO:0036402) |
| 11.0 | 44.2 | GO:0035243 | protein-arginine omega-N symmetric methyltransferase activity(GO:0035243) |
| 11.0 | 296.6 | GO:0046933 | proton-transporting ATP synthase activity, rotational mechanism(GO:0046933) |
| 10.7 | 32.2 | GO:0016435 | rRNA (guanine) methyltransferase activity(GO:0016435) |
| 10.6 | 117.0 | GO:0055131 | C3HC4-type RING finger domain binding(GO:0055131) |
| 10.6 | 52.8 | GO:0008073 | ornithine decarboxylase inhibitor activity(GO:0008073) |
| 10.5 | 555.1 | GO:0008137 | NADH dehydrogenase (ubiquinone) activity(GO:0008137) NADH dehydrogenase (quinone) activity(GO:0050136) |
| 9.9 | 69.5 | GO:0050815 | phosphoserine binding(GO:0050815) |
| 9.3 | 37.3 | GO:0099609 | microtubule lateral binding(GO:0099609) |
| 9.3 | 37.1 | GO:0036033 | mediator complex binding(GO:0036033) |
| 9.2 | 184.6 | GO:0070717 | poly-purine tract binding(GO:0070717) |
| 9.2 | 36.8 | GO:0034603 | pyruvate dehydrogenase activity(GO:0004738) pyruvate dehydrogenase [NAD(P)+] activity(GO:0034603) pyruvate dehydrogenase (NAD+) activity(GO:0034604) |
| 9.0 | 35.9 | GO:0003726 | double-stranded RNA adenosine deaminase activity(GO:0003726) |
| 8.8 | 265.1 | GO:0004298 | threonine-type endopeptidase activity(GO:0004298) threonine-type peptidase activity(GO:0070003) |
| 8.6 | 34.4 | GO:0071987 | WD40-repeat domain binding(GO:0071987) |
| 8.5 | 221.4 | GO:0008187 | poly-pyrimidine tract binding(GO:0008187) |
| 8.5 | 194.9 | GO:0008327 | methyl-CpG binding(GO:0008327) |
| 8.5 | 33.9 | GO:0004594 | pantothenate kinase activity(GO:0004594) |
| 8.2 | 24.7 | GO:1990404 | protein ADP-ribosylase activity(GO:1990404) |
| 8.1 | 48.8 | GO:0061649 | ubiquitinated histone binding(GO:0061649) |
| 7.9 | 79.2 | GO:0004579 | dolichyl-diphosphooligosaccharide-protein glycotransferase activity(GO:0004579) |
| 7.7 | 30.9 | GO:0015319 | sodium:inorganic phosphate symporter activity(GO:0015319) |
| 7.5 | 29.9 | GO:0004165 | dodecenoyl-CoA delta-isomerase activity(GO:0004165) |
| 7.4 | 44.3 | GO:0034513 | box H/ACA snoRNA binding(GO:0034513) |
| 7.1 | 21.2 | GO:0001129 | RNA polymerase II transcription factor activity, TBP-class protein binding, involved in preinitiation complex assembly(GO:0001129) RNA polymerase II transcription factor activity, TBP-class protein binding(GO:0001132) |
| 7.1 | 63.6 | GO:0030911 | TPR domain binding(GO:0030911) |
| 7.0 | 55.9 | GO:0070181 | small ribosomal subunit rRNA binding(GO:0070181) |
| 7.0 | 41.9 | GO:0042296 | ISG15 transferase activity(GO:0042296) |
| 7.0 | 97.7 | GO:0004726 | non-membrane spanning protein tyrosine phosphatase activity(GO:0004726) |
| 6.9 | 20.8 | GO:0061752 | telomeric repeat-containing RNA binding(GO:0061752) |
| 6.9 | 20.7 | GO:0070326 | very-low-density lipoprotein particle receptor binding(GO:0070326) |
| 6.8 | 47.6 | GO:0008312 | 7S RNA binding(GO:0008312) |
| 6.8 | 81.6 | GO:0003857 | 3-hydroxyacyl-CoA dehydrogenase activity(GO:0003857) |
| 6.6 | 231.6 | GO:0051059 | NF-kappaB binding(GO:0051059) |
| 6.6 | 98.3 | GO:0042809 | vitamin D receptor binding(GO:0042809) |
| 6.4 | 32.0 | GO:0047374 | methylumbelliferyl-acetate deacetylase activity(GO:0047374) |
| 6.4 | 38.4 | GO:0008440 | inositol-1,4,5-trisphosphate 3-kinase activity(GO:0008440) |
| 6.3 | 269.7 | GO:0061631 | ubiquitin conjugating enzyme activity(GO:0061631) |
| 6.1 | 220.3 | GO:0070577 | lysine-acetylated histone binding(GO:0070577) |
| 6.1 | 67.3 | GO:0001224 | RNA polymerase II transcription cofactor binding(GO:0001224) |
| 6.1 | 42.8 | GO:0017077 | oxidative phosphorylation uncoupler activity(GO:0017077) |
| 6.1 | 48.6 | GO:0004865 | protein serine/threonine phosphatase inhibitor activity(GO:0004865) |
| 6.0 | 72.3 | GO:0017070 | U6 snRNA binding(GO:0017070) |
| 6.0 | 18.0 | GO:0004821 | histidine-tRNA ligase activity(GO:0004821) |
| 6.0 | 381.6 | GO:0003743 | translation initiation factor activity(GO:0003743) |
| 5.9 | 23.5 | GO:0004660 | protein farnesyltransferase activity(GO:0004660) |
| 5.8 | 29.1 | GO:0015140 | malate transmembrane transporter activity(GO:0015140) |
| 5.8 | 23.2 | GO:0033981 | D-dopachrome decarboxylase activity(GO:0033981) |
| 5.8 | 17.3 | GO:0004711 | ribosomal protein S6 kinase activity(GO:0004711) |
| 5.6 | 44.7 | GO:0008379 | thioredoxin peroxidase activity(GO:0008379) |
| 5.5 | 33.0 | GO:0004839 | ubiquitin activating enzyme activity(GO:0004839) |
| 5.4 | 70.7 | GO:0034450 | ubiquitin-ubiquitin ligase activity(GO:0034450) |
| 5.4 | 248.6 | GO:0019212 | phosphatase inhibitor activity(GO:0019212) |
| 5.4 | 171.4 | GO:0001671 | ATPase activator activity(GO:0001671) |
| 5.2 | 36.4 | GO:0042979 | ornithine decarboxylase activator activity(GO:0042978) ornithine decarboxylase regulator activity(GO:0042979) |
| 5.1 | 56.4 | GO:1904264 | ubiquitin protein ligase activity involved in ERAD pathway(GO:1904264) |
| 5.1 | 66.2 | GO:0008649 | rRNA methyltransferase activity(GO:0008649) |
| 5.1 | 40.7 | GO:0004111 | creatine kinase activity(GO:0004111) |
| 5.1 | 35.6 | GO:0047134 | protein-disulfide reductase activity(GO:0047134) |
| 5.1 | 50.7 | GO:0098505 | G-rich strand telomeric DNA binding(GO:0098505) |
| 5.0 | 20.1 | GO:0030170 | pyridoxal phosphate binding(GO:0030170) |
| 5.0 | 24.9 | GO:0030348 | syntaxin-3 binding(GO:0030348) |
| 4.9 | 1068.8 | GO:0003735 | structural constituent of ribosome(GO:0003735) |
| 4.8 | 38.4 | GO:0016842 | amidine-lyase activity(GO:0016842) |
| 4.6 | 23.0 | GO:0050145 | nucleoside phosphate kinase activity(GO:0050145) |
| 4.6 | 45.6 | GO:1990247 | N6-methyladenosine-containing RNA binding(GO:1990247) |
| 4.5 | 76.8 | GO:0019206 | nucleoside kinase activity(GO:0019206) |
| 4.2 | 12.6 | GO:0003923 | GPI-anchor transamidase activity(GO:0003923) |
| 4.2 | 87.9 | GO:0008157 | protein phosphatase 1 binding(GO:0008157) |
| 4.2 | 58.2 | GO:0051537 | 2 iron, 2 sulfur cluster binding(GO:0051537) |
| 4.1 | 289.4 | GO:0019003 | GDP binding(GO:0019003) |
| 3.9 | 11.8 | GO:0034038 | deoxyhypusine synthase activity(GO:0034038) |
| 3.9 | 43.1 | GO:0004861 | cyclin-dependent protein serine/threonine kinase inhibitor activity(GO:0004861) |
| 3.9 | 85.4 | GO:0034236 | protein kinase A catalytic subunit binding(GO:0034236) |
| 3.8 | 130.5 | GO:0043022 | ribosome binding(GO:0043022) |
| 3.8 | 99.7 | GO:0036002 | pre-mRNA binding(GO:0036002) |
| 3.8 | 57.1 | GO:0004887 | thyroid hormone receptor activity(GO:0004887) |
| 3.7 | 11.1 | GO:0035614 | snRNA stem-loop binding(GO:0035614) |
| 3.7 | 117.9 | GO:0031492 | nucleosomal DNA binding(GO:0031492) |
| 3.6 | 32.5 | GO:0001075 | transcription factor activity, RNA polymerase II core promoter sequence-specific binding involved in preinitiation complex assembly(GO:0001075) |
| 3.6 | 14.4 | GO:0097001 | ceramide binding(GO:0097001) |
| 3.6 | 50.4 | GO:0016018 | cyclosporin A binding(GO:0016018) |
| 3.6 | 10.8 | GO:0032090 | Pyrin domain binding(GO:0032090) |
| 3.4 | 10.3 | GO:0033858 | N-acetylgalactosamine kinase activity(GO:0033858) |
| 3.4 | 116.6 | GO:0044183 | protein binding involved in protein folding(GO:0044183) |
| 3.3 | 33.2 | GO:0005487 | nucleocytoplasmic transporter activity(GO:0005487) |
| 3.3 | 29.5 | GO:0015288 | porin activity(GO:0015288) |
| 3.2 | 12.9 | GO:0008479 | queuine tRNA-ribosyltransferase activity(GO:0008479) |
| 3.2 | 25.6 | GO:0050833 | pyruvate transmembrane transporter activity(GO:0050833) |
| 3.2 | 35.0 | GO:0000150 | recombinase activity(GO:0000150) |
| 3.2 | 149.4 | GO:0051879 | Hsp90 protein binding(GO:0051879) |
| 3.2 | 120.3 | GO:0004532 | exoribonuclease activity(GO:0004532) |
| 3.1 | 12.6 | GO:0008889 | glycerophosphodiester phosphodiesterase activity(GO:0008889) |
| 3.0 | 18.0 | GO:0019776 | Atg8 ligase activity(GO:0019776) |
| 3.0 | 20.9 | GO:0034062 | DNA-directed RNA polymerase activity(GO:0003899) RNA polymerase activity(GO:0034062) |
| 3.0 | 77.3 | GO:0017056 | structural constituent of nuclear pore(GO:0017056) |
| 2.9 | 88.0 | GO:0046966 | thyroid hormone receptor binding(GO:0046966) |
| 2.9 | 23.3 | GO:0008474 | palmitoyl-(protein) hydrolase activity(GO:0008474) palmitoyl hydrolase activity(GO:0098599) |
| 2.9 | 26.1 | GO:0070182 | DNA polymerase binding(GO:0070182) |
| 2.8 | 58.4 | GO:0050811 | GABA receptor binding(GO:0050811) |
| 2.8 | 16.6 | GO:0003945 | N-acetyllactosamine synthase activity(GO:0003945) |
| 2.8 | 16.6 | GO:0017018 | myosin phosphatase activity(GO:0017018) |
| 2.7 | 10.9 | GO:0016532 | superoxide dismutase copper chaperone activity(GO:0016532) |
| 2.7 | 8.1 | GO:0008523 | sodium-dependent multivitamin transmembrane transporter activity(GO:0008523) |
| 2.7 | 32.4 | GO:0003678 | DNA helicase activity(GO:0003678) |
| 2.7 | 13.5 | GO:0070728 | leucine binding(GO:0070728) |
| 2.7 | 61.3 | GO:0001056 | RNA polymerase III activity(GO:0001056) |
| 2.6 | 52.8 | GO:0005537 | mannose binding(GO:0005537) |
| 2.6 | 183.9 | GO:0005507 | copper ion binding(GO:0005507) |
| 2.6 | 10.5 | GO:0031685 | adenosine receptor binding(GO:0031685) |
| 2.6 | 7.8 | GO:0004379 | glycylpeptide N-tetradecanoyltransferase activity(GO:0004379) myristoyltransferase activity(GO:0019107) |
| 2.6 | 20.7 | GO:0001162 | RNA polymerase II intronic transcription regulatory region sequence-specific DNA binding(GO:0001162) |
| 2.6 | 12.8 | GO:0004830 | tryptophan-tRNA ligase activity(GO:0004830) |
| 2.4 | 56.2 | GO:0016881 | acid-amino acid ligase activity(GO:0016881) |
| 2.4 | 43.8 | GO:0003756 | protein disulfide isomerase activity(GO:0003756) intramolecular oxidoreductase activity, transposing S-S bonds(GO:0016864) |
| 2.4 | 26.5 | GO:0016290 | palmitoyl-CoA hydrolase activity(GO:0016290) |
| 2.4 | 11.9 | GO:0005294 | neutral L-amino acid secondary active transmembrane transporter activity(GO:0005294) |
| 2.4 | 37.7 | GO:0070628 | proteasome binding(GO:0070628) |
| 2.3 | 18.7 | GO:0016929 | SUMO-specific protease activity(GO:0016929) |
| 2.3 | 11.7 | GO:0015183 | L-aspartate transmembrane transporter activity(GO:0015183) |
| 2.3 | 96.7 | GO:0008536 | Ran GTPase binding(GO:0008536) |
| 2.3 | 22.6 | GO:0005094 | Rho GDP-dissociation inhibitor activity(GO:0005094) |
| 2.2 | 11.2 | GO:0031491 | nucleosome binding(GO:0031491) |
| 2.2 | 15.5 | GO:0097506 | uracil DNA N-glycosylase activity(GO:0004844) deaminated base DNA N-glycosylase activity(GO:0097506) |
| 2.2 | 123.3 | GO:0004843 | thiol-dependent ubiquitin-specific protease activity(GO:0004843) |
| 2.2 | 13.2 | GO:0016887 | ATPase activity(GO:0016887) |
| 2.2 | 28.1 | GO:0004550 | nucleoside diphosphate kinase activity(GO:0004550) |
| 2.1 | 36.5 | GO:0003746 | translation elongation factor activity(GO:0003746) |
| 2.1 | 12.5 | GO:0035402 | histone kinase activity (H3-T11 specific)(GO:0035402) |
| 2.1 | 119.5 | GO:0070063 | RNA polymerase binding(GO:0070063) |
| 2.0 | 4.1 | GO:0043398 | HLH domain binding(GO:0043398) |
| 2.0 | 30.2 | GO:0032036 | myosin heavy chain binding(GO:0032036) |
| 2.0 | 3.9 | GO:0001034 | RNA polymerase III transcription factor activity, sequence-specific DNA binding(GO:0001034) |
| 1.9 | 31.0 | GO:0034237 | protein kinase A regulatory subunit binding(GO:0034237) |
| 1.9 | 27.1 | GO:0016922 | ligand-dependent nuclear receptor binding(GO:0016922) |
| 1.9 | 30.7 | GO:0004526 | ribonuclease P activity(GO:0004526) |
| 1.9 | 13.4 | GO:0031386 | protein tag(GO:0031386) |
| 1.9 | 37.8 | GO:0051721 | protein phosphatase 2A binding(GO:0051721) |
| 1.9 | 39.7 | GO:0003924 | GTPase activity(GO:0003924) |
| 1.9 | 22.6 | GO:0032050 | clathrin heavy chain binding(GO:0032050) |
| 1.9 | 24.1 | GO:0044548 | S100 protein binding(GO:0044548) |
| 1.8 | 21.9 | GO:0005131 | growth hormone receptor binding(GO:0005131) |
| 1.8 | 12.8 | GO:0015450 | P-P-bond-hydrolysis-driven protein transmembrane transporter activity(GO:0015450) |
| 1.8 | 18.2 | GO:0015232 | heme transporter activity(GO:0015232) |
| 1.8 | 85.9 | GO:0004364 | glutathione transferase activity(GO:0004364) |
| 1.8 | 49.9 | GO:0071889 | 14-3-3 protein binding(GO:0071889) |
| 1.8 | 16.0 | GO:0010314 | phosphatidylinositol-5-phosphate binding(GO:0010314) |
| 1.8 | 29.9 | GO:0043274 | phospholipase binding(GO:0043274) |
| 1.8 | 105.3 | GO:0004004 | ATP-dependent RNA helicase activity(GO:0004004) |
| 1.8 | 80.6 | GO:0016836 | hydro-lyase activity(GO:0016836) |
| 1.7 | 36.6 | GO:0016538 | cyclin-dependent protein serine/threonine kinase regulator activity(GO:0016538) |
| 1.6 | 70.4 | GO:0051539 | 4 iron, 4 sulfur cluster binding(GO:0051539) |
| 1.6 | 4.8 | GO:0015616 | DNA translocase activity(GO:0015616) |
| 1.6 | 2160.4 | GO:0003723 | RNA binding(GO:0003723) |
| 1.6 | 25.3 | GO:0004185 | serine-type carboxypeptidase activity(GO:0004185) |
| 1.6 | 28.4 | GO:0070410 | co-SMAD binding(GO:0070410) |
| 1.6 | 11.0 | GO:0000268 | peroxisome targeting sequence binding(GO:0000268) |
| 1.5 | 84.8 | GO:0008094 | DNA-dependent ATPase activity(GO:0008094) |
| 1.5 | 17.4 | GO:0045294 | alpha-catenin binding(GO:0045294) |
| 1.4 | 5.8 | GO:0003960 | NADPH:quinone reductase activity(GO:0003960) |
| 1.4 | 5.8 | GO:0001222 | transcription corepressor binding(GO:0001222) |
| 1.4 | 15.5 | GO:0016783 | sulfurtransferase activity(GO:0016783) |
| 1.4 | 47.7 | GO:0004709 | MAP kinase kinase kinase activity(GO:0004709) |
| 1.4 | 19.1 | GO:0030215 | semaphorin receptor binding(GO:0030215) |
| 1.3 | 2.7 | GO:0043522 | leucine zipper domain binding(GO:0043522) |
| 1.3 | 12.9 | GO:0005384 | manganese ion transmembrane transporter activity(GO:0005384) |
| 1.3 | 16.7 | GO:0015924 | mannosyl-oligosaccharide mannosidase activity(GO:0015924) |
| 1.3 | 6.4 | GO:0055106 | ubiquitin-protein transferase regulator activity(GO:0055106) ubiquitin-protein transferase activator activity(GO:0097027) |
| 1.3 | 15.2 | GO:0048306 | calcium-dependent protein binding(GO:0048306) |
| 1.3 | 8.8 | GO:0051087 | chaperone binding(GO:0051087) |
| 1.3 | 12.5 | GO:0017176 | phosphatidylinositol N-acetylglucosaminyltransferase activity(GO:0017176) |
| 1.2 | 11.2 | GO:0005381 | iron ion transmembrane transporter activity(GO:0005381) |
| 1.2 | 28.5 | GO:0017134 | fibroblast growth factor binding(GO:0017134) |
| 1.2 | 36.5 | GO:0031593 | polyubiquitin binding(GO:0031593) |
| 1.2 | 37.3 | GO:0008138 | protein tyrosine/serine/threonine phosphatase activity(GO:0008138) |
| 1.2 | 2.4 | GO:0043812 | phosphatidylinositol-4-phosphate phosphatase activity(GO:0043812) |
| 1.2 | 36.8 | GO:0015248 | sterol transporter activity(GO:0015248) |
| 1.2 | 2.4 | GO:0004040 | amidase activity(GO:0004040) |
| 1.2 | 9.2 | GO:0019237 | centromeric DNA binding(GO:0019237) |
| 1.1 | 21.6 | GO:0046965 | retinoid X receptor binding(GO:0046965) |
| 1.1 | 12.4 | GO:0008253 | 5'-nucleotidase activity(GO:0008253) |
| 1.1 | 71.5 | GO:0051082 | unfolded protein binding(GO:0051082) |
| 1.1 | 55.6 | GO:0035255 | ionotropic glutamate receptor binding(GO:0035255) |
| 1.1 | 6.5 | GO:0016861 | intramolecular oxidoreductase activity, interconverting aldoses and ketoses(GO:0016861) |
| 1.1 | 41.0 | GO:0005080 | protein kinase C binding(GO:0005080) |
| 1.0 | 13.6 | GO:0042608 | T cell receptor binding(GO:0042608) |
| 1.0 | 14.5 | GO:0017049 | GTP-Rho binding(GO:0017049) |
| 1.0 | 222.0 | GO:0003714 | transcription corepressor activity(GO:0003714) |
| 1.0 | 2.9 | GO:0000978 | RNA polymerase II core promoter proximal region sequence-specific DNA binding(GO:0000978) |
| 1.0 | 3.8 | GO:0051022 | GDP-dissociation inhibitor binding(GO:0051021) Rho GDP-dissociation inhibitor binding(GO:0051022) |
| 0.9 | 3.6 | GO:0022865 | transmembrane electron transfer carrier(GO:0022865) |
| 0.8 | 8.4 | GO:0033130 | acetylcholine receptor binding(GO:0033130) |
| 0.8 | 28.9 | GO:0019888 | protein phosphatase regulator activity(GO:0019888) |
| 0.8 | 3.3 | GO:0019976 | interleukin-2 receptor activity(GO:0004911) interleukin-2 binding(GO:0019976) |
| 0.8 | 178.7 | GO:0031625 | ubiquitin protein ligase binding(GO:0031625) |
| 0.7 | 5.2 | GO:0016167 | glial cell-derived neurotrophic factor receptor activity(GO:0016167) |
| 0.7 | 2.8 | GO:0005499 | vitamin D binding(GO:0005499) |
| 0.7 | 15.5 | GO:0005086 | ARF guanyl-nucleotide exchange factor activity(GO:0005086) |
| 0.7 | 2.6 | GO:0030292 | protein tyrosine kinase inhibitor activity(GO:0030292) |
| 0.6 | 3.2 | GO:0004095 | carnitine O-palmitoyltransferase activity(GO:0004095) |
| 0.6 | 3.1 | GO:0016721 | superoxide dismutase activity(GO:0004784) oxidoreductase activity, acting on superoxide radicals as acceptor(GO:0016721) |
| 0.6 | 56.1 | GO:0004197 | cysteine-type endopeptidase activity(GO:0004197) |
| 0.6 | 12.6 | GO:0030331 | estrogen receptor binding(GO:0030331) |
| 0.6 | 5.3 | GO:0070273 | phosphatidylinositol-4-phosphate binding(GO:0070273) |
| 0.6 | 49.9 | GO:0000981 | RNA polymerase II transcription factor activity, sequence-specific DNA binding(GO:0000981) |
| 0.6 | 10.8 | GO:0070840 | dynein complex binding(GO:0070840) |
| 0.6 | 17.2 | GO:0042605 | peptide antigen binding(GO:0042605) |
| 0.6 | 6.1 | GO:0016421 | CoA carboxylase activity(GO:0016421) |
| 0.5 | 1.6 | GO:0030158 | protein xylosyltransferase activity(GO:0030158) |
| 0.5 | 10.4 | GO:0016763 | transferase activity, transferring pentosyl groups(GO:0016763) |
| 0.5 | 42.2 | GO:0008565 | protein transporter activity(GO:0008565) |
| 0.5 | 11.7 | GO:0051117 | ATPase binding(GO:0051117) |
| 0.5 | 8.2 | GO:0005041 | low-density lipoprotein receptor activity(GO:0005041) |
| 0.5 | 5.2 | GO:0097602 | cullin family protein binding(GO:0097602) |
| 0.5 | 0.9 | GO:0050072 | endopolyphosphatase activity(GO:0000298) diphosphoinositol-polyphosphate diphosphatase activity(GO:0008486) bis(5'-adenosyl)-hexaphosphatase activity(GO:0034431) bis(5'-adenosyl)-pentaphosphatase activity(GO:0034432) m7G(5')pppN diphosphatase activity(GO:0050072) inositol diphosphate tetrakisphosphate diphosphatase activity(GO:0052840) inositol bisdiphosphate tetrakisphosphate diphosphatase activity(GO:0052841) inositol diphosphate pentakisphosphate diphosphatase activity(GO:0052842) inositol-1-diphosphate-2,3,4,5,6-pentakisphosphate diphosphatase activity(GO:0052843) inositol-3-diphosphate-1,2,4,5,6-pentakisphosphate diphosphatase activity(GO:0052844) inositol-5-diphosphate-1,2,3,4,6-pentakisphosphate diphosphatase activity(GO:0052845) inositol-1,5-bisdiphosphate-2,3,4,6-tetrakisphosphate 1-diphosphatase activity(GO:0052846) inositol-1,5-bisdiphosphate-2,3,4,6-tetrakisphosphate 5-diphosphatase activity(GO:0052847) inositol-3,5-bisdiphosphate-2,3,4,6-tetrakisphosphate 5-diphosphatase activity(GO:0052848) |
| 0.5 | 15.5 | GO:0005164 | tumor necrosis factor receptor binding(GO:0005164) |
| 0.4 | 4.3 | GO:0052629 | phosphatidylinositol-3,5-bisphosphate 3-phosphatase activity(GO:0052629) |
| 0.4 | 47.1 | GO:0004222 | metalloendopeptidase activity(GO:0004222) |
| 0.4 | 25.8 | GO:0004722 | protein serine/threonine phosphatase activity(GO:0004722) |
| 0.4 | 9.9 | GO:0031624 | ubiquitin conjugating enzyme binding(GO:0031624) |
| 0.3 | 33.4 | GO:0009055 | electron carrier activity(GO:0009055) |
| 0.3 | 2.4 | GO:0003712 | transcription cofactor activity(GO:0003712) |
| 0.3 | 9.3 | GO:0003755 | peptidyl-prolyl cis-trans isomerase activity(GO:0003755) |
| 0.3 | 24.0 | GO:0003777 | microtubule motor activity(GO:0003777) |
| 0.3 | 1.9 | GO:0035312 | 5'-3' exodeoxyribonuclease activity(GO:0035312) |
| 0.3 | 8.0 | GO:0005159 | insulin-like growth factor receptor binding(GO:0005159) |
| 0.3 | 44.3 | GO:0005200 | structural constituent of cytoskeleton(GO:0005200) |
| 0.3 | 14.1 | GO:0015078 | hydrogen ion transmembrane transporter activity(GO:0015078) |
| 0.3 | 6.4 | GO:0008191 | metalloendopeptidase inhibitor activity(GO:0008191) |
| 0.2 | 15.8 | GO:0004714 | transmembrane receptor protein tyrosine kinase activity(GO:0004714) |
| 0.2 | 61.4 | GO:0005525 | GTP binding(GO:0005525) |
| 0.2 | 6.8 | GO:0001784 | phosphotyrosine binding(GO:0001784) |
| 0.2 | 6.2 | GO:0008013 | beta-catenin binding(GO:0008013) |
| 0.2 | 10.5 | GO:0034987 | immunoglobulin receptor binding(GO:0034987) |
| 0.2 | 84.3 | GO:0004674 | protein serine/threonine kinase activity(GO:0004674) |
| 0.2 | 27.6 | GO:0008201 | heparin binding(GO:0008201) |
| 0.2 | 8.5 | GO:0004177 | aminopeptidase activity(GO:0004177) |
| 0.2 | 4.7 | GO:0005544 | calcium-dependent phospholipid binding(GO:0005544) |
| 0.2 | 0.9 | GO:0051864 | histone demethylase activity (H3-K36 specific)(GO:0051864) |
| 0.2 | 2.9 | GO:0004143 | diacylglycerol kinase activity(GO:0004143) |
| 0.1 | 2.7 | GO:0015929 | hexosaminidase activity(GO:0015929) |
| 0.1 | 0.7 | GO:0009008 | DNA-methyltransferase activity(GO:0009008) |
| 0.1 | 6.3 | GO:0017112 | Rab guanyl-nucleotide exchange factor activity(GO:0017112) |
| 0.1 | 5.4 | GO:0015459 | potassium channel regulator activity(GO:0015459) |
| 0.1 | 1.6 | GO:0051019 | mitogen-activated protein kinase binding(GO:0051019) |
| 0.1 | 0.3 | GO:0001046 | core promoter sequence-specific DNA binding(GO:0001046) |
| 0.1 | 3.8 | GO:0017048 | Rho GTPase binding(GO:0017048) |
| 0.1 | 0.6 | GO:0022889 | L-serine transmembrane transporter activity(GO:0015194) serine transmembrane transporter activity(GO:0022889) |
| 0.1 | 7.0 | GO:0004896 | cytokine receptor activity(GO:0004896) |
| 0.0 | 0.5 | GO:0030159 | receptor signaling complex scaffold activity(GO:0030159) |
| 0.0 | 0.2 | GO:0043531 | ADP binding(GO:0043531) |
| 0.0 | 0.2 | GO:0080025 | phosphatidylinositol-3,5-bisphosphate binding(GO:0080025) |
Gene overrepresentation in C2:CP category:
| Log-likelihood per target | Total log-likelihood | Term | Description |
|---|---|---|---|
| 9.7 | 67.7 | SIG REGULATION OF THE ACTIN CYTOSKELETON BY RHO GTPASES | Genes related to regulation of the actin cytoskeleton |
| 9.0 | 17.9 | PID IL8 CXCR1 PATHWAY | IL8- and CXCR1-mediated signaling events |
| 6.5 | 443.1 | PID PLK1 PATHWAY | PLK1 signaling events |
| 5.3 | 79.4 | PID RANBP2 PATHWAY | Sumoylation by RanBP2 regulates transcriptional repression |
| 5.2 | 235.3 | PID HIF1A PATHWAY | Hypoxic and oxygen homeostasis regulation of HIF-1-alpha |
| 5.0 | 287.2 | PID AURORA B PATHWAY | Aurora B signaling |
| 4.6 | 187.3 | PID LIS1 PATHWAY | Lissencephaly gene (LIS1) in neuronal migration and development |
| 4.4 | 96.0 | SA G1 AND S PHASES | Cdk2, 4, and 6 bind cyclin D in G1, while cdk2/cyclin E promotes the G1/S transition. |
| 4.0 | 158.3 | PID NFKAPPAB CANONICAL PATHWAY | Canonical NF-kappaB pathway |
| 3.5 | 88.0 | PID BETA CATENIN DEG PATHWAY | Degradation of beta catenin |
| 3.3 | 88.9 | PID TOLL ENDOGENOUS PATHWAY | Endogenous TLR signaling |
| 3.1 | 77.6 | PID CIRCADIAN PATHWAY | Circadian rhythm pathway |
| 3.0 | 44.9 | PID ATM PATHWAY | ATM pathway |
| 3.0 | 291.6 | PID RB 1PATHWAY | Regulation of retinoblastoma protein |
| 2.7 | 21.9 | ST IL 13 PATHWAY | Interleukin 13 (IL-13) Pathway |
| 2.4 | 95.8 | PID EPHB FWD PATHWAY | EPHB forward signaling |
| 2.3 | 268.0 | PID MYC ACTIV PATHWAY | Validated targets of C-MYC transcriptional activation |
| 2.2 | 50.8 | PID EPHA2 FWD PATHWAY | EPHA2 forward signaling |
| 2.2 | 99.0 | PID HES HEY PATHWAY | Notch-mediated HES/HEY network |
| 2.1 | 205.1 | PID CDC42 PATHWAY | CDC42 signaling events |
| 2.0 | 77.0 | PID TRAIL PATHWAY | TRAIL signaling pathway |
| 1.9 | 84.0 | PID FOXO PATHWAY | FoxO family signaling |
| 1.9 | 44.7 | PID AURORA A PATHWAY | Aurora A signaling |
| 1.8 | 38.5 | SA B CELL RECEPTOR COMPLEXES | Antigen binding to B cell receptors activates protein tyrosine kinases, such as the Src family, which ultimate activate MAP kinases. |
| 1.8 | 57.8 | PID IL1 PATHWAY | IL1-mediated signaling events |
| 1.8 | 83.9 | PID P53 REGULATION PATHWAY | p53 pathway |
| 1.8 | 49.2 | PID HIF2PATHWAY | HIF-2-alpha transcription factor network |
| 1.7 | 40.4 | PID IL3 PATHWAY | IL3-mediated signaling events |
| 1.7 | 112.8 | PID HNF3A PATHWAY | FOXA1 transcription factor network |
| 1.7 | 165.8 | PID SMAD2 3NUCLEAR PATHWAY | Regulation of nuclear SMAD2/3 signaling |
| 1.5 | 18.3 | PID BARD1 PATHWAY | BARD1 signaling events |
| 1.3 | 62.9 | PID HNF3B PATHWAY | FOXA2 and FOXA3 transcription factor networks |
| 1.2 | 48.3 | PID NCADHERIN PATHWAY | N-cadherin signaling events |
| 1.2 | 25.1 | PID IFNG PATHWAY | IFN-gamma pathway |
| 1.2 | 55.9 | PID THROMBIN PAR1 PATHWAY | PAR1-mediated thrombin signaling events |
| 1.2 | 71.5 | PID E2F PATHWAY | E2F transcription factor network |
| 1.1 | 32.2 | PID IL8 CXCR2 PATHWAY | IL8- and CXCR2-mediated signaling events |
| 1.1 | 49.3 | PID INTEGRIN A4B1 PATHWAY | Alpha4 beta1 integrin signaling events |
| 1.1 | 20.7 | PID P38 MKK3 6PATHWAY | p38 MAPK signaling pathway |
| 1.0 | 17.8 | PID FAS PATHWAY | FAS (CD95) signaling pathway |
| 0.9 | 52.0 | PID TRKR PATHWAY | Neurotrophic factor-mediated Trk receptor signaling |
| 0.9 | 122.6 | PID P53 DOWNSTREAM PATHWAY | Direct p53 effectors |
| 0.9 | 29.5 | SIG CHEMOTAXIS | Genes related to chemotaxis |
| 0.9 | 16.8 | PID IL6 7 PATHWAY | IL6-mediated signaling events |
| 0.9 | 10.5 | PID ERB GENOMIC PATHWAY | Validated nuclear estrogen receptor beta network |
| 0.7 | 30.0 | PID ILK PATHWAY | Integrin-linked kinase signaling |
| 0.7 | 29.9 | PID FANCONI PATHWAY | Fanconi anemia pathway |
| 0.7 | 44.7 | PID MYC REPRESS PATHWAY | Validated targets of C-MYC transcriptional repression |
| 0.7 | 7.2 | ST GA13 PATHWAY | G alpha 13 Pathway |
| 0.6 | 25.8 | PID REG GR PATHWAY | Glucocorticoid receptor regulatory network |
| 0.6 | 28.1 | PID HIF1 TFPATHWAY | HIF-1-alpha transcription factor network |
| 0.5 | 13.8 | PID PI3KCI PATHWAY | Class I PI3K signaling events |
| 0.5 | 8.2 | PID ALK2 PATHWAY | ALK2 signaling events |
| 0.5 | 12.5 | PID IL23 PATHWAY | IL23-mediated signaling events |
| 0.4 | 27.2 | PID CMYB PATHWAY | C-MYB transcription factor network |
| 0.4 | 17.9 | PID AR PATHWAY | Coregulation of Androgen receptor activity |
| 0.4 | 3.8 | PID WNT NONCANONICAL PATHWAY | Noncanonical Wnt signaling pathway |
| 0.4 | 3.3 | PID IL2 STAT5 PATHWAY | IL2 signaling events mediated by STAT5 |
| 0.3 | 6.4 | PID HDAC CLASSII PATHWAY | Signaling events mediated by HDAC Class II |
| 0.3 | 7.8 | PID TAP63 PATHWAY | Validated transcriptional targets of TAp63 isoforms |
| 0.3 | 18.8 | PID BETA CATENIN NUC PATHWAY | Regulation of nuclear beta catenin signaling and target gene transcription |
| 0.3 | 5.2 | PID RET PATHWAY | Signaling events regulated by Ret tyrosine kinase |
| 0.3 | 5.9 | ST G ALPHA I PATHWAY | G alpha i Pathway |
| 0.2 | 4.4 | PID ATF2 PATHWAY | ATF-2 transcription factor network |
| 0.2 | 6.5 | ST T CELL SIGNAL TRANSDUCTION | T Cell Signal Transduction |
| 0.1 | 2.2 | PID INTEGRIN4 PATHWAY | Alpha6 beta4 integrin-ligand interactions |
| 0.1 | 5.3 | PID ERBB1 DOWNSTREAM PATHWAY | ErbB1 downstream signaling |
| 0.1 | 6.0 | PID INTEGRIN3 PATHWAY | Beta3 integrin cell surface interactions |
| 0.1 | 2.4 | ST ERK1 ERK2 MAPK PATHWAY | ERK1/ERK2 MAPK Pathway |
| 0.1 | 5.4 | PID RHOA REG PATHWAY | Regulation of RhoA activity |
| 0.1 | 16.1 | NABA ECM GLYCOPROTEINS | Genes encoding structural ECM glycoproteins |
| 0.1 | 1.8 | PID IL12 STAT4 PATHWAY | IL12 signaling mediated by STAT4 |
| 0.1 | 1.7 | PID TXA2PATHWAY | Thromboxane A2 receptor signaling |
| 0.0 | 0.5 | SIG INSULIN RECEPTOR PATHWAY IN CARDIAC MYOCYTES | Genes related to the insulin receptor pathway |
Gene overrepresentation in C2:CP:REACTOME category:
| Log-likelihood per target | Total log-likelihood | Term | Description |
|---|---|---|---|
| 11.3 | 258.8 | REACTOME FORMATION OF ATP BY CHEMIOSMOTIC COUPLING | Genes involved in Formation of ATP by chemiosmotic coupling |
| 10.1 | 857.8 | REACTOME RESPIRATORY ELECTRON TRANSPORT | Genes involved in Respiratory electron transport |
| 9.9 | 357.6 | REACTOME CYTOSOLIC TRNA AMINOACYLATION | Genes involved in Cytosolic tRNA aminoacylation |
| 9.5 | 95.2 | REACTOME COPI MEDIATED TRANSPORT | Genes involved in COPI Mediated Transport |
| 8.7 | 78.6 | REACTOME MRNA DECAY BY 3 TO 5 EXORIBONUCLEASE | Genes involved in mRNA Decay by 3' to 5' Exoribonuclease |
| 8.7 | 52.3 | REACTOME RAF MAP KINASE CASCADE | Genes involved in RAF/MAP kinase cascade |
| 8.6 | 267.9 | REACTOME ADVANCED GLYCOSYLATION ENDPRODUCT RECEPTOR SIGNALING | Genes involved in Advanced glycosylation endproduct receptor signaling |
| 8.6 | 77.8 | REACTOME REGULATION OF THE FANCONI ANEMIA PATHWAY | Genes involved in Regulation of the Fanconi anemia pathway |
| 8.6 | 34.3 | REACTOME PROCESSING OF CAPPED INTRON CONTAINING PRE MRNA | Genes involved in Processing of Capped Intron-Containing Pre-mRNA |
| 8.5 | 381.0 | REACTOME MRNA 3 END PROCESSING | Genes involved in mRNA 3'-end processing |
| 8.1 | 634.3 | REACTOME REGULATION OF ORNITHINE DECARBOXYLASE ODC | Genes involved in Regulation of ornithine decarboxylase (ODC) |
| 7.8 | 305.0 | REACTOME PREFOLDIN MEDIATED TRANSFER OF SUBSTRATE TO CCT TRIC | Genes involved in Prefoldin mediated transfer of substrate to CCT/TriC |
| 7.8 | 140.6 | REACTOME MITOCHONDRIAL FATTY ACID BETA OXIDATION | Genes involved in Mitochondrial Fatty Acid Beta-Oxidation |
| 7.4 | 126.0 | REACTOME REGULATION OF PYRUVATE DEHYDROGENASE PDH COMPLEX | Genes involved in Regulation of pyruvate dehydrogenase (PDH) complex |
| 7.4 | 88.9 | REACTOME IRAK1 RECRUITS IKK COMPLEX | Genes involved in IRAK1 recruits IKK complex |
| 6.7 | 134.7 | REACTOME DESTABILIZATION OF MRNA BY AUF1 HNRNP D0 | Genes involved in Destabilization of mRNA by AUF1 (hnRNP D0) |
| 6.6 | 72.3 | REACTOME DESTABILIZATION OF MRNA BY TRISTETRAPROLIN TTP | Genes involved in Destabilization of mRNA by Tristetraprolin (TTP) |
| 6.6 | 190.0 | REACTOME G0 AND EARLY G1 | Genes involved in G0 and Early G1 |
| 6.5 | 96.9 | REACTOME CITRIC ACID CYCLE TCA CYCLE | Genes involved in Citric acid cycle (TCA cycle) |
| 6.3 | 188.3 | REACTOME SIGNALING BY NODAL | Genes involved in Signaling by NODAL |
| 6.1 | 202.0 | REACTOME DOWNREGULATION OF SMAD2 3 SMAD4 TRANSCRIPTIONAL ACTIVITY | Genes involved in Downregulation of SMAD2/3:SMAD4 transcriptional activity |
| 6.1 | 42.8 | REACTOME RESPIRATORY ELECTRON TRANSPORT ATP SYNTHESIS BY CHEMIOSMOTIC COUPLING AND HEAT PRODUCTION BY UNCOUPLING PROTEINS | Genes involved in Respiratory electron transport, ATP synthesis by chemiosmotic coupling, and heat production by uncoupling proteins. |
| 6.1 | 680.1 | REACTOME MRNA SPLICING | Genes involved in mRNA Splicing |
| 6.0 | 72.1 | REACTOME NOTCH HLH TRANSCRIPTION PATHWAY | Genes involved in Notch-HLH transcription pathway |
| 6.0 | 137.8 | REACTOME DEADENYLATION OF MRNA | Genes involved in Deadenylation of mRNA |
| 5.5 | 94.3 | REACTOME SCFSKP2 MEDIATED DEGRADATION OF P27 P21 | Genes involved in SCF(Skp2)-mediated degradation of p27/p21 |
| 5.1 | 144.1 | REACTOME INHIBITION OF THE PROTEOLYTIC ACTIVITY OF APC C REQUIRED FOR THE ONSET OF ANAPHASE BY MITOTIC SPINDLE CHECKPOINT COMPONENTS | Genes involved in Inhibition of the proteolytic activity of APC/C required for the onset of anaphase by mitotic spindle checkpoint components |
| 4.9 | 191.1 | REACTOME NEP NS2 INTERACTS WITH THE CELLULAR EXPORT MACHINERY | Genes involved in NEP/NS2 Interacts with the Cellular Export Machinery |
| 4.9 | 127.1 | REACTOME KINESINS | Genes involved in Kinesins |
| 4.8 | 1123.5 | REACTOME TRANSLATION | Genes involved in Translation |
| 4.6 | 78.7 | REACTOME PURINE RIBONUCLEOSIDE MONOPHOSPHATE BIOSYNTHESIS | Genes involved in Purine ribonucleoside monophosphate biosynthesis |
| 4.6 | 73.9 | REACTOME APOPTOSIS INDUCED DNA FRAGMENTATION | Genes involved in Apoptosis induced DNA fragmentation |
| 4.5 | 49.7 | REACTOME INFLUENZA VIRAL RNA TRANSCRIPTION AND REPLICATION | Genes involved in Influenza Viral RNA Transcription and Replication |
| 4.4 | 151.1 | REACTOME SYNTHESIS AND INTERCONVERSION OF NUCLEOTIDE DI AND TRIPHOSPHATES | Genes involved in Synthesis and interconversion of nucleotide di- and triphosphates |
| 4.0 | 36.4 | REACTOME OXYGEN DEPENDENT PROLINE HYDROXYLATION OF HYPOXIA INDUCIBLE FACTOR ALPHA | Genes involved in Oxygen-dependent Proline Hydroxylation of Hypoxia-inducible Factor Alpha |
| 3.9 | 90.5 | REACTOME METABOLISM OF POLYAMINES | Genes involved in Metabolism of polyamines |
| 3.8 | 53.9 | REACTOME VITAMIN B5 PANTOTHENATE METABOLISM | Genes involved in Vitamin B5 (pantothenate) metabolism |
| 3.8 | 22.7 | REACTOME APC C CDH1 MEDIATED DEGRADATION OF CDC20 AND OTHER APC C CDH1 TARGETED PROTEINS IN LATE MITOSIS EARLY G1 | Genes involved in APC/C:Cdh1 mediated degradation of Cdc20 and other APC/C:Cdh1 targeted proteins in late mitosis/early G1 |
| 3.7 | 54.8 | REACTOME REPAIR SYNTHESIS FOR GAP FILLING BY DNA POL IN TC NER | Genes involved in Repair synthesis for gap-filling by DNA polymerase in TC-NER |
| 3.2 | 51.0 | REACTOME UNWINDING OF DNA | Genes involved in Unwinding of DNA |
| 3.1 | 44.0 | REACTOME MRNA PROCESSING | Genes involved in mRNA Processing |
| 3.1 | 76.8 | REACTOME PURINE SALVAGE | Genes involved in Purine salvage |
| 3.0 | 39.2 | REACTOME RNA POL III TRANSCRIPTION INITIATION FROM TYPE 3 PROMOTER | Genes involved in RNA Polymerase III Transcription Initiation From Type 3 Promoter |
| 3.0 | 47.6 | REACTOME METABOLISM OF NON CODING RNA | Genes involved in Metabolism of non-coding RNA |
| 3.0 | 62.0 | REACTOME RNA POL III TRANSCRIPTION TERMINATION | Genes involved in RNA Polymerase III Transcription Termination |
| 2.8 | 25.4 | REACTOME SIGNALLING TO P38 VIA RIT AND RIN | Genes involved in Signalling to p38 via RIT and RIN |
| 2.8 | 252.4 | REACTOME MEIOTIC SYNAPSIS | Genes involved in Meiotic Synapsis |
| 2.6 | 13.0 | REACTOME BINDING AND ENTRY OF HIV VIRION | Genes involved in Binding and entry of HIV virion |
| 2.6 | 139.7 | REACTOME MITOCHONDRIAL PROTEIN IMPORT | Genes involved in Mitochondrial Protein Import |
| 2.5 | 68.1 | REACTOME DOWNREGULATION OF TGF BETA RECEPTOR SIGNALING | Genes involved in Downregulation of TGF-beta receptor signaling |
| 2.5 | 63.0 | REACTOME CIRCADIAN REPRESSION OF EXPRESSION BY REV ERBA | Genes involved in Circadian Repression of Expression by REV-ERBA |
| 2.4 | 95.4 | REACTOME SIGNALING BY FGFR1 FUSION MUTANTS | Genes involved in Signaling by FGFR1 fusion mutants |
| 2.4 | 63.5 | REACTOME METABOLISM OF PORPHYRINS | Genes involved in Metabolism of porphyrins |
| 2.3 | 154.6 | REACTOME REGULATION OF INSULIN SECRETION BY GLUCAGON LIKE PEPTIDE1 | Genes involved in Regulation of Insulin Secretion by Glucagon-like Peptide-1 |
| 2.2 | 13.2 | REACTOME PECAM1 INTERACTIONS | Genes involved in PECAM1 interactions |
| 2.2 | 21.9 | REACTOME IL 6 SIGNALING | Genes involved in Interleukin-6 signaling |
| 2.2 | 28.3 | REACTOME THE NLRP3 INFLAMMASOME | Genes involved in The NLRP3 inflammasome |
| 2.2 | 26.0 | REACTOME SPRY REGULATION OF FGF SIGNALING | Genes involved in Spry regulation of FGF signaling |
| 2.1 | 44.3 | REACTOME TELOMERE MAINTENANCE | Genes involved in Telomere Maintenance |
| 2.1 | 33.8 | REACTOME REGULATION OF IFNG SIGNALING | Genes involved in Regulation of IFNG signaling |
| 2.1 | 60.0 | REACTOME INSULIN RECEPTOR RECYCLING | Genes involved in Insulin receptor recycling |
| 2.1 | 37.0 | REACTOME N GLYCAN TRIMMING IN THE ER AND CALNEXIN CALRETICULIN CYCLE | Genes involved in N-glycan trimming in the ER and Calnexin/Calreticulin cycle |
| 2.0 | 74.9 | REACTOME CREB PHOSPHORYLATION THROUGH THE ACTIVATION OF RAS | Genes involved in CREB phosphorylation through the activation of Ras |
| 1.8 | 43.7 | REACTOME FORMATION OF INCISION COMPLEX IN GG NER | Genes involved in Formation of incision complex in GG-NER |
| 1.8 | 55.7 | REACTOME SIGNAL TRANSDUCTION BY L1 | Genes involved in Signal transduction by L1 |
| 1.8 | 275.8 | REACTOME ANTIGEN PROCESSING UBIQUITINATION PROTEASOME DEGRADATION | Genes involved in Antigen processing: Ubiquitination & Proteasome degradation |
| 1.7 | 17.4 | REACTOME APOPTOTIC CLEAVAGE OF CELL ADHESION PROTEINS | Genes involved in Apoptotic cleavage of cell adhesion proteins |
| 1.6 | 36.7 | REACTOME RNA POL II TRANSCRIPTION PRE INITIATION AND PROMOTER OPENING | Genes involved in RNA Polymerase II Transcription Pre-Initiation And Promoter Opening |
| 1.6 | 15.8 | REACTOME POST CHAPERONIN TUBULIN FOLDING PATHWAY | Genes involved in Post-chaperonin tubulin folding pathway |
| 1.6 | 18.7 | REACTOME SIGNALING BY CONSTITUTIVELY ACTIVE EGFR | Genes involved in Signaling by constitutively active EGFR |
| 1.5 | 6.1 | REACTOME ARMS MEDIATED ACTIVATION | Genes involved in ARMS-mediated activation |
| 1.5 | 31.7 | REACTOME P38MAPK EVENTS | Genes involved in p38MAPK events |
| 1.5 | 38.8 | REACTOME SIGNALING BY HIPPO | Genes involved in Signaling by Hippo |
| 1.4 | 31.1 | REACTOME RECYCLING PATHWAY OF L1 | Genes involved in Recycling pathway of L1 |
| 1.4 | 84.5 | REACTOME TRANSPORT TO THE GOLGI AND SUBSEQUENT MODIFICATION | Genes involved in Transport to the Golgi and subsequent modification |
| 1.4 | 40.9 | REACTOME ANTIVIRAL MECHANISM BY IFN STIMULATED GENES | Genes involved in Antiviral mechanism by IFN-stimulated genes |
| 1.4 | 78.4 | REACTOME GOLGI ASSOCIATED VESICLE BIOGENESIS | Genes involved in Golgi Associated Vesicle Biogenesis |
| 1.3 | 83.4 | REACTOME HOST INTERACTIONS OF HIV FACTORS | Genes involved in Host Interactions of HIV factors |
| 1.3 | 16.3 | REACTOME CTNNB1 PHOSPHORYLATION CASCADE | Genes involved in Beta-catenin phosphorylation cascade |
| 1.1 | 33.6 | REACTOME G1 PHASE | Genes involved in G1 Phase |
| 1.1 | 15.0 | REACTOME RECRUITMENT OF NUMA TO MITOTIC CENTROSOMES | Genes involved in Recruitment of NuMA to mitotic centrosomes |
| 1.0 | 6.1 | REACTOME NFKB IS ACTIVATED AND SIGNALS SURVIVAL | Genes involved in NF-kB is activated and signals survival |
| 1.0 | 3.0 | REACTOME SYNTHESIS OF PIPS AT THE LATE ENDOSOME MEMBRANE | Genes involved in Synthesis of PIPs at the late endosome membrane |
| 1.0 | 18.0 | REACTOME NEGATIVE REGULATORS OF RIG I MDA5 SIGNALING | Genes involved in Negative regulators of RIG-I/MDA5 signaling |
| 0.9 | 53.4 | REACTOME MHC CLASS II ANTIGEN PRESENTATION | Genes involved in MHC class II antigen presentation |
| 0.9 | 7.3 | REACTOME MTORC1 MEDIATED SIGNALLING | Genes involved in mTORC1-mediated signalling |
| 0.9 | 10.5 | REACTOME HOMOLOGOUS RECOMBINATION REPAIR OF REPLICATION INDEPENDENT DOUBLE STRAND BREAKS | Genes involved in Homologous recombination repair of replication-independent double-strand breaks |
| 0.8 | 7.6 | REACTOME GAP JUNCTION DEGRADATION | Genes involved in Gap junction degradation |
| 0.8 | 13.6 | REACTOME TRANSLOCATION OF ZAP 70 TO IMMUNOLOGICAL SYNAPSE | Genes involved in Translocation of ZAP-70 to Immunological synapse |
| 0.8 | 23.9 | REACTOME SYNTHESIS OF PA | Genes involved in Synthesis of PA |
| 0.7 | 20.0 | REACTOME EXTRINSIC PATHWAY FOR APOPTOSIS | Genes involved in Extrinsic Pathway for Apoptosis |
| 0.6 | 29.7 | REACTOME DNA REPAIR | Genes involved in DNA Repair |
| 0.6 | 11.0 | REACTOME ABCA TRANSPORTERS IN LIPID HOMEOSTASIS | Genes involved in ABCA transporters in lipid homeostasis |
| 0.5 | 30.6 | REACTOME TRANSCRIPTIONAL REGULATION OF WHITE ADIPOCYTE DIFFERENTIATION | Genes involved in Transcriptional Regulation of White Adipocyte Differentiation |
| 0.5 | 11.4 | REACTOME SIGNAL REGULATORY PROTEIN SIRP FAMILY INTERACTIONS | Genes involved in Signal regulatory protein (SIRP) family interactions |
| 0.4 | 19.3 | REACTOME SEMA4D INDUCED CELL MIGRATION AND GROWTH CONE COLLAPSE | Genes involved in Sema4D induced cell migration and growth-cone collapse |
| 0.4 | 8.2 | REACTOME SIGNALING BY BMP | Genes involved in Signaling by BMP |
| 0.4 | 10.0 | REACTOME PIP3 ACTIVATES AKT SIGNALING | Genes involved in PIP3 activates AKT signaling |
| 0.4 | 6.9 | REACTOME IONOTROPIC ACTIVITY OF KAINATE RECEPTORS | Genes involved in Ionotropic activity of Kainate Receptors |
| 0.4 | 4.9 | REACTOME REGULATION OF SIGNALING BY CBL | Genes involved in Regulation of signaling by CBL |
| 0.3 | 13.9 | REACTOME EFFECTS OF PIP2 HYDROLYSIS | Genes involved in Effects of PIP2 hydrolysis |
| 0.3 | 12.1 | REACTOME BASIGIN INTERACTIONS | Genes involved in Basigin interactions |
| 0.3 | 10.4 | REACTOME PYRIMIDINE METABOLISM | Genes involved in Pyrimidine metabolism |
| 0.3 | 14.5 | REACTOME APOPTOTIC CLEAVAGE OF CELLULAR PROTEINS | Genes involved in Apoptotic cleavage of cellular proteins |
| 0.3 | 23.0 | REACTOME P75 NTR RECEPTOR MEDIATED SIGNALLING | Genes involved in p75 NTR receptor-mediated signalling |
| 0.2 | 10.1 | REACTOME GLUCONEOGENESIS | Genes involved in Gluconeogenesis |
| 0.2 | 29.2 | REACTOME RESPONSE TO ELEVATED PLATELET CYTOSOLIC CA2 | Genes involved in Response to elevated platelet cytosolic Ca2+ |
| 0.2 | 3.0 | REACTOME PROTEIN FOLDING | Genes involved in Protein folding |
| 0.2 | 3.3 | REACTOME IL RECEPTOR SHC SIGNALING | Genes involved in Interleukin receptor SHC signaling |
| 0.2 | 5.2 | REACTOME CHOLESTEROL BIOSYNTHESIS | Genes involved in Cholesterol biosynthesis |
| 0.1 | 17.9 | REACTOME G ALPHA Q SIGNALLING EVENTS | Genes involved in G alpha (q) signalling events |
| 0.1 | 3.8 | REACTOME PTM GAMMA CARBOXYLATION HYPUSINE FORMATION AND ARYLSULFATASE ACTIVATION | Genes involved in PTM: gamma carboxylation, hypusine formation and arylsulfatase activation |
| 0.1 | 1.1 | REACTOME PROLACTIN RECEPTOR SIGNALING | Genes involved in Prolactin receptor signaling |
| 0.1 | 18.9 | REACTOME METABOLISM OF CARBOHYDRATES | Genes involved in Metabolism of carbohydrates |
| 0.0 | 2.8 | REACTOME INTERFERON ALPHA BETA SIGNALING | Genes involved in Interferon alpha/beta signaling |
| 0.0 | 1.5 | REACTOME ACTIVATION OF CHAPERONE GENES BY XBP1S | Genes involved in Activation of Chaperone Genes by XBP1(S) |
| 0.0 | 0.7 | REACTOME DARPP 32 EVENTS | Genes involved in DARPP-32 events |
| 0.0 | 2.2 | REACTOME INTEGRIN CELL SURFACE INTERACTIONS | Genes involved in Integrin cell surface interactions |