Project
GNF SymAtlas + NCI-60 cancer cell lines, comparison of cancers vs non-cancers, human (Su, 2004; Ross, 2000)
Navigation
Downloads
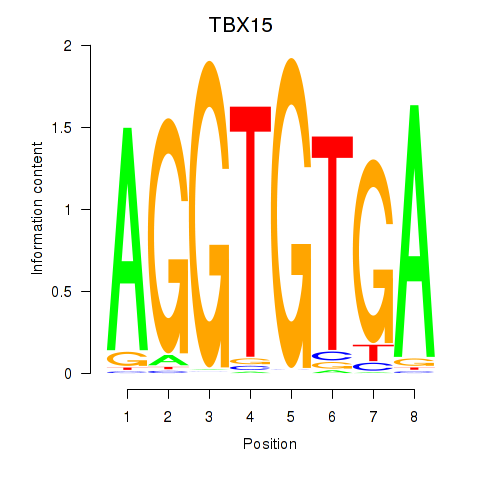
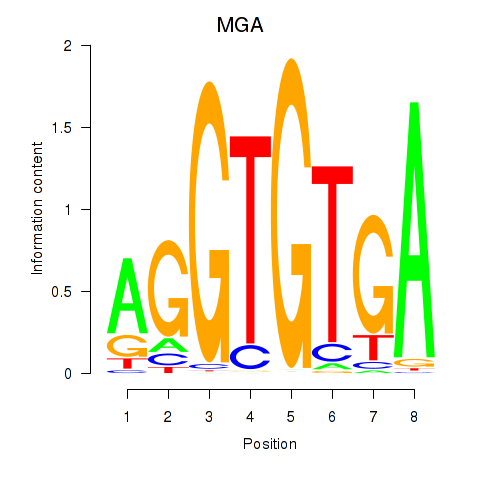
Results for TBX15_MGA
Z-value: 0.62
Motif logo
Transcription factors associated with TBX15_MGA
| Gene Symbol | Gene ID | Gene Info |
|---|---|---|
|
TBX15
|
ENSG00000092607.9 | T-box transcription factor 15 |
|
MGA
|
ENSG00000174197.12 | MAX dimerization protein MGA |
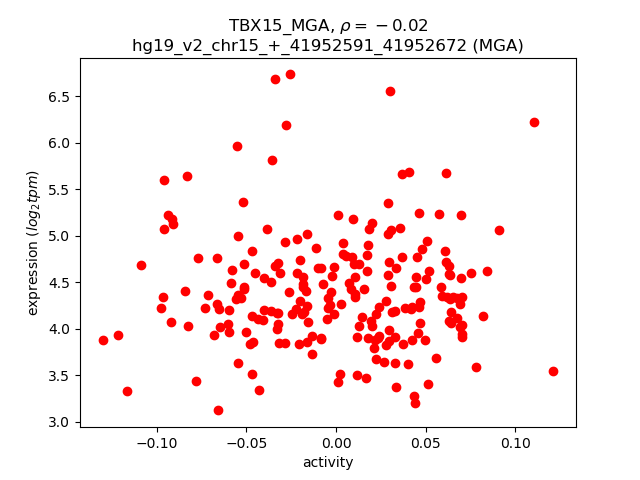
Activity-expression correlation:
| Gene | Promoter | Pearson corr. coef. | P-value | Plot |
|---|---|---|---|---|
| MGA | hg19_v2_chr15_+_41952591_41952672 | -0.02 | 8.0e-01 | Click! |
Activity profile of TBX15_MGA motif
Sorted Z-values of TBX15_MGA motif
| Promoter | Log-likelihood | Transcript | Gene | Gene Info |
|---|---|---|---|---|
| chr1_-_113247543 | 31.20 |
ENST00000414971.1
ENST00000534717.1 |
RHOC
|
ras homolog family member C |
| chr3_-_120170052 | 24.28 |
ENST00000295633.3
|
FSTL1
|
follistatin-like 1 |
| chr11_+_86511569 | 24.06 |
ENST00000441050.1
|
PRSS23
|
protease, serine, 23 |
| chr12_-_56120838 | 20.38 |
ENST00000548160.1
|
CD63
|
CD63 molecule |
| chr17_+_35849937 | 18.40 |
ENST00000394389.4
|
DUSP14
|
dual specificity phosphatase 14 |
| chr3_+_142315225 | 17.75 |
ENST00000457734.2
ENST00000483373.1 ENST00000475296.1 ENST00000495744.1 ENST00000476044.1 ENST00000461644.1 |
PLS1
|
plastin 1 |
| chr7_+_141438393 | 17.47 |
ENST00000484178.1
ENST00000473783.1 ENST00000481508.1 |
SSBP1
|
single-stranded DNA binding protein 1, mitochondrial |
| chr9_-_75567962 | 17.43 |
ENST00000297785.3
ENST00000376939.1 |
ALDH1A1
|
aldehyde dehydrogenase 1 family, member A1 |
| chr12_+_104324112 | 17.29 |
ENST00000299767.5
|
HSP90B1
|
heat shock protein 90kDa beta (Grp94), member 1 |
| chr11_+_46402297 | 16.75 |
ENST00000405308.2
|
MDK
|
midkine (neurite growth-promoting factor 2) |
| chr13_-_48575443 | 16.74 |
ENST00000378654.3
|
SUCLA2
|
succinate-CoA ligase, ADP-forming, beta subunit |
| chr13_-_48575401 | 15.93 |
ENST00000433022.1
ENST00000544100.1 |
SUCLA2
|
succinate-CoA ligase, ADP-forming, beta subunit |
| chr2_-_175870085 | 14.88 |
ENST00000409156.3
|
CHN1
|
chimerin 1 |
| chr17_-_57784755 | 13.94 |
ENST00000537860.1
ENST00000393038.2 ENST00000409433.2 |
PTRH2
|
peptidyl-tRNA hydrolase 2 |
| chr7_+_107220660 | 13.57 |
ENST00000465919.1
ENST00000445771.2 ENST00000479917.1 ENST00000421217.1 ENST00000457837.1 |
BCAP29
|
B-cell receptor-associated protein 29 |
| chr17_+_57784826 | 13.02 |
ENST00000262291.4
|
VMP1
|
vacuole membrane protein 1 |
| chr7_-_76255444 | 12.99 |
ENST00000454397.1
|
POMZP3
|
POM121 and ZP3 fusion |
| chr17_+_57784997 | 12.79 |
ENST00000537567.1
ENST00000539763.1 ENST00000587945.1 ENST00000536180.1 ENST00000589823.2 ENST00000592106.1 ENST00000591315.1 ENST00000545362.1 |
VMP1
|
vacuole membrane protein 1 |
| chr14_-_45603657 | 12.71 |
ENST00000396062.3
|
FKBP3
|
FK506 binding protein 3, 25kDa |
| chr7_+_107220899 | 12.55 |
ENST00000379117.2
ENST00000473124.1 |
BCAP29
|
B-cell receptor-associated protein 29 |
| chr5_+_137514687 | 12.20 |
ENST00000394894.3
|
KIF20A
|
kinesin family member 20A |
| chr5_+_154320623 | 11.60 |
ENST00000523037.1
ENST00000265229.8 ENST00000439747.3 ENST00000522038.1 |
MRPL22
|
mitochondrial ribosomal protein L22 |
| chr9_+_75766652 | 11.32 |
ENST00000257497.6
|
ANXA1
|
annexin A1 |
| chr2_-_26101374 | 11.26 |
ENST00000435504.4
|
ASXL2
|
additional sex combs like 2 (Drosophila) |
| chrX_-_153775426 | 10.86 |
ENST00000393562.2
|
G6PD
|
glucose-6-phosphate dehydrogenase |
| chr12_-_56120865 | 10.37 |
ENST00000548898.1
ENST00000552067.1 |
CD63
|
CD63 molecule |
| chr1_-_115124257 | 10.36 |
ENST00000369541.3
|
BCAS2
|
breast carcinoma amplified sequence 2 |
| chr1_+_169077172 | 10.35 |
ENST00000499679.3
|
ATP1B1
|
ATPase, Na+/K+ transporting, beta 1 polypeptide |
| chr6_+_36646435 | 10.27 |
ENST00000244741.5
ENST00000405375.1 ENST00000373711.2 |
CDKN1A
|
cyclin-dependent kinase inhibitor 1A (p21, Cip1) |
| chr12_+_56473939 | 10.18 |
ENST00000450146.2
|
ERBB3
|
v-erb-b2 avian erythroblastic leukemia viral oncogene homolog 3 |
| chr2_+_62933001 | 10.15 |
ENST00000263991.5
ENST00000354487.3 |
EHBP1
|
EH domain binding protein 1 |
| chr19_-_48894762 | 10.11 |
ENST00000600980.1
ENST00000330720.2 |
KDELR1
|
KDEL (Lys-Asp-Glu-Leu) endoplasmic reticulum protein retention receptor 1 |
| chr12_-_56121580 | 9.82 |
ENST00000550776.1
|
CD63
|
CD63 molecule |
| chrX_-_99891796 | 9.75 |
ENST00000373020.4
|
TSPAN6
|
tetraspanin 6 |
| chr19_-_48894104 | 9.73 |
ENST00000597017.1
|
KDELR1
|
KDEL (Lys-Asp-Glu-Leu) endoplasmic reticulum protein retention receptor 1 |
| chr6_+_121756809 | 9.65 |
ENST00000282561.3
|
GJA1
|
gap junction protein, alpha 1, 43kDa |
| chr1_+_165796753 | 9.55 |
ENST00000367879.4
|
UCK2
|
uridine-cytidine kinase 2 |
| chrX_+_123095546 | 9.51 |
ENST00000371157.3
ENST00000371145.3 ENST00000371144.3 |
STAG2
|
stromal antigen 2 |
| chr11_-_6502534 | 9.22 |
ENST00000254584.2
ENST00000525235.1 ENST00000445086.2 |
ARFIP2
|
ADP-ribosylation factor interacting protein 2 |
| chr3_+_160117418 | 9.20 |
ENST00000465903.1
ENST00000485645.1 ENST00000360111.2 ENST00000472991.1 ENST00000467468.1 ENST00000469762.1 ENST00000489573.1 ENST00000462787.1 ENST00000490207.1 ENST00000485867.1 |
SMC4
|
structural maintenance of chromosomes 4 |
| chr12_-_56121612 | 9.20 |
ENST00000546939.1
|
CD63
|
CD63 molecule |
| chr10_+_95256356 | 9.00 |
ENST00000371485.3
|
CEP55
|
centrosomal protein 55kDa |
| chr2_-_26101314 | 8.92 |
ENST00000336112.4
ENST00000272341.4 |
ASXL2
|
additional sex combs like 2 (Drosophila) |
| chr11_-_27494279 | 8.66 |
ENST00000379214.4
|
LGR4
|
leucine-rich repeat containing G protein-coupled receptor 4 |
| chr9_-_14314518 | 8.45 |
ENST00000397581.2
|
NFIB
|
nuclear factor I/B |
| chr20_+_1115821 | 8.44 |
ENST00000435720.1
|
PSMF1
|
proteasome (prosome, macropain) inhibitor subunit 1 (PI31) |
| chrX_+_70443050 | 8.39 |
ENST00000361726.6
|
GJB1
|
gap junction protein, beta 1, 32kDa |
| chr9_-_128003606 | 8.30 |
ENST00000324460.6
|
HSPA5
|
heat shock 70kDa protein 5 (glucose-regulated protein, 78kDa) |
| chr4_+_140222609 | 8.23 |
ENST00000296543.5
ENST00000398947.1 |
NAA15
|
N(alpha)-acetyltransferase 15, NatA auxiliary subunit |
| chr9_-_14314566 | 8.22 |
ENST00000397579.2
|
NFIB
|
nuclear factor I/B |
| chr11_-_6502580 | 8.15 |
ENST00000423813.2
ENST00000396777.3 |
ARFIP2
|
ADP-ribosylation factor interacting protein 2 |
| chr5_+_137514834 | 8.09 |
ENST00000508792.1
ENST00000504621.1 |
KIF20A
|
kinesin family member 20A |
| chr11_-_27494309 | 8.07 |
ENST00000389858.4
|
LGR4
|
leucine-rich repeat containing G protein-coupled receptor 4 |
| chr14_+_90864504 | 8.01 |
ENST00000544280.2
|
CALM1
|
calmodulin 1 (phosphorylase kinase, delta) |
| chr2_+_62932779 | 7.87 |
ENST00000427809.1
ENST00000405482.1 ENST00000431489.1 |
EHBP1
|
EH domain binding protein 1 |
| chr8_-_99954788 | 7.86 |
ENST00000523601.1
|
STK3
|
serine/threonine kinase 3 |
| chr12_-_49351228 | 7.86 |
ENST00000541959.1
ENST00000447318.2 |
ARF3
|
ADP-ribosylation factor 3 |
| chr7_-_6523755 | 7.80 |
ENST00000436575.1
ENST00000258739.4 |
DAGLB
KDELR2
|
diacylglycerol lipase, beta KDEL (Lys-Asp-Glu-Leu) endoplasmic reticulum protein retention receptor 2 |
| chr1_+_41445413 | 7.76 |
ENST00000541520.1
|
CTPS1
|
CTP synthase 1 |
| chr20_+_11898507 | 7.74 |
ENST00000378226.2
|
BTBD3
|
BTB (POZ) domain containing 3 |
| chr6_+_7541808 | 7.68 |
ENST00000379802.3
|
DSP
|
desmoplakin |
| chr4_-_140222358 | 7.61 |
ENST00000505036.1
ENST00000544855.1 ENST00000539002.1 |
NDUFC1
|
NADH dehydrogenase (ubiquinone) 1, subcomplex unknown, 1, 6kDa |
| chr7_-_6523688 | 7.54 |
ENST00000490996.1
|
KDELR2
|
KDEL (Lys-Asp-Glu-Leu) endoplasmic reticulum protein retention receptor 2 |
| chr14_-_55658252 | 7.50 |
ENST00000395425.2
|
DLGAP5
|
discs, large (Drosophila) homolog-associated protein 5 |
| chr1_-_226374373 | 7.32 |
ENST00000366812.5
|
ACBD3
|
acyl-CoA binding domain containing 3 |
| chr17_-_46682321 | 7.27 |
ENST00000225648.3
ENST00000484302.2 |
HOXB6
|
homeobox B6 |
| chr20_+_34680620 | 7.12 |
ENST00000430276.1
ENST00000373950.2 ENST00000452261.1 |
EPB41L1
|
erythrocyte membrane protein band 4.1-like 1 |
| chr3_-_167452614 | 7.04 |
ENST00000392750.2
ENST00000464360.1 ENST00000492139.1 ENST00000471885.1 ENST00000470131.1 |
PDCD10
|
programmed cell death 10 |
| chr21_+_30502806 | 7.03 |
ENST00000399928.1
ENST00000399926.1 |
MAP3K7CL
|
MAP3K7 C-terminal like |
| chrX_-_10851762 | 7.02 |
ENST00000380785.1
ENST00000380787.1 |
MID1
|
midline 1 (Opitz/BBB syndrome) |
| chr2_-_39664405 | 7.00 |
ENST00000341681.5
ENST00000263881.3 |
MAP4K3
|
mitogen-activated protein kinase kinase kinase kinase 3 |
| chr14_-_103523745 | 6.96 |
ENST00000361246.2
|
CDC42BPB
|
CDC42 binding protein kinase beta (DMPK-like) |
| chrX_+_21958674 | 6.92 |
ENST00000404933.2
|
SMS
|
spermine synthase |
| chr5_-_172756506 | 6.88 |
ENST00000265087.4
|
STC2
|
stanniocalcin 2 |
| chr14_-_55658323 | 6.83 |
ENST00000554067.1
ENST00000247191.2 |
DLGAP5
|
discs, large (Drosophila) homolog-associated protein 5 |
| chrX_+_21958814 | 6.83 |
ENST00000379404.1
ENST00000415881.2 |
SMS
|
spermine synthase |
| chr3_-_167452703 | 6.80 |
ENST00000497056.2
ENST00000473645.2 |
PDCD10
|
programmed cell death 10 |
| chr6_+_83073952 | 6.56 |
ENST00000543496.1
|
TPBG
|
trophoblast glycoprotein |
| chr4_+_166248775 | 6.45 |
ENST00000261507.6
ENST00000507013.1 ENST00000393766.2 ENST00000504317.1 |
MSMO1
|
methylsterol monooxygenase 1 |
| chr11_-_85779971 | 6.43 |
ENST00000393346.3
|
PICALM
|
phosphatidylinositol binding clathrin assembly protein |
| chr12_-_111180644 | 6.42 |
ENST00000551676.1
ENST00000550991.1 ENST00000335007.5 ENST00000340766.5 |
PPP1CC
|
protein phosphatase 1, catalytic subunit, gamma isozyme |
| chr5_-_78809950 | 6.33 |
ENST00000334082.6
|
HOMER1
|
homer homolog 1 (Drosophila) |
| chr12_-_26278030 | 6.33 |
ENST00000242728.4
|
BHLHE41
|
basic helix-loop-helix family, member e41 |
| chr17_+_73257742 | 6.33 |
ENST00000579761.1
ENST00000245539.6 |
MRPS7
|
mitochondrial ribosomal protein S7 |
| chr3_-_167452262 | 6.29 |
ENST00000487947.2
|
PDCD10
|
programmed cell death 10 |
| chr2_-_175869936 | 6.29 |
ENST00000409900.3
|
CHN1
|
chimerin 1 |
| chr5_-_132112921 | 6.26 |
ENST00000378721.4
ENST00000378701.1 |
SEPT8
|
septin 8 |
| chr6_+_7541845 | 6.22 |
ENST00000418664.2
|
DSP
|
desmoplakin |
| chr11_+_114310102 | 6.18 |
ENST00000265881.5
|
REXO2
|
RNA exonuclease 2 |
| chr20_+_34129770 | 6.13 |
ENST00000348547.2
ENST00000357394.4 ENST00000447986.1 ENST00000279052.6 ENST00000416206.1 ENST00000411577.1 ENST00000413587.1 |
ERGIC3
|
ERGIC and golgi 3 |
| chr4_-_102268484 | 5.97 |
ENST00000394853.4
|
PPP3CA
|
protein phosphatase 3, catalytic subunit, alpha isozyme |
| chr5_-_132112907 | 5.94 |
ENST00000458488.2
|
SEPT8
|
septin 8 |
| chr20_+_44098385 | 5.86 |
ENST00000217425.5
ENST00000339946.3 |
WFDC2
|
WAP four-disulfide core domain 2 |
| chr12_-_49351303 | 5.86 |
ENST00000256682.4
|
ARF3
|
ADP-ribosylation factor 3 |
| chrX_+_123095155 | 5.85 |
ENST00000371160.1
ENST00000435103.1 |
STAG2
|
stromal antigen 2 |
| chr7_-_94285511 | 5.84 |
ENST00000265735.7
|
SGCE
|
sarcoglycan, epsilon |
| chr6_-_160166218 | 5.81 |
ENST00000537657.1
|
SOD2
|
superoxide dismutase 2, mitochondrial |
| chr7_-_27135591 | 5.77 |
ENST00000343060.4
ENST00000355633.5 |
HOXA1
|
homeobox A1 |
| chr4_-_102268628 | 5.77 |
ENST00000323055.6
ENST00000512215.1 ENST00000394854.3 |
PPP3CA
|
protein phosphatase 3, catalytic subunit, alpha isozyme |
| chr5_-_9630463 | 5.74 |
ENST00000382492.2
|
TAS2R1
|
taste receptor, type 2, member 1 |
| chrX_+_46771711 | 5.64 |
ENST00000424392.1
ENST00000397189.1 |
PHF16
|
jade family PHD finger 3 |
| chr21_+_37507210 | 5.60 |
ENST00000290354.5
|
CBR3
|
carbonyl reductase 3 |
| chrX_-_109561294 | 5.58 |
ENST00000372059.2
ENST00000262844.5 |
AMMECR1
|
Alport syndrome, mental retardation, midface hypoplasia and elliptocytosis chromosomal region gene 1 |
| chrX_+_46771848 | 5.57 |
ENST00000218343.4
|
PHF16
|
jade family PHD finger 3 |
| chr3_+_160117087 | 5.53 |
ENST00000357388.3
|
SMC4
|
structural maintenance of chromosomes 4 |
| chr17_-_77924627 | 5.50 |
ENST00000572862.1
ENST00000573782.1 ENST00000574427.1 ENST00000570373.1 ENST00000340848.7 ENST00000576768.1 |
TBC1D16
|
TBC1 domain family, member 16 |
| chr4_-_186732048 | 5.41 |
ENST00000448662.2
ENST00000439049.1 ENST00000420158.1 ENST00000431808.1 ENST00000319471.9 |
SORBS2
|
sorbin and SH3 domain containing 2 |
| chr14_+_95078714 | 5.40 |
ENST00000393078.3
ENST00000393080.4 ENST00000467132.1 |
SERPINA3
|
serpin peptidase inhibitor, clade A (alpha-1 antiproteinase, antitrypsin), member 3 |
| chr2_-_183903133 | 5.36 |
ENST00000361354.4
|
NCKAP1
|
NCK-associated protein 1 |
| chrX_-_10645773 | 5.15 |
ENST00000453318.2
|
MID1
|
midline 1 (Opitz/BBB syndrome) |
| chr1_+_172502336 | 5.14 |
ENST00000263688.3
|
SUCO
|
SUN domain containing ossification factor |
| chr17_+_76210267 | 5.14 |
ENST00000301633.4
ENST00000350051.3 ENST00000374948.2 ENST00000590449.1 |
BIRC5
|
baculoviral IAP repeat containing 5 |
| chr10_-_103454876 | 5.10 |
ENST00000331272.7
|
FBXW4
|
F-box and WD repeat domain containing 4 |
| chr6_+_39760129 | 5.07 |
ENST00000274867.4
|
DAAM2
|
dishevelled associated activator of morphogenesis 2 |
| chr1_-_94079648 | 5.07 |
ENST00000370247.3
|
BCAR3
|
breast cancer anti-estrogen resistance 3 |
| chr11_+_74660278 | 5.05 |
ENST00000263672.6
ENST00000530257.1 ENST00000526361.1 ENST00000532972.1 |
SPCS2
|
signal peptidase complex subunit 2 homolog (S. cerevisiae) |
| chr11_+_114310237 | 5.04 |
ENST00000539119.1
|
REXO2
|
RNA exonuclease 2 |
| chr17_+_73257945 | 4.96 |
ENST00000579002.1
|
MRPS7
|
mitochondrial ribosomal protein S7 |
| chr10_-_15413035 | 4.92 |
ENST00000378116.4
ENST00000455654.1 |
FAM171A1
|
family with sequence similarity 171, member A1 |
| chr7_-_72972319 | 4.89 |
ENST00000223368.2
|
BCL7B
|
B-cell CLL/lymphoma 7B |
| chr2_+_201994042 | 4.87 |
ENST00000417748.1
|
CFLAR
|
CASP8 and FADD-like apoptosis regulator |
| chr13_-_46543805 | 4.86 |
ENST00000378921.2
|
ZC3H13
|
zinc finger CCCH-type containing 13 |
| chr20_+_35169885 | 4.76 |
ENST00000279022.2
ENST00000346786.2 |
MYL9
|
myosin, light chain 9, regulatory |
| chr2_+_201994208 | 4.75 |
ENST00000440180.1
|
CFLAR
|
CASP8 and FADD-like apoptosis regulator |
| chr3_-_167452298 | 4.75 |
ENST00000475915.2
ENST00000462725.2 ENST00000461494.1 |
PDCD10
|
programmed cell death 10 |
| chr2_+_69969106 | 4.75 |
ENST00000409920.1
ENST00000394295.4 ENST00000536030.1 |
ANXA4
|
annexin A4 |
| chr21_-_27107344 | 4.63 |
ENST00000457143.2
|
ATP5J
|
ATP synthase, H+ transporting, mitochondrial Fo complex, subunit F6 |
| chr20_+_43343517 | 4.55 |
ENST00000372865.4
|
WISP2
|
WNT1 inducible signaling pathway protein 2 |
| chrX_-_53461288 | 4.51 |
ENST00000375298.4
ENST00000375304.5 |
HSD17B10
|
hydroxysteroid (17-beta) dehydrogenase 10 |
| chr12_-_76462713 | 4.48 |
ENST00000552056.1
|
NAP1L1
|
nucleosome assembly protein 1-like 1 |
| chr12_-_49412541 | 4.47 |
ENST00000547306.1
ENST00000548857.1 ENST00000551696.1 ENST00000316299.5 |
PRKAG1
|
protein kinase, AMP-activated, gamma 1 non-catalytic subunit |
| chr12_-_49412588 | 4.46 |
ENST00000547082.1
ENST00000395170.3 |
PRKAG1
|
protein kinase, AMP-activated, gamma 1 non-catalytic subunit |
| chr2_+_228678550 | 4.46 |
ENST00000409189.3
ENST00000358813.4 |
CCL20
|
chemokine (C-C motif) ligand 20 |
| chr12_-_49412525 | 4.40 |
ENST00000551121.1
ENST00000552212.1 ENST00000548605.1 ENST00000548950.1 ENST00000547125.1 |
PRKAG1
|
protein kinase, AMP-activated, gamma 1 non-catalytic subunit |
| chr12_-_90024360 | 4.40 |
ENST00000393164.2
|
ATP2B1
|
ATPase, Ca++ transporting, plasma membrane 1 |
| chrX_+_105937068 | 4.38 |
ENST00000324342.3
|
RNF128
|
ring finger protein 128, E3 ubiquitin protein ligase |
| chr1_+_223900034 | 4.37 |
ENST00000295006.5
|
CAPN2
|
calpain 2, (m/II) large subunit |
| chr11_-_115375107 | 4.34 |
ENST00000545380.1
ENST00000452722.3 ENST00000537058.1 ENST00000536727.1 ENST00000542447.2 ENST00000331581.6 |
CADM1
|
cell adhesion molecule 1 |
| chr21_-_27107198 | 4.33 |
ENST00000400094.1
|
ATP5J
|
ATP synthase, H+ transporting, mitochondrial Fo complex, subunit F6 |
| chr21_-_27107283 | 4.31 |
ENST00000284971.3
ENST00000400099.1 |
ATP5J
|
ATP synthase, H+ transporting, mitochondrial Fo complex, subunit F6 |
| chr15_+_90808919 | 4.29 |
ENST00000379095.3
|
NGRN
|
neugrin, neurite outgrowth associated |
| chr1_-_153066998 | 4.27 |
ENST00000368750.3
|
SPRR2E
|
small proline-rich protein 2E |
| chr1_-_205744205 | 4.27 |
ENST00000446390.2
|
RAB7L1
|
RAB7, member RAS oncogene family-like 1 |
| chr3_-_66551351 | 4.23 |
ENST00000273261.3
|
LRIG1
|
leucine-rich repeats and immunoglobulin-like domains 1 |
| chr11_+_73358594 | 4.19 |
ENST00000227214.6
ENST00000398494.4 ENST00000543085.1 |
PLEKHB1
|
pleckstrin homology domain containing, family B (evectins) member 1 |
| chr20_-_22565101 | 4.17 |
ENST00000419308.2
|
FOXA2
|
forkhead box A2 |
| chr4_-_170924888 | 4.11 |
ENST00000502832.1
ENST00000393704.3 |
MFAP3L
|
microfibrillar-associated protein 3-like |
| chr16_-_66968055 | 4.07 |
ENST00000568572.1
|
FAM96B
|
family with sequence similarity 96, member B |
| chr8_+_22428457 | 4.07 |
ENST00000517962.1
|
SORBS3
|
sorbin and SH3 domain containing 3 |
| chr12_-_8815215 | 4.03 |
ENST00000544889.1
ENST00000543369.1 |
MFAP5
|
microfibrillar associated protein 5 |
| chr16_-_4395905 | 4.01 |
ENST00000571941.1
|
PAM16
|
presequence translocase-associated motor 16 homolog (S. cerevisiae) |
| chr11_+_64073699 | 4.01 |
ENST00000405666.1
ENST00000468670.1 |
ESRRA
|
estrogen-related receptor alpha |
| chrX_-_132549506 | 3.97 |
ENST00000370828.3
|
GPC4
|
glypican 4 |
| chr2_-_85895295 | 3.93 |
ENST00000428225.1
ENST00000519937.2 |
SFTPB
|
surfactant protein B |
| chrX_-_53461305 | 3.86 |
ENST00000168216.6
|
HSD17B10
|
hydroxysteroid (17-beta) dehydrogenase 10 |
| chr3_-_66551397 | 3.85 |
ENST00000383703.3
|
LRIG1
|
leucine-rich repeats and immunoglobulin-like domains 1 |
| chr6_-_131321863 | 3.79 |
ENST00000528282.1
|
EPB41L2
|
erythrocyte membrane protein band 4.1-like 2 |
| chr10_-_97050777 | 3.78 |
ENST00000329399.6
|
PDLIM1
|
PDZ and LIM domain 1 |
| chr2_-_200322723 | 3.77 |
ENST00000417098.1
|
SATB2
|
SATB homeobox 2 |
| chr14_+_35452104 | 3.77 |
ENST00000216774.6
ENST00000546080.1 |
SRP54
|
signal recognition particle 54kDa |
| chr10_+_60028818 | 3.74 |
ENST00000333926.5
|
CISD1
|
CDGSH iron sulfur domain 1 |
| chr20_-_50385138 | 3.71 |
ENST00000338821.5
|
ATP9A
|
ATPase, class II, type 9A |
| chr12_-_8815299 | 3.71 |
ENST00000535336.1
|
MFAP5
|
microfibrillar associated protein 5 |
| chr8_-_124408652 | 3.68 |
ENST00000287394.5
|
ATAD2
|
ATPase family, AAA domain containing 2 |
| chr14_+_35452169 | 3.68 |
ENST00000555557.1
|
SRP54
|
signal recognition particle 54kDa |
| chr20_+_43343476 | 3.66 |
ENST00000372868.2
|
WISP2
|
WNT1 inducible signaling pathway protein 2 |
| chrX_-_134049262 | 3.66 |
ENST00000370783.3
|
MOSPD1
|
motile sperm domain containing 1 |
| chr1_+_155294264 | 3.64 |
ENST00000368349.4
|
RUSC1
|
RUN and SH3 domain containing 1 |
| chr12_+_121124921 | 3.62 |
ENST00000412616.2
|
MLEC
|
malectin |
| chr1_-_37499726 | 3.59 |
ENST00000373091.3
ENST00000373093.4 |
GRIK3
|
glutamate receptor, ionotropic, kainate 3 |
| chr17_+_39975455 | 3.55 |
ENST00000455106.1
|
FKBP10
|
FK506 binding protein 10, 65 kDa |
| chr11_+_114270752 | 3.54 |
ENST00000540163.1
|
RBM7
|
RNA binding motif protein 7 |
| chr17_+_39975544 | 3.54 |
ENST00000544340.1
|
FKBP10
|
FK506 binding protein 10, 65 kDa |
| chr20_+_44098346 | 3.53 |
ENST00000372676.3
|
WFDC2
|
WAP four-disulfide core domain 2 |
| chr8_-_27457494 | 3.52 |
ENST00000521770.1
|
CLU
|
clusterin |
| chr15_+_44092784 | 3.51 |
ENST00000458412.1
|
HYPK
|
huntingtin interacting protein K |
| chr12_-_7818474 | 3.50 |
ENST00000229304.4
|
APOBEC1
|
apolipoprotein B mRNA editing enzyme, catalytic polypeptide 1 |
| chr12_+_64798095 | 3.49 |
ENST00000332707.5
|
XPOT
|
exportin, tRNA |
| chr14_+_55034330 | 3.48 |
ENST00000251091.5
|
SAMD4A
|
sterile alpha motif domain containing 4A |
| chr3_+_52811596 | 3.48 |
ENST00000542827.1
ENST00000273283.2 |
ITIH1
|
inter-alpha-trypsin inhibitor heavy chain 1 |
| chr1_+_155294342 | 3.47 |
ENST00000292254.4
|
RUSC1
|
RUN and SH3 domain containing 1 |
| chr6_+_43739697 | 3.45 |
ENST00000230480.6
|
VEGFA
|
vascular endothelial growth factor A |
| chr7_-_87849340 | 3.43 |
ENST00000419179.1
ENST00000265729.2 |
SRI
|
sorcin |
| chr10_-_101190202 | 3.42 |
ENST00000543866.1
ENST00000370508.5 |
GOT1
|
glutamic-oxaloacetic transaminase 1, soluble |
| chr11_+_46402482 | 3.42 |
ENST00000441869.1
|
MDK
|
midkine (neurite growth-promoting factor 2) |
| chr8_-_49834299 | 3.42 |
ENST00000396822.1
|
SNAI2
|
snail family zinc finger 2 |
| chr9_+_131452239 | 3.37 |
ENST00000372688.4
ENST00000372686.5 |
SET
|
SET nuclear oncogene |
| chr11_+_117947724 | 3.27 |
ENST00000534111.1
|
TMPRSS4
|
transmembrane protease, serine 4 |
| chr1_-_12677714 | 3.24 |
ENST00000376223.2
|
DHRS3
|
dehydrogenase/reductase (SDR family) member 3 |
| chr12_-_71551652 | 3.21 |
ENST00000546561.1
|
TSPAN8
|
tetraspanin 8 |
| chr14_-_24664540 | 3.19 |
ENST00000530563.1
ENST00000528895.1 ENST00000528669.1 ENST00000532632.1 |
TM9SF1
|
transmembrane 9 superfamily member 1 |
| chr3_-_99833333 | 3.17 |
ENST00000354552.3
ENST00000331335.5 ENST00000398326.2 |
FILIP1L
|
filamin A interacting protein 1-like |
| chr19_-_41942344 | 3.16 |
ENST00000594660.1
|
ATP5SL
|
ATP5S-like |
| chr3_+_52719936 | 3.16 |
ENST00000418458.1
ENST00000394799.2 |
GNL3
|
guanine nucleotide binding protein-like 3 (nucleolar) |
| chr2_-_20251744 | 3.13 |
ENST00000175091.4
|
LAPTM4A
|
lysosomal protein transmembrane 4 alpha |
| chr16_+_2546033 | 3.11 |
ENST00000564543.1
ENST00000434757.2 |
RP11-20I23.1
TBC1D24
|
Uncharacterized protein TBC1 domain family, member 24 |
| chr16_+_67261008 | 3.09 |
ENST00000304800.9
ENST00000563953.1 ENST00000565201.1 |
TMEM208
|
transmembrane protein 208 |
| chr16_+_3162557 | 3.08 |
ENST00000382192.3
ENST00000219091.4 ENST00000444510.2 ENST00000414351.1 |
ZNF205
|
zinc finger protein 205 |
| chr1_-_226129189 | 3.08 |
ENST00000366820.5
|
LEFTY2
|
left-right determination factor 2 |
| chr1_+_155100342 | 3.08 |
ENST00000368406.2
|
EFNA1
|
ephrin-A1 |
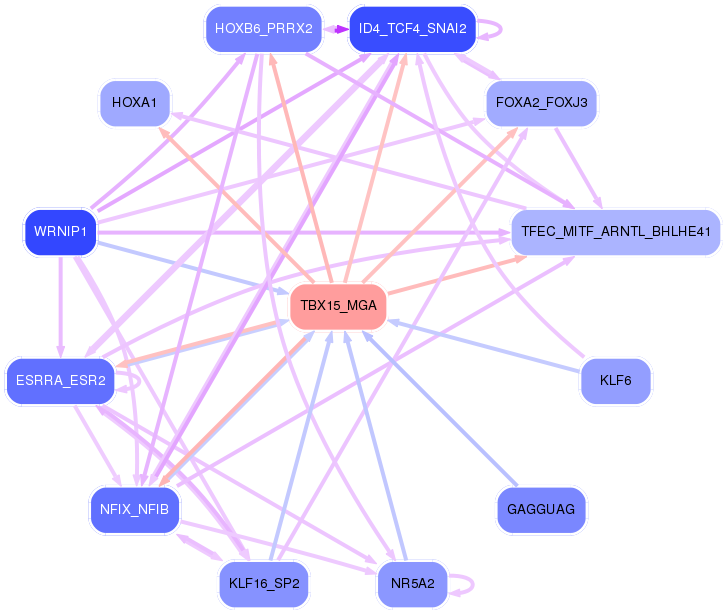
Network of associatons between targets according to the STRING database.

First level regulatory network of TBX15_MGA
Gene Ontology Analysis
Gene overrepresentation in biological_process category:
| Log-likelihood per target | Total log-likelihood | Term | Description |
|---|---|---|---|
| 8.2 | 32.7 | GO:0006780 | uroporphyrinogen III biosynthetic process(GO:0006780) uroporphyrinogen III metabolic process(GO:0046502) |
| 6.0 | 18.1 | GO:0006001 | fructose catabolic process(GO:0006001) fructose catabolic process to hydroxyacetone phosphate and glyceraldehyde-3-phosphate(GO:0061624) |
| 5.2 | 31.2 | GO:1902766 | skeletal muscle satellite cell migration(GO:1902766) |
| 5.0 | 24.9 | GO:1903588 | negative regulation of blood vessel endothelial cell proliferation involved in sprouting angiogenesis(GO:1903588) |
| 4.6 | 13.8 | GO:0006597 | spermine biosynthetic process(GO:0006597) |
| 4.2 | 16.7 | GO:0061289 | cell-cell signaling involved in kidney development(GO:0060995) Wnt signaling pathway involved in kidney development(GO:0061289) canonical Wnt signaling pathway involved in metanephric kidney development(GO:0061290) cell-cell signaling involved in metanephros development(GO:0072204) |
| 3.9 | 11.7 | GO:1905205 | positive regulation of connective tissue replacement(GO:1905205) |
| 3.8 | 19.0 | GO:1902896 | terminal web assembly(GO:1902896) |
| 3.8 | 11.3 | GO:1900138 | negative regulation of phospholipase A2 activity(GO:1900138) |
| 3.6 | 43.5 | GO:0035437 | maintenance of protein localization in endoplasmic reticulum(GO:0035437) |
| 3.6 | 47.1 | GO:0035826 | rubidium ion transport(GO:0035826) regulation of rubidium ion transport(GO:2000680) |
| 3.6 | 10.9 | GO:0009051 | pentose-phosphate shunt, oxidative branch(GO:0009051) |
| 3.4 | 20.2 | GO:0030421 | defecation(GO:0030421) |
| 2.8 | 8.4 | GO:0070901 | mitochondrial tRNA methylation(GO:0070901) |
| 2.7 | 8.1 | GO:0032474 | otolith morphogenesis(GO:0032474) |
| 2.6 | 26.1 | GO:0070973 | protein localization to endoplasmic reticulum exit site(GO:0070973) |
| 2.6 | 10.4 | GO:0044861 | protein transport into plasma membrane raft(GO:0044861) positive regulation of potassium ion import(GO:1903288) |
| 2.6 | 7.8 | GO:0044210 | 'de novo' CTP biosynthetic process(GO:0044210) |
| 2.5 | 7.4 | GO:0006617 | SRP-dependent cotranslational protein targeting to membrane, signal sequence recognition(GO:0006617) |
| 2.4 | 9.7 | GO:0010645 | regulation of cell communication by chemical coupling(GO:0010645) positive regulation of cell communication by chemical coupling(GO:0010652) |
| 2.4 | 14.3 | GO:0007079 | mitotic chromosome movement towards spindle pole(GO:0007079) |
| 2.4 | 9.5 | GO:0006238 | CMP salvage(GO:0006238) CMP biosynthetic process(GO:0009224) CMP metabolic process(GO:0046035) |
| 2.4 | 16.7 | GO:2000795 | trigeminal sensory nucleus development(GO:0021730) principal sensory nucleus of trigeminal nerve development(GO:0021740) negative regulation of epithelial cell proliferation involved in lung morphogenesis(GO:2000795) |
| 2.4 | 7.1 | GO:0000412 | histone peptidyl-prolyl isomerization(GO:0000412) |
| 2.2 | 13.0 | GO:0035803 | egg coat formation(GO:0035803) |
| 2.1 | 6.3 | GO:0007206 | phospholipase C-activating G-protein coupled glutamate receptor signaling pathway(GO:0007206) |
| 2.1 | 4.2 | GO:0045014 | carbon catabolite repression of transcription(GO:0045013) negative regulation of transcription by glucose(GO:0045014) |
| 2.1 | 10.3 | GO:0060574 | intestinal epithelial cell maturation(GO:0060574) |
| 2.0 | 13.9 | GO:0071896 | protein localization to adherens junction(GO:0071896) |
| 1.9 | 5.6 | GO:0070563 | negative regulation of vitamin D receptor signaling pathway(GO:0070563) |
| 1.8 | 14.7 | GO:0010032 | meiotic chromosome condensation(GO:0010032) |
| 1.8 | 20.2 | GO:0035360 | positive regulation of peroxisome proliferator activated receptor signaling pathway(GO:0035360) |
| 1.8 | 31.8 | GO:0000920 | cell separation after cytokinesis(GO:0000920) |
| 1.7 | 17.5 | GO:0051096 | positive regulation of helicase activity(GO:0051096) |
| 1.5 | 17.0 | GO:0032876 | negative regulation of DNA endoreduplication(GO:0032876) |
| 1.5 | 4.5 | GO:0045360 | regulation of interleukin-1 biosynthetic process(GO:0045360) positive regulation of interleukin-1 biosynthetic process(GO:0045362) |
| 1.4 | 17.3 | GO:0034975 | protein folding in endoplasmic reticulum(GO:0034975) |
| 1.4 | 15.3 | GO:2000210 | positive regulation of anoikis(GO:2000210) |
| 1.4 | 8.2 | GO:0017196 | N-terminal peptidyl-methionine acetylation(GO:0017196) |
| 1.3 | 5.4 | GO:0014028 | notochord formation(GO:0014028) |
| 1.3 | 6.3 | GO:0060800 | regulation of cell differentiation involved in embryonic placenta development(GO:0060800) |
| 1.2 | 4.8 | GO:2000483 | negative regulation of interleukin-8 secretion(GO:2000483) |
| 1.2 | 5.8 | GO:0003069 | age-dependent response to oxidative stress(GO:0001306) age-dependent response to reactive oxygen species(GO:0001315) regulation of systemic arterial blood pressure by acetylcholine(GO:0003068) vasodilation by acetylcholine involved in regulation of systemic arterial blood pressure(GO:0003069) regulation of systemic arterial blood pressure by neurotransmitter(GO:0003070) age-dependent general metabolic decline(GO:0007571) |
| 1.2 | 3.5 | GO:1903572 | regulation of protein kinase D signaling(GO:1903570) positive regulation of protein kinase D signaling(GO:1903572) |
| 1.1 | 6.9 | GO:2001256 | regulation of store-operated calcium entry(GO:2001256) |
| 1.1 | 3.4 | GO:0006106 | fumarate metabolic process(GO:0006106) glycerol biosynthetic process(GO:0006114) aspartate catabolic process(GO:0006533) |
| 1.1 | 5.6 | GO:1901662 | phylloquinone metabolic process(GO:0042374) phylloquinone catabolic process(GO:0042376) quinone catabolic process(GO:1901662) |
| 1.1 | 4.3 | GO:0042271 | susceptibility to natural killer cell mediated cytotoxicity(GO:0042271) |
| 1.1 | 25.4 | GO:0034315 | regulation of Arp2/3 complex-mediated actin nucleation(GO:0034315) |
| 1.0 | 3.1 | GO:0006624 | vacuolar protein processing(GO:0006624) |
| 1.0 | 4.1 | GO:0044375 | regulation of peroxisome size(GO:0044375) |
| 1.0 | 9.6 | GO:1903944 | regulation of hepatocyte apoptotic process(GO:1903943) negative regulation of hepatocyte apoptotic process(GO:1903944) |
| 0.9 | 9.4 | GO:0015865 | purine nucleotide transport(GO:0015865) purine ribonucleotide transport(GO:0015868) |
| 0.9 | 12.2 | GO:0035372 | protein localization to microtubule(GO:0035372) |
| 0.9 | 6.4 | GO:1902962 | regulation of metalloendopeptidase activity involved in amyloid precursor protein catabolic process(GO:1902962) negative regulation of metalloendopeptidase activity involved in amyloid precursor protein catabolic process(GO:1902963) |
| 0.9 | 4.4 | GO:0046340 | diacylglycerol catabolic process(GO:0046340) |
| 0.9 | 4.4 | GO:1990034 | calcium ion export from cell(GO:1990034) |
| 0.9 | 1.7 | GO:0016185 | synaptic vesicle budding from presynaptic endocytic zone membrane(GO:0016185) |
| 0.8 | 2.5 | GO:1990737 | response to manganese-induced endoplasmic reticulum stress(GO:1990737) |
| 0.8 | 4.1 | GO:0099590 | neurotransmitter receptor internalization(GO:0099590) |
| 0.8 | 9.7 | GO:1901223 | negative regulation of NIK/NF-kappaB signaling(GO:1901223) |
| 0.8 | 2.3 | GO:1900220 | semaphorin-plexin signaling pathway involved in bone trabecula morphogenesis(GO:1900220) |
| 0.8 | 1.6 | GO:0060300 | regulation of cytokine activity(GO:0060300) |
| 0.7 | 1.5 | GO:0003162 | atrioventricular node development(GO:0003162) |
| 0.7 | 7.2 | GO:0031936 | negative regulation of chromatin silencing(GO:0031936) |
| 0.7 | 3.5 | GO:0071431 | tRNA export from nucleus(GO:0006409) tRNA transport(GO:0051031) tRNA-containing ribonucleoprotein complex export from nucleus(GO:0071431) |
| 0.7 | 2.1 | GO:0061536 | glycine secretion(GO:0061536) glycine secretion, neurotransmission(GO:0061537) |
| 0.7 | 7.6 | GO:0021603 | cranial nerve formation(GO:0021603) |
| 0.7 | 2.0 | GO:1904933 | cardiac right atrium morphogenesis(GO:0003213) positive regulation of anagen(GO:0051885) mediolateral intercalation(GO:0060031) cervix development(GO:0060067) lateral sprouting involved in mammary gland duct morphogenesis(GO:0060599) planar cell polarity pathway involved in gastrula mediolateral intercalation(GO:0060775) regulation of cell proliferation in midbrain(GO:1904933) |
| 0.6 | 3.8 | GO:0061086 | negative regulation of histone H3-K27 methylation(GO:0061086) |
| 0.6 | 4.4 | GO:1904352 | positive regulation of protein catabolic process in the vacuole(GO:1904352) |
| 0.6 | 3.1 | GO:0010728 | regulation of hydrogen peroxide biosynthetic process(GO:0010728) |
| 0.6 | 0.6 | GO:0060266 | negative regulation of respiratory burst involved in inflammatory response(GO:0060266) |
| 0.6 | 3.5 | GO:1902996 | macrophage proliferation(GO:0061517) microglial cell proliferation(GO:0061518) regulation of neuronal signal transduction(GO:1902847) regulation of neurofibrillary tangle assembly(GO:1902996) positive regulation of neurofibrillary tangle assembly(GO:1902998) |
| 0.6 | 19.9 | GO:0008045 | motor neuron axon guidance(GO:0008045) |
| 0.6 | 1.2 | GO:0070245 | positive regulation of thymocyte apoptotic process(GO:0070245) |
| 0.6 | 2.3 | GO:0010982 | regulation of high-density lipoprotein particle clearance(GO:0010982) positive regulation of lipoprotein particle clearance(GO:0010986) |
| 0.6 | 2.8 | GO:0010286 | heat acclimation(GO:0010286) cellular heat acclimation(GO:0070370) |
| 0.6 | 1.1 | GO:2000354 | regulation of ovarian follicle development(GO:2000354) |
| 0.5 | 2.6 | GO:0019348 | dolichol metabolic process(GO:0019348) |
| 0.5 | 3.4 | GO:0097577 | intracellular sequestering of iron ion(GO:0006880) sequestering of iron ion(GO:0097577) |
| 0.5 | 1.9 | GO:0089700 | protein kinase D signaling(GO:0089700) |
| 0.5 | 12.1 | GO:0070886 | positive regulation of calcineurin-NFAT signaling cascade(GO:0070886) |
| 0.5 | 2.3 | GO:2000035 | regulation of stem cell division(GO:2000035) |
| 0.5 | 11.3 | GO:0000028 | ribosomal small subunit assembly(GO:0000028) |
| 0.4 | 1.3 | GO:2000309 | positive regulation of vitamin metabolic process(GO:0046136) positive regulation of vitamin D biosynthetic process(GO:0060557) positive regulation of calcidiol 1-monooxygenase activity(GO:0060559) positive regulation of tumor necrosis factor (ligand) superfamily member 11 production(GO:2000309) |
| 0.4 | 1.8 | GO:0043376 | regulation of CD8-positive, alpha-beta T cell differentiation(GO:0043376) |
| 0.4 | 18.4 | GO:0000188 | inactivation of MAPK activity(GO:0000188) |
| 0.4 | 1.7 | GO:0043324 | eye pigment biosynthetic process(GO:0006726) eye pigment metabolic process(GO:0042441) pigment metabolic process involved in developmental pigmentation(GO:0043324) pigment metabolic process involved in pigmentation(GO:0043474) |
| 0.4 | 25.8 | GO:0007566 | embryo implantation(GO:0007566) |
| 0.4 | 2.1 | GO:1903377 | negative regulation of oxidative stress-induced neuron intrinsic apoptotic signaling pathway(GO:1903377) |
| 0.4 | 13.3 | GO:0042776 | mitochondrial ATP synthesis coupled proton transport(GO:0042776) |
| 0.4 | 7.4 | GO:1990001 | inhibition of cysteine-type endopeptidase activity involved in apoptotic process(GO:1990001) |
| 0.4 | 3.6 | GO:0051967 | negative regulation of synaptic transmission, glutamatergic(GO:0051967) |
| 0.4 | 1.2 | GO:1900217 | pronephric field specification(GO:0039003) pattern specification involved in pronephros development(GO:0039017) thyroid-stimulating hormone secretion(GO:0070460) kidney rudiment formation(GO:0072003) kidney field specification(GO:0072004) regulation of mesenchymal cell apoptotic process involved in metanephric nephron morphogenesis(GO:0072304) negative regulation of mesenchymal cell apoptotic process involved in metanephric nephron morphogenesis(GO:0072305) mesenchymal stem cell maintenance involved in metanephric nephron morphogenesis(GO:0072309) mesenchymal cell apoptotic process involved in metanephros development(GO:1900200) apoptotic process involved in metanephric collecting duct development(GO:1900204) apoptotic process involved in metanephric nephron tubule development(GO:1900205) regulation of mesenchymal cell apoptotic process involved in metanephros development(GO:1900211) negative regulation of mesenchymal cell apoptotic process involved in metanephros development(GO:1900212) regulation of apoptotic process involved in metanephric collecting duct development(GO:1900214) negative regulation of apoptotic process involved in metanephric collecting duct development(GO:1900215) regulation of apoptotic process involved in metanephric nephron tubule development(GO:1900217) negative regulation of apoptotic process involved in metanephric nephron tubule development(GO:1900218) mesenchymal cell apoptotic process involved in metanephric nephron morphogenesis(GO:1901147) regulation of metanephric DCT cell differentiation(GO:2000592) positive regulation of metanephric DCT cell differentiation(GO:2000594) regulation of thyroid-stimulating hormone secretion(GO:2000612) |
| 0.4 | 1.9 | GO:0010587 | miRNA catabolic process(GO:0010587) |
| 0.4 | 1.5 | GO:0060671 | epithelial cell differentiation involved in embryonic placenta development(GO:0060671) epithelial cell morphogenesis involved in placental branching(GO:0060672) |
| 0.4 | 5.7 | GO:0032793 | positive regulation of CREB transcription factor activity(GO:0032793) |
| 0.4 | 3.8 | GO:0021902 | commitment of neuronal cell to specific neuron type in forebrain(GO:0021902) |
| 0.4 | 6.3 | GO:0010832 | negative regulation of myotube differentiation(GO:0010832) |
| 0.4 | 2.9 | GO:2000643 | positive regulation of early endosome to late endosome transport(GO:2000643) |
| 0.3 | 1.7 | GO:0031914 | negative regulation of synaptic plasticity(GO:0031914) |
| 0.3 | 1.0 | GO:1904204 | regulation of skeletal muscle hypertrophy(GO:1904204) |
| 0.3 | 1.7 | GO:0018125 | peptidyl-cysteine methylation(GO:0018125) positive regulation of neurotransmitter uptake(GO:0051582) positive regulation of dopamine uptake involved in synaptic transmission(GO:0051586) positive regulation of catecholamine uptake involved in synaptic transmission(GO:0051944) |
| 0.3 | 2.6 | GO:0018401 | peptidyl-proline hydroxylation to 4-hydroxy-L-proline(GO:0018401) |
| 0.3 | 1.0 | GO:0014878 | response to electrical stimulus involved in regulation of muscle adaptation(GO:0014878) |
| 0.3 | 7.0 | GO:0000185 | activation of MAPKKK activity(GO:0000185) |
| 0.3 | 1.6 | GO:0006696 | ergosterol biosynthetic process(GO:0006696) ergosterol metabolic process(GO:0008204) |
| 0.3 | 5.8 | GO:0016540 | protein autoprocessing(GO:0016540) |
| 0.3 | 2.3 | GO:0016926 | protein desumoylation(GO:0016926) |
| 0.3 | 5.6 | GO:0006465 | signal peptide processing(GO:0006465) |
| 0.3 | 0.6 | GO:0001507 | acetylcholine catabolic process in synaptic cleft(GO:0001507) acetylcholine catabolic process(GO:0006581) |
| 0.3 | 2.8 | GO:0048387 | negative regulation of retinoic acid receptor signaling pathway(GO:0048387) |
| 0.3 | 11.2 | GO:0090503 | RNA phosphodiester bond hydrolysis, exonucleolytic(GO:0090503) |
| 0.3 | 12.0 | GO:0000413 | protein peptidyl-prolyl isomerization(GO:0000413) |
| 0.3 | 3.8 | GO:1904776 | regulation of protein localization to cell cortex(GO:1904776) positive regulation of protein localization to cell cortex(GO:1904778) |
| 0.3 | 5.4 | GO:0030277 | maintenance of gastrointestinal epithelium(GO:0030277) |
| 0.3 | 0.5 | GO:1904504 | regulation of lipophagy(GO:1904502) positive regulation of lipophagy(GO:1904504) |
| 0.3 | 4.0 | GO:0030150 | protein import into mitochondrial matrix(GO:0030150) |
| 0.3 | 6.4 | GO:0043153 | entrainment of circadian clock by photoperiod(GO:0043153) |
| 0.3 | 5.3 | GO:0045723 | positive regulation of fatty acid biosynthetic process(GO:0045723) |
| 0.2 | 2.2 | GO:2000623 | regulation of nuclear-transcribed mRNA catabolic process, nonsense-mediated decay(GO:2000622) negative regulation of nuclear-transcribed mRNA catabolic process, nonsense-mediated decay(GO:2000623) |
| 0.2 | 4.9 | GO:0002089 | lens morphogenesis in camera-type eye(GO:0002089) |
| 0.2 | 21.2 | GO:0006890 | retrograde vesicle-mediated transport, Golgi to ER(GO:0006890) |
| 0.2 | 8.8 | GO:0060216 | definitive hemopoiesis(GO:0060216) |
| 0.2 | 3.2 | GO:0033235 | positive regulation of protein sumoylation(GO:0033235) |
| 0.2 | 2.5 | GO:0034498 | early endosome to Golgi transport(GO:0034498) |
| 0.2 | 0.7 | GO:0003199 | endocardial cushion to mesenchymal transition involved in heart valve formation(GO:0003199) |
| 0.2 | 2.2 | GO:0098914 | membrane repolarization during atrial cardiac muscle cell action potential(GO:0098914) |
| 0.2 | 2.9 | GO:2000194 | regulation of female gonad development(GO:2000194) |
| 0.2 | 2.0 | GO:1902416 | positive regulation of mRNA binding(GO:1902416) |
| 0.2 | 5.7 | GO:0001580 | detection of chemical stimulus involved in sensory perception of bitter taste(GO:0001580) |
| 0.2 | 5.7 | GO:0035067 | negative regulation of histone acetylation(GO:0035067) |
| 0.2 | 2.9 | GO:0090344 | negative regulation of cell aging(GO:0090344) |
| 0.2 | 1.9 | GO:0098814 | spontaneous neurotransmitter secretion(GO:0061669) spontaneous synaptic transmission(GO:0098814) |
| 0.2 | 1.2 | GO:0046208 | spermine catabolic process(GO:0046208) |
| 0.2 | 2.4 | GO:0060965 | negative regulation of gene silencing by miRNA(GO:0060965) |
| 0.2 | 5.1 | GO:0010714 | positive regulation of collagen metabolic process(GO:0010714) positive regulation of collagen biosynthetic process(GO:0032967) positive regulation of multicellular organismal metabolic process(GO:0044253) |
| 0.2 | 3.3 | GO:0002021 | response to dietary excess(GO:0002021) |
| 0.2 | 0.6 | GO:0006990 | positive regulation of transcription from RNA polymerase II promoter involved in unfolded protein response(GO:0006990) |
| 0.2 | 4.1 | GO:0031163 | iron-sulfur cluster assembly(GO:0016226) metallo-sulfur cluster assembly(GO:0031163) |
| 0.2 | 3.7 | GO:0043457 | regulation of cellular respiration(GO:0043457) |
| 0.2 | 0.7 | GO:2000860 | positive regulation of mineralocorticoid secretion(GO:2000857) positive regulation of aldosterone secretion(GO:2000860) |
| 0.2 | 0.6 | GO:1901877 | regulation of calcium ion binding(GO:1901876) negative regulation of calcium ion binding(GO:1901877) |
| 0.2 | 2.0 | GO:0002863 | positive regulation of inflammatory response to antigenic stimulus(GO:0002863) |
| 0.2 | 1.5 | GO:0002051 | osteoblast fate commitment(GO:0002051) |
| 0.2 | 12.9 | GO:0070126 | mitochondrial translational elongation(GO:0070125) mitochondrial translational termination(GO:0070126) |
| 0.2 | 1.1 | GO:1900748 | positive regulation of vascular endothelial growth factor signaling pathway(GO:1900748) |
| 0.2 | 0.9 | GO:0061085 | regulation of histone H3-K27 methylation(GO:0061085) positive regulation of histone H3-K27 methylation(GO:0061087) |
| 0.2 | 13.5 | GO:0032981 | NADH dehydrogenase complex assembly(GO:0010257) mitochondrial respiratory chain complex I assembly(GO:0032981) mitochondrial respiratory chain complex I biogenesis(GO:0097031) |
| 0.2 | 0.7 | GO:0014052 | regulation of gamma-aminobutyric acid secretion(GO:0014052) |
| 0.2 | 5.5 | GO:0001919 | regulation of receptor recycling(GO:0001919) |
| 0.2 | 1.2 | GO:0050915 | sensory perception of sour taste(GO:0050915) |
| 0.2 | 13.3 | GO:0006110 | regulation of glycolytic process(GO:0006110) |
| 0.2 | 1.4 | GO:0097647 | calcitonin family receptor signaling pathway(GO:0097646) amylin receptor signaling pathway(GO:0097647) |
| 0.2 | 2.0 | GO:0046951 | ketone body biosynthetic process(GO:0046951) |
| 0.2 | 1.1 | GO:1990592 | protein polyufmylation(GO:1990564) protein K69-linked ufmylation(GO:1990592) |
| 0.2 | 1.1 | GO:1900045 | negative regulation of histone ubiquitination(GO:0033183) negative regulation of protein K63-linked ubiquitination(GO:1900045) regulation of histone H2A K63-linked ubiquitination(GO:1901314) negative regulation of histone H2A K63-linked ubiquitination(GO:1901315) negative regulation of protein polyubiquitination(GO:1902915) |
| 0.2 | 1.2 | GO:0045599 | negative regulation of fat cell differentiation(GO:0045599) |
| 0.1 | 2.1 | GO:0043517 | positive regulation of DNA damage response, signal transduction by p53 class mediator(GO:0043517) |
| 0.1 | 5.1 | GO:0002053 | positive regulation of mesenchymal cell proliferation(GO:0002053) |
| 0.1 | 0.7 | GO:0035524 | proline transmembrane transport(GO:0035524) |
| 0.1 | 1.9 | GO:0006907 | pinocytosis(GO:0006907) |
| 0.1 | 0.4 | GO:0050760 | negative regulation of thymidylate synthase biosynthetic process(GO:0050760) |
| 0.1 | 2.2 | GO:0045116 | protein neddylation(GO:0045116) |
| 0.1 | 0.9 | GO:0032417 | positive regulation of sodium:proton antiporter activity(GO:0032417) |
| 0.1 | 2.3 | GO:0010592 | positive regulation of lamellipodium assembly(GO:0010592) |
| 0.1 | 0.1 | GO:0014806 | smooth muscle hyperplasia(GO:0014806) |
| 0.1 | 3.9 | GO:0003016 | respiratory system process(GO:0003016) |
| 0.1 | 3.5 | GO:0030866 | cortical actin cytoskeleton organization(GO:0030866) |
| 0.1 | 1.0 | GO:0009649 | entrainment of circadian clock(GO:0009649) |
| 0.1 | 5.9 | GO:0000381 | regulation of alternative mRNA splicing, via spliceosome(GO:0000381) |
| 0.1 | 0.4 | GO:0071505 | negative regulation of phosphatidylinositol biosynthetic process(GO:0010512) positive regulation of metanephric mesenchymal cell migration by platelet-derived growth factor receptor-beta signaling pathway(GO:0035793) response to mycophenolic acid(GO:0071505) cellular response to mycophenolic acid(GO:0071506) metanephric glomerular mesangial cell development(GO:0072255) reversible differentiation(GO:0090677) cell dedifferentiation involved in phenotypic switching(GO:0090678) regulation of metanephric mesenchymal cell migration by platelet-derived growth factor receptor-beta signaling pathway(GO:1900238) positive regulation of phenotypic switching(GO:1900241) regulation of vascular smooth muscle cell dedifferentiation(GO:1905174) positive regulation of vascular smooth muscle cell dedifferentiation(GO:1905176) vascular smooth muscle cell dedifferentiation(GO:1990936) positive regulation of metanephric mesenchymal cell migration(GO:2000591) |
| 0.1 | 6.8 | GO:0000186 | activation of MAPKK activity(GO:0000186) |
| 0.1 | 5.6 | GO:0030212 | hyaluronan metabolic process(GO:0030212) |
| 0.1 | 1.3 | GO:0071803 | positive regulation of podosome assembly(GO:0071803) |
| 0.1 | 5.8 | GO:1900047 | negative regulation of blood coagulation(GO:0030195) negative regulation of hemostasis(GO:1900047) |
| 0.1 | 0.4 | GO:0090050 | positive regulation of cell migration involved in sprouting angiogenesis(GO:0090050) |
| 0.1 | 2.5 | GO:0030252 | growth hormone secretion(GO:0030252) |
| 0.1 | 1.3 | GO:0014722 | regulation of skeletal muscle contraction by calcium ion signaling(GO:0014722) |
| 0.1 | 4.0 | GO:1900078 | positive regulation of cellular response to insulin stimulus(GO:1900078) |
| 0.1 | 9.1 | GO:0006521 | regulation of cellular amino acid metabolic process(GO:0006521) |
| 0.1 | 2.4 | GO:0043101 | purine-containing compound salvage(GO:0043101) |
| 0.1 | 2.8 | GO:0000027 | ribosomal large subunit assembly(GO:0000027) |
| 0.1 | 1.2 | GO:0045161 | neuronal ion channel clustering(GO:0045161) |
| 0.1 | 0.4 | GO:0043654 | recognition of apoptotic cell(GO:0043654) |
| 0.1 | 0.6 | GO:0038110 | interleukin-2-mediated signaling pathway(GO:0038110) |
| 0.1 | 2.6 | GO:0043403 | skeletal muscle tissue regeneration(GO:0043403) |
| 0.1 | 33.1 | GO:0043687 | post-translational protein modification(GO:0043687) |
| 0.1 | 1.1 | GO:0006703 | estrogen biosynthetic process(GO:0006703) |
| 0.1 | 1.9 | GO:0021680 | cerebellar Purkinje cell layer development(GO:0021680) |
| 0.1 | 6.5 | GO:1902653 | cholesterol biosynthetic process(GO:0006695) secondary alcohol biosynthetic process(GO:1902653) |
| 0.1 | 1.1 | GO:1903830 | magnesium ion transmembrane transport(GO:1903830) |
| 0.1 | 3.6 | GO:0010862 | positive regulation of pathway-restricted SMAD protein phosphorylation(GO:0010862) |
| 0.1 | 0.8 | GO:0015889 | cobalamin transport(GO:0015889) |
| 0.1 | 0.9 | GO:0036315 | cellular response to sterol(GO:0036315) |
| 0.1 | 7.3 | GO:0006694 | steroid biosynthetic process(GO:0006694) |
| 0.1 | 4.6 | GO:0051965 | positive regulation of synapse assembly(GO:0051965) |
| 0.1 | 1.0 | GO:0031290 | retinal ganglion cell axon guidance(GO:0031290) |
| 0.1 | 4.2 | GO:0007602 | phototransduction(GO:0007602) |
| 0.1 | 4.0 | GO:0060071 | Wnt signaling pathway, planar cell polarity pathway(GO:0060071) |
| 0.1 | 1.7 | GO:0000462 | maturation of SSU-rRNA from tricistronic rRNA transcript (SSU-rRNA, 5.8S rRNA, LSU-rRNA)(GO:0000462) |
| 0.1 | 0.1 | GO:1990641 | response to iron ion starvation(GO:1990641) |
| 0.1 | 0.2 | GO:0032203 | telomere formation via telomerase(GO:0032203) |
| 0.1 | 0.2 | GO:0001957 | intramembranous ossification(GO:0001957) direct ossification(GO:0036072) |
| 0.1 | 1.3 | GO:0051895 | negative regulation of focal adhesion assembly(GO:0051895) negative regulation of adherens junction organization(GO:1903392) |
| 0.1 | 4.2 | GO:0098773 | skin epidermis development(GO:0098773) |
| 0.1 | 6.1 | GO:0021987 | cerebral cortex development(GO:0021987) |
| 0.1 | 0.5 | GO:0021762 | substantia nigra development(GO:0021762) |
| 0.0 | 0.3 | GO:0071374 | cellular response to parathyroid hormone stimulus(GO:0071374) |
| 0.0 | 2.3 | GO:0006270 | DNA replication initiation(GO:0006270) |
| 0.0 | 0.8 | GO:0032006 | regulation of TOR signaling(GO:0032006) |
| 0.0 | 0.8 | GO:1902751 | positive regulation of cell cycle G2/M phase transition(GO:1902751) |
| 0.0 | 1.0 | GO:0000301 | retrograde transport, vesicle recycling within Golgi(GO:0000301) |
| 0.0 | 0.4 | GO:0008627 | intrinsic apoptotic signaling pathway in response to osmotic stress(GO:0008627) |
| 0.0 | 1.3 | GO:0006198 | cAMP catabolic process(GO:0006198) |
| 0.0 | 1.3 | GO:0007339 | binding of sperm to zona pellucida(GO:0007339) |
| 0.0 | 0.7 | GO:2000352 | negative regulation of endothelial cell apoptotic process(GO:2000352) |
| 0.0 | 0.7 | GO:0032008 | positive regulation of TOR signaling(GO:0032008) |
| 0.0 | 1.3 | GO:0038128 | ERBB2 signaling pathway(GO:0038128) |
| 0.0 | 1.9 | GO:0007416 | synapse assembly(GO:0007416) |
| 0.0 | 2.4 | GO:1902017 | regulation of cilium assembly(GO:1902017) |
| 0.0 | 4.2 | GO:0031032 | actomyosin structure organization(GO:0031032) |
| 0.0 | 0.7 | GO:0010972 | negative regulation of G2/M transition of mitotic cell cycle(GO:0010972) |
| 0.0 | 0.2 | GO:0014047 | glutamate secretion(GO:0014047) |
| 0.0 | 0.7 | GO:0034260 | negative regulation of GTPase activity(GO:0034260) |
| 0.0 | 2.1 | GO:0045727 | positive regulation of translation(GO:0045727) |
| 0.0 | 3.8 | GO:0007015 | actin filament organization(GO:0007015) |
| 0.0 | 0.7 | GO:0048678 | response to axon injury(GO:0048678) |
| 0.0 | 0.2 | GO:0034638 | phosphatidylcholine catabolic process(GO:0034638) |
| 0.0 | 0.4 | GO:0048791 | calcium ion-regulated exocytosis of neurotransmitter(GO:0048791) |
| 0.0 | 0.5 | GO:0007271 | synaptic transmission, cholinergic(GO:0007271) |
| 0.0 | 0.4 | GO:0048488 | synaptic vesicle endocytosis(GO:0048488) |
| 0.0 | 1.3 | GO:0002576 | platelet degranulation(GO:0002576) |
| 0.0 | 0.1 | GO:0060830 | ciliary receptor clustering involved in smoothened signaling pathway(GO:0060830) |
| 0.0 | 0.2 | GO:0018345 | protein palmitoylation(GO:0018345) |
| 0.0 | 0.6 | GO:0046513 | ceramide biosynthetic process(GO:0046513) |
| 0.0 | 0.5 | GO:0030521 | androgen receptor signaling pathway(GO:0030521) |
Gene overrepresentation in cellular_component category:
| Log-likelihood per target | Total log-likelihood | Term | Description |
|---|---|---|---|
| 4.1 | 49.8 | GO:0097487 | multivesicular body, internal vesicle(GO:0097487) |
| 3.4 | 10.3 | GO:0070557 | PCNA-p21 complex(GO:0070557) |
| 3.0 | 17.7 | GO:1990357 | terminal web(GO:1990357) |
| 2.6 | 2.6 | GO:0016222 | procollagen-proline 4-dioxygenase complex(GO:0016222) |
| 1.9 | 11.3 | GO:0031232 | extrinsic component of external side of plasma membrane(GO:0031232) extrinsic component of endosome membrane(GO:0031313) |
| 1.7 | 8.4 | GO:0030678 | mitochondrial ribonuclease P complex(GO:0030678) |
| 1.6 | 23.6 | GO:0005916 | fascia adherens(GO:0005916) |
| 1.5 | 14.7 | GO:0000796 | condensin complex(GO:0000796) |
| 1.4 | 19.8 | GO:0030663 | COPI-coated vesicle membrane(GO:0030663) |
| 1.3 | 25.6 | GO:0034663 | endoplasmic reticulum chaperone complex(GO:0034663) |
| 1.2 | 14.3 | GO:0031616 | spindle pole centrosome(GO:0031616) |
| 1.2 | 8.2 | GO:0031415 | NatA complex(GO:0031415) |
| 1.1 | 6.4 | GO:0070381 | endosome to plasma membrane transport vesicle(GO:0070381) |
| 1.0 | 12.3 | GO:0044300 | cerebellar mossy fiber(GO:0044300) |
| 1.0 | 4.0 | GO:0001405 | presequence translocase-associated import motor(GO:0001405) |
| 0.9 | 7.4 | GO:0005786 | signal recognition particle, endoplasmic reticulum targeting(GO:0005786) |
| 0.9 | 7.4 | GO:0032133 | chromosome passenger complex(GO:0032133) |
| 0.9 | 31.2 | GO:0032420 | stereocilium(GO:0032420) |
| 0.8 | 2.5 | GO:0005850 | eukaryotic translation initiation factor 2 complex(GO:0005850) |
| 0.8 | 30.8 | GO:0000421 | autophagosome membrane(GO:0000421) |
| 0.8 | 2.3 | GO:0036194 | muscle cell projection(GO:0036194) muscle cell projection membrane(GO:0036195) |
| 0.7 | 13.3 | GO:0000276 | mitochondrial proton-transporting ATP synthase complex, coupling factor F(o)(GO:0000276) |
| 0.7 | 5.8 | GO:0016012 | sarcoglycan complex(GO:0016012) |
| 0.7 | 5.1 | GO:0005787 | signal peptidase complex(GO:0005787) |
| 0.7 | 10.4 | GO:0005662 | DNA replication factor A complex(GO:0005662) |
| 0.7 | 3.4 | GO:0044326 | dendritic spine neck(GO:0044326) |
| 0.7 | 4.1 | GO:0071817 | MMXD complex(GO:0071817) |
| 0.7 | 13.3 | GO:0031588 | nucleotide-activated protein kinase complex(GO:0031588) |
| 0.7 | 3.9 | GO:0097208 | alveolar lamellar body(GO:0097208) |
| 0.6 | 9.7 | GO:0090543 | Flemming body(GO:0090543) |
| 0.6 | 6.4 | GO:0072357 | PTW/PP1 phosphatase complex(GO:0072357) |
| 0.6 | 8.1 | GO:0031209 | SCAR complex(GO:0031209) |
| 0.6 | 2.3 | GO:0097135 | cyclin E2-CDK2 complex(GO:0097135) |
| 0.5 | 2.7 | GO:0045272 | plasma membrane respiratory chain complex I(GO:0045272) |
| 0.5 | 9.6 | GO:0097342 | ripoptosome(GO:0097342) |
| 0.5 | 10.4 | GO:0005890 | sodium:potassium-exchanging ATPase complex(GO:0005890) |
| 0.5 | 2.5 | GO:0030905 | retromer, tubulation complex(GO:0030905) |
| 0.5 | 8.4 | GO:0005922 | connexon complex(GO:0005922) |
| 0.5 | 0.5 | GO:0098805 | membrane region(GO:0098589) whole membrane(GO:0098805) |
| 0.4 | 11.3 | GO:0005763 | organellar small ribosomal subunit(GO:0000314) mitochondrial small ribosomal subunit(GO:0005763) |
| 0.4 | 23.2 | GO:0005871 | kinesin complex(GO:0005871) |
| 0.4 | 2.4 | GO:1902560 | GMP reductase complex(GO:1902560) |
| 0.4 | 8.8 | GO:0043205 | microfibril(GO:0001527) fibril(GO:0043205) |
| 0.4 | 2.9 | GO:0098559 | cytoplasmic side of early endosome membrane(GO:0098559) |
| 0.3 | 18.9 | GO:0005801 | cis-Golgi network(GO:0005801) |
| 0.3 | 12.9 | GO:0005762 | organellar large ribosomal subunit(GO:0000315) mitochondrial large ribosomal subunit(GO:0005762) |
| 0.3 | 17.5 | GO:0042645 | nucleoid(GO:0009295) mitochondrial nucleoid(GO:0042645) |
| 0.3 | 2.9 | GO:0042567 | insulin-like growth factor ternary complex(GO:0042567) |
| 0.3 | 4.4 | GO:0097038 | perinuclear endoplasmic reticulum(GO:0097038) |
| 0.3 | 1.2 | GO:0032432 | actin filament bundle(GO:0032432) |
| 0.3 | 3.5 | GO:0097418 | neurofibrillary tangle(GO:0097418) |
| 0.3 | 2.3 | GO:0043196 | varicosity(GO:0043196) |
| 0.3 | 4.1 | GO:0030122 | AP-2 adaptor complex(GO:0030122) |
| 0.3 | 3.8 | GO:0008091 | spectrin(GO:0008091) |
| 0.3 | 2.1 | GO:0042382 | paraspeckles(GO:0042382) |
| 0.3 | 8.4 | GO:0005839 | proteasome core complex(GO:0005839) |
| 0.2 | 6.2 | GO:0030867 | rough endoplasmic reticulum membrane(GO:0030867) |
| 0.2 | 4.5 | GO:0048770 | melanosome(GO:0042470) pigment granule(GO:0048770) |
| 0.2 | 2.3 | GO:0002116 | semaphorin receptor complex(GO:0002116) |
| 0.2 | 3.2 | GO:0042622 | photoreceptor outer segment membrane(GO:0042622) |
| 0.2 | 5.2 | GO:0005779 | integral component of peroxisomal membrane(GO:0005779) intrinsic component of peroxisomal membrane(GO:0031231) |
| 0.2 | 68.7 | GO:0005788 | endoplasmic reticulum lumen(GO:0005788) |
| 0.2 | 15.4 | GO:0031093 | platelet alpha granule lumen(GO:0031093) |
| 0.2 | 1.5 | GO:0031931 | TORC1 complex(GO:0031931) |
| 0.2 | 10.8 | GO:0005747 | mitochondrial respiratory chain complex I(GO:0005747) NADH dehydrogenase complex(GO:0030964) respiratory chain complex I(GO:0045271) |
| 0.2 | 4.9 | GO:0046658 | anchored component of plasma membrane(GO:0046658) |
| 0.2 | 1.8 | GO:0090665 | dystrophin-associated glycoprotein complex(GO:0016010) glycoprotein complex(GO:0090665) |
| 0.2 | 3.6 | GO:0032839 | dendrite cytoplasm(GO:0032839) |
| 0.2 | 8.8 | GO:0019005 | SCF ubiquitin ligase complex(GO:0019005) |
| 0.2 | 9.1 | GO:0005881 | cytoplasmic microtubule(GO:0005881) |
| 0.2 | 4.0 | GO:0035098 | ESC/E(Z) complex(GO:0035098) |
| 0.2 | 3.3 | GO:0032591 | dendritic spine membrane(GO:0032591) |
| 0.1 | 8.0 | GO:0000922 | spindle pole(GO:0000922) |
| 0.1 | 7.5 | GO:0005791 | rough endoplasmic reticulum(GO:0005791) |
| 0.1 | 0.4 | GO:1990761 | growth cone lamellipodium(GO:1990761) |
| 0.1 | 6.1 | GO:0043034 | costamere(GO:0043034) |
| 0.1 | 0.5 | GO:0031211 | serine C-palmitoyltransferase complex(GO:0017059) endoplasmic reticulum palmitoyltransferase complex(GO:0031211) |
| 0.1 | 4.0 | GO:0045171 | intercellular bridge(GO:0045171) |
| 0.1 | 10.9 | GO:0032588 | trans-Golgi network membrane(GO:0032588) |
| 0.1 | 1.7 | GO:0045009 | melanosome membrane(GO:0033162) chitosome(GO:0045009) |
| 0.1 | 23.4 | GO:0043209 | myelin sheath(GO:0043209) |
| 0.1 | 1.0 | GO:0000124 | SAGA complex(GO:0000124) transcription factor TFTC complex(GO:0033276) |
| 0.1 | 6.2 | GO:0016328 | lateral plasma membrane(GO:0016328) |
| 0.1 | 14.6 | GO:0031674 | I band(GO:0031674) |
| 0.1 | 1.2 | GO:0005581 | collagen trimer(GO:0005581) |
| 0.1 | 1.6 | GO:1990124 | messenger ribonucleoprotein complex(GO:1990124) |
| 0.1 | 4.6 | GO:0031594 | neuromuscular junction(GO:0031594) |
| 0.1 | 2.0 | GO:0005852 | eukaryotic translation initiation factor 3 complex(GO:0005852) |
| 0.1 | 3.1 | GO:0071339 | MLL1/2 complex(GO:0044665) MLL1 complex(GO:0071339) |
| 0.1 | 0.8 | GO:0097550 | transcriptional preinitiation complex(GO:0097550) |
| 0.1 | 1.5 | GO:0005640 | nuclear outer membrane(GO:0005640) |
| 0.1 | 0.7 | GO:0008541 | proteasome regulatory particle, lid subcomplex(GO:0008541) |
| 0.1 | 6.6 | GO:0042641 | actomyosin(GO:0042641) |
| 0.1 | 2.0 | GO:0001772 | immunological synapse(GO:0001772) |
| 0.1 | 1.4 | GO:0070822 | Sin3-type complex(GO:0070822) |
| 0.1 | 4.4 | GO:0005913 | cell-cell adherens junction(GO:0005913) |
| 0.1 | 0.4 | GO:0033268 | node of Ranvier(GO:0033268) |
| 0.1 | 1.7 | GO:0032040 | small-subunit processome(GO:0032040) |
| 0.0 | 3.5 | GO:0005758 | mitochondrial intermembrane space(GO:0005758) |
| 0.0 | 2.7 | GO:0005643 | nuclear pore(GO:0005643) |
| 0.0 | 14.5 | GO:0031965 | nuclear membrane(GO:0031965) |
| 0.0 | 0.1 | GO:0031213 | RSF complex(GO:0031213) |
| 0.0 | 3.6 | GO:0035579 | specific granule membrane(GO:0035579) |
| 0.0 | 1.2 | GO:0005669 | transcription factor TFIID complex(GO:0005669) |
| 0.0 | 0.7 | GO:0034451 | centriolar satellite(GO:0034451) |
| 0.0 | 2.6 | GO:0005811 | lipid particle(GO:0005811) |
| 0.0 | 7.3 | GO:0009898 | cytoplasmic side of plasma membrane(GO:0009898) |
| 0.0 | 0.2 | GO:0036021 | endolysosome lumen(GO:0036021) |
| 0.0 | 3.7 | GO:0000932 | cytoplasmic mRNA processing body(GO:0000932) |
| 0.0 | 43.8 | GO:0005794 | Golgi apparatus(GO:0005794) |
| 0.0 | 5.2 | GO:0098793 | presynapse(GO:0098793) |
| 0.0 | 0.3 | GO:0005751 | mitochondrial respiratory chain complex IV(GO:0005751) |
| 0.0 | 18.2 | GO:0005789 | endoplasmic reticulum membrane(GO:0005789) nuclear outer membrane-endoplasmic reticulum membrane network(GO:0042175) |
| 0.0 | 0.1 | GO:0045179 | apical cortex(GO:0045179) |
| 0.0 | 2.8 | GO:0022625 | cytosolic large ribosomal subunit(GO:0022625) |
| 0.0 | 1.7 | GO:0043679 | axon terminus(GO:0043679) |
| 0.0 | 1.6 | GO:0016363 | nuclear matrix(GO:0016363) |
| 0.0 | 0.4 | GO:0005905 | clathrin-coated pit(GO:0005905) |
| 0.0 | 3.3 | GO:0005578 | proteinaceous extracellular matrix(GO:0005578) |
Gene overrepresentation in molecular_function category:
| Log-likelihood per target | Total log-likelihood | Term | Description |
|---|---|---|---|
| 10.9 | 32.7 | GO:0004775 | succinate-CoA ligase (ADP-forming) activity(GO:0004775) |
| 8.8 | 35.2 | GO:0005046 | KDEL sequence binding(GO:0005046) |
| 4.6 | 13.9 | GO:0004045 | aminoacyl-tRNA hydrolase activity(GO:0004045) |
| 3.6 | 10.9 | GO:0004345 | glucose-6-phosphate dehydrogenase activity(GO:0004345) |
| 3.5 | 17.4 | GO:0018479 | benzaldehyde dehydrogenase (NAD+) activity(GO:0018479) |
| 3.4 | 10.3 | GO:0019912 | cyclin-dependent protein kinase activating kinase activity(GO:0019912) |
| 2.6 | 7.8 | GO:0003883 | CTP synthase activity(GO:0003883) |
| 2.3 | 9.4 | GO:0019828 | aspartic-type endopeptidase inhibitor activity(GO:0019828) |
| 1.9 | 11.3 | GO:0019834 | phospholipase A2 inhibitor activity(GO:0019834) |
| 1.9 | 5.6 | GO:0000253 | 3-keto sterol reductase activity(GO:0000253) |
| 1.6 | 9.7 | GO:0086075 | gap junction channel activity involved in cardiac conduction electrical coupling(GO:0086075) |
| 1.6 | 17.3 | GO:0046790 | virion binding(GO:0046790) |
| 1.5 | 13.9 | GO:0086083 | cell adhesive protein binding involved in bundle of His cell-Purkinje myocyte communication(GO:0086083) |
| 1.5 | 7.4 | GO:0030942 | endoplasmic reticulum signal peptide binding(GO:0030942) |
| 1.5 | 4.5 | GO:0031731 | CCR6 chemokine receptor binding(GO:0031731) |
| 1.4 | 13.0 | GO:0032190 | acrosin binding(GO:0032190) |
| 1.4 | 20.2 | GO:0042975 | peroxisome proliferator activated receptor binding(GO:0042975) |
| 1.4 | 9.5 | GO:0004849 | uridine kinase activity(GO:0004849) |
| 1.2 | 18.4 | GO:0017017 | MAP kinase tyrosine/serine/threonine phosphatase activity(GO:0017017) |
| 1.1 | 3.4 | GO:0080130 | phosphatidylserine decarboxylase activity(GO:0004609) L-phenylalanine aminotransferase activity(GO:0070546) L-phenylalanine:2-oxoglutarate aminotransferase activity(GO:0080130) |
| 1.0 | 13.3 | GO:0004679 | AMP-activated protein kinase activity(GO:0004679) |
| 0.9 | 8.4 | GO:0005243 | gap junction channel activity(GO:0005243) |
| 0.9 | 11.7 | GO:0016018 | cyclosporin A binding(GO:0016018) |
| 0.9 | 2.6 | GO:0003976 | UDP-N-acetylglucosamine-lysosomal-enzyme N-acetylglucosaminephosphotransferase activity(GO:0003976) |
| 0.9 | 17.4 | GO:0070273 | phosphatidylinositol-4-phosphate binding(GO:0070273) |
| 0.8 | 5.0 | GO:0052650 | NADP-retinol dehydrogenase activity(GO:0052650) |
| 0.8 | 10.2 | GO:0038132 | neuregulin binding(GO:0038132) |
| 0.7 | 6.3 | GO:0043426 | MRF binding(GO:0043426) |
| 0.7 | 2.1 | GO:0061629 | RNA polymerase II sequence-specific DNA binding transcription factor binding(GO:0061629) |
| 0.7 | 19.8 | GO:0005528 | macrolide binding(GO:0005527) FK506 binding(GO:0005528) |
| 0.7 | 4.0 | GO:1904929 | coreceptor activity involved in Wnt signaling pathway, planar cell polarity pathway(GO:1904929) |
| 0.6 | 10.4 | GO:0005391 | sodium:potassium-exchanging ATPase activity(GO:0005391) |
| 0.6 | 5.8 | GO:0016721 | superoxide dismutase activity(GO:0004784) oxidoreductase activity, acting on superoxide radicals as acceptor(GO:0016721) |
| 0.6 | 8.2 | GO:0004596 | peptide alpha-N-acetyltransferase activity(GO:0004596) |
| 0.6 | 26.5 | GO:0046875 | ephrin receptor binding(GO:0046875) |
| 0.6 | 3.5 | GO:0043183 | vascular endothelial growth factor receptor 1 binding(GO:0043183) |
| 0.6 | 5.7 | GO:0005005 | transmembrane-ephrin receptor activity(GO:0005005) |
| 0.5 | 6.4 | GO:0032050 | clathrin heavy chain binding(GO:0032050) |
| 0.5 | 5.7 | GO:0033038 | bitter taste receptor activity(GO:0033038) |
| 0.5 | 2.1 | GO:0015375 | glycine:sodium symporter activity(GO:0015375) |
| 0.5 | 2.6 | GO:0019798 | procollagen-proline 4-dioxygenase activity(GO:0004656) procollagen-proline dioxygenase activity(GO:0019798) |
| 0.5 | 3.6 | GO:0001640 | adenylate cyclase inhibiting G-protein coupled glutamate receptor activity(GO:0001640) kainate selective glutamate receptor activity(GO:0015277) G-protein coupled glutamate receptor activity(GO:0098988) |
| 0.5 | 3.5 | GO:0004126 | cytidine deaminase activity(GO:0004126) |
| 0.5 | 2.5 | GO:1990460 | leptin receptor binding(GO:1990460) |
| 0.5 | 1.9 | GO:0070653 | high-density lipoprotein particle receptor binding(GO:0070653) |
| 0.5 | 1.9 | GO:0004461 | lactose synthase activity(GO:0004461) |
| 0.4 | 2.2 | GO:0016286 | small conductance calcium-activated potassium channel activity(GO:0016286) |
| 0.4 | 2.7 | GO:0050291 | sphingosine N-acyltransferase activity(GO:0050291) |
| 0.4 | 8.4 | GO:0003857 | 3-hydroxyacyl-CoA dehydrogenase activity(GO:0003857) |
| 0.4 | 3.8 | GO:0042731 | PH domain binding(GO:0042731) |
| 0.4 | 5.0 | GO:0035256 | G-protein coupled glutamate receptor binding(GO:0035256) |
| 0.4 | 2.4 | GO:0016657 | GMP reductase activity(GO:0003920) oxidoreductase activity, acting on NAD(P)H, nitrogenous group as acceptor(GO:0016657) |
| 0.4 | 2.0 | GO:0046912 | transferase activity, transferring acyl groups, acyl groups converted into alkyl on transfer(GO:0046912) |
| 0.4 | 1.6 | GO:0004310 | farnesyl-diphosphate farnesyltransferase activity(GO:0004310) squalene synthase activity(GO:0051996) |
| 0.4 | 1.2 | GO:0052894 | norspermine:oxygen oxidoreductase activity(GO:0052894) N1-acetylspermine:oxygen oxidoreductase (N1-acetylspermidine-forming) activity(GO:0052895) |
| 0.4 | 7.0 | GO:0008349 | MAP kinase kinase kinase kinase activity(GO:0008349) |
| 0.3 | 1.0 | GO:0015230 | FAD transmembrane transporter activity(GO:0015230) coenzyme transporter activity(GO:0051185) |
| 0.3 | 1.0 | GO:0004711 | ribosomal protein S6 kinase activity(GO:0004711) |
| 0.3 | 7.3 | GO:0000062 | fatty-acyl-CoA binding(GO:0000062) |
| 0.3 | 9.6 | GO:0097200 | cysteine-type endopeptidase activity involved in execution phase of apoptosis(GO:0097200) |
| 0.3 | 8.6 | GO:0005520 | insulin-like growth factor binding(GO:0005520) |
| 0.3 | 4.3 | GO:0030280 | structural constituent of epidermis(GO:0030280) |
| 0.3 | 6.4 | GO:0051537 | 2 iron, 2 sulfur cluster binding(GO:0051537) |
| 0.3 | 11.2 | GO:0000175 | 3'-5'-exoribonuclease activity(GO:0000175) |
| 0.3 | 4.8 | GO:0032036 | myosin heavy chain binding(GO:0032036) |
| 0.3 | 2.3 | GO:0016929 | SUMO-specific protease activity(GO:0016929) |
| 0.3 | 23.2 | GO:0003777 | microtubule motor activity(GO:0003777) |
| 0.3 | 4.8 | GO:0004859 | phospholipase inhibitor activity(GO:0004859) |
| 0.2 | 46.2 | GO:0008201 | heparin binding(GO:0008201) |
| 0.2 | 1.2 | GO:0044736 | acid-sensing ion channel activity(GO:0044736) |
| 0.2 | 4.1 | GO:0098748 | clathrin adaptor activity(GO:0035615) endocytic adaptor activity(GO:0098748) |
| 0.2 | 6.4 | GO:0008157 | protein phosphatase 1 binding(GO:0008157) |
| 0.2 | 5.4 | GO:0008093 | cytoskeletal adaptor activity(GO:0008093) |
| 0.2 | 10.7 | GO:0008536 | Ran GTPase binding(GO:0008536) |
| 0.2 | 0.7 | GO:0031871 | proteinase activated receptor binding(GO:0031871) |
| 0.2 | 2.3 | GO:0017154 | semaphorin receptor activity(GO:0017154) |
| 0.2 | 3.5 | GO:0050750 | low-density lipoprotein particle receptor binding(GO:0050750) |
| 0.2 | 2.3 | GO:0047372 | acylglycerol lipase activity(GO:0047372) |
| 0.2 | 7.0 | GO:0043539 | protein serine/threonine kinase activator activity(GO:0043539) |
| 0.2 | 7.8 | GO:0004198 | calcium-dependent cysteine-type endopeptidase activity(GO:0004198) |
| 0.2 | 6.8 | GO:0004709 | MAP kinase kinase kinase activity(GO:0004709) |
| 0.2 | 2.7 | GO:0098641 | cadherin binding involved in cell-cell adhesion(GO:0098641) |
| 0.2 | 30.7 | GO:0047485 | protein N-terminus binding(GO:0047485) |
| 0.2 | 28.8 | GO:0005200 | structural constituent of cytoskeleton(GO:0005200) |
| 0.2 | 2.8 | GO:0008307 | structural constituent of muscle(GO:0008307) |
| 0.2 | 0.5 | GO:0004758 | serine C-palmitoyltransferase activity(GO:0004758) C-palmitoyltransferase activity(GO:0016454) |
| 0.2 | 1.9 | GO:0002151 | G-quadruplex RNA binding(GO:0002151) |
| 0.2 | 15.0 | GO:0004867 | serine-type endopeptidase inhibitor activity(GO:0004867) |
| 0.2 | 2.7 | GO:0005537 | mannose binding(GO:0005537) |
| 0.2 | 1.2 | GO:0004996 | thyroid-stimulating hormone receptor activity(GO:0004996) |
| 0.2 | 17.4 | GO:0017048 | Rho GTPase binding(GO:0017048) |
| 0.2 | 7.6 | GO:0050136 | NADH dehydrogenase (ubiquinone) activity(GO:0008137) NADH dehydrogenase (quinone) activity(GO:0050136) |
| 0.2 | 13.8 | GO:0016765 | transferase activity, transferring alkyl or aryl (other than methyl) groups(GO:0016765) |
| 0.2 | 3.3 | GO:0005159 | insulin-like growth factor receptor binding(GO:0005159) |
| 0.2 | 0.9 | GO:0008142 | oxysterol binding(GO:0008142) |
| 0.2 | 10.4 | GO:0019843 | rRNA binding(GO:0019843) |
| 0.2 | 1.2 | GO:0035727 | lysophosphatidic acid binding(GO:0035727) |
| 0.2 | 4.4 | GO:0005388 | calcium-transporting ATPase activity(GO:0005388) |
| 0.2 | 0.6 | GO:0019976 | interleukin-2 receptor activity(GO:0004911) interleukin-2 binding(GO:0019976) |
| 0.1 | 46.5 | GO:0003924 | GTPase activity(GO:0003924) |
| 0.1 | 5.7 | GO:0004864 | protein phosphatase inhibitor activity(GO:0004864) |
| 0.1 | 0.7 | GO:0015193 | L-proline transmembrane transporter activity(GO:0015193) |
| 0.1 | 3.3 | GO:0004012 | phospholipid-translocating ATPase activity(GO:0004012) |
| 0.1 | 7.4 | GO:0005044 | scavenger receptor activity(GO:0005044) |
| 0.1 | 17.5 | GO:0003697 | single-stranded DNA binding(GO:0003697) |
| 0.1 | 2.2 | GO:0008494 | translation activator activity(GO:0008494) |
| 0.1 | 2.0 | GO:0048018 | receptor agonist activity(GO:0048018) |
| 0.1 | 6.0 | GO:0016709 | oxidoreductase activity, acting on paired donors, with incorporation or reduction of molecular oxygen, NAD(P)H as one donor, and incorporation of one atom of oxygen(GO:0016709) |
| 0.1 | 11.2 | GO:0004866 | endopeptidase inhibitor activity(GO:0004866) |
| 0.1 | 1.5 | GO:0001161 | intronic transcription regulatory region sequence-specific DNA binding(GO:0001161) intronic transcription regulatory region DNA binding(GO:0044213) |
| 0.1 | 1.3 | GO:0097109 | neuroligin family protein binding(GO:0097109) |
| 0.1 | 0.9 | GO:0046976 | histone methyltransferase activity (H3-K27 specific)(GO:0046976) |
| 0.1 | 1.6 | GO:0035198 | miRNA binding(GO:0035198) |
| 0.1 | 0.8 | GO:0038052 | RNA polymerase II transcription factor activity, estrogen-activated sequence-specific DNA binding(GO:0038052) |
| 0.1 | 8.8 | GO:0005201 | extracellular matrix structural constituent(GO:0005201) |
| 0.1 | 15.6 | GO:0003735 | structural constituent of ribosome(GO:0003735) |
| 0.1 | 3.4 | GO:0043022 | ribosome binding(GO:0043022) |
| 0.1 | 0.5 | GO:0004882 | androgen receptor activity(GO:0004882) |
| 0.1 | 1.1 | GO:0015095 | magnesium ion transmembrane transporter activity(GO:0015095) |
| 0.1 | 1.9 | GO:0004697 | protein kinase C activity(GO:0004697) |
| 0.1 | 9.0 | GO:0005525 | GTP binding(GO:0005525) |
| 0.1 | 0.8 | GO:0031419 | cobalamin binding(GO:0031419) |
| 0.1 | 0.2 | GO:0033878 | hormone-sensitive lipase activity(GO:0033878) |
| 0.1 | 2.3 | GO:0016538 | cyclin-dependent protein serine/threonine kinase regulator activity(GO:0016538) |
| 0.1 | 0.7 | GO:0004332 | fructose-bisphosphate aldolase activity(GO:0004332) |
| 0.1 | 3.8 | GO:0035064 | methylated histone binding(GO:0035064) |
| 0.1 | 5.4 | GO:0005070 | SH3/SH2 adaptor activity(GO:0005070) |
| 0.1 | 1.0 | GO:0038191 | neuropilin binding(GO:0038191) |
| 0.1 | 0.4 | GO:0016176 | superoxide-generating NADPH oxidase activator activity(GO:0016176) platelet-derived growth factor binding(GO:0048407) |
| 0.1 | 2.5 | GO:0004693 | cyclin-dependent protein serine/threonine kinase activity(GO:0004693) |
| 0.1 | 1.3 | GO:0004115 | 3',5'-cyclic-AMP phosphodiesterase activity(GO:0004115) |
| 0.1 | 1.4 | GO:0051059 | NF-kappaB binding(GO:0051059) |
| 0.0 | 0.3 | GO:1990381 | ubiquitin-specific protease binding(GO:1990381) |
| 0.0 | 5.2 | GO:0005179 | hormone activity(GO:0005179) |
| 0.0 | 0.1 | GO:0004392 | heme oxygenase (decyclizing) activity(GO:0004392) |
| 0.0 | 5.6 | GO:0044325 | ion channel binding(GO:0044325) |
| 0.0 | 0.8 | GO:0070064 | proline-rich region binding(GO:0070064) |
| 0.0 | 8.3 | GO:0004721 | phosphoprotein phosphatase activity(GO:0004721) |
| 0.0 | 1.5 | GO:0019888 | protein phosphatase regulator activity(GO:0019888) |
| 0.0 | 2.4 | GO:0051117 | ATPase binding(GO:0051117) |
| 0.0 | 12.4 | GO:0016887 | ATPase activity(GO:0016887) |
| 0.0 | 5.9 | GO:0008017 | microtubule binding(GO:0008017) |
| 0.0 | 0.3 | GO:0004691 | cAMP-dependent protein kinase activity(GO:0004691) |
| 0.0 | 4.3 | GO:0008083 | growth factor activity(GO:0008083) |
| 0.0 | 0.6 | GO:0035497 | cAMP response element binding(GO:0035497) |
| 0.0 | 0.7 | GO:0000983 | transcription factor activity, RNA polymerase II core promoter sequence-specific(GO:0000983) |
| 0.0 | 0.8 | GO:0050699 | WW domain binding(GO:0050699) |
| 0.0 | 2.3 | GO:0001104 | RNA polymerase II transcription cofactor activity(GO:0001104) |
| 0.0 | 1.0 | GO:0004402 | histone acetyltransferase activity(GO:0004402) |
| 0.0 | 3.8 | GO:0017016 | Ras GTPase binding(GO:0017016) |
| 0.0 | 2.0 | GO:0005496 | steroid binding(GO:0005496) |
| 0.0 | 0.2 | GO:0001968 | fibronectin binding(GO:0001968) |
| 0.0 | 3.6 | GO:0004252 | serine-type endopeptidase activity(GO:0004252) |
| 0.0 | 0.7 | GO:0005518 | collagen binding(GO:0005518) |
| 0.0 | 1.5 | GO:0051082 | unfolded protein binding(GO:0051082) |
| 0.0 | 0.7 | GO:0005507 | copper ion binding(GO:0005507) |
| 0.0 | 0.4 | GO:0030276 | clathrin binding(GO:0030276) |
| 0.0 | 4.0 | GO:0003779 | actin binding(GO:0003779) |
| 0.0 | 0.3 | GO:0004129 | cytochrome-c oxidase activity(GO:0004129) heme-copper terminal oxidase activity(GO:0015002) oxidoreductase activity, acting on a heme group of donors, oxygen as acceptor(GO:0016676) |
Gene overrepresentation in C2:CP category:
| Log-likelihood per target | Total log-likelihood | Term | Description |
|---|---|---|---|
| 2.5 | 17.3 | PID IL6 7 PATHWAY | IL6-mediated signaling events |
| 1.3 | 32.7 | PID ARF 3PATHWAY | Arf1 pathway |
| 1.2 | 41.5 | PID PRL SIGNALING EVENTS PATHWAY | Signaling events mediated by PRL |
| 0.8 | 48.8 | PID AURORA B PATHWAY | Aurora B signaling |
| 0.7 | 7.1 | PID PI3K PLC TRK PATHWAY | Trk receptor signaling mediated by PI3K and PLC-gamma |
| 0.6 | 17.0 | SA G1 AND S PHASES | Cdk2, 4, and 6 bind cyclin D in G1, while cdk2/cyclin E promotes the G1/S transition. |
| 0.6 | 24.3 | ST WNT BETA CATENIN PATHWAY | Wnt/beta-catenin Pathway |
| 0.5 | 7.1 | PID MAPK TRK PATHWAY | Trk receptor signaling mediated by the MAPK pathway |
| 0.4 | 2.3 | SA REG CASCADE OF CYCLIN EXPR | Expression of cyclins regulates progression through the cell cycle by activating cyclin-dependent kinases. |
| 0.4 | 17.2 | PID NCADHERIN PATHWAY | N-cadherin signaling events |
| 0.4 | 20.2 | PID SYNDECAN 4 PATHWAY | Syndecan-4-mediated signaling events |
| 0.4 | 14.0 | PID AURORA A PATHWAY | Aurora A signaling |
| 0.3 | 8.6 | SA FAS SIGNALING | The TNF-type receptor Fas induces apoptosis on ligand binding. |
| 0.3 | 17.8 | PID PLK1 PATHWAY | PLK1 signaling events |
| 0.3 | 21.2 | PID RAC1 REG PATHWAY | Regulation of RAC1 activity |
| 0.3 | 5.4 | PID EPHA2 FWD PATHWAY | EPHA2 forward signaling |
| 0.3 | 10.6 | PID ERBB NETWORK PATHWAY | ErbB receptor signaling network |
| 0.3 | 31.1 | PID MYC ACTIV PATHWAY | Validated targets of C-MYC transcriptional activation |
| 0.2 | 24.9 | PID ERA GENOMIC PATHWAY | Validated nuclear estrogen receptor alpha network |
| 0.2 | 13.9 | PID AJDISS 2PATHWAY | Posttranslational regulation of adherens junction stability and dissassembly |
| 0.2 | 1.1 | PID AR NONGENOMIC PATHWAY | Nongenotropic Androgen signaling |
| 0.2 | 10.3 | PID ERBB1 INTERNALIZATION PATHWAY | Internalization of ErbB1 |
| 0.2 | 13.4 | PID RAC1 PATHWAY | RAC1 signaling pathway |
| 0.2 | 9.0 | PID FOXO PATHWAY | FoxO family signaling |
| 0.2 | 4.4 | PID NFAT TFPATHWAY | Calcineurin-regulated NFAT-dependent transcription in lymphocytes |
| 0.2 | 3.5 | PID VEGF VEGFR PATHWAY | VEGF and VEGFR signaling network |
| 0.2 | 13.5 | PID LKB1 PATHWAY | LKB1 signaling events |
| 0.2 | 6.3 | PID HIF1 TFPATHWAY | HIF-1-alpha transcription factor network |
| 0.1 | 32.6 | NABA ECM GLYCOPROTEINS | Genes encoding structural ECM glycoproteins |
| 0.1 | 1.9 | PID ER NONGENOMIC PATHWAY | Plasma membrane estrogen receptor signaling |
| 0.1 | 9.7 | WNT SIGNALING | Genes related to Wnt-mediated signal transduction |
| 0.1 | 4.8 | PID ILK PATHWAY | Integrin-linked kinase signaling |
| 0.1 | 2.1 | PID CIRCADIAN PATHWAY | Circadian rhythm pathway |
| 0.1 | 5.7 | PID BMP PATHWAY | BMP receptor signaling |
| 0.1 | 6.2 | PID NFAT 3PATHWAY | Role of Calcineurin-dependent NFAT signaling in lymphocytes |
| 0.1 | 1.3 | ST INTERFERON GAMMA PATHWAY | Interferon gamma pathway. |
| 0.1 | 14.9 | NABA ECM AFFILIATED | Genes encoding proteins affiliated structurally or functionally to extracellular matrix proteins |
| 0.1 | 0.8 | PID IL2 1PATHWAY | IL2-mediated signaling events |
| 0.1 | 1.6 | PID CDC42 REG PATHWAY | Regulation of CDC42 activity |
| 0.1 | 1.6 | PID IL2 PI3K PATHWAY | IL2 signaling events mediated by PI3K |
| 0.1 | 2.5 | PID THROMBIN PAR1 PATHWAY | PAR1-mediated thrombin signaling events |
| 0.1 | 0.9 | PID ERBB1 RECEPTOR PROXIMAL PATHWAY | EGF receptor (ErbB1) signaling pathway |
| 0.1 | 4.2 | PID TNF PATHWAY | TNF receptor signaling pathway |
| 0.0 | 0.4 | PID S1P S1P3 PATHWAY | S1P3 pathway |
| 0.0 | 2.0 | PID TAP63 PATHWAY | Validated transcriptional targets of TAp63 isoforms |
| 0.0 | 2.0 | PID HNF3B PATHWAY | FOXA2 and FOXA3 transcription factor networks |
| 0.0 | 1.8 | PID CASPASE PATHWAY | Caspase cascade in apoptosis |
| 0.0 | 1.8 | PID BETA CATENIN NUC PATHWAY | Regulation of nuclear beta catenin signaling and target gene transcription |
| 0.0 | 5.5 | NABA ECM REGULATORS | Genes encoding enzymes and their regulators involved in the remodeling of the extracellular matrix |
| 0.0 | 1.5 | PID AR PATHWAY | Coregulation of Androgen receptor activity |
| 0.0 | 1.3 | PID HDAC CLASSI PATHWAY | Signaling events mediated by HDAC Class I |
| 0.0 | 0.6 | PID HIF2PATHWAY | HIF-2-alpha transcription factor network |
| 0.0 | 0.8 | PID RHOA REG PATHWAY | Regulation of RhoA activity |
| 0.0 | 0.5 | PID REG GR PATHWAY | Glucocorticoid receptor regulatory network |
| 0.0 | 0.6 | PID P38 ALPHA BETA DOWNSTREAM PATHWAY | Signaling mediated by p38-alpha and p38-beta |
Gene overrepresentation in C2:CP:REACTOME category:
| Log-likelihood per target | Total log-likelihood | Term | Description |
|---|---|---|---|
| 2.2 | 17.4 | REACTOME ETHANOL OXIDATION | Genes involved in Ethanol oxidation |
| 1.9 | 26.2 | REACTOME ACTIVATION OF CHAPERONE GENES BY ATF6 ALPHA | Genes involved in Activation of Chaperone Genes by ATF6-alpha |
| 1.4 | 32.7 | REACTOME CITRIC ACID CYCLE TCA CYCLE | Genes involved in Citric acid cycle (TCA cycle) |
| 1.0 | 18.0 | REACTOME GAP JUNCTION ASSEMBLY | Genes involved in Gap junction assembly |
| 0.9 | 23.2 | REACTOME KINESINS | Genes involved in Kinesins |
| 0.9 | 38.3 | REACTOME SEMA4D INDUCED CELL MIGRATION AND GROWTH CONE COLLAPSE | Genes involved in Sema4D induced cell migration and growth-cone collapse |
| 0.8 | 15.9 | REACTOME SYNTHESIS OF PIPS AT THE GOLGI MEMBRANE | Genes involved in Synthesis of PIPs at the Golgi membrane |
| 0.7 | 18.4 | REACTOME METABOLISM OF POLYAMINES | Genes involved in Metabolism of polyamines |
| 0.7 | 13.9 | REACTOME APOPTOTIC CLEAVAGE OF CELL ADHESION PROTEINS | Genes involved in Apoptotic cleavage of cell adhesion proteins |
| 0.7 | 28.4 | REACTOME SIGNALING BY BMP | Genes involved in Signaling by BMP |
| 0.7 | 13.3 | REACTOME REGULATION OF RHEB GTPASE ACTIVITY BY AMPK | Genes involved in Regulation of Rheb GTPase activity by AMPK |
| 0.6 | 10.3 | REACTOME AKT PHOSPHORYLATES TARGETS IN THE CYTOSOL | Genes involved in AKT phosphorylates targets in the cytosol |
| 0.6 | 13.3 | REACTOME FORMATION OF ATP BY CHEMIOSMOTIC COUPLING | Genes involved in Formation of ATP by chemiosmotic coupling |
| 0.6 | 10.6 | REACTOME DOWNREGULATION OF ERBB2 ERBB3 SIGNALING | Genes involved in Downregulation of ERBB2:ERBB3 signaling |
| 0.5 | 16.7 | REACTOME RNA POL III TRANSCRIPTION TERMINATION | Genes involved in RNA Polymerase III Transcription Termination |
| 0.5 | 70.1 | REACTOME RESPONSE TO ELEVATED PLATELET CYTOSOLIC CA2 | Genes involved in Response to elevated platelet cytosolic Ca2+ |
| 0.4 | 8.1 | REACTOME SIGNALING BY EGFR IN CANCER | Genes involved in Signaling by EGFR in Cancer |
| 0.3 | 5.6 | REACTOME SYNTHESIS SECRETION AND DEACYLATION OF GHRELIN | Genes involved in Synthesis, Secretion, and Deacylation of Ghrelin |
| 0.3 | 1.0 | REACTOME NEGATIVE REGULATION OF THE PI3K AKT NETWORK | Genes involved in Negative regulation of the PI3K/AKT network |
| 0.3 | 8.4 | REACTOME BRANCHED CHAIN AMINO ACID CATABOLISM | Genes involved in Branched-chain amino acid catabolism |
| 0.3 | 6.3 | REACTOME SIGNALING BY HIPPO | Genes involved in Signaling by Hippo |
| 0.3 | 8.6 | REACTOME EXTRINSIC PATHWAY FOR APOPTOSIS | Genes involved in Extrinsic Pathway for Apoptosis |
| 0.3 | 27.2 | REACTOME MITOTIC PROMETAPHASE | Genes involved in Mitotic Prometaphase |
| 0.3 | 1.6 | REACTOME MTORC1 MEDIATED SIGNALLING | Genes involved in mTORC1-mediated signalling |
| 0.3 | 9.5 | REACTOME PYRIMIDINE METABOLISM | Genes involved in Pyrimidine metabolism |
| 0.3 | 5.9 | REACTOME RETROGRADE NEUROTROPHIN SIGNALLING | Genes involved in Retrograde neurotrophin signalling |
| 0.3 | 8.0 | REACTOME CHOLESTEROL BIOSYNTHESIS | Genes involved in Cholesterol biosynthesis |
| 0.3 | 13.7 | REACTOME ION TRANSPORT BY P TYPE ATPASES | Genes involved in Ion transport by P-type ATPases |
| 0.2 | 5.5 | REACTOME REGULATION OF GENE EXPRESSION IN BETA CELLS | Genes involved in Regulation of gene expression in beta cells |
| 0.2 | 3.6 | REACTOME N GLYCAN TRIMMING IN THE ER AND CALNEXIN CALRETICULIN CYCLE | Genes involved in N-glycan trimming in the ER and Calnexin/Calreticulin cycle |
| 0.2 | 2.7 | REACTOME SIGNALING BY NODAL | Genes involved in Signaling by NODAL |
| 0.2 | 12.6 | REACTOME P53 DEPENDENT G1 DNA DAMAGE RESPONSE | Genes involved in p53-Dependent G1 DNA Damage Response |
| 0.2 | 5.1 | REACTOME ASSOCIATION OF TRIC CCT WITH TARGET PROTEINS DURING BIOSYNTHESIS | Genes involved in Association of TriC/CCT with target proteins during biosynthesis |
| 0.2 | 6.5 | REACTOME DARPP 32 EVENTS | Genes involved in DARPP-32 events |
| 0.1 | 10.3 | REACTOME RESPIRATORY ELECTRON TRANSPORT | Genes involved in Respiratory electron transport |
| 0.1 | 6.3 | REACTOME BMAL1 CLOCK NPAS2 ACTIVATES CIRCADIAN EXPRESSION | Genes involved in BMAL1:CLOCK/NPAS2 Activates Circadian Expression |
| 0.1 | 10.0 | REACTOME PPARA ACTIVATES GENE EXPRESSION | Genes involved in PPARA Activates Gene Expression |
| 0.1 | 2.4 | REACTOME PURINE SALVAGE | Genes involved in Purine salvage |
| 0.1 | 2.6 | REACTOME BIOSYNTHESIS OF THE N GLYCAN PRECURSOR DOLICHOL LIPID LINKED OLIGOSACCHARIDE LLO AND TRANSFER TO A NASCENT PROTEIN | Genes involved in Biosynthesis of the N-glycan precursor (dolichol lipid-linked oligosaccharide, LLO) and transfer to a nascent protein |
| 0.1 | 2.2 | REACTOME DESTABILIZATION OF MRNA BY AUF1 HNRNP D0 | Genes involved in Destabilization of mRNA by AUF1 (hnRNP D0) |
| 0.1 | 2.0 | REACTOME FORMATION OF THE TERNARY COMPLEX AND SUBSEQUENTLY THE 43S COMPLEX | Genes involved in Formation of the ternary complex, and subsequently, the 43S complex |
| 0.1 | 2.5 | REACTOME PERK REGULATED GENE EXPRESSION | Genes involved in PERK regulated gene expression |
| 0.1 | 2.0 | REACTOME CD28 DEPENDENT VAV1 PATHWAY | Genes involved in CD28 dependent Vav1 pathway |
| 0.1 | 1.8 | REACTOME ENDOSOMAL SORTING COMPLEX REQUIRED FOR TRANSPORT ESCRT | Genes involved in Endosomal Sorting Complex Required For Transport (ESCRT) |
| 0.1 | 13.3 | REACTOME SIGNALING BY RHO GTPASES | Genes involved in Signaling by Rho GTPases |
| 0.1 | 1.3 | REACTOME REGULATION OF IFNG SIGNALING | Genes involved in Regulation of IFNG signaling |
| 0.1 | 4.1 | REACTOME SMOOTH MUSCLE CONTRACTION | Genes involved in Smooth Muscle Contraction |
| 0.1 | 2.1 | REACTOME HS GAG DEGRADATION | Genes involved in HS-GAG degradation |
| 0.1 | 4.0 | REACTOME MITOCHONDRIAL PROTEIN IMPORT | Genes involved in Mitochondrial Protein Import |
| 0.1 | 5.4 | REACTOME GOLGI ASSOCIATED VESICLE BIOGENESIS | Genes involved in Golgi Associated Vesicle Biogenesis |
| 0.1 | 1.9 | REACTOME N GLYCAN ANTENNAE ELONGATION | Genes involved in N-Glycan antennae elongation |
| 0.1 | 1.1 | REACTOME HORMONE LIGAND BINDING RECEPTORS | Genes involved in Hormone ligand-binding receptors |
| 0.1 | 0.6 | REACTOME COMMON PATHWAY | Genes involved in Common Pathway |
| 0.1 | 13.5 | REACTOME G ALPHA I SIGNALLING EVENTS | Genes involved in G alpha (i) signalling events |
| 0.1 | 2.9 | REACTOME DEPOSITION OF NEW CENPA CONTAINING NUCLEOSOMES AT THE CENTROMERE | Genes involved in Deposition of New CENPA-containing Nucleosomes at the Centromere |
| 0.0 | 0.8 | REACTOME NUCLEAR SIGNALING BY ERBB4 | Genes involved in Nuclear signaling by ERBB4 |
| 0.0 | 8.5 | REACTOME SRP DEPENDENT COTRANSLATIONAL PROTEIN TARGETING TO MEMBRANE | Genes involved in SRP-dependent cotranslational protein targeting to membrane |
| 0.0 | 1.0 | REACTOME REGULATION OF INSULIN LIKE GROWTH FACTOR IGF ACTIVITY BY INSULIN LIKE GROWTH FACTOR BINDING PROTEINS IGFBPS | Genes involved in Regulation of Insulin-like Growth Factor (IGF) Activity by Insulin-like Growth Factor Binding Proteins (IGFBPs) |
| 0.0 | 0.8 | REACTOME G2 M DNA DAMAGE CHECKPOINT | Genes involved in G2/M DNA damage checkpoint |
| 0.0 | 11.5 | REACTOME METABOLISM OF CARBOHYDRATES | Genes involved in Metabolism of carbohydrates |
| 0.0 | 1.2 | REACTOME ADHERENS JUNCTIONS INTERACTIONS | Genes involved in Adherens junctions interactions |
| 0.0 | 0.9 | REACTOME SIGNALING BY CONSTITUTIVELY ACTIVE EGFR | Genes involved in Signaling by constitutively active EGFR |
| 0.0 | 0.7 | REACTOME INFLUENZA VIRAL RNA TRANSCRIPTION AND REPLICATION | Genes involved in Influenza Viral RNA Transcription and Replication |
| 0.0 | 1.0 | REACTOME PEROXISOMAL LIPID METABOLISM | Genes involved in Peroxisomal lipid metabolism |
| 0.0 | 0.7 | REACTOME CYCLIN E ASSOCIATED EVENTS DURING G1 S TRANSITION | Genes involved in Cyclin E associated events during G1/S transition |
| 0.0 | 0.5 | REACTOME PRESYNAPTIC NICOTINIC ACETYLCHOLINE RECEPTORS | Genes involved in Presynaptic nicotinic acetylcholine receptors |
| 0.0 | 1.0 | REACTOME RNA POL II TRANSCRIPTION PRE INITIATION AND PROMOTER OPENING | Genes involved in RNA Polymerase II Transcription Pre-Initiation And Promoter Opening |
| 0.0 | 3.9 | REACTOME MRNA PROCESSING | Genes involved in mRNA Processing |
| 0.0 | 2.0 | REACTOME CLASS B 2 SECRETIN FAMILY RECEPTORS | Genes involved in Class B/2 (Secretin family receptors) |
| 0.0 | 0.2 | REACTOME TRAFFICKING AND PROCESSING OF ENDOSOMAL TLR | Genes involved in Trafficking and processing of endosomal TLR |
| 0.0 | 0.6 | REACTOME IL RECEPTOR SHC SIGNALING | Genes involved in Interleukin receptor SHC signaling |
| 0.0 | 0.4 | REACTOME SPHINGOLIPID DE NOVO BIOSYNTHESIS | Genes involved in Sphingolipid de novo biosynthesis |