Project
GNF SymAtlas + NCI-60 cancer cell lines, comparison of cancers vs non-cancers, human (Su, 2004; Ross, 2000)
Navigation
Downloads
Results for TBX21_TBR1
Z-value: 0.98
Motif logo
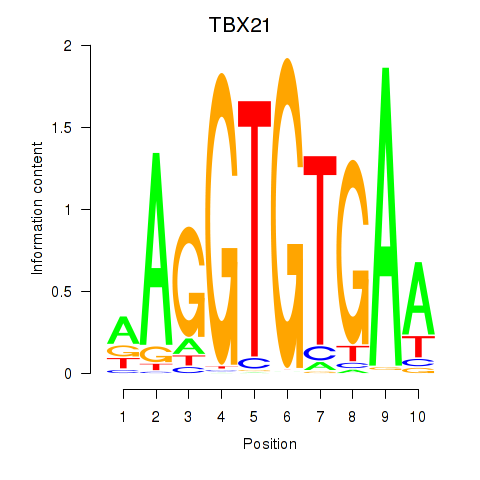
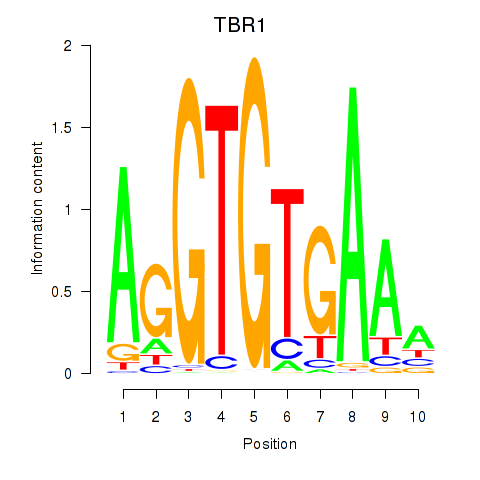
Transcription factors associated with TBX21_TBR1
| Gene Symbol | Gene ID | Gene Info |
|---|---|---|
|
TBX21
|
ENSG00000073861.2 | T-box transcription factor 21 |
|
TBR1
|
ENSG00000136535.10 | T-box brain transcription factor 1 |
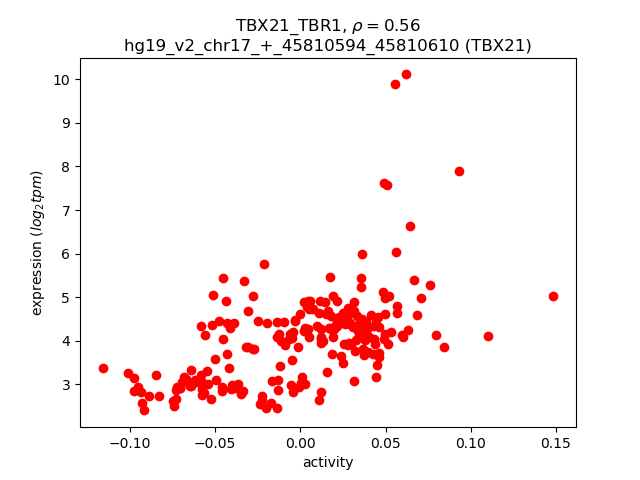
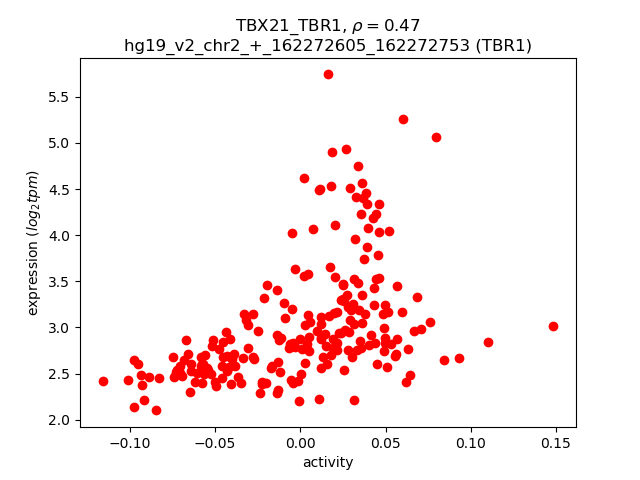
Activity-expression correlation:
| Gene | Promoter | Pearson corr. coef. | P-value | Plot |
|---|---|---|---|---|
| TBX21 | hg19_v2_chr17_+_45810594_45810610 | 0.56 | 4.9e-19 | Click! |
| TBR1 | hg19_v2_chr2_+_162272605_162272753 | 0.47 | 4.1e-13 | Click! |
Activity profile of TBX21_TBR1 motif
Sorted Z-values of TBX21_TBR1 motif
| Promoter | Log-likelihood | Transcript | Gene | Gene Info |
|---|---|---|---|---|
| chr5_+_54320078 | 21.64 |
ENST00000231009.2
|
GZMK
|
granzyme K (granzyme 3; tryptase II) |
| chr11_+_73358594 | 21.43 |
ENST00000227214.6
ENST00000398494.4 ENST00000543085.1 |
PLEKHB1
|
pleckstrin homology domain containing, family B (evectins) member 1 |
| chr5_-_131132614 | 18.10 |
ENST00000307968.7
ENST00000307954.8 |
FNIP1
|
folliculin interacting protein 1 |
| chr14_+_95078714 | 17.58 |
ENST00000393078.3
ENST00000393080.4 ENST00000467132.1 |
SERPINA3
|
serpin peptidase inhibitor, clade A (alpha-1 antiproteinase, antitrypsin), member 3 |
| chr15_-_83316087 | 15.69 |
ENST00000568757.1
|
CPEB1
|
cytoplasmic polyadenylation element binding protein 1 |
| chr14_+_75745477 | 15.51 |
ENST00000303562.4
ENST00000554617.1 ENST00000554212.1 ENST00000535987.1 ENST00000555242.1 |
FOS
|
FBJ murine osteosarcoma viral oncogene homolog |
| chr15_-_83316254 | 14.20 |
ENST00000567678.1
ENST00000450751.2 |
CPEB1
|
cytoplasmic polyadenylation element binding protein 1 |
| chr22_-_38699003 | 14.15 |
ENST00000451964.1
|
CSNK1E
|
casein kinase 1, epsilon |
| chr2_-_175869936 | 13.17 |
ENST00000409900.3
|
CHN1
|
chimerin 1 |
| chr8_-_27457494 | 12.44 |
ENST00000521770.1
|
CLU
|
clusterin |
| chr1_+_38022513 | 12.41 |
ENST00000296218.7
|
DNALI1
|
dynein, axonemal, light intermediate chain 1 |
| chr5_+_74807886 | 12.09 |
ENST00000514296.1
|
POLK
|
polymerase (DNA directed) kappa |
| chr2_-_175870085 | 11.96 |
ENST00000409156.3
|
CHN1
|
chimerin 1 |
| chr11_+_112832202 | 11.84 |
ENST00000534015.1
|
NCAM1
|
neural cell adhesion molecule 1 |
| chr13_+_42031679 | 11.48 |
ENST00000379359.3
|
RGCC
|
regulator of cell cycle |
| chr9_+_17134980 | 11.16 |
ENST00000380647.3
|
CNTLN
|
centlein, centrosomal protein |
| chr11_+_112832090 | 10.99 |
ENST00000533760.1
|
NCAM1
|
neural cell adhesion molecule 1 |
| chr22_+_23243156 | 10.52 |
ENST00000390323.2
|
IGLC2
|
immunoglobulin lambda constant 2 (Kern-Oz- marker) |
| chr1_-_11907829 | 10.44 |
ENST00000376480.3
|
NPPA
|
natriuretic peptide A |
| chr7_-_100026280 | 10.00 |
ENST00000360951.4
ENST00000398027.2 ENST00000324725.6 ENST00000472716.1 |
ZCWPW1
|
zinc finger, CW type with PWWP domain 1 |
| chrX_+_56259316 | 9.88 |
ENST00000468660.1
|
KLF8
|
Kruppel-like factor 8 |
| chr14_+_75746781 | 9.85 |
ENST00000555347.1
|
FOS
|
FBJ murine osteosarcoma viral oncogene homolog |
| chr11_-_133826852 | 9.75 |
ENST00000533871.2
ENST00000321016.8 |
IGSF9B
|
immunoglobulin superfamily, member 9B |
| chr3_-_66551397 | 9.60 |
ENST00000383703.3
|
LRIG1
|
leucine-rich repeats and immunoglobulin-like domains 1 |
| chr1_-_163172625 | 9.51 |
ENST00000527988.1
ENST00000531476.1 ENST00000530507.1 |
RGS5
|
regulator of G-protein signaling 5 |
| chr9_+_17135016 | 9.46 |
ENST00000425824.1
ENST00000262360.5 ENST00000380641.4 |
CNTLN
|
centlein, centrosomal protein |
| chr11_-_236326 | 9.23 |
ENST00000525237.1
ENST00000532956.1 ENST00000525319.1 ENST00000524564.1 ENST00000382743.4 |
SIRT3
|
sirtuin 3 |
| chr7_-_36764004 | 9.14 |
ENST00000431169.1
|
AOAH
|
acyloxyacyl hydrolase (neutrophil) |
| chr17_-_8066843 | 8.96 |
ENST00000404970.3
|
VAMP2
|
vesicle-associated membrane protein 2 (synaptobrevin 2) |
| chr5_-_131132658 | 8.96 |
ENST00000514667.1
ENST00000511848.1 ENST00000510461.1 |
CTC-432M15.3
FNIP1
|
Folliculin-interacting protein 1 folliculin interacting protein 1 |
| chr12_+_69742121 | 8.73 |
ENST00000261267.2
ENST00000549690.1 ENST00000548839.1 |
LYZ
|
lysozyme |
| chr7_-_36764142 | 8.61 |
ENST00000258749.5
ENST00000535891.1 |
AOAH
|
acyloxyacyl hydrolase (neutrophil) |
| chr1_+_89829610 | 8.61 |
ENST00000370456.4
ENST00000535065.1 |
GBP6
|
guanylate binding protein family, member 6 |
| chr17_+_34431212 | 8.38 |
ENST00000394495.1
|
CCL4
|
chemokine (C-C motif) ligand 4 |
| chr2_-_157189180 | 8.26 |
ENST00000539077.1
ENST00000424077.1 ENST00000426264.1 ENST00000339562.4 ENST00000421709.1 |
NR4A2
|
nuclear receptor subfamily 4, group A, member 2 |
| chr3_-_179169330 | 7.97 |
ENST00000232564.3
|
GNB4
|
guanine nucleotide binding protein (G protein), beta polypeptide 4 |
| chrY_+_2709527 | 7.96 |
ENST00000250784.8
|
RPS4Y1
|
ribosomal protein S4, Y-linked 1 |
| chr3_-_66551351 | 7.91 |
ENST00000273261.3
|
LRIG1
|
leucine-rich repeats and immunoglobulin-like domains 1 |
| chr11_+_17756279 | 7.89 |
ENST00000265969.6
|
KCNC1
|
potassium voltage-gated channel, Shaw-related subfamily, member 1 |
| chr1_-_25256368 | 7.82 |
ENST00000308873.6
|
RUNX3
|
runt-related transcription factor 3 |
| chr12_+_14572070 | 7.64 |
ENST00000545769.1
ENST00000428217.2 ENST00000396279.2 ENST00000542514.1 ENST00000536279.1 |
ATF7IP
|
activating transcription factor 7 interacting protein |
| chr10_+_118305435 | 7.56 |
ENST00000369221.2
|
PNLIP
|
pancreatic lipase |
| chr8_+_1993173 | 7.54 |
ENST00000523438.1
|
MYOM2
|
myomesin 2 |
| chrY_+_2709906 | 7.45 |
ENST00000430575.1
|
RPS4Y1
|
ribosomal protein S4, Y-linked 1 |
| chr6_+_131894284 | 7.43 |
ENST00000368087.3
ENST00000356962.2 |
ARG1
|
arginase 1 |
| chr16_-_30546141 | 7.40 |
ENST00000535210.1
ENST00000395094.3 |
ZNF747
|
zinc finger protein 747 |
| chr11_-_76155700 | 7.25 |
ENST00000572035.1
|
RP11-111M22.3
|
RP11-111M22.3 |
| chr19_-_39390350 | 7.01 |
ENST00000447739.1
ENST00000358931.5 ENST00000407552.1 |
SIRT2
|
sirtuin 2 |
| chr9_+_134378289 | 6.85 |
ENST00000423007.1
ENST00000404875.2 ENST00000441334.1 ENST00000341012.7 ENST00000372228.3 ENST00000402686.3 ENST00000419118.2 ENST00000541219.1 ENST00000354713.4 ENST00000418774.1 ENST00000415075.1 ENST00000448212.1 ENST00000430619.1 |
POMT1
|
protein-O-mannosyltransferase 1 |
| chr6_-_84937314 | 6.71 |
ENST00000257766.4
ENST00000403245.3 |
KIAA1009
|
KIAA1009 |
| chr22_-_31688431 | 6.68 |
ENST00000402249.3
ENST00000443175.1 ENST00000215912.5 ENST00000441972.1 |
PIK3IP1
|
phosphoinositide-3-kinase interacting protein 1 |
| chr11_-_76155618 | 6.67 |
ENST00000530759.1
|
RP11-111M22.3
|
RP11-111M22.3 |
| chr14_-_81687575 | 6.65 |
ENST00000434192.2
|
GTF2A1
|
general transcription factor IIA, 1, 19/37kDa |
| chr2_+_219247021 | 6.59 |
ENST00000539932.1
|
SLC11A1
|
solute carrier family 11 (proton-coupled divalent metal ion transporter), member 1 |
| chr7_+_150264365 | 6.48 |
ENST00000255945.2
ENST00000461940.1 |
GIMAP4
|
GTPase, IMAP family member 4 |
| chr17_+_25799008 | 6.36 |
ENST00000583370.1
ENST00000398988.3 ENST00000268763.6 |
KSR1
|
kinase suppressor of ras 1 |
| chr4_+_166300084 | 6.32 |
ENST00000402744.4
|
CPE
|
carboxypeptidase E |
| chr6_-_52705641 | 6.10 |
ENST00000370989.2
|
GSTA5
|
glutathione S-transferase alpha 5 |
| chr3_-_196065248 | 6.06 |
ENST00000446879.1
ENST00000273695.3 |
TM4SF19
|
transmembrane 4 L six family member 19 |
| chr1_+_184356188 | 6.03 |
ENST00000235307.6
|
C1orf21
|
chromosome 1 open reading frame 21 |
| chr5_-_39270725 | 6.00 |
ENST00000512138.1
ENST00000512982.1 ENST00000540520.1 |
FYB
|
FYN binding protein |
| chr6_+_142468361 | 5.91 |
ENST00000367630.4
|
VTA1
|
vesicle (multivesicular body) trafficking 1 |
| chr1_+_38022572 | 5.84 |
ENST00000541606.1
|
DNALI1
|
dynein, axonemal, light intermediate chain 1 |
| chr12_-_45269430 | 5.83 |
ENST00000395487.2
|
NELL2
|
NEL-like 2 (chicken) |
| chr8_-_22089845 | 5.72 |
ENST00000454243.2
|
PHYHIP
|
phytanoyl-CoA 2-hydroxylase interacting protein |
| chr20_+_44509857 | 5.64 |
ENST00000372523.1
ENST00000372520.1 |
ZSWIM1
|
zinc finger, SWIM-type containing 1 |
| chr8_-_22089533 | 5.58 |
ENST00000321613.3
|
PHYHIP
|
phytanoyl-CoA 2-hydroxylase interacting protein |
| chr8_+_103563792 | 5.54 |
ENST00000285402.3
|
ODF1
|
outer dense fiber of sperm tails 1 |
| chr11_-_6440624 | 5.46 |
ENST00000311051.3
|
APBB1
|
amyloid beta (A4) precursor protein-binding, family B, member 1 (Fe65) |
| chr2_+_143886877 | 5.46 |
ENST00000295095.6
|
ARHGAP15
|
Rho GTPase activating protein 15 |
| chr1_-_156786634 | 5.42 |
ENST00000392306.2
ENST00000368199.3 |
SH2D2A
|
SH2 domain containing 2A |
| chr6_+_32132360 | 5.37 |
ENST00000333845.6
ENST00000395512.1 ENST00000432129.1 |
EGFL8
|
EGF-like-domain, multiple 8 |
| chr6_-_13487784 | 5.35 |
ENST00000379287.3
|
GFOD1
|
glucose-fructose oxidoreductase domain containing 1 |
| chr10_+_135050908 | 5.34 |
ENST00000325980.9
|
VENTX
|
VENT homeobox |
| chr6_-_46459675 | 5.34 |
ENST00000306764.7
|
RCAN2
|
regulator of calcineurin 2 |
| chr1_-_153029980 | 5.34 |
ENST00000392653.2
|
SPRR2A
|
small proline-rich protein 2A |
| chr3_-_61237050 | 5.31 |
ENST00000476844.1
ENST00000488467.1 ENST00000492590.1 ENST00000468189.1 |
FHIT
|
fragile histidine triad |
| chr16_+_75681650 | 5.31 |
ENST00000300086.4
|
TERF2IP
|
telomeric repeat binding factor 2, interacting protein |
| chr7_+_143013198 | 5.29 |
ENST00000343257.2
|
CLCN1
|
chloride channel, voltage-sensitive 1 |
| chr5_+_66124590 | 5.15 |
ENST00000490016.2
ENST00000403666.1 ENST00000450827.1 |
MAST4
|
microtubule associated serine/threonine kinase family member 4 |
| chr9_-_96717654 | 5.11 |
ENST00000253968.6
|
BARX1
|
BARX homeobox 1 |
| chr11_+_6281036 | 5.07 |
ENST00000532715.1
ENST00000525014.1 ENST00000531712.1 ENST00000525462.1 |
CCKBR
|
cholecystokinin B receptor |
| chr1_+_182758900 | 5.03 |
ENST00000367555.1
ENST00000367554.3 |
NPL
|
N-acetylneuraminate pyruvate lyase (dihydrodipicolinate synthase) |
| chrX_+_129473859 | 4.96 |
ENST00000424447.1
|
SLC25A14
|
solute carrier family 25 (mitochondrial carrier, brain), member 14 |
| chr1_+_50513686 | 4.85 |
ENST00000448907.2
|
ELAVL4
|
ELAV like neuron-specific RNA binding protein 4 |
| chr19_-_50529193 | 4.80 |
ENST00000596445.1
ENST00000599538.1 |
VRK3
|
vaccinia related kinase 3 |
| chr2_-_73053126 | 4.79 |
ENST00000272427.6
ENST00000410104.1 |
EXOC6B
|
exocyst complex component 6B |
| chr1_-_19229014 | 4.74 |
ENST00000538839.1
ENST00000290597.5 |
ALDH4A1
|
aldehyde dehydrogenase 4 family, member A1 |
| chr1_-_156786530 | 4.73 |
ENST00000368198.3
|
SH2D2A
|
SH2 domain containing 2A |
| chr6_+_170190417 | 4.71 |
ENST00000420557.2
|
LINC00574
|
long intergenic non-protein coding RNA 574 |
| chr1_+_150898812 | 4.70 |
ENST00000271640.5
ENST00000448029.1 ENST00000368962.2 ENST00000534805.1 ENST00000368969.4 ENST00000368963.1 ENST00000498193.1 |
SETDB1
|
SET domain, bifurcated 1 |
| chr6_+_45390222 | 4.68 |
ENST00000359524.5
|
RUNX2
|
runt-related transcription factor 2 |
| chr17_-_7493390 | 4.66 |
ENST00000538513.2
ENST00000570788.1 ENST00000250055.2 |
SOX15
|
SRY (sex determining region Y)-box 15 |
| chr15_+_25200074 | 4.66 |
ENST00000390687.4
ENST00000584968.1 ENST00000346403.6 ENST00000554227.2 |
SNRPN
|
small nuclear ribonucleoprotein polypeptide N |
| chr6_-_112194484 | 4.65 |
ENST00000518295.1
ENST00000484067.2 ENST00000229470.5 ENST00000356013.2 ENST00000368678.4 ENST00000523238.1 ENST00000354650.3 |
FYN
|
FYN oncogene related to SRC, FGR, YES |
| chr4_-_121843985 | 4.62 |
ENST00000264808.3
ENST00000428209.2 ENST00000515109.1 ENST00000394435.2 |
PRDM5
|
PR domain containing 5 |
| chr22_-_31688381 | 4.59 |
ENST00000487265.2
|
PIK3IP1
|
phosphoinositide-3-kinase interacting protein 1 |
| chr1_+_2036149 | 4.57 |
ENST00000482686.1
ENST00000400920.1 ENST00000486681.1 |
PRKCZ
|
protein kinase C, zeta |
| chr1_-_183387723 | 4.57 |
ENST00000287713.6
|
NMNAT2
|
nicotinamide nucleotide adenylyltransferase 2 |
| chr19_-_15529790 | 4.56 |
ENST00000596195.1
ENST00000595067.1 ENST00000595465.2 ENST00000397410.5 ENST00000600247.1 |
AKAP8L
|
A kinase (PRKA) anchor protein 8-like |
| chr17_-_76356148 | 4.53 |
ENST00000587578.1
ENST00000330871.2 |
SOCS3
|
suppressor of cytokine signaling 3 |
| chr5_+_176853702 | 4.52 |
ENST00000507633.1
ENST00000393576.3 ENST00000355958.5 ENST00000528793.1 ENST00000512684.1 |
GRK6
|
G protein-coupled receptor kinase 6 |
| chr12_-_7848364 | 4.52 |
ENST00000329913.3
|
GDF3
|
growth differentiation factor 3 |
| chr12_+_4918342 | 4.52 |
ENST00000280684.3
ENST00000433855.1 |
KCNA6
|
potassium voltage-gated channel, shaker-related subfamily, member 6 |
| chr17_+_54911444 | 4.51 |
ENST00000284061.3
ENST00000572810.1 |
DGKE
|
diacylglycerol kinase, epsilon 64kDa |
| chr1_-_19229248 | 4.46 |
ENST00000375341.3
|
ALDH4A1
|
aldehyde dehydrogenase 4 family, member A1 |
| chr17_-_9929581 | 4.46 |
ENST00000437099.2
ENST00000396115.2 |
GAS7
|
growth arrest-specific 7 |
| chr17_-_37309480 | 4.36 |
ENST00000539608.1
|
PLXDC1
|
plexin domain containing 1 |
| chr16_+_28834531 | 4.31 |
ENST00000570200.1
|
ATXN2L
|
ataxin 2-like |
| chr3_+_167453493 | 4.30 |
ENST00000295777.5
ENST00000472747.2 |
SERPINI1
|
serpin peptidase inhibitor, clade I (neuroserpin), member 1 |
| chr14_+_24583836 | 4.30 |
ENST00000559115.1
ENST00000558215.1 ENST00000557810.1 ENST00000561375.1 ENST00000446197.3 ENST00000559796.1 ENST00000560713.1 ENST00000560901.1 ENST00000559382.1 |
DCAF11
|
DDB1 and CUL4 associated factor 11 |
| chr19_+_10381769 | 4.29 |
ENST00000423829.2
ENST00000588645.1 |
ICAM1
|
intercellular adhesion molecule 1 |
| chr17_+_76356516 | 4.22 |
ENST00000592569.1
|
RP11-806H10.4
|
RP11-806H10.4 |
| chr3_-_49466686 | 4.20 |
ENST00000273598.3
ENST00000436744.2 |
NICN1
|
nicolin 1 |
| chr1_+_32716857 | 4.19 |
ENST00000482949.1
ENST00000495610.2 |
LCK
|
lymphocyte-specific protein tyrosine kinase |
| chr17_-_40333099 | 4.18 |
ENST00000607371.1
|
KCNH4
|
potassium voltage-gated channel, subfamily H (eag-related), member 4 |
| chr13_+_53602894 | 4.15 |
ENST00000219022.2
|
OLFM4
|
olfactomedin 4 |
| chrX_+_16804544 | 4.15 |
ENST00000380122.5
ENST00000398155.4 |
TXLNG
|
taxilin gamma |
| chr4_-_90757364 | 4.12 |
ENST00000508895.1
|
SNCA
|
synuclein, alpha (non A4 component of amyloid precursor) |
| chr6_+_45389893 | 4.07 |
ENST00000371432.3
|
RUNX2
|
runt-related transcription factor 2 |
| chr9_+_33750515 | 4.07 |
ENST00000361005.5
|
PRSS3
|
protease, serine, 3 |
| chr19_-_13213662 | 4.07 |
ENST00000264824.4
|
LYL1
|
lymphoblastic leukemia derived sequence 1 |
| chr17_-_37308824 | 4.05 |
ENST00000415163.1
ENST00000441877.1 ENST00000444911.2 |
PLXDC1
|
plexin domain containing 1 |
| chr6_+_39760129 | 4.00 |
ENST00000274867.4
|
DAAM2
|
dishevelled associated activator of morphogenesis 2 |
| chrX_+_18443703 | 3.98 |
ENST00000379996.3
|
CDKL5
|
cyclin-dependent kinase-like 5 |
| chr1_+_32716840 | 3.97 |
ENST00000336890.5
|
LCK
|
lymphocyte-specific protein tyrosine kinase |
| chr1_+_172628154 | 3.91 |
ENST00000340030.3
ENST00000367721.2 |
FASLG
|
Fas ligand (TNF superfamily, member 6) |
| chr9_+_33750667 | 3.91 |
ENST00000457896.1
ENST00000342836.4 ENST00000429677.3 |
PRSS3
|
protease, serine, 3 |
| chr22_+_40342819 | 3.90 |
ENST00000407075.3
|
GRAP2
|
GRB2-related adaptor protein 2 |
| chr11_-_59950622 | 3.87 |
ENST00000323961.3
ENST00000412309.2 |
MS4A6A
|
membrane-spanning 4-domains, subfamily A, member 6A |
| chr17_-_76713100 | 3.81 |
ENST00000585509.1
|
CYTH1
|
cytohesin 1 |
| chr17_+_76311791 | 3.80 |
ENST00000586321.1
|
AC061992.2
|
AC061992.2 |
| chr16_-_79634595 | 3.79 |
ENST00000326043.4
ENST00000393350.1 |
MAF
|
v-maf avian musculoaponeurotic fibrosarcoma oncogene homolog |
| chr11_+_28129795 | 3.73 |
ENST00000406787.3
ENST00000342303.5 ENST00000403099.1 ENST00000407364.3 |
METTL15
|
methyltransferase like 15 |
| chr14_-_75518129 | 3.71 |
ENST00000556257.1
ENST00000557648.1 ENST00000553263.1 ENST00000355774.2 ENST00000380968.2 ENST00000238662.7 |
MLH3
|
mutL homolog 3 |
| chr2_-_219031709 | 3.71 |
ENST00000295683.2
|
CXCR1
|
chemokine (C-X-C motif) receptor 1 |
| chrX_+_69642881 | 3.70 |
ENST00000453994.2
ENST00000536730.1 ENST00000538649.1 ENST00000374382.3 |
GDPD2
|
glycerophosphodiester phosphodiesterase domain containing 2 |
| chr12_-_91576561 | 3.70 |
ENST00000547568.2
ENST00000552962.1 |
DCN
|
decorin |
| chr17_-_56406117 | 3.69 |
ENST00000268893.6
ENST00000355701.3 |
BZRAP1
|
benzodiazepine receptor (peripheral) associated protein 1 |
| chr11_-_33913708 | 3.68 |
ENST00000257818.2
|
LMO2
|
LIM domain only 2 (rhombotin-like 1) |
| chr5_+_161274940 | 3.65 |
ENST00000393943.4
|
GABRA1
|
gamma-aminobutyric acid (GABA) A receptor, alpha 1 |
| chr12_+_66582919 | 3.63 |
ENST00000545837.1
ENST00000457197.2 |
IRAK3
|
interleukin-1 receptor-associated kinase 3 |
| chr12_-_8025499 | 3.59 |
ENST00000431042.2
|
SLC2A14
|
solute carrier family 2 (facilitated glucose transporter), member 14 |
| chr1_+_16062820 | 3.57 |
ENST00000294454.5
|
SLC25A34
|
solute carrier family 25, member 34 |
| chr3_-_146213722 | 3.53 |
ENST00000336685.2
ENST00000489015.1 |
PLSCR2
|
phospholipid scramblase 2 |
| chr4_-_90756769 | 3.50 |
ENST00000345009.4
ENST00000505199.1 ENST00000502987.1 |
SNCA
|
synuclein, alpha (non A4 component of amyloid precursor) |
| chr17_-_56609302 | 3.49 |
ENST00000581607.1
ENST00000317256.6 ENST00000426861.1 ENST00000580809.1 ENST00000577729.1 ENST00000583291.1 |
SEPT4
|
septin 4 |
| chr5_-_34043310 | 3.49 |
ENST00000231338.7
|
C1QTNF3
|
C1q and tumor necrosis factor related protein 3 |
| chr9_+_124048864 | 3.46 |
ENST00000545652.1
|
GSN
|
gelsolin |
| chr20_+_43595115 | 3.44 |
ENST00000372806.3
ENST00000396731.4 ENST00000372801.1 ENST00000499879.2 |
STK4
|
serine/threonine kinase 4 |
| chr3_-_57678772 | 3.43 |
ENST00000311128.5
|
DENND6A
|
DENN/MADD domain containing 6A |
| chr1_+_92417716 | 3.41 |
ENST00000402388.1
|
BRDT
|
bromodomain, testis-specific |
| chr12_-_8025442 | 3.41 |
ENST00000340749.5
ENST00000535295.1 ENST00000539234.1 |
SLC2A14
|
solute carrier family 2 (facilitated glucose transporter), member 14 |
| chr5_+_161274685 | 3.41 |
ENST00000428797.2
|
GABRA1
|
gamma-aminobutyric acid (GABA) A receptor, alpha 1 |
| chr12_-_8025398 | 3.38 |
ENST00000535344.1
ENST00000543909.1 |
SLC2A14
|
solute carrier family 2 (facilitated glucose transporter), member 14 |
| chr17_-_38721711 | 3.36 |
ENST00000578085.1
ENST00000246657.2 |
CCR7
|
chemokine (C-C motif) receptor 7 |
| chr14_-_93651186 | 3.35 |
ENST00000556883.1
ENST00000298894.4 |
MOAP1
|
modulator of apoptosis 1 |
| chr4_+_48833234 | 3.34 |
ENST00000510824.1
ENST00000425583.2 |
OCIAD1
|
OCIA domain containing 1 |
| chr7_+_5919458 | 3.34 |
ENST00000416608.1
|
OCM
|
oncomodulin |
| chr12_-_91576429 | 3.32 |
ENST00000552145.1
ENST00000546745.1 |
DCN
|
decorin |
| chr12_+_32112340 | 3.30 |
ENST00000540924.1
ENST00000312561.4 |
KIAA1551
|
KIAA1551 |
| chr10_-_75226166 | 3.30 |
ENST00000544628.1
|
PPP3CB
|
protein phosphatase 3, catalytic subunit, beta isozyme |
| chr1_-_111148241 | 3.28 |
ENST00000440270.1
|
KCNA2
|
potassium voltage-gated channel, shaker-related subfamily, member 2 |
| chr4_-_186732048 | 3.28 |
ENST00000448662.2
ENST00000439049.1 ENST00000420158.1 ENST00000431808.1 ENST00000319471.9 |
SORBS2
|
sorbin and SH3 domain containing 2 |
| chr5_+_35856951 | 3.25 |
ENST00000303115.3
ENST00000343305.4 ENST00000506850.1 ENST00000511982.1 |
IL7R
|
interleukin 7 receptor |
| chr12_+_57853918 | 3.25 |
ENST00000532291.1
ENST00000543426.1 ENST00000228682.2 ENST00000546141.1 |
GLI1
|
GLI family zinc finger 1 |
| chr14_-_106963409 | 3.24 |
ENST00000390621.2
|
IGHV1-45
|
immunoglobulin heavy variable 1-45 |
| chr2_-_241737128 | 3.21 |
ENST00000404283.3
|
KIF1A
|
kinesin family member 1A |
| chr11_-_59950519 | 3.20 |
ENST00000528851.1
|
MS4A6A
|
membrane-spanning 4-domains, subfamily A, member 6A |
| chr6_+_391739 | 3.15 |
ENST00000380956.4
|
IRF4
|
interferon regulatory factor 4 |
| chr4_+_48833119 | 3.13 |
ENST00000444354.2
ENST00000509963.1 ENST00000509246.1 |
OCIAD1
|
OCIA domain containing 1 |
| chr6_+_108487245 | 3.13 |
ENST00000368986.4
|
NR2E1
|
nuclear receptor subfamily 2, group E, member 1 |
| chr7_+_27282319 | 3.12 |
ENST00000222761.3
|
EVX1
|
even-skipped homeobox 1 |
| chr16_+_6069072 | 3.05 |
ENST00000547605.1
ENST00000550418.1 ENST00000553186.1 |
RBFOX1
|
RNA binding protein, fox-1 homolog (C. elegans) 1 |
| chr1_+_213123976 | 3.05 |
ENST00000366965.2
ENST00000366967.2 |
VASH2
|
vasohibin 2 |
| chr15_+_65903680 | 3.04 |
ENST00000537259.1
|
SLC24A1
|
solute carrier family 24 (sodium/potassium/calcium exchanger), member 1 |
| chr7_+_110731062 | 3.00 |
ENST00000308478.5
ENST00000451085.1 ENST00000422987.3 ENST00000421101.1 |
LRRN3
|
leucine rich repeat neuronal 3 |
| chr2_+_79252834 | 2.98 |
ENST00000409471.1
|
REG3G
|
regenerating islet-derived 3 gamma |
| chr16_-_67965756 | 2.96 |
ENST00000571044.1
ENST00000571605.1 |
CTRL
|
chymotrypsin-like |
| chr10_-_23003460 | 2.92 |
ENST00000376573.4
|
PIP4K2A
|
phosphatidylinositol-5-phosphate 4-kinase, type II, alpha |
| chr16_-_20681177 | 2.90 |
ENST00000524149.1
|
ACSM1
|
acyl-CoA synthetase medium-chain family member 1 |
| chr22_-_41215328 | 2.89 |
ENST00000434185.1
ENST00000435456.2 |
SLC25A17
|
solute carrier family 25 (mitochondrial carrier; peroxisomal membrane protein, 34kDa), member 17 |
| chr8_-_82395461 | 2.88 |
ENST00000256104.4
|
FABP4
|
fatty acid binding protein 4, adipocyte |
| chr10_-_76868931 | 2.87 |
ENST00000372700.3
ENST00000473072.2 ENST00000491677.2 ENST00000607131.1 ENST00000372702.3 |
DUSP13
|
dual specificity phosphatase 13 |
| chr2_+_219246746 | 2.85 |
ENST00000233202.6
|
SLC11A1
|
solute carrier family 11 (proton-coupled divalent metal ion transporter), member 1 |
| chr2_+_61108771 | 2.85 |
ENST00000394479.3
|
REL
|
v-rel avian reticuloendotheliosis viral oncogene homolog |
| chr11_+_5009424 | 2.84 |
ENST00000300762.1
|
MMP26
|
matrix metallopeptidase 26 |
| chr11_-_59950486 | 2.83 |
ENST00000426738.2
ENST00000533023.1 ENST00000420732.2 |
MS4A6A
|
membrane-spanning 4-domains, subfamily A, member 6A |
| chr2_+_176972000 | 2.82 |
ENST00000249504.5
|
HOXD11
|
homeobox D11 |
| chr1_+_151584544 | 2.82 |
ENST00000458013.2
ENST00000368843.3 |
SNX27
|
sorting nexin family member 27 |
| chr6_+_127587755 | 2.81 |
ENST00000368314.1
ENST00000476956.1 ENST00000609447.1 ENST00000356799.2 ENST00000477776.1 ENST00000609944.1 |
RNF146
|
ring finger protein 146 |
| chr17_+_45331184 | 2.79 |
ENST00000559488.1
ENST00000571680.1 ENST00000435993.2 |
ITGB3
|
integrin, beta 3 (platelet glycoprotein IIIa, antigen CD61) |
| chr2_+_79252822 | 2.77 |
ENST00000272324.5
|
REG3G
|
regenerating islet-derived 3 gamma |
| chr17_+_7531281 | 2.77 |
ENST00000575729.1
ENST00000340624.5 |
SHBG
|
sex hormone-binding globulin |
| chr10_-_79789291 | 2.75 |
ENST00000372371.3
|
POLR3A
|
polymerase (RNA) III (DNA directed) polypeptide A, 155kDa |
| chr14_-_76447494 | 2.75 |
ENST00000238682.3
|
TGFB3
|
transforming growth factor, beta 3 |
| chr11_-_47736896 | 2.75 |
ENST00000525123.1
ENST00000528244.1 ENST00000532595.1 ENST00000529154.1 ENST00000530969.1 |
AGBL2
|
ATP/GTP binding protein-like 2 |
| chr1_+_202995611 | 2.73 |
ENST00000367240.2
|
PPFIA4
|
protein tyrosine phosphatase, receptor type, f polypeptide (PTPRF), interacting protein (liprin), alpha 4 |
| chr1_+_199996702 | 2.73 |
ENST00000367362.3
|
NR5A2
|
nuclear receptor subfamily 5, group A, member 2 |
| chr14_-_24584138 | 2.72 |
ENST00000558280.1
ENST00000561028.1 |
NRL
|
neural retina leucine zipper |
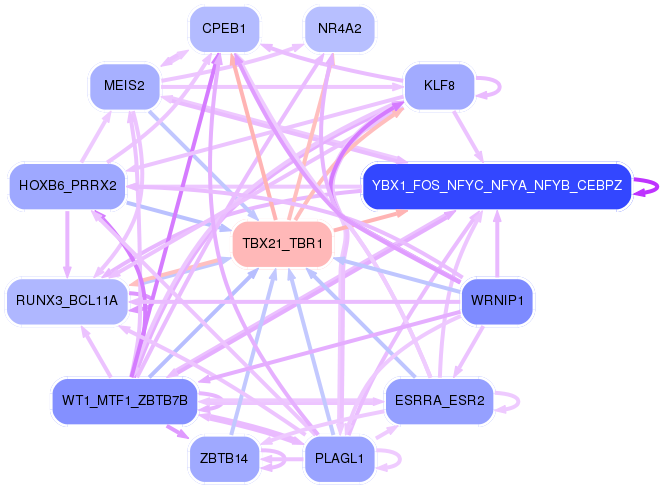
Network of associatons between targets according to the STRING database.

First level regulatory network of TBX21_TBR1
Gene Ontology Analysis
Gene overrepresentation in biological_process category:
| Log-likelihood per target | Total log-likelihood | Term | Description |
|---|---|---|---|
| 6.8 | 27.1 | GO:0002904 | positive regulation of B cell apoptotic process(GO:0002904) |
| 5.8 | 17.5 | GO:0032474 | otolith morphogenesis(GO:0032474) |
| 3.8 | 11.5 | GO:2000048 | negative regulation of cell-cell adhesion mediated by cadherin(GO:2000048) |
| 3.8 | 11.3 | GO:0090219 | negative regulation of lipid kinase activity(GO:0090219) |
| 3.7 | 29.9 | GO:2000766 | negative regulation of cytoplasmic translation(GO:2000766) |
| 3.4 | 27.5 | GO:0001661 | conditioned taste aversion(GO:0001661) |
| 3.4 | 16.9 | GO:0043091 | L-arginine import(GO:0043091) arginine import(GO:0090467) L-arginine transport(GO:1902023) |
| 2.8 | 8.3 | GO:0021538 | epithalamus development(GO:0021538) habenula development(GO:0021986) |
| 2.7 | 8.2 | GO:0044278 | cell wall disruption in other organism(GO:0044278) |
| 2.6 | 18.3 | GO:1903818 | positive regulation of voltage-gated potassium channel activity(GO:1903818) |
| 2.3 | 7.0 | GO:2000777 | positive regulation of oocyte maturation(GO:1900195) negative regulation of NLRP3 inflammasome complex assembly(GO:1900226) positive regulation of proteasomal ubiquitin-dependent protein catabolic process involved in cellular response to hypoxia(GO:2000777) |
| 2.3 | 9.2 | GO:0019470 | 4-hydroxyproline catabolic process(GO:0019470) |
| 2.1 | 12.4 | GO:1902847 | macrophage proliferation(GO:0061517) microglial cell proliferation(GO:0061518) regulation of neuronal signal transduction(GO:1902847) positive regulation of neurofibrillary tangle assembly(GO:1902998) |
| 1.8 | 5.5 | GO:0050760 | negative regulation of thymidylate synthase biosynthetic process(GO:0050760) |
| 1.7 | 8.7 | GO:0016998 | cell wall macromolecule catabolic process(GO:0016998) |
| 1.7 | 5.1 | GO:0038188 | cholecystokinin signaling pathway(GO:0038188) |
| 1.6 | 4.7 | GO:0048627 | myoblast development(GO:0048627) positive regulation of G0 to G1 transition(GO:0070318) |
| 1.5 | 7.6 | GO:0051622 | negative regulation of dopamine uptake involved in synaptic transmission(GO:0051585) norepinephrine uptake(GO:0051620) regulation of norepinephrine uptake(GO:0051621) negative regulation of norepinephrine uptake(GO:0051622) negative regulation of catecholamine uptake involved in synaptic transmission(GO:0051945) regulation of glutathione peroxidase activity(GO:1903282) positive regulation of glutathione peroxidase activity(GO:1903284) positive regulation of hydrogen peroxide catabolic process(GO:1903285) regulation of peroxidase activity(GO:2000468) positive regulation of peroxidase activity(GO:2000470) |
| 1.4 | 6.9 | GO:1904100 | regulation of protein O-linked glycosylation(GO:1904098) positive regulation of protein O-linked glycosylation(GO:1904100) |
| 1.3 | 9.0 | GO:1903593 | regulation of histamine secretion by mast cell(GO:1903593) |
| 1.3 | 6.4 | GO:0010936 | negative regulation of macrophage cytokine production(GO:0010936) |
| 1.3 | 6.3 | GO:0030070 | insulin processing(GO:0030070) |
| 1.3 | 10.0 | GO:0002074 | extraocular skeletal muscle development(GO:0002074) |
| 1.2 | 3.7 | GO:0098758 | response to interleukin-8(GO:0098758) cellular response to interleukin-8(GO:0098759) |
| 1.2 | 8.4 | GO:2000503 | positive regulation of natural killer cell chemotaxis(GO:2000503) |
| 1.2 | 7.0 | GO:2001181 | positive regulation of interleukin-10 secretion(GO:2001181) |
| 1.2 | 9.2 | GO:0034983 | peptidyl-lysine deacetylation(GO:0034983) |
| 1.1 | 20.6 | GO:0010457 | centriole-centriole cohesion(GO:0010457) |
| 1.1 | 3.4 | GO:0051037 | histone displacement(GO:0001207) regulation of transcription involved in meiotic cell cycle(GO:0051037) positive regulation of transcription involved in meiotic cell cycle(GO:0051039) |
| 1.1 | 4.5 | GO:0060708 | spongiotrophoblast differentiation(GO:0060708) |
| 1.1 | 4.5 | GO:0048859 | formation of anatomical boundary(GO:0048859) |
| 1.1 | 3.4 | GO:2000523 | dendritic cell dendrite assembly(GO:0097026) regulation of T cell costimulation(GO:2000523) positive regulation of T cell costimulation(GO:2000525) regulation of dendritic cell dendrite assembly(GO:2000547) |
| 1.1 | 8.8 | GO:0002051 | osteoblast fate commitment(GO:0002051) |
| 1.1 | 3.2 | GO:0007418 | ventral midline development(GO:0007418) smoothened signaling pathway involved in regulation of cerebellar granule cell precursor cell proliferation(GO:0021938) |
| 1.1 | 1.1 | GO:0048022 | negative regulation of melanin biosynthetic process(GO:0048022) negative regulation of secondary metabolite biosynthetic process(GO:1900377) |
| 1.1 | 4.3 | GO:0097368 | establishment of Sertoli cell barrier(GO:0097368) |
| 1.1 | 3.2 | GO:0045082 | interleukin-4 biosynthetic process(GO:0042097) positive regulation of interleukin-10 biosynthetic process(GO:0045082) regulation of interleukin-4 biosynthetic process(GO:0045402) positive regulation of interleukin-4 biosynthetic process(GO:0045404) |
| 1.0 | 3.1 | GO:0060164 | regulation of timing of neuron differentiation(GO:0060164) |
| 1.0 | 3.1 | GO:0021913 | regulation of transcription from RNA polymerase II promoter involved in ventral spinal cord interneuron specification(GO:0021913) |
| 1.0 | 4.9 | GO:0048388 | endosomal lumen acidification(GO:0048388) |
| 1.0 | 2.9 | GO:0018874 | benzoate metabolic process(GO:0018874) butyrate metabolic process(GO:0019605) |
| 0.9 | 2.7 | GO:0035610 | protein side chain deglutamylation(GO:0035610) |
| 0.9 | 4.6 | GO:0010793 | regulation of mRNA export from nucleus(GO:0010793) |
| 0.9 | 4.5 | GO:0006398 | mRNA 3'-end processing by stem-loop binding and cleavage(GO:0006398) |
| 0.9 | 17.6 | GO:0030277 | maintenance of gastrointestinal epithelium(GO:0030277) |
| 0.9 | 6.1 | GO:0006749 | glutathione metabolic process(GO:0006749) |
| 0.8 | 5.0 | GO:0019262 | N-acetylneuraminate catabolic process(GO:0019262) |
| 0.8 | 2.5 | GO:0071284 | cellular response to lead ion(GO:0071284) |
| 0.8 | 3.3 | GO:0021633 | optic nerve structural organization(GO:0021633) |
| 0.8 | 16.5 | GO:2000052 | positive regulation of non-canonical Wnt signaling pathway(GO:2000052) |
| 0.8 | 2.3 | GO:0060940 | epithelial to mesenchymal transition involved in cardiac fibroblast development(GO:0060940) |
| 0.7 | 2.2 | GO:0032661 | central nervous system myelin formation(GO:0032289) regulation of interleukin-18 production(GO:0032661) detection of bacterial lipoprotein(GO:0042494) detection of triacyl bacterial lipopeptide(GO:0042495) detection of bacterial lipopeptide(GO:0070340) |
| 0.7 | 25.1 | GO:0008045 | motor neuron axon guidance(GO:0008045) |
| 0.7 | 3.5 | GO:0030382 | sperm mitochondrion organization(GO:0030382) |
| 0.7 | 2.8 | GO:0045715 | negative regulation of low-density lipoprotein particle receptor biosynthetic process(GO:0045715) |
| 0.7 | 4.2 | GO:0016554 | cytidine to uridine editing(GO:0016554) |
| 0.7 | 2.8 | GO:0061113 | pancreas morphogenesis(GO:0061113) |
| 0.7 | 4.9 | GO:0097411 | hypoxia-inducible factor-1alpha signaling pathway(GO:0097411) |
| 0.7 | 3.5 | GO:0044856 | plasma membrane raft distribution(GO:0044855) plasma membrane raft localization(GO:0044856) plasma membrane raft polarization(GO:0044858) regulation of plasma membrane raft polarization(GO:1903906) |
| 0.7 | 2.7 | GO:0045872 | positive regulation of rhodopsin gene expression(GO:0045872) |
| 0.7 | 2.0 | GO:0033214 | iron assimilation(GO:0033212) iron assimilation by chelation and transport(GO:0033214) positive regulation of bone mineralization involved in bone maturation(GO:1900159) negative regulation of tumor necrosis factor (ligand) superfamily member 11 production(GO:2000308) |
| 0.6 | 2.5 | GO:0000255 | allantoin metabolic process(GO:0000255) |
| 0.6 | 4.3 | GO:0000160 | phosphorelay signal transduction system(GO:0000160) |
| 0.6 | 0.6 | GO:0045976 | negative regulation of mitotic cell cycle, embryonic(GO:0045976) |
| 0.6 | 4.2 | GO:2000389 | regulation of neutrophil extravasation(GO:2000389) |
| 0.6 | 7.0 | GO:1900747 | negative regulation of vascular endothelial growth factor signaling pathway(GO:1900747) |
| 0.6 | 1.2 | GO:0048867 | stem cell fate determination(GO:0048867) |
| 0.6 | 4.6 | GO:0006531 | aspartate metabolic process(GO:0006531) |
| 0.6 | 2.8 | GO:0001767 | establishment of lymphocyte polarity(GO:0001767) |
| 0.6 | 1.7 | GO:1990502 | dense core granule maturation(GO:1990502) |
| 0.5 | 6.5 | GO:0001915 | negative regulation of T cell mediated cytotoxicity(GO:0001915) |
| 0.5 | 8.2 | GO:0050862 | positive regulation of T cell receptor signaling pathway(GO:0050862) |
| 0.5 | 2.1 | GO:1904327 | maintenance of unfolded protein(GO:0036506) protein localization to cytosolic proteasome complex(GO:1904327) maintenance of unfolded protein involved in ERAD pathway(GO:1904378) protein localization to cytosolic proteasome complex involved in ERAD pathway(GO:1904379) |
| 0.5 | 9.0 | GO:0097151 | positive regulation of inhibitory postsynaptic potential(GO:0097151) modulation of inhibitory postsynaptic potential(GO:0098828) |
| 0.5 | 3.5 | GO:0035356 | cellular triglyceride homeostasis(GO:0035356) |
| 0.5 | 1.5 | GO:0015888 | thiamine transport(GO:0015888) thiamine transmembrane transport(GO:0071934) |
| 0.5 | 5.3 | GO:0031848 | protection from non-homologous end joining at telomere(GO:0031848) |
| 0.5 | 5.3 | GO:0098870 | neuronal action potential propagation(GO:0019227) action potential propagation(GO:0098870) |
| 0.5 | 7.6 | GO:0061365 | positive regulation of triglyceride lipase activity(GO:0061365) |
| 0.5 | 3.7 | GO:0070475 | rRNA base methylation(GO:0070475) |
| 0.5 | 4.7 | GO:1902951 | negative regulation of dendritic spine maintenance(GO:1902951) |
| 0.5 | 5.9 | GO:1904903 | ESCRT complex disassembly(GO:1904896) ESCRT III complex disassembly(GO:1904903) |
| 0.5 | 1.8 | GO:2000317 | T-helper 1 cell lineage commitment(GO:0002296) cellular response to mercury ion(GO:0071288) negative regulation of complement-dependent cytotoxicity(GO:1903660) negative regulation of T-helper 17 type immune response(GO:2000317) negative regulation of T-helper 17 cell differentiation(GO:2000320) positive regulation of eosinophil migration(GO:2000418) |
| 0.4 | 5.8 | GO:0070050 | neuron cellular homeostasis(GO:0070050) |
| 0.4 | 12.1 | GO:0042276 | error-prone translesion synthesis(GO:0042276) |
| 0.4 | 3.0 | GO:0009642 | response to light intensity(GO:0009642) |
| 0.4 | 5.6 | GO:0017121 | phospholipid scrambling(GO:0017121) |
| 0.4 | 3.7 | GO:0007144 | female meiosis I(GO:0007144) |
| 0.4 | 1.2 | GO:0051710 | regulation of cytolysis in other organism(GO:0051710) |
| 0.4 | 4.1 | GO:0001955 | blood vessel maturation(GO:0001955) |
| 0.4 | 0.4 | GO:0021855 | hypothalamus cell migration(GO:0021855) |
| 0.4 | 2.0 | GO:0072023 | thick ascending limb development(GO:0072023) metanephric thick ascending limb development(GO:0072233) |
| 0.4 | 0.4 | GO:2000171 | negative regulation of dendrite development(GO:2000171) |
| 0.4 | 1.5 | GO:0014028 | notochord formation(GO:0014028) |
| 0.4 | 3.4 | GO:2000049 | positive regulation of cell-cell adhesion mediated by cadherin(GO:2000049) |
| 0.4 | 1.1 | GO:0061394 | regulation of transcription from RNA polymerase II promoter in response to arsenic-containing substance(GO:0061394) |
| 0.4 | 10.4 | GO:0035428 | hexose transmembrane transport(GO:0035428) glucose transmembrane transport(GO:1904659) |
| 0.4 | 1.8 | GO:0060718 | negative regulation of cytokinesis(GO:0032466) chorionic trophoblast cell differentiation(GO:0060718) |
| 0.4 | 9.2 | GO:0009235 | cobalamin metabolic process(GO:0009235) |
| 0.4 | 7.1 | GO:0071420 | cellular response to histamine(GO:0071420) |
| 0.3 | 5.2 | GO:0018105 | peptidyl-serine phosphorylation(GO:0018105) |
| 0.3 | 4.8 | GO:0032516 | positive regulation of phosphoprotein phosphatase activity(GO:0032516) |
| 0.3 | 1.7 | GO:0018243 | protein O-linked glycosylation via threonine(GO:0018243) |
| 0.3 | 4.3 | GO:0010603 | regulation of cytoplasmic mRNA processing body assembly(GO:0010603) |
| 0.3 | 2.7 | GO:0002710 | negative regulation of T cell mediated immunity(GO:0002710) |
| 0.3 | 0.3 | GO:0002408 | myeloid dendritic cell chemotaxis(GO:0002408) |
| 0.3 | 1.9 | GO:1903760 | regulation of voltage-gated potassium channel activity involved in ventricular cardiac muscle cell action potential repolarization(GO:1903760) |
| 0.3 | 7.8 | GO:0048935 | peripheral nervous system neuron differentiation(GO:0048934) peripheral nervous system neuron development(GO:0048935) |
| 0.3 | 2.2 | GO:0045653 | negative regulation of megakaryocyte differentiation(GO:0045653) |
| 0.3 | 21.4 | GO:0007602 | phototransduction(GO:0007602) |
| 0.3 | 2.6 | GO:0034378 | acylglycerol transport(GO:0034196) triglyceride transport(GO:0034197) chylomicron assembly(GO:0034378) |
| 0.3 | 2.0 | GO:0097354 | protein prenylation(GO:0018342) protein geranylgeranylation(GO:0018344) prenylation(GO:0097354) |
| 0.3 | 3.7 | GO:0090527 | actin filament reorganization(GO:0090527) |
| 0.3 | 5.7 | GO:0032012 | regulation of ARF protein signal transduction(GO:0032012) |
| 0.3 | 0.8 | GO:0097254 | renal tubular secretion(GO:0097254) |
| 0.3 | 0.3 | GO:0071926 | endocannabinoid signaling pathway(GO:0071926) |
| 0.3 | 1.4 | GO:0090309 | positive regulation of methylation-dependent chromatin silencing(GO:0090309) |
| 0.3 | 1.3 | GO:1903385 | regulation of homophilic cell adhesion(GO:1903385) |
| 0.3 | 0.8 | GO:0034124 | regulation of MyD88-dependent toll-like receptor signaling pathway(GO:0034124) negative regulation of macrophage apoptotic process(GO:2000110) |
| 0.3 | 1.1 | GO:0035962 | response to interleukin-13(GO:0035962) |
| 0.2 | 2.0 | GO:0010533 | regulation of activation of Janus kinase activity(GO:0010533) |
| 0.2 | 2.9 | GO:2000786 | positive regulation of autophagosome assembly(GO:2000786) |
| 0.2 | 2.7 | GO:0015871 | choline transport(GO:0015871) |
| 0.2 | 2.9 | GO:0048003 | antigen processing and presentation of lipid antigen via MHC class Ib(GO:0048003) antigen processing and presentation, exogenous lipid antigen via MHC class Ib(GO:0048007) |
| 0.2 | 1.9 | GO:0007258 | JUN phosphorylation(GO:0007258) |
| 0.2 | 7.2 | GO:0045898 | regulation of RNA polymerase II transcriptional preinitiation complex assembly(GO:0045898) |
| 0.2 | 1.1 | GO:0014835 | myoblast differentiation involved in skeletal muscle regeneration(GO:0014835) |
| 0.2 | 2.0 | GO:0045617 | negative regulation of keratinocyte differentiation(GO:0045617) |
| 0.2 | 1.8 | GO:0035934 | corticosterone secretion(GO:0035934) regulation of corticosterone secretion(GO:2000852) |
| 0.2 | 3.4 | GO:1990573 | potassium ion import across plasma membrane(GO:1990573) |
| 0.2 | 4.2 | GO:2001275 | positive regulation of glucose import in response to insulin stimulus(GO:2001275) |
| 0.2 | 2.3 | GO:0045046 | protein import into peroxisome membrane(GO:0045046) |
| 0.2 | 1.0 | GO:0032455 | nerve growth factor processing(GO:0032455) |
| 0.2 | 1.4 | GO:0043654 | recognition of apoptotic cell(GO:0043654) |
| 0.2 | 1.0 | GO:0070092 | regulation of glucagon secretion(GO:0070092) |
| 0.2 | 1.6 | GO:0006116 | NADH oxidation(GO:0006116) |
| 0.2 | 3.7 | GO:0042789 | mRNA transcription from RNA polymerase II promoter(GO:0042789) |
| 0.2 | 2.4 | GO:0015812 | gamma-aminobutyric acid transport(GO:0015812) |
| 0.2 | 0.9 | GO:0032571 | response to vitamin K(GO:0032571) |
| 0.2 | 2.3 | GO:1902593 | single-organism nuclear import(GO:1902593) |
| 0.2 | 1.5 | GO:2001205 | negative regulation of osteoclast development(GO:2001205) |
| 0.2 | 0.6 | GO:0002331 | pre-B cell differentiation(GO:0002329) pre-B cell allelic exclusion(GO:0002331) |
| 0.2 | 1.9 | GO:0007130 | synaptonemal complex assembly(GO:0007130) |
| 0.2 | 4.3 | GO:0007422 | peripheral nervous system development(GO:0007422) |
| 0.2 | 5.9 | GO:0007205 | protein kinase C-activating G-protein coupled receptor signaling pathway(GO:0007205) |
| 0.2 | 1.5 | GO:0043152 | induction of bacterial agglutination(GO:0043152) |
| 0.2 | 0.5 | GO:0035522 | monoubiquitinated histone deubiquitination(GO:0035521) monoubiquitinated histone H2A deubiquitination(GO:0035522) |
| 0.2 | 1.4 | GO:0060770 | negative regulation of epithelial cell proliferation involved in prostate gland development(GO:0060770) |
| 0.1 | 3.2 | GO:1903861 | positive regulation of dendrite extension(GO:1903861) |
| 0.1 | 1.6 | GO:0008612 | peptidyl-lysine modification to peptidyl-hypusine(GO:0008612) |
| 0.1 | 3.6 | GO:0006957 | complement activation, alternative pathway(GO:0006957) |
| 0.1 | 4.8 | GO:0006607 | NLS-bearing protein import into nucleus(GO:0006607) |
| 0.1 | 19.7 | GO:0046718 | viral entry into host cell(GO:0046718) |
| 0.1 | 7.2 | GO:0006904 | vesicle docking involved in exocytosis(GO:0006904) |
| 0.1 | 2.3 | GO:0006878 | cellular copper ion homeostasis(GO:0006878) |
| 0.1 | 2.2 | GO:0035635 | entry of bacterium into host cell(GO:0035635) |
| 0.1 | 1.9 | GO:0016264 | gap junction assembly(GO:0016264) |
| 0.1 | 5.1 | GO:0048536 | spleen development(GO:0048536) |
| 0.1 | 2.9 | GO:0050872 | white fat cell differentiation(GO:0050872) |
| 0.1 | 1.4 | GO:0019800 | peptide cross-linking via chondroitin 4-sulfate glycosaminoglycan(GO:0019800) |
| 0.1 | 5.2 | GO:0018149 | peptide cross-linking(GO:0018149) |
| 0.1 | 3.3 | GO:0003301 | physiological muscle hypertrophy(GO:0003298) physiological cardiac muscle hypertrophy(GO:0003301) cell growth involved in cardiac muscle cell development(GO:0061049) |
| 0.1 | 1.1 | GO:0000722 | telomere maintenance via recombination(GO:0000722) |
| 0.1 | 2.4 | GO:0016254 | preassembly of GPI anchor in ER membrane(GO:0016254) |
| 0.1 | 1.2 | GO:0042118 | endothelial cell activation(GO:0042118) |
| 0.1 | 0.8 | GO:0031118 | rRNA pseudouridine synthesis(GO:0031118) |
| 0.1 | 1.6 | GO:0051123 | RNA polymerase II transcriptional preinitiation complex assembly(GO:0051123) |
| 0.1 | 3.4 | GO:0001569 | patterning of blood vessels(GO:0001569) |
| 0.1 | 2.1 | GO:0048485 | sympathetic nervous system development(GO:0048485) |
| 0.1 | 1.6 | GO:2000251 | positive regulation of actin cytoskeleton reorganization(GO:2000251) |
| 0.1 | 3.3 | GO:0051567 | histone H3-K9 methylation(GO:0051567) |
| 0.1 | 13.1 | GO:0008277 | regulation of G-protein coupled receptor protein signaling pathway(GO:0008277) |
| 0.1 | 2.4 | GO:0035338 | long-chain fatty-acyl-CoA biosynthetic process(GO:0035338) |
| 0.1 | 4.3 | GO:0071377 | cellular response to glucagon stimulus(GO:0071377) |
| 0.1 | 8.4 | GO:0021510 | spinal cord development(GO:0021510) |
| 0.1 | 3.8 | GO:0070306 | lens fiber cell differentiation(GO:0070306) |
| 0.1 | 1.1 | GO:0060484 | lung-associated mesenchyme development(GO:0060484) |
| 0.1 | 0.3 | GO:0060474 | positive regulation of sperm motility involved in capacitation(GO:0060474) |
| 0.1 | 3.0 | GO:0045026 | plasma membrane fusion(GO:0045026) |
| 0.1 | 6.4 | GO:0019933 | cAMP-mediated signaling(GO:0019933) |
| 0.1 | 0.3 | GO:0086023 | adrenergic receptor signaling pathway involved in heart process(GO:0086023) regulation of the force of heart contraction by cardiac conduction(GO:0086092) G-protein coupled receptor signaling pathway involved in heart process(GO:0086103) regulation of calcium ion binding(GO:1901876) negative regulation of calcium ion binding(GO:1901877) negative regulation of calcium-transporting ATPase activity(GO:1901895) regulation of calcium ion import into sarcoplasmic reticulum(GO:1902080) negative regulation of calcium ion import into sarcoplasmic reticulum(GO:1902081) |
| 0.1 | 1.3 | GO:0060134 | prepulse inhibition(GO:0060134) |
| 0.1 | 0.7 | GO:0060137 | maternal process involved in parturition(GO:0060137) |
| 0.1 | 5.4 | GO:0051865 | protein autoubiquitination(GO:0051865) |
| 0.1 | 3.4 | GO:0014047 | glutamate secretion(GO:0014047) |
| 0.1 | 4.0 | GO:0050775 | positive regulation of dendrite morphogenesis(GO:0050775) |
| 0.1 | 1.1 | GO:0006611 | protein export from nucleus(GO:0006611) |
| 0.1 | 2.8 | GO:0006383 | transcription from RNA polymerase III promoter(GO:0006383) |
| 0.1 | 1.6 | GO:0035024 | negative regulation of Rho protein signal transduction(GO:0035024) |
| 0.1 | 2.2 | GO:0050869 | negative regulation of B cell activation(GO:0050869) |
| 0.1 | 0.5 | GO:0010944 | negative regulation of transcription by competitive promoter binding(GO:0010944) |
| 0.1 | 6.7 | GO:0042795 | snRNA transcription(GO:0009301) snRNA transcription from RNA polymerase II promoter(GO:0042795) |
| 0.1 | 1.2 | GO:0045954 | positive regulation of natural killer cell mediated cytotoxicity(GO:0045954) |
| 0.1 | 1.4 | GO:0007030 | Golgi organization(GO:0007030) |
| 0.1 | 4.6 | GO:0007368 | determination of left/right symmetry(GO:0007368) |
| 0.1 | 1.6 | GO:0045494 | photoreceptor cell maintenance(GO:0045494) |
| 0.1 | 1.1 | GO:0001764 | neuron migration(GO:0001764) |
| 0.1 | 2.0 | GO:0034080 | CENP-A containing nucleosome assembly(GO:0034080) CENP-A containing chromatin organization(GO:0061641) |
| 0.1 | 0.7 | GO:0046606 | negative regulation of centrosome cycle(GO:0046606) |
| 0.1 | 3.2 | GO:0006306 | DNA alkylation(GO:0006305) DNA methylation(GO:0006306) |
| 0.1 | 0.8 | GO:0030220 | platelet formation(GO:0030220) |
| 0.1 | 0.7 | GO:0015884 | folic acid transport(GO:0015884) |
| 0.1 | 4.3 | GO:0031295 | T cell costimulation(GO:0031295) |
| 0.1 | 3.2 | GO:0006910 | phagocytosis, recognition(GO:0006910) |
| 0.1 | 3.6 | GO:0032435 | negative regulation of proteasomal ubiquitin-dependent protein catabolic process(GO:0032435) |
| 0.1 | 0.5 | GO:2000507 | positive regulation of energy homeostasis(GO:2000507) |
| 0.1 | 0.7 | GO:0014059 | dopamine secretion(GO:0014046) regulation of dopamine secretion(GO:0014059) |
| 0.1 | 1.2 | GO:0090200 | positive regulation of release of cytochrome c from mitochondria(GO:0090200) |
| 0.1 | 0.6 | GO:0006657 | CDP-choline pathway(GO:0006657) |
| 0.1 | 0.6 | GO:0042149 | cellular response to glucose starvation(GO:0042149) |
| 0.1 | 2.6 | GO:0051965 | positive regulation of synapse assembly(GO:0051965) |
| 0.0 | 1.6 | GO:0048247 | lymphocyte chemotaxis(GO:0048247) |
| 0.0 | 0.9 | GO:0008053 | mitochondrial fusion(GO:0008053) |
| 0.0 | 0.7 | GO:0034599 | cellular response to oxidative stress(GO:0034599) |
| 0.0 | 0.3 | GO:0018879 | biphenyl metabolic process(GO:0018879) |
| 0.0 | 4.5 | GO:0048010 | vascular endothelial growth factor receptor signaling pathway(GO:0048010) |
| 0.0 | 1.0 | GO:0006590 | thyroid hormone generation(GO:0006590) |
| 0.0 | 0.2 | GO:0039536 | negative regulation of RIG-I signaling pathway(GO:0039536) |
| 0.0 | 2.0 | GO:0070527 | platelet aggregation(GO:0070527) |
| 0.0 | 2.3 | GO:0006730 | one-carbon metabolic process(GO:0006730) |
| 0.0 | 1.2 | GO:0050832 | defense response to fungus(GO:0050832) |
| 0.0 | 0.8 | GO:0021591 | ventricular system development(GO:0021591) |
| 0.0 | 1.0 | GO:0045746 | negative regulation of Notch signaling pathway(GO:0045746) |
| 0.0 | 2.5 | GO:0007218 | neuropeptide signaling pathway(GO:0007218) |
| 0.0 | 0.3 | GO:0071447 | cellular response to hydroperoxide(GO:0071447) |
| 0.0 | 0.2 | GO:0048739 | cardiac muscle fiber development(GO:0048739) |
| 0.0 | 1.4 | GO:0016050 | vesicle organization(GO:0016050) |
| 0.0 | 1.2 | GO:0019228 | neuronal action potential(GO:0019228) |
| 0.0 | 1.3 | GO:0008285 | negative regulation of cell proliferation(GO:0008285) |
| 0.0 | 3.8 | GO:0002262 | myeloid cell homeostasis(GO:0002262) |
| 0.0 | 10.4 | GO:0002250 | adaptive immune response(GO:0002250) |
| 0.0 | 1.9 | GO:0050728 | negative regulation of inflammatory response(GO:0050728) |
| 0.0 | 1.1 | GO:0051693 | actin filament capping(GO:0051693) |
| 0.0 | 2.8 | GO:0009311 | oligosaccharide metabolic process(GO:0009311) |
| 0.0 | 1.1 | GO:0042267 | natural killer cell mediated cytotoxicity(GO:0042267) |
| 0.0 | 0.8 | GO:0046676 | negative regulation of insulin secretion(GO:0046676) |
| 0.0 | 1.1 | GO:0051568 | histone H3-K4 methylation(GO:0051568) |
| 0.0 | 4.2 | GO:0006614 | SRP-dependent cotranslational protein targeting to membrane(GO:0006614) |
| 0.0 | 0.4 | GO:0006198 | cAMP catabolic process(GO:0006198) |
| 0.0 | 3.8 | GO:0042742 | defense response to bacterium(GO:0042742) |
| 0.0 | 0.4 | GO:0006874 | cellular calcium ion homeostasis(GO:0006874) calcium ion homeostasis(GO:0055074) |
| 0.0 | 0.8 | GO:0016236 | macroautophagy(GO:0016236) |
| 0.0 | 4.1 | GO:0071804 | cellular potassium ion transport(GO:0071804) potassium ion transmembrane transport(GO:0071805) |
| 0.0 | 0.1 | GO:0003408 | optic cup formation involved in camera-type eye development(GO:0003408) oxidative stress-induced premature senescence(GO:0090403) |
| 0.0 | 0.9 | GO:0009953 | dorsal/ventral pattern formation(GO:0009953) |
| 0.0 | 1.2 | GO:0030500 | regulation of bone mineralization(GO:0030500) |
| 0.0 | 0.1 | GO:1900220 | semaphorin-plexin signaling pathway involved in bone trabecula morphogenesis(GO:1900220) |
| 0.0 | 0.2 | GO:0035095 | behavioral response to nicotine(GO:0035095) |
| 0.0 | 1.5 | GO:0006687 | glycosphingolipid metabolic process(GO:0006687) |
| 0.0 | 0.3 | GO:0032060 | bleb assembly(GO:0032060) |
| 0.0 | 0.7 | GO:0006654 | phosphatidic acid biosynthetic process(GO:0006654) phosphatidic acid metabolic process(GO:0046473) |
| 0.0 | 0.5 | GO:0033344 | cholesterol efflux(GO:0033344) |
| 0.0 | 1.7 | GO:0071222 | cellular response to lipopolysaccharide(GO:0071222) |
| 0.0 | 1.1 | GO:0030168 | platelet activation(GO:0030168) |
| 0.0 | 0.4 | GO:0030101 | natural killer cell activation(GO:0030101) |
| 0.0 | 1.4 | GO:0070268 | cornification(GO:0070268) |
| 0.0 | 0.3 | GO:0045948 | positive regulation of translational initiation(GO:0045948) |
| 0.0 | 0.1 | GO:0018022 | peptidyl-lysine methylation(GO:0018022) |
| 0.0 | 0.2 | GO:0022037 | cerebellum development(GO:0021549) metencephalon development(GO:0022037) |
| 0.0 | 1.2 | GO:0030879 | mammary gland development(GO:0030879) |
| 0.0 | 1.2 | GO:0007156 | homophilic cell adhesion via plasma membrane adhesion molecules(GO:0007156) |
| 0.0 | 0.9 | GO:0051291 | protein heterooligomerization(GO:0051291) |
Gene overrepresentation in cellular_component category:
| Log-likelihood per target | Total log-likelihood | Term | Description |
|---|---|---|---|
| 3.2 | 25.4 | GO:0035976 | AP1 complex(GO:0035976) |
| 2.2 | 9.0 | GO:0070044 | synaptobrevin 2-SNAP-25-syntaxin-1a-complexin I complex(GO:0070032) synaptobrevin 2-SNAP-25-syntaxin-1a complex(GO:0070044) |
| 1.4 | 4.2 | GO:0030895 | apolipoprotein B mRNA editing enzyme complex(GO:0030895) |
| 1.2 | 22.8 | GO:1990124 | messenger ribonucleoprotein complex(GO:1990124) |
| 0.9 | 3.7 | GO:0005712 | chiasma(GO:0005712) |
| 0.9 | 10.3 | GO:0033010 | paranodal junction(GO:0033010) |
| 0.8 | 6.7 | GO:0005672 | transcription factor TFIIA complex(GO:0005672) |
| 0.8 | 9.8 | GO:0060077 | inhibitory synapse(GO:0060077) |
| 0.8 | 5.5 | GO:0001520 | outer dense fiber(GO:0001520) |
| 0.8 | 5.5 | GO:1990812 | growth cone filopodium(GO:1990812) |
| 0.8 | 5.3 | GO:0030870 | Mre11 complex(GO:0030870) |
| 0.7 | 12.4 | GO:0034366 | spherical high-density lipoprotein particle(GO:0034366) |
| 0.7 | 5.8 | GO:0044294 | dendritic growth cone(GO:0044294) |
| 0.7 | 2.2 | GO:0035354 | Toll-like receptor 1-Toll-like receptor 2 protein complex(GO:0035354) |
| 0.7 | 2.8 | GO:0071062 | alphav-beta3 integrin-vitronectin complex(GO:0071062) |
| 0.6 | 4.8 | GO:0045179 | apical cortex(GO:0045179) |
| 0.6 | 1.1 | GO:1990622 | CHOP-ATF3 complex(GO:1990622) |
| 0.5 | 2.1 | GO:0071818 | BAT3 complex(GO:0071818) ER membrane insertion complex(GO:0072379) |
| 0.5 | 2.0 | GO:0005968 | Rab-protein geranylgeranyltransferase complex(GO:0005968) |
| 0.5 | 7.0 | GO:0098647 | collagen type VI trimer(GO:0005589) collagen beaded filament(GO:0098647) |
| 0.5 | 2.4 | GO:0031501 | mannosyltransferase complex(GO:0031501) |
| 0.5 | 3.2 | GO:0097013 | phagocytic vesicle lumen(GO:0097013) |
| 0.4 | 2.8 | GO:0071203 | WASH complex(GO:0071203) |
| 0.4 | 10.2 | GO:0032982 | myosin filament(GO:0032982) |
| 0.4 | 3.3 | GO:0005955 | calcineurin complex(GO:0005955) |
| 0.4 | 8.2 | GO:0000242 | pericentriolar material(GO:0000242) |
| 0.3 | 18.2 | GO:0030286 | dynein complex(GO:0030286) |
| 0.3 | 9.6 | GO:0031092 | platelet alpha granule membrane(GO:0031092) |
| 0.3 | 10.4 | GO:0042629 | mast cell granule(GO:0042629) |
| 0.3 | 30.9 | GO:0035578 | azurophil granule lumen(GO:0035578) |
| 0.3 | 4.8 | GO:0000145 | exocyst(GO:0000145) |
| 0.3 | 4.7 | GO:0005687 | U4 snRNP(GO:0005687) |
| 0.3 | 3.5 | GO:0097227 | sperm annulus(GO:0097227) |
| 0.3 | 1.6 | GO:0034464 | BBSome(GO:0034464) |
| 0.3 | 3.5 | GO:0030478 | actin cap(GO:0030478) |
| 0.3 | 1.8 | GO:0030121 | AP-1 adaptor complex(GO:0030121) |
| 0.3 | 7.9 | GO:0030673 | axolemma(GO:0030673) |
| 0.2 | 2.8 | GO:0033256 | I-kappaB/NF-kappaB complex(GO:0033256) |
| 0.2 | 2.1 | GO:0098839 | postsynaptic density membrane(GO:0098839) |
| 0.2 | 3.2 | GO:0000788 | nuclear nucleosome(GO:0000788) |
| 0.2 | 16.5 | GO:0022627 | cytosolic small ribosomal subunit(GO:0022627) |
| 0.2 | 7.1 | GO:1902711 | GABA-A receptor complex(GO:1902711) |
| 0.2 | 4.2 | GO:0005942 | phosphatidylinositol 3-kinase complex(GO:0005942) |
| 0.2 | 1.9 | GO:0043219 | lateral loop(GO:0043219) |
| 0.2 | 9.9 | GO:0016235 | aggresome(GO:0016235) |
| 0.2 | 3.2 | GO:0031235 | intrinsic component of the cytoplasmic side of the plasma membrane(GO:0031235) |
| 0.2 | 3.4 | GO:0005890 | sodium:potassium-exchanging ATPase complex(GO:0005890) |
| 0.2 | 25.5 | GO:0031225 | anchored component of membrane(GO:0031225) |
| 0.2 | 1.9 | GO:0008385 | IkappaB kinase complex(GO:0008385) |
| 0.1 | 2.5 | GO:0043020 | NADPH oxidase complex(GO:0043020) |
| 0.1 | 12.7 | GO:0005814 | centriole(GO:0005814) |
| 0.1 | 5.1 | GO:0034707 | chloride channel complex(GO:0034707) |
| 0.1 | 3.8 | GO:0097542 | ciliary tip(GO:0097542) |
| 0.1 | 1.5 | GO:0005577 | fibrinogen complex(GO:0005577) |
| 0.1 | 16.6 | GO:0005923 | bicellular tight junction(GO:0005923) |
| 0.1 | 1.1 | GO:0097197 | tetraspanin-enriched microdomain(GO:0097197) |
| 0.1 | 1.6 | GO:0034451 | centriolar satellite(GO:0034451) |
| 0.1 | 8.6 | GO:0101003 | ficolin-1-rich granule membrane(GO:0101003) |
| 0.1 | 2.8 | GO:0005666 | DNA-directed RNA polymerase III complex(GO:0005666) |
| 0.1 | 4.3 | GO:0001772 | immunological synapse(GO:0001772) |
| 0.1 | 1.9 | GO:0005922 | connexon complex(GO:0005922) |
| 0.1 | 1.6 | GO:0000124 | SAGA complex(GO:0000124) |
| 0.1 | 1.1 | GO:0044666 | MLL3/4 complex(GO:0044666) |
| 0.1 | 1.6 | GO:0005859 | muscle myosin complex(GO:0005859) |
| 0.1 | 2.6 | GO:0043235 | receptor complex(GO:0043235) |
| 0.1 | 2.5 | GO:0030140 | trans-Golgi network transport vesicle(GO:0030140) |
| 0.1 | 4.2 | GO:0001533 | cornified envelope(GO:0001533) |
| 0.1 | 17.7 | GO:0072562 | blood microparticle(GO:0072562) |
| 0.1 | 8.8 | GO:0034705 | voltage-gated potassium channel complex(GO:0008076) potassium channel complex(GO:0034705) |
| 0.1 | 7.2 | GO:0031093 | platelet alpha granule lumen(GO:0031093) |
| 0.1 | 3.2 | GO:0048786 | presynaptic active zone(GO:0048786) |
| 0.1 | 2.9 | GO:0005776 | autophagosome(GO:0005776) |
| 0.1 | 1.8 | GO:0009897 | external side of plasma membrane(GO:0009897) |
| 0.1 | 1.2 | GO:0001518 | voltage-gated sodium channel complex(GO:0001518) |
| 0.1 | 2.2 | GO:0080008 | Cul4-RING E3 ubiquitin ligase complex(GO:0080008) |
| 0.1 | 1.1 | GO:0005682 | U5 snRNP(GO:0005682) |
| 0.1 | 1.9 | GO:0000795 | synaptonemal complex(GO:0000795) |
| 0.1 | 4.5 | GO:0015030 | Cajal body(GO:0015030) |
| 0.1 | 5.8 | GO:0043202 | lysosomal lumen(GO:0043202) |
| 0.1 | 8.8 | GO:0031234 | extrinsic component of cytoplasmic side of plasma membrane(GO:0031234) |
| 0.1 | 7.2 | GO:0032587 | ruffle membrane(GO:0032587) |
| 0.1 | 3.2 | GO:0010494 | cytoplasmic stress granule(GO:0010494) |
| 0.1 | 0.3 | GO:0090533 | cation-transporting ATPase complex(GO:0090533) |
| 0.1 | 1.5 | GO:0009898 | cytoplasmic side of plasma membrane(GO:0009898) |
| 0.1 | 1.2 | GO:0035327 | transcriptionally active chromatin(GO:0035327) |
| 0.0 | 1.6 | GO:0031672 | A band(GO:0031672) |
| 0.0 | 3.5 | GO:0005581 | collagen trimer(GO:0005581) |
| 0.0 | 4.1 | GO:0098852 | lysosomal membrane(GO:0005765) lytic vacuole membrane(GO:0098852) |
| 0.0 | 0.2 | GO:0097208 | alveolar lamellar body(GO:0097208) |
| 0.0 | 0.3 | GO:0043196 | varicosity(GO:0043196) |
| 0.0 | 1.4 | GO:0045095 | keratin filament(GO:0045095) |
| 0.0 | 4.2 | GO:0005578 | proteinaceous extracellular matrix(GO:0005578) |
| 0.0 | 4.3 | GO:0043204 | perikaryon(GO:0043204) |
| 0.0 | 2.2 | GO:0005796 | Golgi lumen(GO:0005796) |
| 0.0 | 0.7 | GO:0031231 | integral component of peroxisomal membrane(GO:0005779) intrinsic component of peroxisomal membrane(GO:0031231) |
| 0.0 | 1.4 | GO:0008023 | transcription elongation factor complex(GO:0008023) |
| 0.0 | 4.6 | GO:0005802 | trans-Golgi network(GO:0005802) |
| 0.0 | 1.6 | GO:0035580 | specific granule lumen(GO:0035580) |
| 0.0 | 0.8 | GO:0000407 | pre-autophagosomal structure(GO:0000407) |
| 0.0 | 1.4 | GO:0005764 | lytic vacuole(GO:0000323) lysosome(GO:0005764) |
| 0.0 | 0.3 | GO:0097225 | sperm midpiece(GO:0097225) |
| 0.0 | 3.4 | GO:0055037 | recycling endosome(GO:0055037) |
| 0.0 | 2.8 | GO:0030658 | transport vesicle membrane(GO:0030658) |
| 0.0 | 3.9 | GO:0030027 | lamellipodium(GO:0030027) |
| 0.0 | 16.5 | GO:0005615 | extracellular space(GO:0005615) |
| 0.0 | 0.5 | GO:0001669 | acrosomal vesicle(GO:0001669) |
| 0.0 | 0.2 | GO:0034098 | VCP-NPL4-UFD1 AAA ATPase complex(GO:0034098) |
| 0.0 | 0.3 | GO:0005952 | cAMP-dependent protein kinase complex(GO:0005952) |
| 0.0 | 1.5 | GO:0016605 | PML body(GO:0016605) |
| 0.0 | 0.2 | GO:0097228 | sperm principal piece(GO:0097228) |
| 0.0 | 0.3 | GO:0002102 | podosome(GO:0002102) |
Gene overrepresentation in molecular_function category:
| Log-likelihood per target | Total log-likelihood | Term | Description |
|---|---|---|---|
| 6.8 | 27.3 | GO:0042030 | ATPase inhibitor activity(GO:0042030) |
| 5.9 | 17.8 | GO:0050528 | acyloxyacyl hydrolase activity(GO:0050528) |
| 3.1 | 9.4 | GO:0051139 | metal ion:proton antiporter activity(GO:0051139) |
| 2.3 | 7.0 | GO:0034739 | histone deacetylase activity (H4-K16 specific)(GO:0034739) |
| 2.1 | 12.8 | GO:0042610 | CD8 receptor binding(GO:0042610) |
| 1.9 | 29.9 | GO:0035925 | mRNA 3'-UTR AU-rich region binding(GO:0035925) |
| 1.7 | 5.1 | GO:0004951 | cholecystokinin receptor activity(GO:0004951) |
| 1.7 | 5.0 | GO:0016833 | oxo-acid-lyase activity(GO:0016833) |
| 1.5 | 7.6 | GO:0060961 | phospholipase D inhibitor activity(GO:0060961) |
| 1.5 | 4.6 | GO:0004515 | nicotinate-nucleotide adenylyltransferase activity(GO:0004515) |
| 1.5 | 4.5 | GO:0047696 | beta-adrenergic receptor kinase activity(GO:0047696) |
| 1.5 | 8.7 | GO:0003796 | lysozyme activity(GO:0003796) |
| 1.2 | 3.7 | GO:0016434 | rRNA (cytosine) methyltransferase activity(GO:0016434) |
| 1.2 | 3.7 | GO:0019959 | interleukin-8 binding(GO:0019959) |
| 1.2 | 8.4 | GO:0031726 | CCR1 chemokine receptor binding(GO:0031726) |
| 1.1 | 9.2 | GO:1904315 | neurotransmitter receptor activity involved in regulation of postsynaptic membrane potential(GO:0099529) transmitter-gated ion channel activity involved in regulation of postsynaptic membrane potential(GO:1904315) |
| 1.1 | 6.9 | GO:0004169 | dolichyl-phosphate-mannose-protein mannosyltransferase activity(GO:0004169) |
| 1.1 | 3.2 | GO:0004917 | interleukin-7 receptor activity(GO:0004917) |
| 1.0 | 2.9 | GO:0016309 | 1-phosphatidylinositol-5-phosphate 4-kinase activity(GO:0016309) |
| 1.0 | 10.6 | GO:0070492 | oligosaccharide binding(GO:0070492) |
| 0.9 | 3.7 | GO:0008889 | glycerophosphodiester phosphodiesterase activity(GO:0008889) |
| 0.9 | 2.8 | GO:0034714 | type III transforming growth factor beta receptor binding(GO:0034714) |
| 0.9 | 18.2 | GO:0045504 | dynein heavy chain binding(GO:0045504) |
| 0.9 | 5.3 | GO:0008597 | calcium-dependent protein serine/threonine phosphatase regulator activity(GO:0008597) |
| 0.8 | 2.5 | GO:0050698 | proteoglycan sulfotransferase activity(GO:0050698) |
| 0.8 | 2.5 | GO:0032767 | copper-dependent protein binding(GO:0032767) |
| 0.8 | 14.5 | GO:0051787 | misfolded protein binding(GO:0051787) |
| 0.7 | 10.4 | GO:0055056 | D-glucose transmembrane transporter activity(GO:0055056) |
| 0.7 | 36.8 | GO:0070412 | R-SMAD binding(GO:0070412) |
| 0.7 | 4.3 | GO:0000155 | phosphorelay sensor kinase activity(GO:0000155) |
| 0.7 | 15.7 | GO:0005251 | delayed rectifier potassium channel activity(GO:0005251) |
| 0.7 | 8.2 | GO:0005078 | MAP-kinase scaffold activity(GO:0005078) |
| 0.6 | 9.2 | GO:0017136 | NAD-dependent histone deacetylase activity(GO:0017136) |
| 0.6 | 3.0 | GO:0008273 | calcium, potassium:sodium antiporter activity(GO:0008273) |
| 0.6 | 2.4 | GO:0004376 | glycolipid mannosyltransferase activity(GO:0004376) |
| 0.6 | 2.4 | GO:0060422 | peptidyl-dipeptidase inhibitor activity(GO:0060422) |
| 0.6 | 2.3 | GO:0015220 | choline transmembrane transporter activity(GO:0015220) |
| 0.6 | 26.7 | GO:0046875 | ephrin receptor binding(GO:0046875) |
| 0.6 | 10.7 | GO:0035259 | glucocorticoid receptor binding(GO:0035259) |
| 0.5 | 1.6 | GO:0010698 | acetyltransferase activator activity(GO:0010698) |
| 0.5 | 7.4 | GO:0016813 | hydrolase activity, acting on carbon-nitrogen (but not peptide) bonds, in linear amidines(GO:0016813) |
| 0.5 | 5.3 | GO:0098505 | G-rich strand telomeric DNA binding(GO:0098505) |
| 0.5 | 5.6 | GO:0017128 | phospholipid scramblase activity(GO:0017128) |
| 0.5 | 4.6 | GO:0043560 | insulin receptor substrate binding(GO:0043560) |
| 0.5 | 4.6 | GO:0017151 | DEAD/H-box RNA helicase binding(GO:0017151) |
| 0.5 | 5.5 | GO:0048156 | tau protein binding(GO:0048156) |
| 0.5 | 1.5 | GO:0015403 | thiamine transmembrane transporter activity(GO:0015234) thiamine uptake transmembrane transporter activity(GO:0015403) |
| 0.5 | 2.0 | GO:0070051 | fibrinogen binding(GO:0070051) |
| 0.5 | 11.3 | GO:0043548 | phosphatidylinositol 3-kinase binding(GO:0043548) |
| 0.5 | 4.2 | GO:0046935 | 1-phosphatidylinositol-3-kinase regulator activity(GO:0046935) |
| 0.5 | 10.5 | GO:0051428 | peptide hormone receptor binding(GO:0051428) |
| 0.5 | 6.3 | GO:0042043 | neurexin family protein binding(GO:0042043) |
| 0.4 | 1.8 | GO:0070996 | type 1 melanocortin receptor binding(GO:0070996) |
| 0.4 | 10.0 | GO:0097493 | muscle alpha-actinin binding(GO:0051371) structural molecule activity conferring elasticity(GO:0097493) |
| 0.4 | 2.1 | GO:0008046 | axon guidance receptor activity(GO:0008046) |
| 0.4 | 12.1 | GO:0003887 | DNA-directed DNA polymerase activity(GO:0003887) |
| 0.4 | 1.7 | GO:0019828 | aspartic-type endopeptidase inhibitor activity(GO:0019828) |
| 0.4 | 3.3 | GO:0033192 | calmodulin-dependent protein phosphatase activity(GO:0033192) |
| 0.4 | 1.2 | GO:0016019 | peptidoglycan receptor activity(GO:0016019) |
| 0.4 | 2.4 | GO:0015185 | gamma-aminobutyric acid:sodium symporter activity(GO:0005332) gamma-aminobutyric acid transmembrane transporter activity(GO:0015185) |
| 0.4 | 6.0 | GO:0004551 | nucleotide diphosphatase activity(GO:0004551) |
| 0.4 | 3.7 | GO:0019237 | satellite DNA binding(GO:0003696) centromeric DNA binding(GO:0019237) |
| 0.4 | 5.1 | GO:0071723 | lipopeptide binding(GO:0071723) |
| 0.4 | 9.2 | GO:0016646 | oxidoreductase activity, acting on the CH-NH group of donors, NAD or NADP as acceptor(GO:0016646) |
| 0.3 | 2.8 | GO:0019960 | C-X3-C chemokine binding(GO:0019960) |
| 0.3 | 7.6 | GO:0004806 | triglyceride lipase activity(GO:0004806) |
| 0.3 | 5.9 | GO:0004143 | diacylglycerol kinase activity(GO:0004143) |
| 0.3 | 2.9 | GO:0004321 | fatty-acyl-CoA synthase activity(GO:0004321) |
| 0.3 | 3.7 | GO:0019957 | C-C chemokine binding(GO:0019957) |
| 0.3 | 9.3 | GO:0017075 | syntaxin-1 binding(GO:0017075) |
| 0.3 | 3.5 | GO:0045159 | myosin II binding(GO:0045159) |
| 0.3 | 6.3 | GO:0005247 | voltage-gated chloride channel activity(GO:0005247) |
| 0.3 | 1.6 | GO:0005119 | smoothened binding(GO:0005119) |
| 0.3 | 1.1 | GO:0031728 | CCR3 chemokine receptor binding(GO:0031728) |
| 0.3 | 12.9 | GO:0043425 | bHLH transcription factor binding(GO:0043425) |
| 0.2 | 1.2 | GO:0004663 | Rab geranylgeranyltransferase activity(GO:0004663) |
| 0.2 | 24.0 | GO:0001618 | virus receptor activity(GO:0001618) |
| 0.2 | 4.8 | GO:0017091 | AU-rich element binding(GO:0017091) |
| 0.2 | 3.4 | GO:0005391 | sodium:potassium-exchanging ATPase activity(GO:0005391) |
| 0.2 | 5.7 | GO:0005086 | ARF guanyl-nucleotide exchange factor activity(GO:0005086) |
| 0.2 | 1.1 | GO:0031697 | beta-1 adrenergic receptor binding(GO:0031697) |
| 0.2 | 21.4 | GO:0004867 | serine-type endopeptidase inhibitor activity(GO:0004867) |
| 0.2 | 1.6 | GO:0005497 | androgen binding(GO:0005497) |
| 0.2 | 1.8 | GO:0004791 | thioredoxin-disulfide reductase activity(GO:0004791) |
| 0.2 | 1.1 | GO:0030109 | HLA-B specific inhibitory MHC class I receptor activity(GO:0030109) |
| 0.2 | 0.5 | GO:0034041 | sterol-transporting ATPase activity(GO:0034041) |
| 0.2 | 1.9 | GO:0097016 | L27 domain binding(GO:0097016) |
| 0.2 | 6.8 | GO:0017025 | TBP-class protein binding(GO:0017025) |
| 0.2 | 1.0 | GO:0004447 | iodide peroxidase activity(GO:0004447) |
| 0.2 | 6.7 | GO:0001784 | phosphotyrosine binding(GO:0001784) |
| 0.2 | 0.7 | GO:0017040 | ceramidase activity(GO:0017040) |
| 0.2 | 14.9 | GO:0005070 | SH3/SH2 adaptor activity(GO:0005070) |
| 0.2 | 2.7 | GO:0043522 | leucine zipper domain binding(GO:0043522) |
| 0.2 | 0.6 | GO:0004307 | diacylglycerol cholinephosphotransferase activity(GO:0004142) ethanolaminephosphotransferase activity(GO:0004307) |
| 0.1 | 9.1 | GO:0016278 | lysine N-methyltransferase activity(GO:0016278) protein-lysine N-methyltransferase activity(GO:0016279) |
| 0.1 | 10.7 | GO:0019843 | rRNA binding(GO:0019843) |
| 0.1 | 1.6 | GO:0004332 | fructose-bisphosphate aldolase activity(GO:0004332) |
| 0.1 | 39.7 | GO:0004252 | serine-type endopeptidase activity(GO:0004252) |
| 0.1 | 1.1 | GO:0034061 | telomerase activity(GO:0003720) RNA-directed DNA polymerase activity(GO:0003964) DNA polymerase activity(GO:0034061) |
| 0.1 | 1.8 | GO:0004726 | non-membrane spanning protein tyrosine phosphatase activity(GO:0004726) |
| 0.1 | 2.3 | GO:0004089 | carbonate dehydratase activity(GO:0004089) |
| 0.1 | 2.4 | GO:0102391 | decanoate--CoA ligase activity(GO:0102391) |
| 0.1 | 2.0 | GO:0005159 | insulin-like growth factor receptor binding(GO:0005159) |
| 0.1 | 1.9 | GO:0005243 | gap junction channel activity(GO:0005243) |
| 0.1 | 2.5 | GO:0016175 | superoxide-generating NADPH oxidase activity(GO:0016175) |
| 0.1 | 1.0 | GO:0003810 | protein-glutamine gamma-glutamyltransferase activity(GO:0003810) |
| 0.1 | 6.1 | GO:0004364 | glutathione transferase activity(GO:0004364) |
| 0.1 | 2.8 | GO:0001056 | RNA polymerase III activity(GO:0001056) |
| 0.1 | 2.3 | GO:0008093 | cytoskeletal adaptor activity(GO:0008093) |
| 0.1 | 1.2 | GO:0031419 | cobalamin binding(GO:0031419) |
| 0.1 | 7.0 | GO:0050840 | extracellular matrix binding(GO:0050840) |
| 0.1 | 0.7 | GO:0004035 | alkaline phosphatase activity(GO:0004035) |
| 0.1 | 1.7 | GO:0004653 | polypeptide N-acetylgalactosaminyltransferase activity(GO:0004653) |
| 0.1 | 2.8 | GO:0032266 | phosphatidylinositol-3-phosphate binding(GO:0032266) |
| 0.1 | 15.2 | GO:0030674 | protein binding, bridging(GO:0030674) |
| 0.1 | 2.0 | GO:0019864 | IgG binding(GO:0019864) |
| 0.1 | 16.0 | GO:0003823 | antigen binding(GO:0003823) |
| 0.1 | 1.1 | GO:0051525 | NFAT protein binding(GO:0051525) |
| 0.1 | 2.7 | GO:0004181 | metallocarboxypeptidase activity(GO:0004181) |
| 0.1 | 15.7 | GO:0001078 | transcriptional repressor activity, RNA polymerase II core promoter proximal region sequence-specific binding(GO:0001078) |
| 0.1 | 9.6 | GO:0017048 | Rho GTPase binding(GO:0017048) |
| 0.1 | 0.8 | GO:0009982 | pseudouridine synthase activity(GO:0009982) |
| 0.1 | 3.4 | GO:0070577 | lysine-acetylated histone binding(GO:0070577) |
| 0.1 | 0.8 | GO:1901702 | urate transmembrane transporter activity(GO:0015143) salt transmembrane transporter activity(GO:1901702) |
| 0.1 | 3.9 | GO:0005164 | tumor necrosis factor receptor binding(GO:0005164) |
| 0.1 | 5.0 | GO:0019905 | syntaxin binding(GO:0019905) |
| 0.1 | 4.1 | GO:0005160 | transforming growth factor beta receptor binding(GO:0005160) |
| 0.1 | 0.6 | GO:0080025 | phosphatidylinositol-3,5-bisphosphate binding(GO:0080025) |
| 0.1 | 0.8 | GO:0030676 | Rac guanyl-nucleotide exchange factor activity(GO:0030676) |
| 0.1 | 0.2 | GO:0036487 | nitric-oxide synthase inhibitor activity(GO:0036487) |
| 0.1 | 3.4 | GO:0017112 | Rab guanyl-nucleotide exchange factor activity(GO:0017112) |
| 0.1 | 2.9 | GO:0005089 | Rho guanyl-nucleotide exchange factor activity(GO:0005089) |
| 0.1 | 2.6 | GO:0005548 | phospholipid transporter activity(GO:0005548) |
| 0.1 | 0.8 | GO:0004065 | arylsulfatase activity(GO:0004065) |
| 0.1 | 0.8 | GO:0030215 | semaphorin receptor binding(GO:0030215) |
| 0.1 | 2.9 | GO:0005504 | fatty acid binding(GO:0005504) |
| 0.1 | 0.3 | GO:0039552 | RIG-I binding(GO:0039552) |
| 0.1 | 1.1 | GO:0043539 | protein serine/threonine kinase activator activity(GO:0043539) |
| 0.1 | 1.3 | GO:0005001 | transmembrane receptor protein tyrosine phosphatase activity(GO:0005001) transmembrane receptor protein phosphatase activity(GO:0019198) |
| 0.1 | 1.6 | GO:0048020 | CCR chemokine receptor binding(GO:0048020) |
| 0.1 | 1.7 | GO:0030507 | spectrin binding(GO:0030507) |
| 0.1 | 3.2 | GO:0005507 | copper ion binding(GO:0005507) |
| 0.1 | 1.2 | GO:0005248 | voltage-gated sodium channel activity(GO:0005248) voltage-gated ion channel activity involved in regulation of postsynaptic membrane potential(GO:1905030) |
| 0.0 | 14.3 | GO:0005096 | GTPase activator activity(GO:0005096) |
| 0.0 | 0.9 | GO:0051400 | BH domain binding(GO:0051400) |
| 0.0 | 0.6 | GO:0004859 | phospholipase inhibitor activity(GO:0004859) |
| 0.0 | 1.3 | GO:0008276 | protein methyltransferase activity(GO:0008276) |
| 0.0 | 2.2 | GO:0033613 | activating transcription factor binding(GO:0033613) |
| 0.0 | 0.7 | GO:0005542 | folic acid binding(GO:0005542) |
| 0.0 | 5.0 | GO:0003705 | transcription factor activity, RNA polymerase II distal enhancer sequence-specific binding(GO:0003705) |
| 0.0 | 0.5 | GO:0008190 | eukaryotic initiation factor 4E binding(GO:0008190) |
| 0.0 | 0.7 | GO:0008569 | ATP-dependent microtubule motor activity, minus-end-directed(GO:0008569) |
| 0.0 | 4.2 | GO:0003725 | double-stranded RNA binding(GO:0003725) |
| 0.0 | 0.6 | GO:0015467 | G-protein activated inward rectifier potassium channel activity(GO:0015467) |
| 0.0 | 0.3 | GO:0015643 | toxic substance binding(GO:0015643) |
| 0.0 | 0.2 | GO:0017018 | myosin phosphatase activity(GO:0017018) |
| 0.0 | 0.2 | GO:0004563 | beta-N-acetylhexosaminidase activity(GO:0004563) |
| 0.0 | 2.3 | GO:0051117 | ATPase binding(GO:0051117) |
| 0.0 | 0.6 | GO:0042813 | Wnt-activated receptor activity(GO:0042813) |
| 0.0 | 1.1 | GO:0005518 | collagen binding(GO:0005518) |
| 0.0 | 0.3 | GO:0047372 | acylglycerol lipase activity(GO:0047372) |
| 0.0 | 2.0 | GO:0031625 | ubiquitin protein ligase binding(GO:0031625) |
| 0.0 | 0.6 | GO:0048487 | beta-tubulin binding(GO:0048487) |
| 0.0 | 3.5 | GO:0030246 | carbohydrate binding(GO:0030246) |
| 0.0 | 2.3 | GO:0035091 | phosphatidylinositol binding(GO:0035091) |
| 0.0 | 0.4 | GO:0004115 | 3',5'-cyclic-AMP phosphodiesterase activity(GO:0004115) |
| 0.0 | 1.7 | GO:0019900 | kinase binding(GO:0019900) |
| 0.0 | 0.3 | GO:0043495 | protein anchor(GO:0043495) |
| 0.0 | 3.5 | GO:0061630 | ubiquitin protein ligase activity(GO:0061630) |
| 0.0 | 0.3 | GO:0008191 | metalloendopeptidase inhibitor activity(GO:0008191) |
| 0.0 | 0.3 | GO:0034236 | protein kinase A catalytic subunit binding(GO:0034236) |
Gene overrepresentation in C2:CP category:
| Log-likelihood per target | Total log-likelihood | Term | Description |
|---|---|---|---|
| 1.2 | 25.4 | PID TCR RAS PATHWAY | Ras signaling in the CD4+ TCR pathway |
| 0.6 | 14.1 | PID CIRCADIAN PATHWAY | Circadian rhythm pathway |
| 0.6 | 4.5 | PID CXCR4 PATHWAY | CXCR4-mediated signaling events |
| 0.6 | 32.5 | PID AURORA A PATHWAY | Aurora A signaling |
| 0.5 | 16.2 | PID HDAC CLASSIII PATHWAY | Signaling events mediated by HDAC Class III |
| 0.4 | 28.9 | PID ERBB4 PATHWAY | ErbB4 signaling events |
| 0.4 | 25.1 | PID RAC1 REG PATHWAY | Regulation of RAC1 activity |
| 0.4 | 27.6 | PID FGF PATHWAY | FGF signaling pathway |
| 0.3 | 10.5 | PID NFKAPPAB ATYPICAL PATHWAY | Atypical NF-kappaB pathway |
| 0.3 | 6.0 | ST G ALPHA S PATHWAY | G alpha s Pathway |
| 0.3 | 13.2 | PID TCR CALCIUM PATHWAY | Calcium signaling in the CD4+ TCR pathway |
| 0.2 | 19.0 | PID IL4 2PATHWAY | IL4-mediated signaling events |
| 0.2 | 1.5 | PID EPHA2 FWD PATHWAY | EPHA2 forward signaling |
| 0.2 | 11.1 | PID FRA PATHWAY | Validated transcriptional targets of AP1 family members Fra1 and Fra2 |
| 0.2 | 3.9 | PID TCR JNK PATHWAY | JNK signaling in the CD4+ TCR pathway |
| 0.2 | 2.8 | PID AR NONGENOMIC PATHWAY | Nongenotropic Androgen signaling |
| 0.2 | 9.3 | PID WNT NONCANONICAL PATHWAY | Noncanonical Wnt signaling pathway |
| 0.2 | 3.7 | PID IL8 CXCR1 PATHWAY | IL8- and CXCR1-mediated signaling events |
| 0.2 | 3.5 | PID AVB3 OPN PATHWAY | Osteopontin-mediated events |
| 0.2 | 9.9 | PID FAK PATHWAY | Signaling events mediated by focal adhesion kinase |
| 0.2 | 5.4 | PID ALPHA SYNUCLEIN PATHWAY | Alpha-synuclein signaling |
| 0.2 | 3.5 | PID EPHRINB REV PATHWAY | Ephrin B reverse signaling |
| 0.2 | 3.2 | ST GA12 PATHWAY | G alpha 12 Pathway |
| 0.2 | 28.6 | NABA ECM AFFILIATED | Genes encoding proteins affiliated structurally or functionally to extracellular matrix proteins |
| 0.2 | 11.6 | PID AP1 PATHWAY | AP-1 transcription factor network |
| 0.2 | 5.7 | PID PI3KCI PATHWAY | Class I PI3K signaling events |
| 0.1 | 2.7 | ST GRANULE CELL SURVIVAL PATHWAY | Granule Cell Survival Pathway is a specific case of more general PAC1 Receptor Pathway. |
| 0.1 | 4.3 | PID AMB2 NEUTROPHILS PATHWAY | amb2 Integrin signaling |
| 0.1 | 2.2 | PID NECTIN PATHWAY | Nectin adhesion pathway |
| 0.1 | 13.2 | PID ERBB1 DOWNSTREAM PATHWAY | ErbB1 downstream signaling |
| 0.1 | 6.3 | PID ARF6 TRAFFICKING PATHWAY | Arf6 trafficking events |
| 0.1 | 3.6 | PID IL1 PATHWAY | IL1-mediated signaling events |
| 0.1 | 6.1 | PID IL12 2PATHWAY | IL12-mediated signaling events |
| 0.1 | 2.2 | PID TOLL ENDOGENOUS PATHWAY | Endogenous TLR signaling |
| 0.1 | 2.8 | PID GLYPICAN 1PATHWAY | Glypican 1 network |
| 0.1 | 1.9 | PID ECADHERIN NASCENT AJ PATHWAY | E-cadherin signaling in the nascent adherens junction |
| 0.1 | 28.5 | NABA ECM REGULATORS | Genes encoding enzymes and their regulators involved in the remodeling of the extracellular matrix |
| 0.1 | 6.0 | PID TCR PATHWAY | TCR signaling in naïve CD4+ T cells |
| 0.1 | 2.6 | PID BCR 5PATHWAY | BCR signaling pathway |
| 0.1 | 1.9 | ST JNK MAPK PATHWAY | JNK MAPK Pathway |
| 0.1 | 2.8 | PID RAC1 PATHWAY | RAC1 signaling pathway |
| 0.1 | 3.2 | PID HEDGEHOG GLI PATHWAY | Hedgehog signaling events mediated by Gli proteins |
| 0.1 | 7.4 | PID MYC REPRESS PATHWAY | Validated targets of C-MYC transcriptional repression |
| 0.1 | 5.6 | PID CMYB PATHWAY | C-MYB transcription factor network |
| 0.1 | 2.9 | PID RHOA REG PATHWAY | Regulation of RhoA activity |
| 0.1 | 2.2 | PID AJDISS 2PATHWAY | Posttranslational regulation of adherens junction stability and dissassembly |
| 0.0 | 1.6 | PID MYC PATHWAY | C-MYC pathway |
| 0.0 | 0.9 | ST MYOCYTE AD PATHWAY | Myocyte Adrenergic Pathway is a specific case of the generalized Adrenergic Pathway. |
| 0.0 | 4.1 | PID P53 DOWNSTREAM PATHWAY | Direct p53 effectors |
| 0.0 | 1.8 | PID REG GR PATHWAY | Glucocorticoid receptor regulatory network |
| 0.0 | 0.9 | PID LIS1 PATHWAY | Lissencephaly gene (LIS1) in neuronal migration and development |
| 0.0 | 10.4 | NABA SECRETED FACTORS | Genes encoding secreted soluble factors |
| 0.0 | 1.6 | PID HNF3B PATHWAY | FOXA2 and FOXA3 transcription factor networks |
| 0.0 | 0.3 | PID IFNG PATHWAY | IFN-gamma pathway |
| 0.0 | 0.3 | PID NCADHERIN PATHWAY | N-cadherin signaling events |
| 0.0 | 0.3 | PID INTEGRIN A4B1 PATHWAY | Alpha4 beta1 integrin signaling events |
Gene overrepresentation in C2:CP:REACTOME category:
| Log-likelihood per target | Total log-likelihood | Term | Description |
|---|---|---|---|
| 1.3 | 26.5 | REACTOME ACTIVATION OF THE AP1 FAMILY OF TRANSCRIPTION FACTORS | Genes involved in Activation of the AP-1 family of transcription factors |
| 0.8 | 15.6 | REACTOME PECAM1 INTERACTIONS | Genes involved in PECAM1 interactions |
| 0.6 | 15.3 | REACTOME INSULIN SYNTHESIS AND PROCESSING | Genes involved in Insulin Synthesis and Processing |
| 0.5 | 19.2 | REACTOME YAP1 AND WWTR1 TAZ STIMULATED GENE EXPRESSION | Genes involved in YAP1- and WWTR1 (TAZ)-stimulated gene expression |
| 0.5 | 5.3 | REACTOME PACKAGING OF TELOMERE ENDS | Genes involved in Packaging Of Telomere Ends |
| 0.5 | 44.2 | REACTOME INTERFERON GAMMA SIGNALING | Genes involved in Interferon gamma signaling |
| 0.5 | 9.9 | REACTOME IL 7 SIGNALING | Genes involved in Interleukin-7 signaling |
| 0.4 | 20.0 | REACTOME VOLTAGE GATED POTASSIUM CHANNELS | Genes involved in Voltage gated Potassium channels |
| 0.4 | 2.8 | REACTOME ACTIVATION OF NF KAPPAB IN B CELLS | Genes involved in Activation of NF-kappaB in B Cells |
| 0.4 | 8.1 | REACTOME METAL ION SLC TRANSPORTERS | Genes involved in Metal ion SLC transporters |
| 0.3 | 4.5 | REACTOME SLBP DEPENDENT PROCESSING OF REPLICATION DEPENDENT HISTONE PRE MRNAS | Genes involved in SLBP Dependent Processing of Replication-Dependent Histone Pre-mRNAs |
| 0.3 | 7.0 | REACTOME CS DS DEGRADATION | Genes involved in CS/DS degradation |
| 0.2 | 2.5 | REACTOME BETA DEFENSINS | Genes involved in Beta defensins |
| 0.2 | 9.9 | REACTOME GENERATION OF SECOND MESSENGER MOLECULES | Genes involved in Generation of second messenger molecules |
| 0.2 | 5.9 | REACTOME ENDOSOMAL SORTING COMPLEX REQUIRED FOR TRANSPORT ESCRT | Genes involved in Endosomal Sorting Complex Required For Transport (ESCRT) |
| 0.2 | 2.8 | REACTOME RNA POL III CHAIN ELONGATION | Genes involved in RNA Polymerase III Chain Elongation |
| 0.2 | 4.6 | REACTOME TGF BETA RECEPTOR SIGNALING IN EMT EPITHELIAL TO MESENCHYMAL TRANSITION | Genes involved in TGF-beta receptor signaling in EMT (epithelial to mesenchymal transition) |
| 0.2 | 7.1 | REACTOME GABA A RECEPTOR ACTIVATION | Genes involved in GABA A receptor activation |
| 0.2 | 14.6 | REACTOME CIRCADIAN CLOCK | Genes involved in Circadian Clock |
| 0.2 | 9.3 | REACTOME METABOLISM OF STEROID HORMONES AND VITAMINS A AND D | Genes involved in Metabolism of steroid hormones and vitamins A and D |
| 0.2 | 13.5 | REACTOME CHEMOKINE RECEPTORS BIND CHEMOKINES | Genes involved in Chemokine receptors bind chemokines |
| 0.2 | 16.0 | REACTOME FORMATION OF THE TERNARY COMPLEX AND SUBSEQUENTLY THE 43S COMPLEX | Genes involved in Formation of the ternary complex, and subsequently, the 43S complex |
| 0.2 | 18.5 | REACTOME AMYLOIDS | Genes involved in Amyloids |
| 0.2 | 3.5 | REACTOME P130CAS LINKAGE TO MAPK SIGNALING FOR INTEGRINS | Genes involved in p130Cas linkage to MAPK signaling for integrins |
| 0.2 | 6.1 | REACTOME GLUTATHIONE CONJUGATION | Genes involved in Glutathione conjugation |
| 0.2 | 3.6 | REACTOME INITIAL TRIGGERING OF COMPLEMENT | Genes involved in Initial triggering of complement |
| 0.2 | 4.1 | REACTOME GLUCAGON SIGNALING IN METABOLIC REGULATION | Genes involved in Glucagon signaling in metabolic regulation |
| 0.2 | 1.2 | REACTOME DEFENSINS | Genes involved in Defensins |
| 0.2 | 2.3 | REACTOME REVERSIBLE HYDRATION OF CARBON DIOXIDE | Genes involved in Reversible Hydration of Carbon Dioxide |
| 0.2 | 4.8 | REACTOME DARPP 32 EVENTS | Genes involved in DARPP-32 events |
| 0.1 | 6.2 | REACTOME EFFECTS OF PIP2 HYDROLYSIS | Genes involved in Effects of PIP2 hydrolysis |
| 0.1 | 2.1 | REACTOME CREB PHOSPHORYLATION THROUGH THE ACTIVATION OF CAMKII | Genes involved in CREB phosphorylation through the activation of CaMKII |
| 0.1 | 3.2 | REACTOME SYNTHESIS OF GLYCOSYLPHOSPHATIDYLINOSITOL GPI | Genes involved in Synthesis of glycosylphosphatidylinositol (GPI) |
| 0.1 | 8.2 | REACTOME RNA POL II TRANSCRIPTION PRE INITIATION AND PROMOTER OPENING | Genes involved in RNA Polymerase II Transcription Pre-Initiation And Promoter Opening |
| 0.1 | 2.6 | REACTOME CHYLOMICRON MEDIATED LIPID TRANSPORT | Genes involved in Chylomicron-mediated lipid transport |
| 0.1 | 10.0 | REACTOME NUCLEAR RECEPTOR TRANSCRIPTION PATHWAY | Genes involved in Nuclear Receptor transcription pathway |
| 0.1 | 3.9 | REACTOME AMINE COMPOUND SLC TRANSPORTERS | Genes involved in Amine compound SLC transporters |
| 0.1 | 18.1 | REACTOME SIGNALING BY EGFR IN CANCER | Genes involved in Signaling by EGFR in Cancer |
| 0.1 | 0.4 | REACTOME PD1 SIGNALING | Genes involved in PD-1 signaling |
| 0.1 | 2.4 | REACTOME SYNTHESIS OF VERY LONG CHAIN FATTY ACYL COAS | Genes involved in Synthesis of very long-chain fatty acyl-CoAs |
| 0.1 | 5.9 | REACTOME ION TRANSPORT BY P TYPE ATPASES | Genes involved in Ion transport by P-type ATPases |
| 0.1 | 1.9 | REACTOME GAP JUNCTION ASSEMBLY | Genes involved in Gap junction assembly |
| 0.1 | 3.7 | REACTOME MEIOTIC RECOMBINATION | Genes involved in Meiotic Recombination |
| 0.1 | 2.9 | REACTOME SYNTHESIS OF PIPS AT THE PLASMA MEMBRANE | Genes involved in Synthesis of PIPs at the plasma membrane |
| 0.1 | 2.0 | REACTOME DEPOSITION OF NEW CENPA CONTAINING NUCLEOSOMES AT THE CENTROMERE | Genes involved in Deposition of New CENPA-containing Nucleosomes at the Centromere |
| 0.1 | 2.4 | REACTOME PTM GAMMA CARBOXYLATION HYPUSINE FORMATION AND ARYLSULFATASE ACTIVATION | Genes involved in PTM: gamma carboxylation, hypusine formation and arylsulfatase activation |
| 0.1 | 1.5 | REACTOME IONOTROPIC ACTIVITY OF KAINATE RECEPTORS | Genes involved in Ionotropic activity of Kainate Receptors |
| 0.1 | 0.9 | REACTOME COMMON PATHWAY | Genes involved in Common Pathway |
| 0.1 | 2.6 | REACTOME TIGHT JUNCTION INTERACTIONS | Genes involved in Tight junction interactions |
| 0.1 | 1.7 | REACTOME RIP MEDIATED NFKB ACTIVATION VIA DAI | Genes involved in RIP-mediated NFkB activation via DAI |
| 0.1 | 2.2 | REACTOME CELL CELL JUNCTION ORGANIZATION | Genes involved in Cell-cell junction organization |
| 0.1 | 11.0 | REACTOME SIGNALING BY RHO GTPASES | Genes involved in Signaling by Rho GTPases |
| 0.1 | 2.5 | REACTOME LATENT INFECTION OF HOMO SAPIENS WITH MYCOBACTERIUM TUBERCULOSIS | Genes involved in Latent infection of Homo sapiens with Mycobacterium tuberculosis |
| 0.0 | 1.0 | REACTOME AMINE DERIVED HORMONES | Genes involved in Amine-derived hormones |
| 0.0 | 0.8 | REACTOME ORGANIC CATION ANION ZWITTERION TRANSPORT | Genes involved in Organic cation/anion/zwitterion transport |
| 0.0 | 0.7 | REACTOME HIGHLY CALCIUM PERMEABLE POSTSYNAPTIC NICOTINIC ACETYLCHOLINE RECEPTORS | Genes involved in Highly calcium permeable postsynaptic nicotinic acetylcholine receptors |
| 0.0 | 5.1 | REACTOME PEPTIDE LIGAND BINDING RECEPTORS | Genes involved in Peptide ligand-binding receptors |
| 0.0 | 1.7 | REACTOME O LINKED GLYCOSYLATION OF MUCINS | Genes involved in O-linked glycosylation of mucins |
| 0.0 | 1.1 | REACTOME ACTIVATION OF GENES BY ATF4 | Genes involved in Activation of Genes by ATF4 |
| 0.0 | 1.6 | REACTOME GLYCOLYSIS | Genes involved in Glycolysis |
| 0.0 | 2.3 | REACTOME TRANSCRIPTIONAL REGULATION OF WHITE ADIPOCYTE DIFFERENTIATION | Genes involved in Transcriptional Regulation of White Adipocyte Differentiation |
| 0.0 | 0.6 | REACTOME SYNTHESIS OF PE | Genes involved in Synthesis of PE |
| 0.0 | 1.4 | REACTOME IL1 SIGNALING | Genes involved in Interleukin-1 signaling |
| 0.0 | 0.9 | REACTOME GLYCOSPHINGOLIPID METABOLISM | Genes involved in Glycosphingolipid metabolism |
| 0.0 | 0.5 | REACTOME ABCA TRANSPORTERS IN LIPID HOMEOSTASIS | Genes involved in ABCA transporters in lipid homeostasis |
| 0.0 | 1.8 | REACTOME METABOLISM OF VITAMINS AND COFACTORS | Genes involved in Metabolism of vitamins and cofactors |
| 0.0 | 0.6 | REACTOME INHIBITION OF VOLTAGE GATED CA2 CHANNELS VIA GBETA GAMMA SUBUNITS | Genes involved in Inhibition of voltage gated Ca2+ channels via Gbeta/gamma subunits |
| 0.0 | 0.8 | REACTOME IMMUNOREGULATORY INTERACTIONS BETWEEN A LYMPHOID AND A NON LYMPHOID CELL | Genes involved in Immunoregulatory interactions between a Lymphoid and a non-Lymphoid cell |