Project
GNF SymAtlas + NCI-60 cancer cell lines, comparison of cancers vs non-cancers, human (Su, 2004; Ross, 2000)
Navigation
Downloads
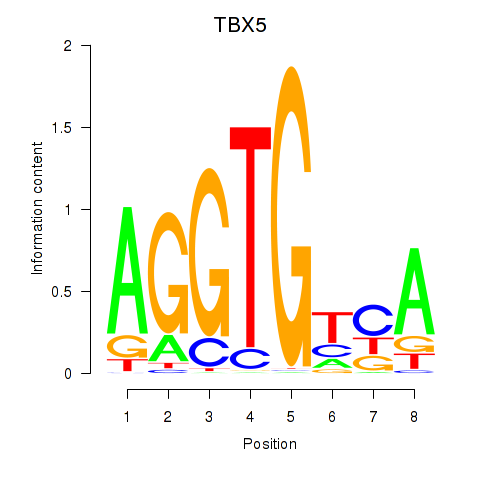
Results for TBX5
Z-value: 1.45
Motif logo
Transcription factors associated with TBX5
| Gene Symbol | Gene ID | Gene Info |
|---|---|---|
|
TBX5
|
ENSG00000089225.15 | T-box transcription factor 5 |
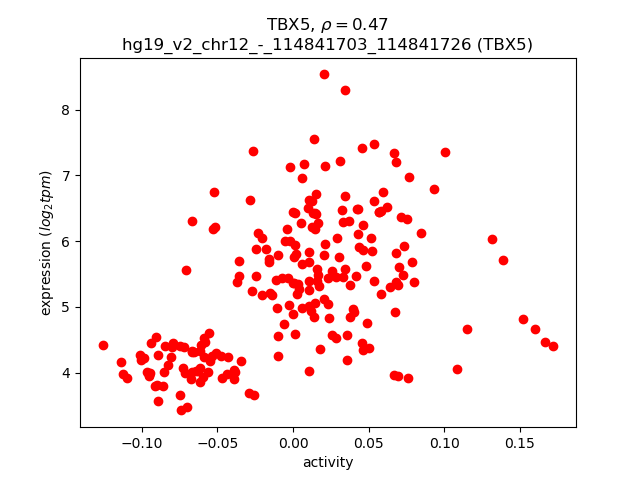
Activity-expression correlation:
| Gene | Promoter | Pearson corr. coef. | P-value | Plot |
|---|---|---|---|---|
| TBX5 | hg19_v2_chr12_-_114841703_114841726 | 0.47 | 1.2e-13 | Click! |
Activity profile of TBX5 motif
Sorted Z-values of TBX5 motif
| Promoter | Log-likelihood | Transcript | Gene | Gene Info |
|---|---|---|---|---|
| chr11_-_5248294 | 30.90 |
ENST00000335295.4
|
HBB
|
hemoglobin, beta |
| chr14_+_75746781 | 30.36 |
ENST00000555347.1
|
FOS
|
FBJ murine osteosarcoma viral oncogene homolog |
| chr3_+_167453493 | 21.49 |
ENST00000295777.5
ENST00000472747.2 |
SERPINI1
|
serpin peptidase inhibitor, clade I (neuroserpin), member 1 |
| chr16_+_2588012 | 20.02 |
ENST00000354836.5
ENST00000389224.3 |
PDPK1
|
3-phosphoinositide dependent protein kinase-1 |
| chr1_-_35325400 | 18.28 |
ENST00000521580.2
|
SMIM12
|
small integral membrane protein 12 |
| chr14_+_75745477 | 18.15 |
ENST00000303562.4
ENST00000554617.1 ENST00000554212.1 ENST00000535987.1 ENST00000555242.1 |
FOS
|
FBJ murine osteosarcoma viral oncogene homolog |
| chr12_-_45270077 | 17.47 |
ENST00000551601.1
ENST00000549027.1 ENST00000452445.2 |
NELL2
|
NEL-like 2 (chicken) |
| chr12_-_45270151 | 17.44 |
ENST00000429094.2
|
NELL2
|
NEL-like 2 (chicken) |
| chr5_-_127418755 | 16.68 |
ENST00000501702.2
ENST00000501173.2 ENST00000514573.1 ENST00000499346.2 ENST00000606251.1 |
CTC-228N24.3
|
CTC-228N24.3 |
| chr11_+_73358594 | 16.13 |
ENST00000227214.6
ENST00000398494.4 ENST00000543085.1 |
PLEKHB1
|
pleckstrin homology domain containing, family B (evectins) member 1 |
| chr4_-_120133661 | 15.90 |
ENST00000503243.1
ENST00000326780.3 |
RP11-455G16.1
|
Uncharacterized protein |
| chr2_+_68962014 | 15.24 |
ENST00000467265.1
|
ARHGAP25
|
Rho GTPase activating protein 25 |
| chr3_-_18466026 | 14.65 |
ENST00000417717.2
|
SATB1
|
SATB homeobox 1 |
| chr18_-_52969844 | 14.51 |
ENST00000561831.3
|
TCF4
|
transcription factor 4 |
| chr17_+_77681075 | 14.51 |
ENST00000397549.2
|
CTD-2116F7.1
|
CTD-2116F7.1 |
| chr19_-_39108568 | 14.43 |
ENST00000586296.1
|
MAP4K1
|
mitogen-activated protein kinase kinase kinase kinase 1 |
| chr2_-_175869936 | 14.31 |
ENST00000409900.3
|
CHN1
|
chimerin 1 |
| chr4_+_166300084 | 13.49 |
ENST00000402744.4
|
CPE
|
carboxypeptidase E |
| chr5_+_54320078 | 13.31 |
ENST00000231009.2
|
GZMK
|
granzyme K (granzyme 3; tryptase II) |
| chr10_-_99531709 | 13.24 |
ENST00000266066.3
|
SFRP5
|
secreted frizzled-related protein 5 |
| chr17_+_34431212 | 12.90 |
ENST00000394495.1
|
CCL4
|
chemokine (C-C motif) ligand 4 |
| chr2_+_68961934 | 12.78 |
ENST00000409202.3
|
ARHGAP25
|
Rho GTPase activating protein 25 |
| chr2_+_68961905 | 12.42 |
ENST00000295381.3
|
ARHGAP25
|
Rho GTPase activating protein 25 |
| chr16_+_2587998 | 12.18 |
ENST00000441549.3
ENST00000268673.7 |
PDPK1
|
3-phosphoinositide dependent protein kinase-1 |
| chr4_-_176733897 | 12.09 |
ENST00000393658.2
|
GPM6A
|
glycoprotein M6A |
| chr4_+_158142750 | 12.09 |
ENST00000505888.1
ENST00000449365.1 |
GRIA2
|
glutamate receptor, ionotropic, AMPA 2 |
| chr13_-_36429763 | 11.29 |
ENST00000379893.1
|
DCLK1
|
doublecortin-like kinase 1 |
| chr2_-_175870085 | 10.92 |
ENST00000409156.3
|
CHN1
|
chimerin 1 |
| chr17_+_27055798 | 10.84 |
ENST00000268766.6
|
NEK8
|
NIMA-related kinase 8 |
| chr16_+_2587965 | 10.65 |
ENST00000342085.4
ENST00000566659.1 |
PDPK1
|
3-phosphoinositide dependent protein kinase-1 |
| chrX_-_106960285 | 10.61 |
ENST00000503515.1
ENST00000372397.2 |
TSC22D3
|
TSC22 domain family, member 3 |
| chr22_-_51016433 | 10.53 |
ENST00000405237.3
|
CPT1B
|
carnitine palmitoyltransferase 1B (muscle) |
| chr17_+_34430980 | 10.49 |
ENST00000250151.4
|
CCL4
|
chemokine (C-C motif) ligand 4 |
| chrX_+_56259316 | 9.99 |
ENST00000468660.1
|
KLF8
|
Kruppel-like factor 8 |
| chr19_-_49622348 | 9.76 |
ENST00000408991.2
|
C19orf73
|
chromosome 19 open reading frame 73 |
| chr8_-_9760839 | 9.70 |
ENST00000519461.1
ENST00000517675.1 |
LINC00599
|
long intergenic non-protein coding RNA 599 |
| chr11_-_72385437 | 9.62 |
ENST00000418754.2
ENST00000542969.2 ENST00000334456.5 |
PDE2A
|
phosphodiesterase 2A, cGMP-stimulated |
| chr1_-_169680745 | 9.60 |
ENST00000236147.4
|
SELL
|
selectin L |
| chr2_+_103089756 | 9.53 |
ENST00000295269.4
|
SLC9A4
|
solute carrier family 9, subfamily A (NHE4, cation proton antiporter 4), member 4 |
| chr17_-_46507567 | 9.49 |
ENST00000584924.1
|
SKAP1
|
src kinase associated phosphoprotein 1 |
| chr12_+_8234807 | 9.37 |
ENST00000339754.5
|
NECAP1
|
NECAP endocytosis associated 1 |
| chr1_+_101702417 | 9.18 |
ENST00000305352.6
|
S1PR1
|
sphingosine-1-phosphate receptor 1 |
| chr10_-_102279586 | 9.12 |
ENST00000370345.3
ENST00000451524.1 ENST00000370329.5 |
SEC31B
|
SEC31 homolog B (S. cerevisiae) |
| chrX_-_106959631 | 9.09 |
ENST00000486554.1
ENST00000372390.4 |
TSC22D3
|
TSC22 domain family, member 3 |
| chr7_+_97361218 | 9.00 |
ENST00000319273.5
|
TAC1
|
tachykinin, precursor 1 |
| chr1_-_241520525 | 8.93 |
ENST00000366565.1
|
RGS7
|
regulator of G-protein signaling 7 |
| chr11_-_59383617 | 8.85 |
ENST00000263847.1
|
OSBP
|
oxysterol binding protein |
| chr19_-_10420459 | 8.70 |
ENST00000403352.1
ENST00000403903.3 |
ZGLP1
|
zinc finger, GATA-like protein 1 |
| chrY_+_15016013 | 8.66 |
ENST00000360160.4
ENST00000454054.1 |
DDX3Y
|
DEAD (Asp-Glu-Ala-Asp) box helicase 3, Y-linked |
| chr7_+_5919458 | 8.36 |
ENST00000416608.1
|
OCM
|
oncomodulin |
| chr22_-_51016846 | 8.35 |
ENST00000312108.7
ENST00000395650.2 |
CPT1B
|
carnitine palmitoyltransferase 1B (muscle) |
| chr1_-_15735925 | 8.32 |
ENST00000427824.1
|
RP3-467K16.4
|
RP3-467K16.4 |
| chrX_-_49056635 | 8.10 |
ENST00000472598.1
ENST00000538567.1 ENST00000479808.1 ENST00000263233.4 |
SYP
|
synaptophysin |
| chr22_-_31688431 | 8.07 |
ENST00000402249.3
ENST00000443175.1 ENST00000215912.5 ENST00000441972.1 |
PIK3IP1
|
phosphoinositide-3-kinase interacting protein 1 |
| chr2_-_89399845 | 8.03 |
ENST00000479981.1
|
IGKV1-16
|
immunoglobulin kappa variable 1-16 |
| chr3_-_49459865 | 8.03 |
ENST00000427987.1
|
AMT
|
aminomethyltransferase |
| chr1_+_1981890 | 8.02 |
ENST00000378567.3
ENST00000468310.1 |
PRKCZ
|
protein kinase C, zeta |
| chr11_-_18656028 | 7.99 |
ENST00000336349.5
|
SPTY2D1
|
SPT2, Suppressor of Ty, domain containing 1 (S. cerevisiae) |
| chr9_-_93405352 | 7.95 |
ENST00000375765.3
|
DIRAS2
|
DIRAS family, GTP-binding RAS-like 2 |
| chrY_+_15016725 | 7.90 |
ENST00000336079.3
|
DDX3Y
|
DEAD (Asp-Glu-Ala-Asp) box helicase 3, Y-linked |
| chr19_+_50380682 | 7.74 |
ENST00000221543.5
|
TBC1D17
|
TBC1 domain family, member 17 |
| chr19_+_50380917 | 7.72 |
ENST00000535102.2
|
TBC1D17
|
TBC1 domain family, member 17 |
| chr5_-_134914673 | 7.58 |
ENST00000512158.1
|
CXCL14
|
chemokine (C-X-C motif) ligand 14 |
| chr14_-_24911971 | 7.56 |
ENST00000555365.1
ENST00000399395.3 |
SDR39U1
|
short chain dehydrogenase/reductase family 39U, member 1 |
| chr1_-_27961720 | 7.56 |
ENST00000545953.1
ENST00000374005.3 |
FGR
|
feline Gardner-Rasheed sarcoma viral oncogene homolog |
| chr7_-_130080818 | 7.56 |
ENST00000343969.5
ENST00000541543.1 ENST00000489512.1 |
CEP41
|
centrosomal protein 41kDa |
| chr1_+_11866207 | 7.54 |
ENST00000312413.6
ENST00000346436.6 |
CLCN6
|
chloride channel, voltage-sensitive 6 |
| chrX_+_129473859 | 7.50 |
ENST00000424447.1
|
SLC25A14
|
solute carrier family 25 (mitochondrial carrier, brain), member 14 |
| chr19_-_4302375 | 7.49 |
ENST00000600114.1
ENST00000600349.1 ENST00000595645.1 ENST00000301272.2 |
TMIGD2
|
transmembrane and immunoglobulin domain containing 2 |
| chr11_+_117947782 | 7.29 |
ENST00000522307.1
ENST00000523251.1 ENST00000437212.3 ENST00000522824.1 ENST00000522151.1 |
TMPRSS4
|
transmembrane protease, serine 4 |
| chr16_-_4465886 | 7.17 |
ENST00000539968.1
|
CORO7
|
coronin 7 |
| chr17_+_53343577 | 7.16 |
ENST00000573945.1
|
HLF
|
hepatic leukemia factor |
| chr3_-_49459878 | 7.16 |
ENST00000546031.1
ENST00000458307.2 ENST00000430521.1 |
AMT
|
aminomethyltransferase |
| chr17_-_46507537 | 7.15 |
ENST00000336915.6
|
SKAP1
|
src kinase associated phosphoprotein 1 |
| chr1_+_168148273 | 7.03 |
ENST00000367830.3
|
TIPRL
|
TIP41, TOR signaling pathway regulator-like (S. cerevisiae) |
| chr15_+_81589254 | 6.98 |
ENST00000394652.2
|
IL16
|
interleukin 16 |
| chr17_-_26220366 | 6.97 |
ENST00000460380.2
ENST00000508862.1 ENST00000379102.3 ENST00000582441.1 |
LYRM9
RP1-66C13.4
|
LYR motif containing 9 Uncharacterized protein |
| chr7_+_97361388 | 6.97 |
ENST00000350485.4
ENST00000346867.4 |
TAC1
|
tachykinin, precursor 1 |
| chr22_+_46481861 | 6.93 |
ENST00000360737.3
|
FLJ27365
|
hsa-mir-4763 |
| chr14_-_24911868 | 6.86 |
ENST00000554698.1
|
SDR39U1
|
short chain dehydrogenase/reductase family 39U, member 1 |
| chr2_+_189156638 | 6.85 |
ENST00000410051.1
|
GULP1
|
GULP, engulfment adaptor PTB domain containing 1 |
| chr8_-_18666360 | 6.83 |
ENST00000286485.8
|
PSD3
|
pleckstrin and Sec7 domain containing 3 |
| chr19_-_39108643 | 6.82 |
ENST00000396857.2
|
MAP4K1
|
mitogen-activated protein kinase kinase kinase kinase 1 |
| chr19_-_14016877 | 6.81 |
ENST00000454313.1
ENST00000591586.1 ENST00000346736.2 |
C19orf57
|
chromosome 19 open reading frame 57 |
| chr6_-_33239712 | 6.72 |
ENST00000436044.2
|
VPS52
|
vacuolar protein sorting 52 homolog (S. cerevisiae) |
| chr1_-_25256368 | 6.68 |
ENST00000308873.6
|
RUNX3
|
runt-related transcription factor 3 |
| chrX_-_99987088 | 6.67 |
ENST00000372981.1
ENST00000263033.5 |
SYTL4
|
synaptotagmin-like 4 |
| chr16_-_31454346 | 6.64 |
ENST00000564218.1
ENST00000315678.5 |
ZNF843
|
zinc finger protein 843 |
| chr20_+_48884002 | 6.62 |
ENST00000425497.1
ENST00000445003.1 |
RP11-290F20.3
|
RP11-290F20.3 |
| chr16_+_30662360 | 6.56 |
ENST00000542965.2
|
PRR14
|
proline rich 14 |
| chr7_+_100450328 | 6.53 |
ENST00000540482.1
ENST00000418037.1 ENST00000428758.1 ENST00000275729.3 ENST00000415287.1 ENST00000354161.3 ENST00000416675.1 |
SLC12A9
|
solute carrier family 12, member 9 |
| chr1_-_20250110 | 6.53 |
ENST00000375116.3
|
PLA2G2E
|
phospholipase A2, group IIE |
| chr7_-_137028534 | 6.51 |
ENST00000348225.2
|
PTN
|
pleiotrophin |
| chr11_-_123525289 | 6.50 |
ENST00000392770.2
ENST00000299333.3 ENST00000530277.1 |
SCN3B
|
sodium channel, voltage-gated, type III, beta subunit |
| chr15_-_41099648 | 6.43 |
ENST00000220496.4
|
DNAJC17
|
DnaJ (Hsp40) homolog, subfamily C, member 17 |
| chr15_-_71055878 | 6.36 |
ENST00000322954.6
|
UACA
|
uveal autoantigen with coiled-coil domains and ankyrin repeats |
| chr19_-_39108552 | 6.33 |
ENST00000591517.1
|
MAP4K1
|
mitogen-activated protein kinase kinase kinase kinase 1 |
| chr7_-_137028498 | 6.26 |
ENST00000393083.2
|
PTN
|
pleiotrophin |
| chr1_+_16062820 | 6.26 |
ENST00000294454.5
|
SLC25A34
|
solute carrier family 25, member 34 |
| chr1_-_151119087 | 6.23 |
ENST00000341697.3
ENST00000368914.3 |
SEMA6C
|
sema domain, transmembrane domain (TM), and cytoplasmic domain, (semaphorin) 6C |
| chr12_-_111021110 | 6.20 |
ENST00000354300.3
|
PPTC7
|
PTC7 protein phosphatase homolog (S. cerevisiae) |
| chr3_+_35722487 | 6.10 |
ENST00000441454.1
|
ARPP21
|
cAMP-regulated phosphoprotein, 21kDa |
| chr13_+_115047097 | 6.03 |
ENST00000351487.5
|
UPF3A
|
UPF3 regulator of nonsense transcripts homolog A (yeast) |
| chr22_-_31688381 | 6.03 |
ENST00000487265.2
|
PIK3IP1
|
phosphoinositide-3-kinase interacting protein 1 |
| chr3_-_101232019 | 5.97 |
ENST00000394095.2
ENST00000394091.1 ENST00000394094.2 ENST00000358203.3 ENST00000348610.3 ENST00000314261.7 |
SENP7
|
SUMO1/sentrin specific peptidase 7 |
| chr7_-_100253993 | 5.94 |
ENST00000461605.1
ENST00000160382.5 |
ACTL6B
|
actin-like 6B |
| chr1_+_179712298 | 5.89 |
ENST00000341785.4
|
FAM163A
|
family with sequence similarity 163, member A |
| chr8_+_123793633 | 5.87 |
ENST00000314393.4
|
ZHX2
|
zinc fingers and homeoboxes 2 |
| chr11_+_65479702 | 5.87 |
ENST00000530446.1
ENST00000534104.1 ENST00000530605.1 ENST00000528198.1 ENST00000531880.1 ENST00000534650.1 |
KAT5
|
K(lysine) acetyltransferase 5 |
| chr9_+_87285539 | 5.84 |
ENST00000359847.3
|
NTRK2
|
neurotrophic tyrosine kinase, receptor, type 2 |
| chr21_+_38445539 | 5.82 |
ENST00000418766.1
ENST00000450533.1 ENST00000438055.1 ENST00000355666.1 ENST00000540756.1 ENST00000399010.1 |
TTC3
|
tetratricopeptide repeat domain 3 |
| chr12_+_112563303 | 5.75 |
ENST00000412615.2
|
TRAFD1
|
TRAF-type zinc finger domain containing 1 |
| chr6_+_44184653 | 5.60 |
ENST00000573382.2
ENST00000576476.1 |
RP1-302G2.5
|
RP1-302G2.5 |
| chr20_-_45035198 | 5.60 |
ENST00000372176.1
|
ELMO2
|
engulfment and cell motility 2 |
| chr6_-_41168920 | 5.59 |
ENST00000483722.1
|
TREML2
|
triggering receptor expressed on myeloid cells-like 2 |
| chr2_-_89521942 | 5.58 |
ENST00000482769.1
|
IGKV2-28
|
immunoglobulin kappa variable 2-28 |
| chrX_-_70329118 | 5.57 |
ENST00000374188.3
|
IL2RG
|
interleukin 2 receptor, gamma |
| chr17_-_40333099 | 5.53 |
ENST00000607371.1
|
KCNH4
|
potassium voltage-gated channel, subfamily H (eag-related), member 4 |
| chr8_-_21988558 | 5.49 |
ENST00000312841.8
|
HR
|
hair growth associated |
| chr11_+_1940786 | 5.45 |
ENST00000278317.6
ENST00000381561.4 ENST00000381548.3 ENST00000360603.3 ENST00000381549.3 |
TNNT3
|
troponin T type 3 (skeletal, fast) |
| chr1_+_13910194 | 5.42 |
ENST00000376057.4
ENST00000510906.1 |
PDPN
|
podoplanin |
| chrX_+_76709648 | 5.36 |
ENST00000439435.1
|
FGF16
|
fibroblast growth factor 16 |
| chr17_-_73892992 | 5.33 |
ENST00000540128.1
ENST00000269383.3 |
TRIM65
|
tripartite motif containing 65 |
| chr20_+_57875658 | 5.28 |
ENST00000371025.3
|
EDN3
|
endothelin 3 |
| chr6_+_292051 | 5.20 |
ENST00000344450.5
|
DUSP22
|
dual specificity phosphatase 22 |
| chr5_-_131347583 | 5.19 |
ENST00000379255.1
ENST00000430403.1 ENST00000544770.1 ENST00000379246.1 ENST00000414078.1 ENST00000441995.1 |
ACSL6
|
acyl-CoA synthetase long-chain family member 6 |
| chr20_+_57875457 | 5.15 |
ENST00000337938.2
ENST00000311585.7 ENST00000371028.2 |
EDN3
|
endothelin 3 |
| chr5_+_66124590 | 5.12 |
ENST00000490016.2
ENST00000403666.1 ENST00000450827.1 |
MAST4
|
microtubule associated serine/threonine kinase family member 4 |
| chr12_+_57853918 | 5.11 |
ENST00000532291.1
ENST00000543426.1 ENST00000228682.2 ENST00000546141.1 |
GLI1
|
GLI family zinc finger 1 |
| chr2_-_152589670 | 5.05 |
ENST00000604864.1
ENST00000603639.1 |
NEB
|
nebulin |
| chr7_+_96634850 | 5.01 |
ENST00000518156.2
|
DLX6
|
distal-less homeobox 6 |
| chr6_+_39760129 | 5.00 |
ENST00000274867.4
|
DAAM2
|
dishevelled associated activator of morphogenesis 2 |
| chr2_+_89998789 | 5.00 |
ENST00000453166.2
|
IGKV2D-28
|
immunoglobulin kappa variable 2D-28 |
| chr12_+_112563335 | 4.99 |
ENST00000549358.1
ENST00000257604.5 ENST00000548092.1 ENST00000552896.1 |
TRAFD1
|
TRAF-type zinc finger domain containing 1 |
| chr12_+_7055767 | 4.97 |
ENST00000447931.2
|
PTPN6
|
protein tyrosine phosphatase, non-receptor type 6 |
| chr17_-_61959202 | 4.96 |
ENST00000449787.2
ENST00000456543.2 ENST00000423893.2 ENST00000332800.7 |
GH2
|
growth hormone 2 |
| chr15_+_89182156 | 4.94 |
ENST00000379224.5
|
ISG20
|
interferon stimulated exonuclease gene 20kDa |
| chr7_-_74221288 | 4.93 |
ENST00000451013.2
|
GTF2IRD2
|
GTF2I repeat domain containing 2 |
| chr22_-_51017084 | 4.92 |
ENST00000360719.2
ENST00000457250.1 ENST00000440709.1 |
CPT1B
|
carnitine palmitoyltransferase 1B (muscle) |
| chrX_-_130423200 | 4.83 |
ENST00000361420.3
|
IGSF1
|
immunoglobulin superfamily, member 1 |
| chr11_-_119252425 | 4.82 |
ENST00000260187.2
|
USP2
|
ubiquitin specific peptidase 2 |
| chr7_+_30951461 | 4.81 |
ENST00000311813.4
|
AQP1
|
aquaporin 1 (Colton blood group) |
| chr11_-_45939565 | 4.81 |
ENST00000525192.1
ENST00000378750.5 |
PEX16
|
peroxisomal biogenesis factor 16 |
| chr1_-_207095324 | 4.80 |
ENST00000530505.1
ENST00000367091.3 ENST00000442471.2 |
FAIM3
|
Fas apoptotic inhibitory molecule 3 |
| chr11_+_117947724 | 4.77 |
ENST00000534111.1
|
TMPRSS4
|
transmembrane protease, serine 4 |
| chr22_-_38699003 | 4.76 |
ENST00000451964.1
|
CSNK1E
|
casein kinase 1, epsilon |
| chr10_+_76586348 | 4.74 |
ENST00000372724.1
ENST00000287239.4 ENST00000372714.1 |
KAT6B
|
K(lysine) acetyltransferase 6B |
| chr15_+_81489213 | 4.73 |
ENST00000559383.1
ENST00000394660.2 |
IL16
|
interleukin 16 |
| chr19_-_45826125 | 4.69 |
ENST00000221476.3
|
CKM
|
creatine kinase, muscle |
| chr9_-_79307096 | 4.67 |
ENST00000376717.2
ENST00000223609.6 ENST00000443509.2 |
PRUNE2
|
prune homolog 2 (Drosophila) |
| chr6_+_127588020 | 4.67 |
ENST00000309649.3
ENST00000610162.1 ENST00000610153.1 ENST00000608991.1 ENST00000480444.1 |
RNF146
|
ring finger protein 146 |
| chr2_+_183943464 | 4.65 |
ENST00000354221.4
|
DUSP19
|
dual specificity phosphatase 19 |
| chr6_-_33239612 | 4.64 |
ENST00000482399.1
ENST00000445902.2 |
VPS52
|
vacuolar protein sorting 52 homolog (S. cerevisiae) |
| chr17_-_61996160 | 4.61 |
ENST00000458650.2
ENST00000351388.4 ENST00000323322.5 |
GH1
|
growth hormone 1 |
| chr2_-_152118352 | 4.56 |
ENST00000331426.5
|
RBM43
|
RNA binding motif protein 43 |
| chr17_-_61996192 | 4.52 |
ENST00000392824.4
|
CSHL1
|
chorionic somatomammotropin hormone-like 1 |
| chr1_+_55464600 | 4.51 |
ENST00000371265.4
|
BSND
|
Bartter syndrome, infantile, with sensorineural deafness (Barttin) |
| chr7_+_40174565 | 4.50 |
ENST00000309930.5
ENST00000401647.2 ENST00000335693.4 ENST00000413931.1 ENST00000416370.1 ENST00000540834.1 |
C7orf10
|
succinylCoA:glutarate-CoA transferase |
| chr7_+_86974974 | 4.45 |
ENST00000419147.2
|
CROT
|
carnitine O-octanoyltransferase |
| chr1_-_169863016 | 4.43 |
ENST00000367772.4
ENST00000367771.6 |
SCYL3
|
SCY1-like 3 (S. cerevisiae) |
| chr17_-_35969409 | 4.29 |
ENST00000394378.2
ENST00000585472.1 ENST00000591288.1 ENST00000502449.2 ENST00000345615.4 ENST00000346661.4 ENST00000585689.1 ENST00000339208.6 |
SYNRG
|
synergin, gamma |
| chr11_+_46354455 | 4.28 |
ENST00000343674.6
|
DGKZ
|
diacylglycerol kinase, zeta |
| chr4_-_141348789 | 4.28 |
ENST00000414773.1
|
CLGN
|
calmegin |
| chr16_-_53537105 | 4.23 |
ENST00000568596.1
ENST00000570004.1 ENST00000564497.1 ENST00000300245.4 ENST00000394657.7 |
AKTIP
|
AKT interacting protein |
| chr17_+_30814707 | 4.19 |
ENST00000584792.1
|
CDK5R1
|
cyclin-dependent kinase 5, regulatory subunit 1 (p35) |
| chr7_+_29237354 | 4.16 |
ENST00000546235.1
|
CHN2
|
chimerin 2 |
| chr11_-_58345569 | 4.14 |
ENST00000528954.1
ENST00000528489.1 |
LPXN
|
leupaxin |
| chr11_+_1940925 | 4.14 |
ENST00000453458.1
ENST00000381557.2 ENST00000381589.3 ENST00000381579.3 ENST00000381563.4 ENST00000344578.4 |
TNNT3
|
troponin T type 3 (skeletal, fast) |
| chr1_+_184356188 | 4.13 |
ENST00000235307.6
|
C1orf21
|
chromosome 1 open reading frame 21 |
| chr12_+_7055631 | 4.13 |
ENST00000543115.1
ENST00000399448.1 |
PTPN6
|
protein tyrosine phosphatase, non-receptor type 6 |
| chr19_+_18723660 | 4.13 |
ENST00000262817.3
|
TMEM59L
|
transmembrane protein 59-like |
| chr19_-_51875894 | 4.11 |
ENST00000600427.1
ENST00000595217.1 ENST00000221978.5 |
NKG7
|
natural killer cell group 7 sequence |
| chr6_+_83777374 | 4.10 |
ENST00000349129.2
ENST00000237163.5 ENST00000536812.1 |
DOPEY1
|
dopey family member 1 |
| chr19_+_48867652 | 4.09 |
ENST00000344846.2
|
SYNGR4
|
synaptogyrin 4 |
| chr1_+_19923454 | 4.07 |
ENST00000602662.1
ENST00000602293.1 ENST00000322753.6 |
MINOS1-NBL1
MINOS1
|
MINOS1-NBL1 readthrough mitochondrial inner membrane organizing system 1 |
| chr12_-_121342170 | 4.06 |
ENST00000353487.2
|
SPPL3
|
signal peptide peptidase like 3 |
| chr17_-_61988556 | 4.05 |
ENST00000309894.5
ENST00000438387.2 ENST00000346606.6 ENST00000561003.1 ENST00000450719.3 ENST00000259003.10 |
CSHL1
|
chorionic somatomammotropin hormone-like 1 |
| chr15_+_89181974 | 4.04 |
ENST00000306072.5
|
ISG20
|
interferon stimulated exonuclease gene 20kDa |
| chr12_-_371994 | 4.03 |
ENST00000343164.4
ENST00000436453.1 ENST00000445055.2 ENST00000546319.1 |
SLC6A13
|
solute carrier family 6 (neurotransmitter transporter), member 13 |
| chr14_+_21467414 | 3.98 |
ENST00000554422.1
ENST00000298681.4 |
SLC39A2
|
solute carrier family 39 (zinc transporter), member 2 |
| chrX_+_21392553 | 3.98 |
ENST00000279451.4
|
CNKSR2
|
connector enhancer of kinase suppressor of Ras 2 |
| chr17_+_58755184 | 3.97 |
ENST00000589222.1
ENST00000407086.3 ENST00000390652.5 |
BCAS3
|
breast carcinoma amplified sequence 3 |
| chr6_-_13487784 | 3.96 |
ENST00000379287.3
|
GFOD1
|
glucose-fructose oxidoreductase domain containing 1 |
| chr16_+_640201 | 3.96 |
ENST00000563109.1
|
RAB40C
|
RAB40C, member RAS oncogene family |
| chr7_-_138666053 | 3.96 |
ENST00000440172.1
ENST00000422774.1 |
KIAA1549
|
KIAA1549 |
| chrX_+_69642881 | 3.95 |
ENST00000453994.2
ENST00000536730.1 ENST00000538649.1 ENST00000374382.3 |
GDPD2
|
glycerophosphodiester phosphodiesterase domain containing 2 |
| chr19_-_3500635 | 3.89 |
ENST00000250937.3
|
DOHH
|
deoxyhypusine hydroxylase/monooxygenase |
| chr7_-_71801980 | 3.89 |
ENST00000329008.5
|
CALN1
|
calneuron 1 |
| chr2_-_217724767 | 3.88 |
ENST00000236979.2
|
TNP1
|
transition protein 1 (during histone to protamine replacement) |
| chr2_+_242127924 | 3.84 |
ENST00000402530.3
ENST00000274979.8 ENST00000402430.3 |
ANO7
|
anoctamin 7 |
| chr15_-_58357932 | 3.79 |
ENST00000347587.3
|
ALDH1A2
|
aldehyde dehydrogenase 1 family, member A2 |
| chr3_-_61237050 | 3.76 |
ENST00000476844.1
ENST00000488467.1 ENST00000492590.1 ENST00000468189.1 |
FHIT
|
fragile histidine triad |
| chr3_-_49726486 | 3.75 |
ENST00000449682.2
|
MST1
|
macrophage stimulating 1 (hepatocyte growth factor-like) |
| chr16_-_18937726 | 3.71 |
ENST00000389467.3
ENST00000446231.2 |
SMG1
|
SMG1 phosphatidylinositol 3-kinase-related kinase |
| chrX_-_130423386 | 3.68 |
ENST00000370903.3
|
IGSF1
|
immunoglobulin superfamily, member 1 |
| chr3_-_3221358 | 3.67 |
ENST00000424814.1
ENST00000450014.1 ENST00000231948.4 ENST00000432408.2 |
CRBN
|
cereblon |
| chr15_+_89182178 | 3.66 |
ENST00000559876.1
|
ISG20
|
interferon stimulated exonuclease gene 20kDa |
| chr8_-_53322303 | 3.64 |
ENST00000276480.7
|
ST18
|
suppression of tumorigenicity 18 (breast carcinoma) (zinc finger protein) |
| chr11_-_47470591 | 3.61 |
ENST00000524487.1
|
RAPSN
|
receptor-associated protein of the synapse |
| chr1_+_13910479 | 3.61 |
ENST00000509009.1
|
PDPN
|
podoplanin |
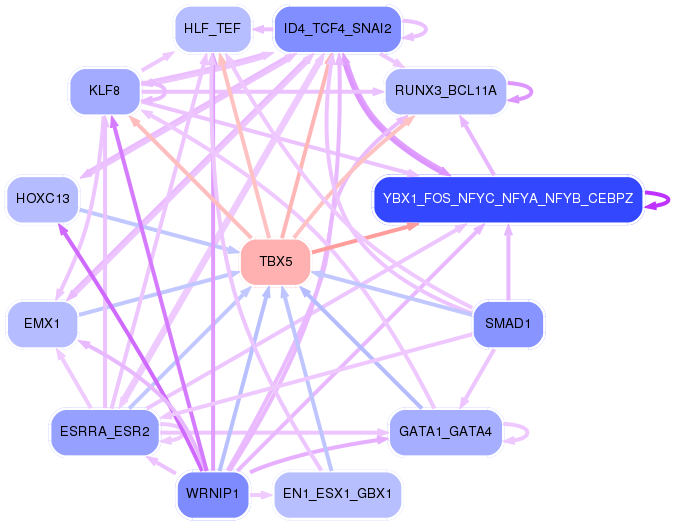
Network of associatons between targets according to the STRING database.

First level regulatory network of TBX5
Gene Ontology Analysis
Gene overrepresentation in biological_process category:
| Log-likelihood per target | Total log-likelihood | Term | Description |
|---|---|---|---|
| 8.9 | 35.7 | GO:0030185 | nitric oxide transport(GO:0030185) |
| 6.4 | 51.4 | GO:0001661 | conditioned taste aversion(GO:0001661) |
| 5.3 | 16.0 | GO:2000854 | positive regulation of corticosterone secretion(GO:2000854) |
| 4.7 | 14.1 | GO:0090219 | negative regulation of lipid kinase activity(GO:0090219) |
| 4.4 | 31.0 | GO:2000503 | positive regulation of natural killer cell chemotaxis(GO:2000503) |
| 4.3 | 42.8 | GO:1990416 | cellular response to brain-derived neurotrophic factor stimulus(GO:1990416) |
| 4.3 | 12.8 | GO:1904395 | retinal rod cell differentiation(GO:0060221) positive regulation of skeletal muscle acetylcholine-gated channel clustering(GO:1904395) negative regulation of neuromuscular junction development(GO:1904397) |
| 4.2 | 12.6 | GO:0000738 | DNA catabolic process, exonucleolytic(GO:0000738) |
| 3.8 | 11.4 | GO:0048611 | ectodermal digestive tract development(GO:0007439) embryonic ectodermal digestive tract development(GO:0048611) |
| 3.5 | 10.5 | GO:1990764 | regulation of myofibroblast contraction(GO:1904328) myofibroblast contraction(GO:1990764) |
| 3.4 | 10.3 | GO:1900075 | regulation of neuromuscular synaptic transmission(GO:1900073) positive regulation of neuromuscular synaptic transmission(GO:1900075) |
| 3.3 | 13.2 | GO:0044333 | Wnt signaling pathway involved in digestive tract morphogenesis(GO:0044333) |
| 3.2 | 9.6 | GO:0033159 | negative regulation of protein import into nucleus, translocation(GO:0033159) |
| 3.1 | 9.2 | GO:0003241 | growth involved in heart morphogenesis(GO:0003241) |
| 3.0 | 15.2 | GO:0006546 | glycine catabolic process(GO:0006546) glycine decarboxylation via glycine cleavage system(GO:0019464) |
| 3.0 | 3.0 | GO:0010652 | regulation of cell communication by chemical coupling(GO:0010645) positive regulation of cell communication by chemical coupling(GO:0010652) |
| 2.7 | 8.2 | GO:0032581 | ER-dependent peroxisome organization(GO:0032581) |
| 2.7 | 13.5 | GO:0030070 | insulin processing(GO:0030070) |
| 2.6 | 10.4 | GO:0010961 | cellular magnesium ion homeostasis(GO:0010961) |
| 2.5 | 34.9 | GO:0070050 | neuron cellular homeostasis(GO:0070050) |
| 2.5 | 2.5 | GO:0010533 | regulation of activation of Janus kinase activity(GO:0010533) |
| 2.5 | 19.7 | GO:0070236 | regulation of activation-induced cell death of T cells(GO:0070235) negative regulation of activation-induced cell death of T cells(GO:0070236) |
| 2.3 | 9.1 | GO:0033277 | abortive mitotic cell cycle(GO:0033277) |
| 1.6 | 6.5 | GO:2000857 | positive regulation of mineralocorticoid secretion(GO:2000857) positive regulation of aldosterone secretion(GO:2000860) |
| 1.6 | 6.2 | GO:0060672 | epithelial cell differentiation involved in embryonic placenta development(GO:0060671) epithelial cell morphogenesis involved in placental branching(GO:0060672) |
| 1.5 | 7.6 | GO:0099538 | synaptic signaling via neuropeptide(GO:0099538) trans-synaptic signaling by neuropeptide(GO:0099540) trans-synaptic signaling by neuropeptide, modulating synaptic transmission(GO:0099551) |
| 1.4 | 4.2 | GO:0021586 | pons maturation(GO:0021586) |
| 1.3 | 8.0 | GO:2001181 | positive regulation of interleukin-10 secretion(GO:2001181) |
| 1.3 | 3.9 | GO:0007290 | spermatid nucleus elongation(GO:0007290) |
| 1.3 | 5.1 | GO:0007418 | ventral midline development(GO:0007418) smoothened signaling pathway involved in regulation of cerebellar granule cell precursor cell proliferation(GO:0021938) |
| 1.3 | 5.0 | GO:0007525 | somatic muscle development(GO:0007525) |
| 1.3 | 7.6 | GO:0018095 | protein polyglutamylation(GO:0018095) |
| 1.2 | 27.6 | GO:0000185 | activation of MAPKKK activity(GO:0000185) |
| 1.2 | 23.8 | GO:0006853 | carnitine shuttle(GO:0006853) |
| 1.2 | 3.5 | GO:0051710 | regulation of cytolysis in other organism(GO:0051710) |
| 1.1 | 3.4 | GO:1904404 | cellular response to vitamin B1(GO:0071301) response to formaldehyde(GO:1904404) |
| 1.1 | 7.5 | GO:0010536 | positive regulation of activation of Janus kinase activity(GO:0010536) |
| 1.1 | 11.6 | GO:0035330 | regulation of hippo signaling(GO:0035330) |
| 1.0 | 1.0 | GO:0032423 | regulation of mismatch repair(GO:0032423) positive regulation of mismatch repair(GO:0032425) |
| 1.0 | 2.9 | GO:0097056 | seryl-tRNA aminoacylation(GO:0006434) selenocysteinyl-tRNA(Sec) biosynthetic process(GO:0097056) |
| 0.9 | 14.9 | GO:0043374 | CD8-positive, alpha-beta T cell differentiation(GO:0043374) |
| 0.9 | 6.5 | GO:0060373 | regulation of ventricular cardiac muscle cell membrane depolarization(GO:0060373) |
| 0.9 | 2.7 | GO:0060474 | positive regulation of sperm motility involved in capacitation(GO:0060474) |
| 0.9 | 8.0 | GO:0001672 | regulation of chromatin assembly or disassembly(GO:0001672) |
| 0.9 | 6.1 | GO:0051533 | positive regulation of NFAT protein import into nucleus(GO:0051533) |
| 0.9 | 2.6 | GO:0014807 | regulation of somitogenesis(GO:0014807) |
| 0.9 | 10.2 | GO:0048172 | regulation of short-term neuronal synaptic plasticity(GO:0048172) |
| 0.8 | 2.5 | GO:0048170 | positive regulation of long-term neuronal synaptic plasticity(GO:0048170) trans-synaptic signaling by trans-synaptic complex(GO:0099545) |
| 0.8 | 4.1 | GO:0050859 | negative regulation of B cell receptor signaling pathway(GO:0050859) |
| 0.8 | 3.2 | GO:0060010 | Sertoli cell fate commitment(GO:0060010) |
| 0.8 | 5.6 | GO:0038110 | interleukin-2-mediated signaling pathway(GO:0038110) |
| 0.8 | 5.4 | GO:1904849 | positive regulation of cell chemotaxis to fibroblast growth factor(GO:1904849) positive regulation of endothelial cell chemotaxis to fibroblast growth factor(GO:2000546) |
| 0.7 | 3.0 | GO:2001271 | negative regulation of cysteine-type endopeptidase activity involved in execution phase of apoptosis(GO:2001271) |
| 0.7 | 5.1 | GO:0000160 | phosphorelay signal transduction system(GO:0000160) |
| 0.7 | 25.2 | GO:0008045 | motor neuron axon guidance(GO:0008045) |
| 0.7 | 2.7 | GO:0090076 | relaxation of skeletal muscle(GO:0090076) |
| 0.7 | 2.7 | GO:0060605 | tube lumen cavitation(GO:0060605) salivary gland cavitation(GO:0060662) |
| 0.6 | 6.4 | GO:0051791 | medium-chain fatty acid metabolic process(GO:0051791) |
| 0.6 | 3.1 | GO:0046340 | diacylglycerol catabolic process(GO:0046340) |
| 0.6 | 0.6 | GO:0046668 | regulation of retinal cell programmed cell death(GO:0046668) |
| 0.6 | 4.9 | GO:0002051 | osteoblast fate commitment(GO:0002051) |
| 0.6 | 9.5 | GO:1990118 | sodium ion import across plasma membrane(GO:0098719) sodium ion import into cell(GO:1990118) |
| 0.6 | 1.7 | GO:2000870 | positive regulation of female gonad development(GO:2000196) regulation of progesterone secretion(GO:2000870) |
| 0.6 | 8.8 | GO:0045721 | negative regulation of gluconeogenesis(GO:0045721) |
| 0.6 | 1.1 | GO:0071288 | cellular response to mercury ion(GO:0071288) |
| 0.5 | 6.0 | GO:2000576 | positive regulation of microtubule motor activity(GO:2000576) regulation of ATP-dependent microtubule motor activity, plus-end-directed(GO:2000580) positive regulation of ATP-dependent microtubule motor activity, plus-end-directed(GO:2000582) |
| 0.5 | 7.6 | GO:0033008 | positive regulation of mast cell activation involved in immune response(GO:0033008) positive regulation of mast cell degranulation(GO:0043306) |
| 0.5 | 2.7 | GO:1904823 | pyrimidine nucleobase transport(GO:0015855) purine nucleobase transmembrane transport(GO:1904823) |
| 0.5 | 11.7 | GO:0050930 | induction of positive chemotaxis(GO:0050930) |
| 0.5 | 3.2 | GO:0006003 | fructose 2,6-bisphosphate metabolic process(GO:0006003) |
| 0.5 | 2.1 | GO:0035548 | gamma-delta T cell activation involved in immune response(GO:0002290) negative regulation of interferon-beta secretion(GO:0035548) regulation of gamma-delta T cell activation involved in immune response(GO:2001191) positive regulation of gamma-delta T cell activation involved in immune response(GO:2001193) |
| 0.5 | 1.6 | GO:0035521 | monoubiquitinated histone deubiquitination(GO:0035521) monoubiquitinated histone H2A deubiquitination(GO:0035522) |
| 0.5 | 1.5 | GO:0031548 | regulation of brain-derived neurotrophic factor receptor signaling pathway(GO:0031548) |
| 0.5 | 2.5 | GO:1903588 | negative regulation of blood vessel endothelial cell proliferation involved in sprouting angiogenesis(GO:1903588) |
| 0.5 | 9.8 | GO:0044117 | growth of symbiont in host(GO:0044117) regulation of growth of symbiont in host(GO:0044126) |
| 0.5 | 7.7 | GO:0045475 | locomotor rhythm(GO:0045475) |
| 0.5 | 2.4 | GO:0018125 | peptidyl-cysteine methylation(GO:0018125) |
| 0.5 | 1.9 | GO:0006049 | UDP-N-acetylglucosamine catabolic process(GO:0006049) |
| 0.5 | 2.4 | GO:0002442 | serotonin production involved in inflammatory response(GO:0002351) serotonin secretion involved in inflammatory response(GO:0002442) serotonin secretion by platelet(GO:0002554) |
| 0.5 | 3.6 | GO:0070102 | interleukin-6-mediated signaling pathway(GO:0070102) |
| 0.5 | 11.3 | GO:0021952 | central nervous system projection neuron axonogenesis(GO:0021952) |
| 0.5 | 11.3 | GO:0006895 | Golgi to endosome transport(GO:0006895) |
| 0.4 | 16.1 | GO:0051491 | positive regulation of filopodium assembly(GO:0051491) |
| 0.4 | 1.8 | GO:0051835 | positive regulation of synapse structural plasticity(GO:0051835) |
| 0.4 | 9.0 | GO:0032703 | negative regulation of interleukin-2 production(GO:0032703) |
| 0.4 | 4.7 | GO:0006600 | creatine metabolic process(GO:0006600) |
| 0.4 | 7.2 | GO:0036148 | phosphatidylglycerol acyl-chain remodeling(GO:0036148) |
| 0.4 | 3.8 | GO:0035799 | ureter maturation(GO:0035799) |
| 0.4 | 4.5 | GO:0090073 | positive regulation of protein homodimerization activity(GO:0090073) |
| 0.4 | 2.8 | GO:0048743 | positive regulation of skeletal muscle fiber development(GO:0048743) |
| 0.4 | 1.2 | GO:0060370 | susceptibility to T cell mediated cytotoxicity(GO:0060370) |
| 0.4 | 3.6 | GO:2001300 | ductus arteriosus closure(GO:0097070) lipoxin metabolic process(GO:2001300) |
| 0.4 | 7.1 | GO:0019371 | cyclooxygenase pathway(GO:0019371) |
| 0.4 | 2.3 | GO:0061737 | leukotriene signaling pathway(GO:0061737) |
| 0.4 | 1.2 | GO:0006438 | valyl-tRNA aminoacylation(GO:0006438) |
| 0.4 | 3.1 | GO:0006216 | cytidine catabolic process(GO:0006216) cytidine deamination(GO:0009972) cytidine metabolic process(GO:0046087) |
| 0.4 | 1.5 | GO:0048861 | leukemia inhibitory factor signaling pathway(GO:0048861) |
| 0.4 | 1.1 | GO:0048859 | formation of anatomical boundary(GO:0048859) |
| 0.4 | 6.8 | GO:0032012 | regulation of ARF protein signal transduction(GO:0032012) |
| 0.4 | 3.9 | GO:0008612 | peptidyl-lysine modification to peptidyl-hypusine(GO:0008612) |
| 0.3 | 2.4 | GO:0043353 | enucleate erythrocyte differentiation(GO:0043353) |
| 0.3 | 0.7 | GO:0097156 | fasciculation of motor neuron axon(GO:0097156) |
| 0.3 | 7.5 | GO:0060397 | JAK-STAT cascade involved in growth hormone signaling pathway(GO:0060397) |
| 0.3 | 1.3 | GO:1902202 | regulation of hepatocyte growth factor receptor signaling pathway(GO:1902202) |
| 0.3 | 5.2 | GO:0002710 | negative regulation of T cell mediated immunity(GO:0002710) |
| 0.3 | 2.2 | GO:0035871 | protein K11-linked deubiquitination(GO:0035871) |
| 0.3 | 0.9 | GO:0001544 | initiation of primordial ovarian follicle growth(GO:0001544) |
| 0.3 | 3.8 | GO:0017121 | phospholipid scrambling(GO:0017121) |
| 0.3 | 5.5 | GO:0033169 | histone H3-K9 demethylation(GO:0033169) |
| 0.3 | 1.1 | GO:0002420 | natural killer cell mediated cytotoxicity directed against tumor cell target(GO:0002420) natural killer cell mediated immune response to tumor cell(GO:0002423) regulation of natural killer cell mediated immune response to tumor cell(GO:0002855) positive regulation of natural killer cell mediated immune response to tumor cell(GO:0002857) regulation of natural killer cell mediated cytotoxicity directed against tumor cell target(GO:0002858) positive regulation of natural killer cell mediated cytotoxicity directed against tumor cell target(GO:0002860) |
| 0.3 | 3.9 | GO:0090527 | actin filament reorganization(GO:0090527) |
| 0.3 | 4.8 | GO:0038092 | nodal signaling pathway(GO:0038092) |
| 0.3 | 4.0 | GO:0015812 | gamma-aminobutyric acid transport(GO:0015812) |
| 0.3 | 6.5 | GO:0006884 | cell volume homeostasis(GO:0006884) |
| 0.3 | 5.7 | GO:0048934 | peripheral nervous system neuron differentiation(GO:0048934) peripheral nervous system neuron development(GO:0048935) |
| 0.3 | 4.6 | GO:0032515 | negative regulation of phosphoprotein phosphatase activity(GO:0032515) |
| 0.3 | 1.0 | GO:0018352 | protein-pyridoxal-5-phosphate linkage(GO:0018352) |
| 0.3 | 2.3 | GO:0071550 | death-inducing signaling complex assembly(GO:0071550) |
| 0.3 | 1.8 | GO:1903760 | cortical microtubule organization(GO:0043622) establishment of centrosome localization(GO:0051660) regulation of voltage-gated potassium channel activity involved in ventricular cardiac muscle cell action potential repolarization(GO:1903760) |
| 0.3 | 4.8 | GO:2000052 | positive regulation of non-canonical Wnt signaling pathway(GO:2000052) |
| 0.2 | 10.5 | GO:0035235 | ionotropic glutamate receptor signaling pathway(GO:0035235) |
| 0.2 | 20.2 | GO:0031338 | regulation of vesicle fusion(GO:0031338) |
| 0.2 | 2.2 | GO:0098870 | neuronal action potential propagation(GO:0019227) action potential propagation(GO:0098870) |
| 0.2 | 21.8 | GO:0007422 | peripheral nervous system development(GO:0007422) |
| 0.2 | 4.6 | GO:0043508 | negative regulation of JUN kinase activity(GO:0043508) |
| 0.2 | 2.2 | GO:0002775 | antimicrobial peptide production(GO:0002775) antibacterial peptide production(GO:0002778) |
| 0.2 | 17.0 | GO:0007602 | phototransduction(GO:0007602) |
| 0.2 | 6.2 | GO:0042104 | positive regulation of activated T cell proliferation(GO:0042104) |
| 0.2 | 3.4 | GO:0051256 | mitotic spindle midzone assembly(GO:0051256) |
| 0.2 | 4.3 | GO:0046339 | diacylglycerol metabolic process(GO:0046339) |
| 0.2 | 0.9 | GO:1904379 | maintenance of unfolded protein(GO:0036506) protein localization to cytosolic proteasome complex(GO:1904327) maintenance of unfolded protein involved in ERAD pathway(GO:1904378) protein localization to cytosolic proteasome complex involved in ERAD pathway(GO:1904379) |
| 0.2 | 10.7 | GO:0045824 | negative regulation of innate immune response(GO:0045824) |
| 0.2 | 6.7 | GO:0046676 | negative regulation of insulin secretion(GO:0046676) |
| 0.2 | 10.5 | GO:0010501 | RNA secondary structure unwinding(GO:0010501) |
| 0.2 | 0.8 | GO:0002215 | defense response to nematode(GO:0002215) |
| 0.2 | 1.2 | GO:0036289 | peptidyl-serine autophosphorylation(GO:0036289) |
| 0.2 | 7.6 | GO:0048599 | oocyte development(GO:0048599) |
| 0.2 | 4.0 | GO:0071577 | zinc II ion transmembrane transport(GO:0071577) |
| 0.2 | 1.3 | GO:0001574 | ganglioside biosynthetic process(GO:0001574) |
| 0.2 | 2.3 | GO:0051775 | response to redox state(GO:0051775) |
| 0.2 | 2.1 | GO:0048387 | negative regulation of retinoic acid receptor signaling pathway(GO:0048387) |
| 0.2 | 10.6 | GO:0070936 | protein K48-linked ubiquitination(GO:0070936) |
| 0.2 | 0.6 | GO:0060492 | foregut regionalization(GO:0060423) lung field specification(GO:0060424) lung induction(GO:0060492) |
| 0.2 | 2.7 | GO:0015732 | prostaglandin transport(GO:0015732) |
| 0.2 | 1.2 | GO:0045974 | miRNA mediated inhibition of translation(GO:0035278) negative regulation of translation, ncRNA-mediated(GO:0040033) regulation of translation, ncRNA-mediated(GO:0045974) |
| 0.2 | 3.5 | GO:0014912 | negative regulation of smooth muscle cell migration(GO:0014912) |
| 0.1 | 1.3 | GO:0060088 | auditory receptor cell stereocilium organization(GO:0060088) |
| 0.1 | 1.7 | GO:0030321 | transepithelial chloride transport(GO:0030321) |
| 0.1 | 1.4 | GO:0000712 | resolution of meiotic recombination intermediates(GO:0000712) negative regulation of telomerase activity(GO:0051974) |
| 0.1 | 1.0 | GO:0072383 | plus-end-directed vesicle transport along microtubule(GO:0072383) |
| 0.1 | 0.5 | GO:0046725 | negative regulation by virus of viral protein levels in host cell(GO:0046725) negative regulation of nephron tubule epithelial cell differentiation(GO:0072183) negative regulation of metanephric nephron tubule epithelial cell differentiation(GO:0072308) negative regulation of epithelial cell differentiation involved in kidney development(GO:2000697) |
| 0.1 | 4.9 | GO:0010107 | potassium ion import(GO:0010107) |
| 0.1 | 6.4 | GO:1901998 | toxin transport(GO:1901998) |
| 0.1 | 10.4 | GO:0030049 | muscle filament sliding(GO:0030049) actin-myosin filament sliding(GO:0033275) |
| 0.1 | 46.1 | GO:0051056 | regulation of small GTPase mediated signal transduction(GO:0051056) |
| 0.1 | 0.9 | GO:0098914 | membrane repolarization during atrial cardiac muscle cell action potential(GO:0098914) |
| 0.1 | 3.2 | GO:1904380 | endoplasmic reticulum mannose trimming(GO:1904380) |
| 0.1 | 17.8 | GO:0006958 | complement activation, classical pathway(GO:0006958) |
| 0.1 | 0.5 | GO:0097210 | response to gonadotropin-releasing hormone(GO:0097210) cellular response to gonadotropin-releasing hormone(GO:0097211) |
| 0.1 | 6.4 | GO:1901222 | regulation of NIK/NF-kappaB signaling(GO:1901222) |
| 0.1 | 2.0 | GO:0060716 | labyrinthine layer blood vessel development(GO:0060716) |
| 0.1 | 10.8 | GO:1902476 | chloride transmembrane transport(GO:1902476) |
| 0.1 | 2.0 | GO:0035455 | response to interferon-alpha(GO:0035455) |
| 0.1 | 1.6 | GO:0090129 | positive regulation of synapse maturation(GO:0090129) |
| 0.1 | 1.5 | GO:0055003 | cardiac myofibril assembly(GO:0055003) |
| 0.1 | 3.2 | GO:0048536 | spleen development(GO:0048536) |
| 0.1 | 4.2 | GO:0008333 | endosome to lysosome transport(GO:0008333) |
| 0.1 | 1.9 | GO:0019800 | peptide cross-linking via chondroitin 4-sulfate glycosaminoglycan(GO:0019800) |
| 0.1 | 4.0 | GO:0006904 | vesicle docking involved in exocytosis(GO:0006904) |
| 0.1 | 1.7 | GO:0016180 | snRNA processing(GO:0016180) |
| 0.1 | 4.1 | GO:0014047 | glutamate secretion(GO:0014047) |
| 0.1 | 2.7 | GO:0006911 | phagocytosis, engulfment(GO:0006911) |
| 0.1 | 2.0 | GO:0000042 | protein targeting to Golgi(GO:0000042) |
| 0.1 | 16.6 | GO:0050852 | T cell receptor signaling pathway(GO:0050852) |
| 0.1 | 2.8 | GO:0006376 | mRNA splice site selection(GO:0006376) |
| 0.1 | 1.9 | GO:0042149 | cellular response to glucose starvation(GO:0042149) |
| 0.1 | 0.6 | GO:0002335 | mature B cell differentiation(GO:0002335) |
| 0.1 | 5.3 | GO:0010508 | positive regulation of autophagy(GO:0010508) |
| 0.1 | 4.7 | GO:0043966 | histone H3 acetylation(GO:0043966) |
| 0.1 | 4.6 | GO:0007368 | determination of left/right symmetry(GO:0007368) |
| 0.1 | 4.3 | GO:0009060 | aerobic respiration(GO:0009060) |
| 0.1 | 3.1 | GO:0006749 | glutathione metabolic process(GO:0006749) |
| 0.1 | 1.3 | GO:0000028 | ribosomal small subunit assembly(GO:0000028) |
| 0.1 | 1.8 | GO:0046326 | positive regulation of glucose import(GO:0046326) |
| 0.1 | 1.1 | GO:0048260 | positive regulation of receptor-mediated endocytosis(GO:0048260) |
| 0.1 | 0.6 | GO:0048007 | antigen processing and presentation of lipid antigen via MHC class Ib(GO:0048003) antigen processing and presentation, exogenous lipid antigen via MHC class Ib(GO:0048007) |
| 0.0 | 5.0 | GO:0035113 | embryonic limb morphogenesis(GO:0030326) embryonic appendage morphogenesis(GO:0035113) |
| 0.0 | 6.7 | GO:0043406 | positive regulation of MAP kinase activity(GO:0043406) |
| 0.0 | 1.8 | GO:0048247 | lymphocyte chemotaxis(GO:0048247) |
| 0.0 | 5.1 | GO:0001676 | long-chain fatty acid metabolic process(GO:0001676) |
| 0.0 | 3.7 | GO:0046854 | phosphatidylinositol phosphorylation(GO:0046854) |
| 0.0 | 2.9 | GO:0030500 | regulation of bone mineralization(GO:0030500) |
| 0.0 | 6.3 | GO:0034605 | cellular response to heat(GO:0034605) |
| 0.0 | 5.1 | GO:0002576 | platelet degranulation(GO:0002576) |
| 0.0 | 0.6 | GO:0005513 | detection of calcium ion(GO:0005513) |
| 0.0 | 1.3 | GO:0070098 | chemokine-mediated signaling pathway(GO:0070098) |
| 0.0 | 4.0 | GO:0051028 | mRNA transport(GO:0051028) |
| 0.0 | 1.3 | GO:0071277 | cellular response to calcium ion(GO:0071277) |
| 0.0 | 2.3 | GO:0060326 | cell chemotaxis(GO:0060326) |
| 0.0 | 0.3 | GO:0030239 | myofibril assembly(GO:0030239) |
| 0.0 | 3.2 | GO:0007188 | adenylate cyclase-modulating G-protein coupled receptor signaling pathway(GO:0007188) |
| 0.0 | 0.5 | GO:0033198 | response to ATP(GO:0033198) |
| 0.0 | 0.6 | GO:0090200 | positive regulation of release of cytochrome c from mitochondria(GO:0090200) |
| 0.0 | 2.0 | GO:0007030 | Golgi organization(GO:0007030) |
| 0.0 | 0.6 | GO:0019985 | translesion synthesis(GO:0019985) |
| 0.0 | 2.5 | GO:0007156 | homophilic cell adhesion via plasma membrane adhesion molecules(GO:0007156) |
| 0.0 | 0.6 | GO:0033344 | cholesterol efflux(GO:0033344) |
| 0.0 | 0.6 | GO:0051693 | actin filament capping(GO:0051693) |
| 0.0 | 2.1 | GO:0051480 | regulation of cytosolic calcium ion concentration(GO:0051480) |
| 0.0 | 2.4 | GO:0006898 | receptor-mediated endocytosis(GO:0006898) |
| 0.0 | 0.6 | GO:0006937 | regulation of muscle contraction(GO:0006937) |
| 0.0 | 1.2 | GO:0070268 | cornification(GO:0070268) |
Gene overrepresentation in cellular_component category:
| Log-likelihood per target | Total log-likelihood | Term | Description |
|---|---|---|---|
| 7.7 | 30.9 | GO:0031838 | haptoglobin-hemoglobin complex(GO:0031838) |
| 6.1 | 48.5 | GO:0035976 | AP1 complex(GO:0035976) |
| 2.8 | 11.4 | GO:1990745 | EARP complex(GO:1990745) |
| 2.5 | 7.5 | GO:0070195 | growth hormone receptor complex(GO:0070195) |
| 2.4 | 12.1 | GO:0098843 | postsynaptic endocytic zone(GO:0098843) |
| 2.3 | 9.0 | GO:0032777 | Piccolo NuA4 histone acetyltransferase complex(GO:0032777) |
| 1.6 | 4.8 | GO:0020003 | symbiont-containing vacuole(GO:0020003) symbiont-containing vacuole membrane(GO:0020005) |
| 1.1 | 13.2 | GO:0099634 | postsynaptic specialization membrane(GO:0099634) |
| 1.1 | 4.2 | GO:0070695 | FHF complex(GO:0070695) |
| 1.0 | 4.2 | GO:0016533 | cyclin-dependent protein kinase 5 holoenzyme complex(GO:0016533) |
| 1.0 | 10.5 | GO:0097197 | tetraspanin-enriched microdomain(GO:0097197) |
| 1.0 | 8.0 | GO:0045179 | apical cortex(GO:0045179) |
| 0.8 | 9.1 | GO:0042105 | alpha-beta T cell receptor complex(GO:0042105) |
| 0.8 | 16.6 | GO:0042101 | T cell receptor complex(GO:0042101) |
| 0.6 | 3.2 | GO:0000836 | Hrd1p ubiquitin ligase complex(GO:0000836) |
| 0.6 | 4.3 | GO:0030121 | AP-1 adaptor complex(GO:0030121) |
| 0.6 | 4.1 | GO:0061617 | MICOS complex(GO:0061617) |
| 0.6 | 4.1 | GO:0098554 | cytoplasmic side of endoplasmic reticulum membrane(GO:0098554) |
| 0.5 | 12.1 | GO:0044295 | axonal growth cone(GO:0044295) |
| 0.5 | 12.3 | GO:0005861 | troponin complex(GO:0005861) |
| 0.5 | 8.1 | GO:0098563 | integral component of synaptic vesicle membrane(GO:0030285) intrinsic component of synaptic vesicle membrane(GO:0098563) |
| 0.5 | 4.7 | GO:0070776 | H3 histone acetyltransferase complex(GO:0070775) MOZ/MORF histone acetyltransferase complex(GO:0070776) |
| 0.4 | 64.0 | GO:0043204 | perikaryon(GO:0043204) |
| 0.4 | 6.5 | GO:0001518 | voltage-gated sodium channel complex(GO:0001518) |
| 0.4 | 1.5 | GO:0005896 | interleukin-6 receptor complex(GO:0005896) |
| 0.4 | 15.9 | GO:0097546 | ciliary base(GO:0097546) |
| 0.4 | 3.9 | GO:0000788 | nuclear nucleosome(GO:0000788) |
| 0.3 | 14.6 | GO:0005720 | nuclear heterochromatin(GO:0005720) |
| 0.3 | 8.2 | GO:0031231 | integral component of peroxisomal membrane(GO:0005779) intrinsic component of peroxisomal membrane(GO:0031231) |
| 0.3 | 3.7 | GO:0031464 | Cul4A-RING E3 ubiquitin ligase complex(GO:0031464) |
| 0.3 | 2.1 | GO:0097208 | alveolar lamellar body(GO:0097208) |
| 0.2 | 7.6 | GO:0031092 | platelet alpha granule membrane(GO:0031092) |
| 0.2 | 1.2 | GO:0005594 | collagen type IX trimer(GO:0005594) |
| 0.2 | 5.9 | GO:0071565 | nBAF complex(GO:0071565) |
| 0.2 | 4.9 | GO:0042588 | zymogen granule(GO:0042588) |
| 0.2 | 1.6 | GO:0097013 | phagocytic vesicle lumen(GO:0097013) |
| 0.2 | 2.1 | GO:0005955 | calcineurin complex(GO:0005955) |
| 0.2 | 0.9 | GO:0071818 | BAT3 complex(GO:0071818) ER membrane insertion complex(GO:0072379) |
| 0.2 | 6.0 | GO:0035145 | exon-exon junction complex(GO:0035145) |
| 0.2 | 2.7 | GO:0097524 | sperm plasma membrane(GO:0097524) |
| 0.2 | 2.3 | GO:0043235 | receptor complex(GO:0043235) |
| 0.2 | 6.0 | GO:0005868 | cytoplasmic dynein complex(GO:0005868) |
| 0.2 | 0.6 | GO:0097058 | CRLF-CLCF1 complex(GO:0097058) |
| 0.2 | 1.4 | GO:0000110 | nucleotide-excision repair factor 1 complex(GO:0000110) ERCC4-ERCC1 complex(GO:0070522) |
| 0.2 | 3.0 | GO:0005916 | fascia adherens(GO:0005916) |
| 0.2 | 10.3 | GO:0005834 | heterotrimeric G-protein complex(GO:0005834) |
| 0.2 | 2.1 | GO:0042622 | photoreceptor outer segment membrane(GO:0042622) |
| 0.2 | 2.1 | GO:0005614 | interstitial matrix(GO:0005614) |
| 0.2 | 1.7 | GO:0032039 | integrator complex(GO:0032039) |
| 0.2 | 8.1 | GO:0030662 | coated vesicle membrane(GO:0030662) |
| 0.2 | 1.8 | GO:0043219 | lateral loop(GO:0043219) |
| 0.2 | 2.1 | GO:0048786 | presynaptic active zone(GO:0048786) |
| 0.2 | 9.0 | GO:0031904 | endosome lumen(GO:0031904) |
| 0.2 | 10.4 | GO:0031594 | neuromuscular junction(GO:0031594) |
| 0.2 | 4.0 | GO:0035327 | transcriptionally active chromatin(GO:0035327) |
| 0.2 | 7.8 | GO:0016235 | aggresome(GO:0016235) |
| 0.1 | 1.0 | GO:0060198 | clathrin-sculpted vesicle(GO:0060198) clathrin-sculpted gamma-aminobutyric acid transport vesicle(GO:0061200) clathrin-sculpted gamma-aminobutyric acid transport vesicle membrane(GO:0061202) |
| 0.1 | 3.4 | GO:0046930 | pore complex(GO:0046930) |
| 0.1 | 2.4 | GO:0005639 | integral component of nuclear inner membrane(GO:0005639) intrinsic component of nuclear inner membrane(GO:0031229) nuclear membrane part(GO:0044453) |
| 0.1 | 13.3 | GO:0008076 | voltage-gated potassium channel complex(GO:0008076) potassium channel complex(GO:0034705) |
| 0.1 | 2.1 | GO:0032591 | dendritic spine membrane(GO:0032591) |
| 0.1 | 9.7 | GO:0030658 | transport vesicle membrane(GO:0030658) |
| 0.1 | 7.6 | GO:0043195 | terminal bouton(GO:0043195) |
| 0.1 | 9.1 | GO:0012507 | ER to Golgi transport vesicle membrane(GO:0012507) |
| 0.1 | 18.4 | GO:0055037 | recycling endosome(GO:0055037) |
| 0.1 | 2.0 | GO:0030137 | COPI-coated vesicle(GO:0030137) |
| 0.1 | 10.0 | GO:0044438 | microbody part(GO:0044438) peroxisomal part(GO:0044439) |
| 0.1 | 9.5 | GO:0005581 | collagen trimer(GO:0005581) |
| 0.1 | 17.2 | GO:0005802 | trans-Golgi network(GO:0005802) |
| 0.1 | 1.0 | GO:0033270 | paranode region of axon(GO:0033270) |
| 0.1 | 11.8 | GO:0016605 | PML body(GO:0016605) |
| 0.1 | 4.1 | GO:0002102 | podosome(GO:0002102) |
| 0.1 | 12.5 | GO:0030018 | Z disc(GO:0030018) |
| 0.1 | 3.6 | GO:0045095 | keratin filament(GO:0045095) |
| 0.1 | 19.1 | GO:0014069 | postsynaptic density(GO:0014069) postsynaptic specialization(GO:0099572) |
| 0.1 | 25.4 | GO:0000790 | nuclear chromatin(GO:0000790) |
| 0.1 | 19.4 | GO:0009897 | external side of plasma membrane(GO:0009897) |
| 0.1 | 17.9 | GO:0016323 | basolateral plasma membrane(GO:0016323) |
| 0.1 | 9.1 | GO:0030016 | myofibril(GO:0030016) |
| 0.1 | 0.6 | GO:0070652 | HAUS complex(GO:0070652) |
| 0.1 | 4.9 | GO:0036064 | ciliary basal body(GO:0036064) |
| 0.1 | 4.6 | GO:0042383 | sarcolemma(GO:0042383) |
| 0.1 | 3.2 | GO:0042734 | presynaptic membrane(GO:0042734) |
| 0.0 | 1.7 | GO:0005905 | clathrin-coated pit(GO:0005905) |
| 0.0 | 3.4 | GO:0072686 | mitotic spindle(GO:0072686) |
| 0.0 | 0.9 | GO:0097381 | photoreceptor disc membrane(GO:0097381) |
| 0.0 | 3.1 | GO:0005811 | lipid particle(GO:0005811) |
| 0.0 | 10.6 | GO:0043025 | neuronal cell body(GO:0043025) |
| 0.0 | 2.6 | GO:0017053 | transcriptional repressor complex(GO:0017053) |
| 0.0 | 2.3 | GO:0032587 | ruffle membrane(GO:0032587) |
| 0.0 | 2.1 | GO:0045111 | intermediate filament cytoskeleton(GO:0045111) |
| 0.0 | 3.5 | GO:0001650 | fibrillar center(GO:0001650) |
| 0.0 | 2.8 | GO:0072562 | blood microparticle(GO:0072562) |
| 0.0 | 1.9 | GO:0005578 | proteinaceous extracellular matrix(GO:0005578) |
| 0.0 | 1.7 | GO:0035578 | azurophil granule lumen(GO:0035578) |
| 0.0 | 0.8 | GO:0098794 | postsynapse(GO:0098794) |
| 0.0 | 1.1 | GO:0034707 | chloride channel complex(GO:0034707) |
| 0.0 | 3.2 | GO:0036464 | cytoplasmic ribonucleoprotein granule(GO:0036464) |
| 0.0 | 1.8 | GO:0000139 | Golgi membrane(GO:0000139) |
| 0.0 | 41.9 | GO:0016021 | integral component of membrane(GO:0016021) |
Gene overrepresentation in molecular_function category:
| Log-likelihood per target | Total log-likelihood | Term | Description |
|---|---|---|---|
| 14.3 | 42.8 | GO:0004676 | 3-phosphoinositide-dependent protein kinase activity(GO:0004676) |
| 5.1 | 30.9 | GO:0030492 | hemoglobin binding(GO:0030492) |
| 4.8 | 23.8 | GO:0004095 | carnitine O-palmitoyltransferase activity(GO:0004095) |
| 4.2 | 12.6 | GO:0008859 | exoribonuclease II activity(GO:0008859) |
| 3.8 | 15.2 | GO:0004047 | aminomethyltransferase activity(GO:0004047) |
| 3.3 | 23.4 | GO:0031726 | CCR1 chemokine receptor binding(GO:0031726) |
| 3.2 | 12.8 | GO:0035373 | chondroitin sulfate proteoglycan binding(GO:0035373) |
| 2.5 | 7.5 | GO:0005148 | prolactin receptor binding(GO:0005148) |
| 2.4 | 9.6 | GO:0030899 | calcium-dependent ATPase activity(GO:0030899) |
| 2.2 | 19.7 | GO:0043426 | MRF binding(GO:0043426) |
| 2.1 | 6.4 | GO:0016406 | carnitine O-acyltransferase activity(GO:0016406) |
| 2.1 | 10.4 | GO:0031708 | endothelin B receptor binding(GO:0031708) |
| 1.9 | 7.6 | GO:0034988 | Fc-gamma receptor I complex binding(GO:0034988) |
| 1.9 | 5.6 | GO:0004913 | interleukin-4 receptor activity(GO:0004913) interleukin-7 receptor activity(GO:0004917) |
| 1.6 | 9.6 | GO:0004118 | cGMP-stimulated cyclic-nucleotide phosphodiesterase activity(GO:0004118) |
| 1.6 | 4.8 | GO:0035379 | carbon dioxide transmembrane transporter activity(GO:0035379) |
| 1.6 | 4.7 | GO:0036134 | thromboxane-A synthase activity(GO:0004796) 12-hydroxyheptadecatrienoic acid synthase activity(GO:0036134) |
| 1.6 | 18.8 | GO:0046625 | sphingolipid binding(GO:0046625) |
| 1.5 | 27.6 | GO:0008349 | MAP kinase kinase kinase kinase activity(GO:0008349) |
| 1.5 | 7.6 | GO:0060175 | brain-derived neurotrophic factor-activated receptor activity(GO:0060175) |
| 1.4 | 20.2 | GO:0042043 | neurexin family protein binding(GO:0042043) |
| 1.4 | 4.2 | GO:0016534 | cyclin-dependent protein kinase 5 activator activity(GO:0016534) |
| 1.4 | 10.9 | GO:0034711 | inhibin binding(GO:0034711) |
| 1.3 | 4.0 | GO:0010698 | acetyltransferase activator activity(GO:0010698) |
| 1.3 | 6.5 | GO:0086006 | voltage-gated sodium channel activity involved in cardiac muscle cell action potential(GO:0086006) |
| 1.3 | 3.8 | GO:0017128 | phospholipid scramblase activity(GO:0017128) |
| 1.3 | 8.8 | GO:0008142 | oxysterol binding(GO:0008142) |
| 1.1 | 3.4 | GO:0061663 | NEDD8 ligase activity(GO:0061663) |
| 1.1 | 14.5 | GO:0001087 | transcription factor activity, sequence-specific DNA binding, RNA polymerase recruiting(GO:0001011) transcription factor activity, TFIIB-class binding(GO:0001087) |
| 1.0 | 3.1 | GO:0033878 | hormone-sensitive lipase activity(GO:0033878) |
| 1.0 | 4.1 | GO:0042500 | aspartic endopeptidase activity, intramembrane cleaving(GO:0042500) |
| 1.0 | 12.1 | GO:0004971 | AMPA glutamate receptor activity(GO:0004971) |
| 1.0 | 3.9 | GO:0008889 | glycerophosphodiester phosphodiesterase activity(GO:0008889) |
| 1.0 | 9.5 | GO:0015385 | sodium:proton antiporter activity(GO:0015385) potassium:proton antiporter activity(GO:0015386) |
| 1.0 | 2.9 | GO:0004828 | serine-tRNA ligase activity(GO:0004828) |
| 1.0 | 48.5 | GO:0070412 | R-SMAD binding(GO:0070412) |
| 0.9 | 4.7 | GO:0004111 | creatine kinase activity(GO:0004111) |
| 0.9 | 2.7 | GO:0015389 | pyrimidine- and adenine-specific:sodium symporter activity(GO:0015389) |
| 0.9 | 8.0 | GO:0043560 | insulin receptor substrate binding(GO:0043560) |
| 0.9 | 3.6 | GO:0016404 | 15-hydroxyprostaglandin dehydrogenase (NAD+) activity(GO:0016404) |
| 0.8 | 5.1 | GO:0000155 | phosphorelay sensor kinase activity(GO:0000155) |
| 0.8 | 8.9 | GO:0031681 | G-protein beta-subunit binding(GO:0031681) |
| 0.8 | 4.9 | GO:0015272 | ATP-activated inward rectifier potassium channel activity(GO:0015272) |
| 0.8 | 1.5 | GO:0048403 | brain-derived neurotrophic factor binding(GO:0048403) |
| 0.7 | 8.0 | GO:0001042 | RNA polymerase I core binding(GO:0001042) |
| 0.7 | 9.1 | GO:0008517 | folic acid transporter activity(GO:0008517) |
| 0.7 | 2.1 | GO:0070052 | collagen V binding(GO:0070052) |
| 0.7 | 4.0 | GO:0005332 | gamma-aminobutyric acid:sodium symporter activity(GO:0005332) gamma-aminobutyric acid transmembrane transporter activity(GO:0015185) |
| 0.6 | 14.3 | GO:0005247 | voltage-gated chloride channel activity(GO:0005247) |
| 0.6 | 27.4 | GO:0046875 | ephrin receptor binding(GO:0046875) |
| 0.6 | 11.7 | GO:0042609 | CD4 receptor binding(GO:0042609) |
| 0.6 | 3.0 | GO:0071253 | connexin binding(GO:0071253) |
| 0.6 | 2.4 | GO:0004666 | prostaglandin-endoperoxide synthase activity(GO:0004666) |
| 0.6 | 2.9 | GO:1904315 | neurotransmitter receptor activity involved in regulation of postsynaptic membrane potential(GO:0099529) transmitter-gated ion channel activity involved in regulation of postsynaptic membrane potential(GO:1904315) |
| 0.6 | 13.2 | GO:0042813 | Wnt-activated receptor activity(GO:0042813) |
| 0.6 | 2.3 | GO:0001632 | leukotriene B4 receptor activity(GO:0001632) |
| 0.6 | 14.1 | GO:0043548 | phosphatidylinositol 3-kinase binding(GO:0043548) |
| 0.5 | 1.6 | GO:0016019 | peptidoglycan receptor activity(GO:0016019) |
| 0.5 | 10.3 | GO:0033130 | acetylcholine receptor binding(GO:0033130) |
| 0.5 | 3.2 | GO:0003873 | 6-phosphofructo-2-kinase activity(GO:0003873) fructose-2,6-bisphosphate 2-phosphatase activity(GO:0004331) |
| 0.5 | 2.1 | GO:0030107 | HLA-A specific inhibitory MHC class I receptor activity(GO:0030107) |
| 0.5 | 5.5 | GO:0015379 | potassium:chloride symporter activity(GO:0015379) potassium ion symporter activity(GO:0022820) |
| 0.5 | 2.5 | GO:0008046 | axon guidance receptor activity(GO:0008046) |
| 0.5 | 1.5 | GO:0019981 | interleukin-6 receptor activity(GO:0004915) oncostatin-M receptor activity(GO:0004924) interleukin-6 binding(GO:0019981) |
| 0.5 | 16.0 | GO:0071855 | neuropeptide receptor binding(GO:0071855) |
| 0.5 | 1.9 | GO:0003827 | alpha-1,3-mannosylglycoprotein 2-beta-N-acetylglucosaminyltransferase activity(GO:0003827) |
| 0.4 | 18.4 | GO:0042169 | SH2 domain binding(GO:0042169) |
| 0.4 | 1.3 | GO:0005171 | hepatocyte growth factor receptor binding(GO:0005171) |
| 0.4 | 3.1 | GO:0004126 | cytidine deaminase activity(GO:0004126) |
| 0.4 | 7.4 | GO:0102391 | decanoate--CoA ligase activity(GO:0102391) |
| 0.4 | 3.2 | GO:0044323 | retinoic acid-responsive element binding(GO:0044323) |
| 0.4 | 2.0 | GO:0001641 | group II metabotropic glutamate receptor activity(GO:0001641) |
| 0.4 | 1.2 | GO:0004832 | valine-tRNA ligase activity(GO:0004832) |
| 0.4 | 4.6 | GO:0005078 | MAP-kinase scaffold activity(GO:0005078) |
| 0.3 | 5.5 | GO:0032454 | histone demethylase activity (H3-K9 specific)(GO:0032454) |
| 0.3 | 0.9 | GO:0034041 | sterol-transporting ATPase activity(GO:0034041) |
| 0.3 | 6.0 | GO:0045504 | dynein heavy chain binding(GO:0045504) |
| 0.3 | 2.5 | GO:0005159 | insulin-like growth factor receptor binding(GO:0005159) |
| 0.3 | 2.7 | GO:0019957 | C-C chemokine binding(GO:0019957) |
| 0.3 | 3.8 | GO:0004028 | 3-chloroallyl aldehyde dehydrogenase activity(GO:0004028) |
| 0.3 | 3.5 | GO:0030215 | semaphorin receptor binding(GO:0030215) |
| 0.3 | 6.8 | GO:0005086 | ARF guanyl-nucleotide exchange factor activity(GO:0005086) |
| 0.3 | 2.1 | GO:0033192 | calmodulin-dependent protein phosphatase activity(GO:0033192) |
| 0.3 | 2.5 | GO:0031821 | G-protein coupled serotonin receptor binding(GO:0031821) |
| 0.3 | 11.3 | GO:0015026 | coreceptor activity(GO:0015026) |
| 0.2 | 27.2 | GO:0004867 | serine-type endopeptidase inhibitor activity(GO:0004867) |
| 0.2 | 1.0 | GO:0004698 | calcium-dependent protein kinase C activity(GO:0004698) |
| 0.2 | 1.7 | GO:0015065 | uridine nucleotide receptor activity(GO:0015065) G-protein coupled pyrimidinergic nucleotide receptor activity(GO:0071553) |
| 0.2 | 4.3 | GO:0004143 | diacylglycerol kinase activity(GO:0004143) |
| 0.2 | 1.2 | GO:0004692 | cGMP-dependent protein kinase activity(GO:0004692) |
| 0.2 | 3.8 | GO:0004551 | nucleotide diphosphatase activity(GO:0004551) |
| 0.2 | 9.4 | GO:0008009 | chemokine activity(GO:0008009) |
| 0.2 | 2.7 | GO:0052658 | inositol-1,4,5-trisphosphate 5-phosphatase activity(GO:0052658) |
| 0.2 | 2.2 | GO:1990380 | Lys48-specific deubiquitinase activity(GO:1990380) |
| 0.2 | 1.6 | GO:0097109 | neuroligin family protein binding(GO:0097109) |
| 0.2 | 2.4 | GO:0005344 | oxygen transporter activity(GO:0005344) |
| 0.2 | 2.4 | GO:0035381 | extracellular ATP-gated cation channel activity(GO:0004931) ATP-gated ion channel activity(GO:0035381) |
| 0.2 | 4.0 | GO:0005385 | zinc ion transmembrane transporter activity(GO:0005385) |
| 0.2 | 6.5 | GO:0005518 | collagen binding(GO:0005518) |
| 0.2 | 2.7 | GO:0015245 | fatty acid transporter activity(GO:0015245) |
| 0.2 | 0.6 | GO:0005127 | ciliary neurotrophic factor receptor binding(GO:0005127) |
| 0.2 | 1.4 | GO:1990599 | 3' overhang single-stranded DNA endodeoxyribonuclease activity(GO:1990599) |
| 0.2 | 2.7 | GO:0031014 | troponin T binding(GO:0031014) |
| 0.2 | 3.3 | GO:0019206 | nucleoside kinase activity(GO:0019206) |
| 0.2 | 10.8 | GO:0005044 | scavenger receptor activity(GO:0005044) |
| 0.2 | 1.3 | GO:0003828 | alpha-N-acetylneuraminate alpha-2,8-sialyltransferase activity(GO:0003828) |
| 0.2 | 13.8 | GO:0004402 | histone acetyltransferase activity(GO:0004402) |
| 0.2 | 5.4 | GO:0005104 | fibroblast growth factor receptor binding(GO:0005104) |
| 0.2 | 8.3 | GO:0030332 | cyclin binding(GO:0030332) |
| 0.2 | 7.2 | GO:0004623 | phospholipase A2 activity(GO:0004623) |
| 0.2 | 0.9 | GO:0008048 | calcium sensitive guanylate cyclase activator activity(GO:0008048) |
| 0.2 | 1.2 | GO:0030020 | extracellular matrix structural constituent conferring tensile strength(GO:0030020) |
| 0.2 | 0.9 | GO:0016286 | small conductance calcium-activated potassium channel activity(GO:0016286) |
| 0.2 | 5.7 | GO:0044183 | protein binding involved in protein folding(GO:0044183) |
| 0.2 | 6.0 | GO:0005487 | nucleocytoplasmic transporter activity(GO:0005487) |
| 0.2 | 4.9 | GO:0043425 | bHLH transcription factor binding(GO:0043425) |
| 0.2 | 2.7 | GO:0015467 | G-protein activated inward rectifier potassium channel activity(GO:0015467) voltage-gated potassium channel activity involved in cardiac muscle cell action potential repolarization(GO:0086008) |
| 0.2 | 1.8 | GO:0097016 | L27 domain binding(GO:0097016) |
| 0.2 | 1.7 | GO:0035612 | AP-2 adaptor complex binding(GO:0035612) |
| 0.1 | 1.0 | GO:0004351 | glutamate decarboxylase activity(GO:0004351) |
| 0.1 | 14.3 | GO:0019905 | syntaxin binding(GO:0019905) |
| 0.1 | 10.5 | GO:0004004 | ATP-dependent RNA helicase activity(GO:0004004) |
| 0.1 | 45.5 | GO:0005096 | GTPase activator activity(GO:0005096) |
| 0.1 | 2.0 | GO:0034483 | heparan sulfate sulfotransferase activity(GO:0034483) |
| 0.1 | 2.3 | GO:0030676 | Rac guanyl-nucleotide exchange factor activity(GO:0030676) |
| 0.1 | 11.4 | GO:0005179 | hormone activity(GO:0005179) |
| 0.1 | 0.7 | GO:0043125 | ErbB-3 class receptor binding(GO:0043125) |
| 0.1 | 12.1 | GO:0005262 | calcium channel activity(GO:0005262) |
| 0.1 | 3.4 | GO:0016248 | channel inhibitor activity(GO:0016248) |
| 0.1 | 20.4 | GO:0003823 | antigen binding(GO:0003823) |
| 0.1 | 1.9 | GO:0008191 | metalloendopeptidase inhibitor activity(GO:0008191) |
| 0.1 | 2.8 | GO:0070888 | E-box binding(GO:0070888) |
| 0.1 | 2.4 | GO:0030742 | GTP-dependent protein binding(GO:0030742) |
| 0.1 | 0.9 | GO:0015643 | toxic substance binding(GO:0015643) |
| 0.1 | 0.4 | GO:0017018 | myosin phosphatase activity(GO:0017018) |
| 0.1 | 2.3 | GO:0005164 | tumor necrosis factor receptor binding(GO:0005164) |
| 0.1 | 0.1 | GO:0004974 | leukotriene receptor activity(GO:0004974) |
| 0.1 | 0.3 | GO:0031433 | telethonin binding(GO:0031433) |
| 0.1 | 1.0 | GO:0071889 | 14-3-3 protein binding(GO:0071889) |
| 0.1 | 0.8 | GO:0071837 | HMG box domain binding(GO:0071837) |
| 0.0 | 2.3 | GO:0051879 | Hsp90 protein binding(GO:0051879) |
| 0.0 | 1.8 | GO:0004683 | calmodulin-dependent protein kinase activity(GO:0004683) |
| 0.0 | 2.3 | GO:0017048 | Rho GTPase binding(GO:0017048) |
| 0.0 | 3.0 | GO:0002039 | p53 binding(GO:0002039) |
| 0.0 | 0.6 | GO:0015269 | calcium-activated potassium channel activity(GO:0015269) |
| 0.0 | 2.8 | GO:0044822 | mRNA binding(GO:0003729) poly(A) RNA binding(GO:0044822) |
| 0.0 | 4.9 | GO:0003714 | transcription corepressor activity(GO:0003714) |
| 0.0 | 2.6 | GO:0003730 | mRNA 3'-UTR binding(GO:0003730) |
| 0.0 | 1.1 | GO:0005160 | transforming growth factor beta receptor binding(GO:0005160) |
| 0.0 | 1.9 | GO:0020037 | heme binding(GO:0020037) |
| 0.0 | 0.5 | GO:0016500 | protein-hormone receptor activity(GO:0016500) |
| 0.0 | 2.5 | GO:0001085 | RNA polymerase II transcription factor binding(GO:0001085) |
| 0.0 | 1.4 | GO:0030165 | PDZ domain binding(GO:0030165) |
| 0.0 | 1.3 | GO:0000979 | RNA polymerase II core promoter sequence-specific DNA binding(GO:0000979) |
| 0.0 | 2.1 | GO:0009055 | electron carrier activity(GO:0009055) |
| 0.0 | 2.5 | GO:0005057 | receptor signaling protein activity(GO:0005057) |
| 0.0 | 0.9 | GO:0001221 | transcription cofactor binding(GO:0001221) |
| 0.0 | 1.9 | GO:0004497 | monooxygenase activity(GO:0004497) |
| 0.0 | 1.1 | GO:0005254 | chloride channel activity(GO:0005254) |
| 0.0 | 0.1 | GO:0003810 | protein-glutamine gamma-glutamyltransferase activity(GO:0003810) |
| 0.0 | 1.5 | GO:0005178 | integrin binding(GO:0005178) |
| 0.0 | 0.3 | GO:0044325 | ion channel binding(GO:0044325) |
Gene overrepresentation in C2:CP category:
| Log-likelihood per target | Total log-likelihood | Term | Description |
|---|---|---|---|
| 2.2 | 48.5 | PID TCR RAS PATHWAY | Ras signaling in the CD4+ TCR pathway |
| 1.7 | 76.2 | SIG IL4RECEPTOR IN B LYPHOCYTES | Genes related to IL4 rceptor signaling in B lymphocytes |
| 1.3 | 2.5 | SA TRKA RECEPTOR | The TrkA receptor binds nerve growth factor to activate MAP kinase pathways and promote cell growth. |
| 0.5 | 12.1 | PID NCADHERIN PATHWAY | N-cadherin signaling events |
| 0.5 | 30.2 | PID RAC1 REG PATHWAY | Regulation of RAC1 activity |
| 0.4 | 12.8 | PID SYNDECAN 3 PATHWAY | Syndecan-3-mediated signaling events |
| 0.3 | 32.7 | PID IL12 2PATHWAY | IL12-mediated signaling events |
| 0.3 | 11.7 | PID S1P S1P3 PATHWAY | S1P3 pathway |
| 0.3 | 19.3 | PID AMB2 NEUTROPHILS PATHWAY | amb2 Integrin signaling |
| 0.3 | 9.0 | ST ERK1 ERK2 MAPK PATHWAY | ERK1/ERK2 MAPK Pathway |
| 0.3 | 19.3 | PID HNF3B PATHWAY | FOXA2 and FOXA3 transcription factor networks |
| 0.2 | 11.4 | PID ENDOTHELIN PATHWAY | Endothelins |
| 0.2 | 3.4 | PID RANBP2 PATHWAY | Sumoylation by RanBP2 regulates transcriptional repression |
| 0.2 | 9.1 | PID CD8 TCR PATHWAY | TCR signaling in naïve CD8+ T cells |
| 0.2 | 1.5 | PID IL27 PATHWAY | IL27-mediated signaling events |
| 0.2 | 4.8 | PID BETA CATENIN DEG PATHWAY | Degradation of beta catenin |
| 0.2 | 4.9 | PID FGF PATHWAY | FGF signaling pathway |
| 0.1 | 4.3 | PID MAPK TRK PATHWAY | Trk receptor signaling mediated by the MAPK pathway |
| 0.1 | 5.2 | PID SHP2 PATHWAY | SHP2 signaling |
| 0.1 | 49.8 | NABA SECRETED FACTORS | Genes encoding secreted soluble factors |
| 0.1 | 4.0 | ST WNT CA2 CYCLIC GMP PATHWAY | Wnt/Ca2+/cyclic GMP signaling. |
| 0.1 | 5.1 | PID HEDGEHOG GLI PATHWAY | Hedgehog signaling events mediated by Gli proteins |
| 0.1 | 5.9 | PID FRA PATHWAY | Validated transcriptional targets of AP1 family members Fra1 and Fra2 |
| 0.1 | 3.2 | PID RETINOIC ACID PATHWAY | Retinoic acid receptors-mediated signaling |
| 0.1 | 2.5 | PID EPHRINB REV PATHWAY | Ephrin B reverse signaling |
| 0.1 | 3.7 | PID ARF6 PATHWAY | Arf6 signaling events |
| 0.1 | 3.0 | PID INTEGRIN2 PATHWAY | Beta2 integrin cell surface interactions |
| 0.1 | 5.6 | PID ILK PATHWAY | Integrin-linked kinase signaling |
| 0.1 | 15.0 | NABA ECM AFFILIATED | Genes encoding proteins affiliated structurally or functionally to extracellular matrix proteins |
| 0.1 | 2.1 | PID TAP63 PATHWAY | Validated transcriptional targets of TAp63 isoforms |
| 0.1 | 8.6 | PID CASPASE PATHWAY | Caspase cascade in apoptosis |
| 0.1 | 3.3 | NABA PROTEOGLYCANS | Genes encoding proteoglycans |
| 0.1 | 3.3 | PID AR TF PATHWAY | Regulation of Androgen receptor activity |
| 0.1 | 3.0 | PID TNF PATHWAY | TNF receptor signaling pathway |
| 0.1 | 4.7 | PID RB 1PATHWAY | Regulation of retinoblastoma protein |
| 0.1 | 3.4 | PID PLK1 PATHWAY | PLK1 signaling events |
| 0.0 | 1.5 | PID FAK PATHWAY | Signaling events mediated by focal adhesion kinase |
| 0.0 | 10.4 | NABA ECM GLYCOPROTEINS | Genes encoding structural ECM glycoproteins |
| 0.0 | 0.7 | PID EPHA FWDPATHWAY | EPHA forward signaling |
| 0.0 | 0.9 | PID CONE PATHWAY | Visual signal transduction: Cones |
| 0.0 | 0.9 | PID HDAC CLASSIII PATHWAY | Signaling events mediated by HDAC Class III |
| 0.0 | 1.9 | PID CMYB PATHWAY | C-MYB transcription factor network |
| 0.0 | 1.8 | PID P53 DOWNSTREAM PATHWAY | Direct p53 effectors |
| 0.0 | 0.8 | PID ARF6 TRAFFICKING PATHWAY | Arf6 trafficking events |
| 0.0 | 0.7 | PID SYNDECAN 1 PATHWAY | Syndecan-1-mediated signaling events |
| 0.0 | 0.6 | PID BCR 5PATHWAY | BCR signaling pathway |
| 0.0 | 3.9 | NABA ECM REGULATORS | Genes encoding enzymes and their regulators involved in the remodeling of the extracellular matrix |
| 0.0 | 0.6 | PID P73PATHWAY | p73 transcription factor network |
Gene overrepresentation in C2:CP:REACTOME category:
| Log-likelihood per target | Total log-likelihood | Term | Description |
|---|---|---|---|
| 2.4 | 48.5 | REACTOME ACTIVATION OF THE AP1 FAMILY OF TRANSCRIPTION FACTORS | Genes involved in Activation of the AP-1 family of transcription factors |
| 1.3 | 42.8 | REACTOME G BETA GAMMA SIGNALLING THROUGH PI3KGAMMA | Genes involved in G beta:gamma signalling through PI3Kgamma |
| 0.8 | 23.8 | REACTOME ACTIVATED AMPK STIMULATES FATTY ACID OXIDATION IN MUSCLE | Genes involved in Activated AMPK stimulates fatty-acid oxidation in muscle |
| 0.7 | 16.7 | REACTOME PLATELET SENSITIZATION BY LDL | Genes involved in Platelet sensitization by LDL |
| 0.6 | 15.0 | REACTOME UNBLOCKING OF NMDA RECEPTOR GLUTAMATE BINDING AND ACTIVATION | Genes involved in Unblocking of NMDA receptor, glutamate binding and activation |
| 0.6 | 15.0 | REACTOME PROLACTIN RECEPTOR SIGNALING | Genes involved in Prolactin receptor signaling |
| 0.5 | 7.2 | REACTOME ACYL CHAIN REMODELLING OF PG | Genes involved in Acyl chain remodelling of PG |
| 0.4 | 27.4 | REACTOME CHEMOKINE RECEPTORS BIND CHEMOKINES | Genes involved in Chemokine receptors bind chemokines |
| 0.4 | 8.0 | REACTOME TGF BETA RECEPTOR SIGNALING IN EMT EPITHELIAL TO MESENCHYMAL TRANSITION | Genes involved in TGF-beta receptor signaling in EMT (epithelial to mesenchymal transition) |
| 0.4 | 66.5 | REACTOME SIGNALING BY RHO GTPASES | Genes involved in Signaling by Rho GTPases |
| 0.4 | 2.6 | REACTOME SYNTHESIS SECRETION AND INACTIVATION OF GLP1 | Genes involved in Synthesis, Secretion, and Inactivation of Glucagon-like Peptide-1 (GLP-1) |
| 0.4 | 2.5 | REACTOME NRAGE SIGNALS DEATH THROUGH JNK | Genes involved in NRAGE signals death through JNK |
| 0.3 | 4.8 | REACTOME PASSIVE TRANSPORT BY AQUAPORINS | Genes involved in Passive Transport by Aquaporins |
| 0.3 | 5.6 | REACTOME IL 7 SIGNALING | Genes involved in Interleukin-7 signaling |
| 0.3 | 11.4 | REACTOME CGMP EFFECTS | Genes involved in cGMP effects |
| 0.3 | 3.4 | REACTOME AKT PHOSPHORYLATES TARGETS IN THE CYTOSOL | Genes involved in AKT phosphorylates targets in the cytosol |
| 0.3 | 7.6 | REACTOME INWARDLY RECTIFYING K CHANNELS | Genes involved in Inwardly rectifying K+ channels |
| 0.3 | 2.5 | REACTOME G PROTEIN ACTIVATION | Genes involved in G-protein activation |
| 0.2 | 4.0 | REACTOME ZINC TRANSPORTERS | Genes involved in Zinc transporters |
| 0.2 | 2.3 | REACTOME CIRCADIAN REPRESSION OF EXPRESSION BY REV ERBA | Genes involved in Circadian Repression of Expression by REV-ERBA |
| 0.2 | 6.7 | REACTOME SPHINGOLIPID DE NOVO BIOSYNTHESIS | Genes involved in Sphingolipid de novo biosynthesis |
| 0.2 | 2.4 | REACTOME ELEVATION OF CYTOSOLIC CA2 LEVELS | Genes involved in Elevation of cytosolic Ca2+ levels |
| 0.2 | 3.9 | REACTOME ACTIVATION OF BH3 ONLY PROTEINS | Genes involved in Activation of BH3-only proteins |
| 0.2 | 6.5 | REACTOME INTERACTION BETWEEN L1 AND ANKYRINS | Genes involved in Interaction between L1 and Ankyrins |
| 0.2 | 6.4 | REACTOME PEROXISOMAL LIPID METABOLISM | Genes involved in Peroxisomal lipid metabolism |
| 0.2 | 17.4 | REACTOME G ALPHA I SIGNALLING EVENTS | Genes involved in G alpha (i) signalling events |
| 0.2 | 26.4 | REACTOME PEPTIDE LIGAND BINDING RECEPTORS | Genes involved in Peptide ligand-binding receptors |
| 0.2 | 1.5 | REACTOME IL 6 SIGNALING | Genes involved in Interleukin-6 signaling |
| 0.2 | 15.9 | REACTOME IMMUNOREGULATORY INTERACTIONS BETWEEN A LYMPHOID AND A NON LYMPHOID CELL | Genes involved in Immunoregulatory interactions between a Lymphoid and a non-Lymphoid cell |
| 0.2 | 15.7 | REACTOME INTERFERON ALPHA BETA SIGNALING | Genes involved in Interferon alpha/beta signaling |
| 0.2 | 1.4 | REACTOME TRANSCRIPTION COUPLED NER TC NER | Genes involved in Transcription-coupled NER (TC-NER) |
| 0.2 | 2.0 | REACTOME NEF MEDIATED DOWNREGULATION OF MHC CLASS I COMPLEX CELL SURFACE EXPRESSION | Genes involved in Nef mediated downregulation of MHC class I complex cell surface expression |
| 0.2 | 3.5 | REACTOME OTHER SEMAPHORIN INTERACTIONS | Genes involved in Other semaphorin interactions |
| 0.2 | 3.0 | REACTOME GAP JUNCTION ASSEMBLY | Genes involved in Gap junction assembly |
| 0.2 | 4.2 | REACTOME CRMPS IN SEMA3A SIGNALING | Genes involved in CRMPs in Sema3A signaling |
| 0.2 | 2.3 | REACTOME EICOSANOID LIGAND BINDING RECEPTORS | Genes involved in Eicosanoid ligand-binding receptors |
| 0.2 | 2.0 | REACTOME CLASS C 3 METABOTROPIC GLUTAMATE PHEROMONE RECEPTORS | Genes involved in Class C/3 (Metabotropic glutamate/pheromone receptors) |
| 0.1 | 3.7 | REACTOME INSULIN SYNTHESIS AND PROCESSING | Genes involved in Insulin Synthesis and Processing |
| 0.1 | 3.2 | REACTOME PRE NOTCH PROCESSING IN GOLGI | Genes involved in Pre-NOTCH Processing in Golgi |
| 0.1 | 12.3 | REACTOME LOSS OF NLP FROM MITOTIC CENTROSOMES | Genes involved in Loss of Nlp from mitotic centrosomes |
| 0.1 | 2.7 | REACTOME TRANSPORT OF ORGANIC ANIONS | Genes involved in Transport of organic anions |
| 0.1 | 4.9 | REACTOME YAP1 AND WWTR1 TAZ STIMULATED GENE EXPRESSION | Genes involved in YAP1- and WWTR1 (TAZ)-stimulated gene expression |
| 0.1 | 6.0 | REACTOME MHC CLASS II ANTIGEN PRESENTATION | Genes involved in MHC class II antigen presentation |
| 0.1 | 3.1 | REACTOME HORMONE SENSITIVE LIPASE HSL MEDIATED TRIACYLGLYCEROL HYDROLYSIS | Genes involved in Hormone-sensitive lipase (HSL)-mediated triacylglycerol hydrolysis |
| 0.1 | 5.4 | REACTOME MYOGENESIS | Genes involved in Myogenesis |
| 0.1 | 3.9 | REACTOME PTM GAMMA CARBOXYLATION HYPUSINE FORMATION AND ARYLSULFATASE ACTIVATION | Genes involved in PTM: gamma carboxylation, hypusine formation and arylsulfatase activation |
| 0.1 | 2.7 | REACTOME TRANSPORT OF VITAMINS NUCLEOSIDES AND RELATED MOLECULES | Genes involved in Transport of vitamins, nucleosides, and related molecules |
| 0.1 | 5.1 | REACTOME VOLTAGE GATED POTASSIUM CHANNELS | Genes involved in Voltage gated Potassium channels |
| 0.1 | 2.1 | REACTOME DARPP 32 EVENTS | Genes involved in DARPP-32 events |
| 0.1 | 1.2 | REACTOME PRE NOTCH TRANSCRIPTION AND TRANSLATION | Genes involved in Pre-NOTCH Transcription and Translation |
| 0.1 | 6.4 | REACTOME STRIATED MUSCLE CONTRACTION | Genes involved in Striated Muscle Contraction |
| 0.1 | 2.7 | REACTOME TRAFFICKING OF AMPA RECEPTORS | Genes involved in Trafficking of AMPA receptors |
| 0.1 | 6.3 | REACTOME APOPTOTIC CLEAVAGE OF CELLULAR PROTEINS | Genes involved in Apoptotic cleavage of cellular proteins |
| 0.1 | 3.2 | REACTOME PACKAGING OF TELOMERE ENDS | Genes involved in Packaging Of Telomere Ends |
| 0.1 | 7.7 | REACTOME TRANSPORT OF INORGANIC CATIONS ANIONS AND AMINO ACIDS OLIGOPEPTIDES | Genes involved in Transport of inorganic cations/anions and amino acids/oligopeptides |
| 0.1 | 0.9 | REACTOME POTASSIUM CHANNELS | Genes involved in Potassium Channels |
| 0.1 | 2.0 | REACTOME HS GAG BIOSYNTHESIS | Genes involved in HS-GAG biosynthesis |
| 0.0 | 2.7 | REACTOME CYTOCHROME P450 ARRANGED BY SUBSTRATE TYPE | Genes involved in Cytochrome P450 - arranged by substrate type |
| 0.0 | 1.0 | REACTOME GABA SYNTHESIS RELEASE REUPTAKE AND DEGRADATION | Genes involved in GABA synthesis, release, reuptake and degradation |
| 0.0 | 1.6 | REACTOME PI3K EVENTS IN ERBB4 SIGNALING | Genes involved in PI3K events in ERBB4 signaling |
| 0.0 | 2.6 | REACTOME GOLGI ASSOCIATED VESICLE BIOGENESIS | Genes involved in Golgi Associated Vesicle Biogenesis |
| 0.0 | 2.5 | REACTOME NCAM1 INTERACTIONS | Genes involved in NCAM1 interactions |
| 0.0 | 1.6 | REACTOME GLYCOLYSIS | Genes involved in Glycolysis |
| 0.0 | 1.1 | REACTOME DEGRADATION OF THE EXTRACELLULAR MATRIX | Genes involved in Degradation of the extracellular matrix |
| 0.0 | 0.8 | REACTOME REGULATION OF INSULIN LIKE GROWTH FACTOR IGF ACTIVITY BY INSULIN LIKE GROWTH FACTOR BINDING PROTEINS IGFBPS | Genes involved in Regulation of Insulin-like Growth Factor (IGF) Activity by Insulin-like Growth Factor Binding Proteins (IGFBPs) |
| 0.0 | 1.9 | REACTOME TRANSPORT TO THE GOLGI AND SUBSEQUENT MODIFICATION | Genes involved in Transport to the Golgi and subsequent modification |
| 0.0 | 0.5 | REACTOME HORMONE LIGAND BINDING RECEPTORS | Genes involved in Hormone ligand-binding receptors |
| 0.0 | 0.6 | REACTOME ABCA TRANSPORTERS IN LIPID HOMEOSTASIS | Genes involved in ABCA transporters in lipid homeostasis |
| 0.0 | 2.6 | REACTOME RESPONSE TO ELEVATED PLATELET CYTOSOLIC CA2 | Genes involved in Response to elevated platelet cytosolic Ca2+ |
| 0.0 | 0.9 | REACTOME TRANSCRIPTIONAL REGULATION OF WHITE ADIPOCYTE DIFFERENTIATION | Genes involved in Transcriptional Regulation of White Adipocyte Differentiation |
| 0.0 | 1.1 | REACTOME NGF SIGNALLING VIA TRKA FROM THE PLASMA MEMBRANE | Genes involved in NGF signalling via TRKA from the plasma membrane |