Project
GNF SymAtlas + NCI-60 cancer cell lines, comparison of cancers vs non-cancers, human (Su, 2004; Ross, 2000)
Navigation
Downloads
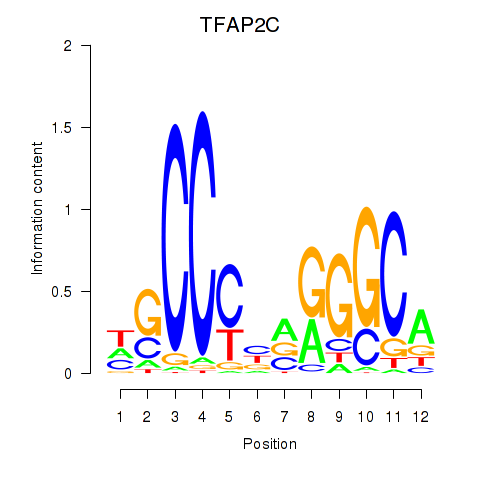
Results for TFAP2C
Z-value: 0.84
Motif logo
Transcription factors associated with TFAP2C
| Gene Symbol | Gene ID | Gene Info |
|---|---|---|
|
TFAP2C
|
ENSG00000087510.5 | transcription factor AP-2 gamma |
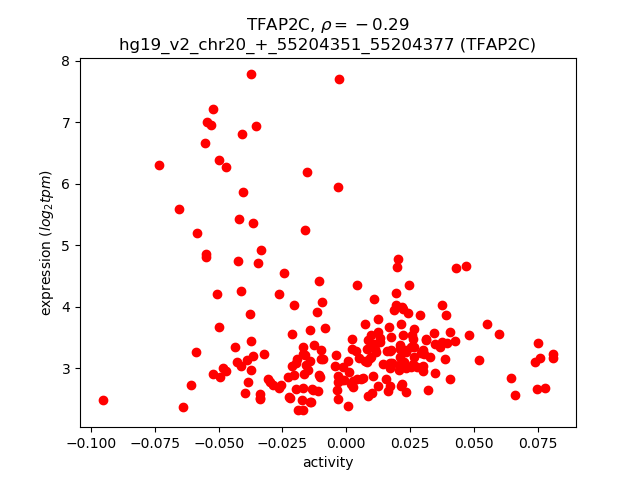
Activity-expression correlation:
| Gene | Promoter | Pearson corr. coef. | P-value | Plot |
|---|---|---|---|---|
| TFAP2C | hg19_v2_chr20_+_55204351_55204377 | -0.29 | 1.9e-05 | Click! |
Activity profile of TFAP2C motif
Sorted Z-values of TFAP2C motif
| Promoter | Log-likelihood | Transcript | Gene | Gene Info |
|---|---|---|---|---|
| chr21_-_46348694 | 24.84 |
ENST00000355153.4
ENST00000397850.2 |
ITGB2
|
integrin, beta 2 (complement component 3 receptor 3 and 4 subunit) |
| chrX_+_153237740 | 23.84 |
ENST00000369982.4
|
TMEM187
|
transmembrane protein 187 |
| chr15_+_91427691 | 21.33 |
ENST00000559355.1
ENST00000394302.1 |
FES
|
feline sarcoma oncogene |
| chr18_+_77439775 | 17.94 |
ENST00000299543.7
ENST00000075430.7 |
CTDP1
|
CTD (carboxy-terminal domain, RNA polymerase II, polypeptide A) phosphatase, subunit 1 |
| chr14_+_102027688 | 17.31 |
ENST00000510508.4
ENST00000359323.3 |
DIO3
|
deiodinase, iodothyronine, type III |
| chr15_-_64338521 | 17.07 |
ENST00000457488.1
ENST00000558069.1 |
DAPK2
|
death-associated protein kinase 2 |
| chr16_+_222846 | 17.01 |
ENST00000251595.6
ENST00000397806.1 |
HBA2
|
hemoglobin, alpha 2 |
| chr15_+_44580955 | 16.97 |
ENST00000345795.2
ENST00000360824.3 |
CASC4
|
cancer susceptibility candidate 4 |
| chr15_+_44580899 | 15.74 |
ENST00000559222.1
ENST00000299957.6 |
CASC4
|
cancer susceptibility candidate 4 |
| chr6_+_33043703 | 15.65 |
ENST00000418931.2
ENST00000535465.1 |
HLA-DPB1
|
major histocompatibility complex, class II, DP beta 1 |
| chr11_-_64512273 | 15.55 |
ENST00000377497.3
ENST00000377487.1 ENST00000430645.1 |
RASGRP2
|
RAS guanyl releasing protein 2 (calcium and DAG-regulated) |
| chr17_-_15903002 | 15.21 |
ENST00000399277.1
|
ZSWIM7
|
zinc finger, SWIM-type containing 7 |
| chr14_+_73704201 | 14.77 |
ENST00000340738.5
ENST00000427855.1 ENST00000381166.3 |
PAPLN
|
papilin, proteoglycan-like sulfated glycoprotein |
| chr15_-_48937884 | 14.34 |
ENST00000560355.1
|
FBN1
|
fibrillin 1 |
| chr17_+_8339164 | 13.91 |
ENST00000582665.1
ENST00000334527.7 ENST00000299734.7 |
NDEL1
|
nudE neurodevelopment protein 1-like 1 |
| chr2_-_38604398 | 13.60 |
ENST00000443098.1
ENST00000449130.1 ENST00000378954.4 ENST00000539122.1 ENST00000419554.2 ENST00000451483.1 ENST00000406122.1 |
ATL2
|
atlastin GTPase 2 |
| chr1_-_213031418 | 13.53 |
ENST00000356684.3
ENST00000426161.1 ENST00000424044.1 |
FLVCR1-AS1
|
FLVCR1 antisense RNA 1 (head to head) |
| chr10_-_21786179 | 13.42 |
ENST00000377113.5
|
CASC10
|
cancer susceptibility candidate 10 |
| chr6_+_31554779 | 13.39 |
ENST00000376090.2
|
LST1
|
leukocyte specific transcript 1 |
| chr17_-_79139817 | 13.19 |
ENST00000326724.4
|
AATK
|
apoptosis-associated tyrosine kinase |
| chr9_-_139094988 | 13.16 |
ENST00000371746.3
|
LHX3
|
LIM homeobox 3 |
| chr1_+_6845384 | 12.92 |
ENST00000303635.7
|
CAMTA1
|
calmodulin binding transcription activator 1 |
| chr17_+_77681075 | 12.61 |
ENST00000397549.2
|
CTD-2116F7.1
|
CTD-2116F7.1 |
| chr4_+_2965307 | 12.60 |
ENST00000398051.4
ENST00000503518.2 ENST00000398052.4 ENST00000345167.6 ENST00000504933.1 ENST00000442472.2 |
GRK4
|
G protein-coupled receptor kinase 4 |
| chr15_+_99791567 | 12.46 |
ENST00000558879.1
ENST00000301981.3 ENST00000422500.2 ENST00000447360.2 ENST00000442993.2 |
LRRC28
|
leucine rich repeat containing 28 |
| chr1_+_54519242 | 12.23 |
ENST00000234827.1
|
TCEANC2
|
transcription elongation factor A (SII) N-terminal and central domain containing 2 |
| chr16_+_4784273 | 12.18 |
ENST00000299320.5
ENST00000586724.1 |
C16orf71
|
chromosome 16 open reading frame 71 |
| chr4_-_681114 | 12.15 |
ENST00000503156.1
|
MFSD7
|
major facilitator superfamily domain containing 7 |
| chr10_-_124768300 | 12.15 |
ENST00000368886.5
|
IKZF5
|
IKAROS family zinc finger 5 (Pegasus) |
| chr7_+_111846741 | 12.14 |
ENST00000421043.1
ENST00000425229.1 ENST00000450657.1 |
ZNF277
|
zinc finger protein 277 |
| chr17_+_38083977 | 11.94 |
ENST00000578802.1
ENST00000578478.1 ENST00000582263.1 |
RP11-387H17.4
|
RP11-387H17.4 |
| chr15_-_90358048 | 11.74 |
ENST00000300060.6
ENST00000560137.1 |
ANPEP
|
alanyl (membrane) aminopeptidase |
| chr20_-_35580240 | 11.67 |
ENST00000262878.4
|
SAMHD1
|
SAM domain and HD domain 1 |
| chr6_+_150920999 | 11.60 |
ENST00000367328.1
ENST00000367326.1 |
PLEKHG1
|
pleckstrin homology domain containing, family G (with RhoGef domain) member 1 |
| chr3_-_138763734 | 11.47 |
ENST00000413199.1
ENST00000502927.2 |
PRR23C
|
proline rich 23C |
| chr10_+_88728189 | 11.46 |
ENST00000416348.1
|
ADIRF
|
adipogenesis regulatory factor |
| chr15_+_41786065 | 11.44 |
ENST00000260386.5
|
ITPKA
|
inositol-trisphosphate 3-kinase A |
| chr19_-_33793430 | 11.43 |
ENST00000498907.2
|
CEBPA
|
CCAAT/enhancer binding protein (C/EBP), alpha |
| chr11_+_1889880 | 11.32 |
ENST00000405957.2
|
LSP1
|
lymphocyte-specific protein 1 |
| chr1_+_24969755 | 11.29 |
ENST00000447431.2
ENST00000374389.4 |
SRRM1
|
serine/arginine repetitive matrix 1 |
| chr11_-_111170526 | 11.27 |
ENST00000355430.4
|
COLCA1
|
colorectal cancer associated 1 |
| chr1_-_182360918 | 11.25 |
ENST00000339526.4
|
GLUL
|
glutamate-ammonia ligase |
| chr16_-_75498308 | 11.16 |
ENST00000569540.1
|
TMEM170A
|
transmembrane protein 170A |
| chr19_+_35521572 | 11.08 |
ENST00000262631.5
|
SCN1B
|
sodium channel, voltage-gated, type I, beta subunit |
| chr11_-_2906979 | 11.06 |
ENST00000380725.1
ENST00000313407.6 ENST00000430149.2 ENST00000440480.2 ENST00000414822.3 |
CDKN1C
|
cyclin-dependent kinase inhibitor 1C (p57, Kip2) |
| chr19_-_14016877 | 11.05 |
ENST00000454313.1
ENST00000591586.1 ENST00000346736.2 |
C19orf57
|
chromosome 19 open reading frame 57 |
| chr17_-_5138099 | 11.04 |
ENST00000571800.1
ENST00000574081.1 ENST00000399600.4 ENST00000574297.1 |
SCIMP
|
SLP adaptor and CSK interacting membrane protein |
| chr3_+_14989186 | 10.95 |
ENST00000435454.1
ENST00000323373.6 |
NR2C2
|
nuclear receptor subfamily 2, group C, member 2 |
| chr12_-_51717922 | 10.75 |
ENST00000452142.2
|
BIN2
|
bridging integrator 2 |
| chr6_+_7108210 | 10.63 |
ENST00000467782.1
ENST00000334984.6 ENST00000349384.6 |
RREB1
|
ras responsive element binding protein 1 |
| chr7_+_148959262 | 10.62 |
ENST00000434415.1
|
ZNF783
|
zinc finger family member 783 |
| chr17_+_8339189 | 10.52 |
ENST00000585098.1
ENST00000380025.4 ENST00000402554.3 ENST00000584866.1 ENST00000582490.1 |
NDEL1
|
nudE neurodevelopment protein 1-like 1 |
| chr1_-_111217603 | 10.49 |
ENST00000369769.2
|
KCNA3
|
potassium voltage-gated channel, shaker-related subfamily, member 3 |
| chr19_-_6720686 | 10.43 |
ENST00000245907.6
|
C3
|
complement component 3 |
| chr3_-_169899504 | 10.19 |
ENST00000474275.1
ENST00000484931.1 ENST00000494943.1 ENST00000497658.1 ENST00000465896.1 ENST00000475729.1 ENST00000495893.2 ENST00000481639.1 ENST00000467570.1 ENST00000466189.1 |
PHC3
|
polyhomeotic homolog 3 (Drosophila) |
| chr16_-_30582888 | 10.18 |
ENST00000563707.1
ENST00000567855.1 |
ZNF688
|
zinc finger protein 688 |
| chr16_-_4588469 | 10.12 |
ENST00000588381.1
ENST00000563332.2 |
CDIP1
|
cell death-inducing p53 target 1 |
| chr1_-_153363452 | 10.07 |
ENST00000368732.1
ENST00000368733.3 |
S100A8
|
S100 calcium binding protein A8 |
| chr12_+_124155652 | 10.03 |
ENST00000426174.2
ENST00000303372.5 |
TCTN2
|
tectonic family member 2 |
| chr1_+_233086326 | 10.00 |
ENST00000366628.5
ENST00000366627.4 |
NTPCR
|
nucleoside-triphosphatase, cancer-related |
| chr2_+_10183651 | 10.00 |
ENST00000305883.1
|
KLF11
|
Kruppel-like factor 11 |
| chr19_+_19431490 | 9.99 |
ENST00000392313.6
ENST00000262815.8 ENST00000609122.1 |
MAU2
|
MAU2 sister chromatid cohesion factor |
| chr19_-_37701386 | 9.91 |
ENST00000527838.1
ENST00000591492.1 ENST00000532828.2 |
ZNF585B
|
zinc finger protein 585B |
| chr5_+_176853702 | 9.90 |
ENST00000507633.1
ENST00000393576.3 ENST00000355958.5 ENST00000528793.1 ENST00000512684.1 |
GRK6
|
G protein-coupled receptor kinase 6 |
| chr4_-_8873531 | 9.88 |
ENST00000400677.3
|
HMX1
|
H6 family homeobox 1 |
| chr4_+_76439665 | 9.85 |
ENST00000508105.1
ENST00000311638.3 ENST00000380837.3 ENST00000507556.1 ENST00000504190.1 ENST00000507885.1 ENST00000502620.1 ENST00000514480.1 |
THAP6
|
THAP domain containing 6 |
| chr15_+_91427642 | 9.81 |
ENST00000328850.3
ENST00000414248.2 |
FES
|
feline sarcoma oncogene |
| chr19_+_1205740 | 9.79 |
ENST00000326873.7
|
STK11
|
serine/threonine kinase 11 |
| chr16_+_22825475 | 9.77 |
ENST00000261374.3
|
HS3ST2
|
heparan sulfate (glucosamine) 3-O-sulfotransferase 2 |
| chr6_+_31865552 | 9.75 |
ENST00000469372.1
ENST00000497706.1 |
C2
|
complement component 2 |
| chr20_-_39317868 | 9.74 |
ENST00000373313.2
|
MAFB
|
v-maf avian musculoaponeurotic fibrosarcoma oncogene homolog B |
| chr22_-_51021397 | 9.68 |
ENST00000406938.2
|
CHKB
|
choline kinase beta |
| chr2_-_220110187 | 9.62 |
ENST00000295759.7
ENST00000392089.2 |
GLB1L
|
galactosidase, beta 1-like |
| chr20_+_30639991 | 9.60 |
ENST00000534862.1
ENST00000538448.1 ENST00000375862.2 |
HCK
|
hemopoietic cell kinase |
| chr16_-_70719925 | 9.60 |
ENST00000338779.6
|
MTSS1L
|
metastasis suppressor 1-like |
| chr19_-_49137790 | 9.59 |
ENST00000599385.1
|
DBP
|
D site of albumin promoter (albumin D-box) binding protein |
| chr8_-_132052458 | 9.58 |
ENST00000377928.3
|
ADCY8
|
adenylate cyclase 8 (brain) |
| chr19_+_56915668 | 9.53 |
ENST00000333201.9
ENST00000391778.3 |
ZNF583
|
zinc finger protein 583 |
| chr6_+_31554962 | 9.52 |
ENST00000376092.3
ENST00000376086.3 ENST00000303757.8 ENST00000376093.2 ENST00000376102.3 |
LST1
|
leukocyte specific transcript 1 |
| chr19_+_16435625 | 9.44 |
ENST00000248071.5
ENST00000592003.1 |
KLF2
|
Kruppel-like factor 2 |
| chr4_+_156588350 | 9.44 |
ENST00000296518.7
|
GUCY1A3
|
guanylate cyclase 1, soluble, alpha 3 |
| chr10_-_102790852 | 9.43 |
ENST00000470414.1
ENST00000370215.3 |
PDZD7
|
PDZ domain containing 7 |
| chr3_+_127634312 | 9.42 |
ENST00000407609.3
|
KBTBD12
|
kelch repeat and BTB (POZ) domain containing 12 |
| chr9_-_95432536 | 9.40 |
ENST00000287996.3
|
IPPK
|
inositol 1,3,4,5,6-pentakisphosphate 2-kinase |
| chr5_+_72921983 | 9.40 |
ENST00000296794.6
ENST00000545377.1 ENST00000513042.2 ENST00000287898.5 ENST00000509848.1 |
ARHGEF28
|
Rho guanine nucleotide exchange factor (GEF) 28 |
| chr7_+_150498610 | 9.38 |
ENST00000461345.1
|
TMEM176A
|
transmembrane protein 176A |
| chr1_-_226111929 | 9.36 |
ENST00000343818.6
ENST00000432920.2 |
PYCR2
RP4-559A3.7
|
pyrroline-5-carboxylate reductase family, member 2 Uncharacterized protein |
| chr7_-_149470540 | 9.32 |
ENST00000302017.3
|
ZNF467
|
zinc finger protein 467 |
| chr2_-_160654745 | 9.26 |
ENST00000259053.4
ENST00000429078.2 |
CD302
|
CD302 molecule |
| chr3_+_122044084 | 9.23 |
ENST00000264474.3
ENST00000479204.1 |
CSTA
|
cystatin A (stefin A) |
| chr17_+_41857793 | 9.22 |
ENST00000449302.3
|
C17orf105
|
chromosome 17 open reading frame 105 |
| chr11_+_71791849 | 9.18 |
ENST00000423494.2
ENST00000539587.1 ENST00000538478.1 ENST00000324866.7 ENST00000439209.1 |
LRTOMT
|
leucine rich transmembrane and O-methyltransferase domain containing |
| chr19_-_5340730 | 9.17 |
ENST00000372412.4
ENST00000357368.4 ENST00000262963.6 ENST00000348075.2 ENST00000353284.2 |
PTPRS
|
protein tyrosine phosphatase, receptor type, S |
| chr20_-_3154162 | 9.16 |
ENST00000360342.3
|
LZTS3
|
Homo sapiens leucine zipper, putative tumor suppressor family member 3 (LZTS3), mRNA. |
| chr4_-_186125077 | 9.16 |
ENST00000458385.2
ENST00000514798.1 ENST00000296775.6 |
KIAA1430
|
KIAA1430 |
| chr12_+_112204691 | 9.09 |
ENST00000416293.3
ENST00000261733.2 |
ALDH2
|
aldehyde dehydrogenase 2 family (mitochondrial) |
| chr9_+_115913222 | 9.08 |
ENST00000259392.3
|
SLC31A2
|
solute carrier family 31 (copper transporter), member 2 |
| chr8_-_56685859 | 9.07 |
ENST00000523423.1
ENST00000523073.1 ENST00000519784.1 ENST00000434581.2 ENST00000519780.1 ENST00000521229.1 ENST00000522576.1 ENST00000523180.1 ENST00000522090.1 |
TMEM68
|
transmembrane protein 68 |
| chr12_+_10366016 | 9.06 |
ENST00000546017.1
ENST00000535576.1 ENST00000539170.1 |
GABARAPL1
|
GABA(A) receptor-associated protein like 1 |
| chr1_-_27961720 | 9.05 |
ENST00000545953.1
ENST00000374005.3 |
FGR
|
feline Gardner-Rasheed sarcoma viral oncogene homolog |
| chr19_+_8455200 | 9.05 |
ENST00000601897.1
ENST00000594216.1 |
RAB11B
|
RAB11B, member RAS oncogene family |
| chr16_+_58283814 | 8.95 |
ENST00000443128.2
ENST00000219299.4 |
CCDC113
|
coiled-coil domain containing 113 |
| chr2_-_206950781 | 8.91 |
ENST00000403263.1
|
INO80D
|
INO80 complex subunit D |
| chr1_-_113615699 | 8.89 |
ENST00000421157.1
|
RP11-31F15.2
|
RP11-31F15.2 |
| chr7_-_150038704 | 8.80 |
ENST00000466675.1
ENST00000482669.1 ENST00000467793.1 ENST00000223271.3 |
RARRES2
|
retinoic acid receptor responder (tazarotene induced) 2 |
| chr12_+_52301175 | 8.77 |
ENST00000388922.4
|
ACVRL1
|
activin A receptor type II-like 1 |
| chr14_+_95078714 | 8.75 |
ENST00000393078.3
ENST00000393080.4 ENST00000467132.1 |
SERPINA3
|
serpin peptidase inhibitor, clade A (alpha-1 antiproteinase, antitrypsin), member 3 |
| chr20_-_48532019 | 8.74 |
ENST00000289431.5
|
SPATA2
|
spermatogenesis associated 2 |
| chr3_+_183903811 | 8.74 |
ENST00000429586.2
ENST00000292808.5 |
ABCF3
|
ATP-binding cassette, sub-family F (GCN20), member 3 |
| chr11_-_133826852 | 8.72 |
ENST00000533871.2
ENST00000321016.8 |
IGSF9B
|
immunoglobulin superfamily, member 9B |
| chr3_-_50540854 | 8.70 |
ENST00000423994.2
ENST00000424201.2 ENST00000479441.1 ENST00000429770.1 |
CACNA2D2
|
calcium channel, voltage-dependent, alpha 2/delta subunit 2 |
| chr21_-_46340884 | 8.69 |
ENST00000302347.5
ENST00000517819.1 |
ITGB2
|
integrin, beta 2 (complement component 3 receptor 3 and 4 subunit) |
| chr18_-_56940611 | 8.69 |
ENST00000256852.7
ENST00000334889.3 |
RAX
|
retina and anterior neural fold homeobox |
| chr11_-_47400078 | 8.69 |
ENST00000378538.3
|
SPI1
|
spleen focus forming virus (SFFV) proviral integration oncogene |
| chr7_+_139478030 | 8.62 |
ENST00000425687.1
ENST00000263552.6 ENST00000438104.1 ENST00000336425.5 |
TBXAS1
|
thromboxane A synthase 1 (platelet) |
| chr17_-_18218237 | 8.60 |
ENST00000542570.1
|
TOP3A
|
topoisomerase (DNA) III alpha |
| chr9_-_136857403 | 8.59 |
ENST00000406606.3
ENST00000371850.3 |
VAV2
|
vav 2 guanine nucleotide exchange factor |
| chr20_+_34043085 | 8.49 |
ENST00000397527.1
ENST00000342580.4 |
CEP250
|
centrosomal protein 250kDa |
| chr7_-_130080818 | 8.43 |
ENST00000343969.5
ENST00000541543.1 ENST00000489512.1 |
CEP41
|
centrosomal protein 41kDa |
| chr12_-_51717948 | 8.43 |
ENST00000267012.4
|
BIN2
|
bridging integrator 2 |
| chr1_+_9599540 | 8.41 |
ENST00000302692.6
|
SLC25A33
|
solute carrier family 25 (pyrimidine nucleotide carrier), member 33 |
| chr20_-_4804244 | 8.38 |
ENST00000379400.3
|
RASSF2
|
Ras association (RalGDS/AF-6) domain family member 2 |
| chr7_-_149470297 | 8.36 |
ENST00000484747.1
|
ZNF467
|
zinc finger protein 467 |
| chr20_-_62710832 | 8.36 |
ENST00000395042.1
|
RGS19
|
regulator of G-protein signaling 19 |
| chr1_+_27561007 | 8.35 |
ENST00000319394.3
|
WDTC1
|
WD and tetratricopeptide repeats 1 |
| chr8_+_142138711 | 8.28 |
ENST00000518347.1
ENST00000262585.2 ENST00000424248.1 ENST00000519811.1 ENST00000520986.1 ENST00000523058.1 |
DENND3
|
DENN/MADD domain containing 3 |
| chr8_-_110704014 | 8.26 |
ENST00000529190.1
ENST00000422135.1 ENST00000419099.1 |
SYBU
|
syntabulin (syntaxin-interacting) |
| chr16_+_85061367 | 8.20 |
ENST00000538274.1
ENST00000258180.3 |
KIAA0513
|
KIAA0513 |
| chr12_+_70760056 | 8.14 |
ENST00000258111.4
|
KCNMB4
|
potassium large conductance calcium-activated channel, subfamily M, beta member 4 |
| chr22_-_19512893 | 8.11 |
ENST00000403084.1
ENST00000413119.2 |
CLDN5
|
claudin 5 |
| chr19_-_38720294 | 8.03 |
ENST00000412732.1
ENST00000456296.1 |
DPF1
|
D4, zinc and double PHD fingers family 1 |
| chr5_-_178772424 | 7.95 |
ENST00000251582.7
ENST00000274609.5 |
ADAMTS2
|
ADAM metallopeptidase with thrombospondin type 1 motif, 2 |
| chr1_-_182360498 | 7.93 |
ENST00000417584.2
|
GLUL
|
glutamate-ammonia ligase |
| chr17_-_18585541 | 7.92 |
ENST00000285274.5
ENST00000545289.1 ENST00000580145.1 |
ZNF286B
|
zinc finger protein 286B |
| chr21_-_36260980 | 7.90 |
ENST00000344691.4
ENST00000358356.5 |
RUNX1
|
runt-related transcription factor 1 |
| chr10_+_49514698 | 7.89 |
ENST00000432379.1
ENST00000429041.1 ENST00000374189.1 |
MAPK8
|
mitogen-activated protein kinase 8 |
| chr19_-_39264072 | 7.89 |
ENST00000599035.1
ENST00000378626.4 |
LGALS7
|
lectin, galactoside-binding, soluble, 7 |
| chr19_+_39833036 | 7.87 |
ENST00000602243.1
ENST00000598913.1 ENST00000314471.6 |
SAMD4B
|
sterile alpha motif domain containing 4B |
| chr4_+_156588806 | 7.86 |
ENST00000513574.1
|
GUCY1A3
|
guanylate cyclase 1, soluble, alpha 3 |
| chr4_-_57522673 | 7.84 |
ENST00000381255.3
ENST00000317745.7 ENST00000555760.2 ENST00000556614.2 |
HOPX
|
HOP homeobox |
| chr1_+_25944341 | 7.79 |
ENST00000263979.3
|
MAN1C1
|
mannosidase, alpha, class 1C, member 1 |
| chr2_-_208489707 | 7.77 |
ENST00000448007.2
ENST00000432416.1 ENST00000411432.1 |
METTL21A
|
methyltransferase like 21A |
| chr3_+_9834758 | 7.75 |
ENST00000485273.1
ENST00000433034.1 ENST00000397256.1 |
ARPC4
ARPC4-TTLL3
|
actin related protein 2/3 complex, subunit 4, 20kDa ARPC4-TTLL3 readthrough |
| chr20_+_34042962 | 7.74 |
ENST00000446710.1
ENST00000420564.1 |
CEP250
|
centrosomal protein 250kDa |
| chr8_-_56685966 | 7.69 |
ENST00000334667.2
|
TMEM68
|
transmembrane protein 68 |
| chr18_+_77160282 | 7.68 |
ENST00000318065.5
ENST00000545796.1 ENST00000592223.1 ENST00000329101.4 ENST00000586434.1 |
NFATC1
|
nuclear factor of activated T-cells, cytoplasmic, calcineurin-dependent 1 |
| chr4_-_5894777 | 7.67 |
ENST00000324989.7
|
CRMP1
|
collapsin response mediator protein 1 |
| chr17_-_74137374 | 7.66 |
ENST00000322957.6
|
FOXJ1
|
forkhead box J1 |
| chr14_-_23834411 | 7.64 |
ENST00000429593.2
|
EFS
|
embryonal Fyn-associated substrate |
| chr19_+_50706866 | 7.63 |
ENST00000440075.2
ENST00000376970.2 ENST00000425460.1 ENST00000599920.1 ENST00000601313.1 |
MYH14
|
myosin, heavy chain 14, non-muscle |
| chr15_+_68871308 | 7.63 |
ENST00000261861.5
|
CORO2B
|
coronin, actin binding protein, 2B |
| chr8_-_41754231 | 7.60 |
ENST00000265709.8
|
ANK1
|
ankyrin 1, erythrocytic |
| chr19_+_45973120 | 7.59 |
ENST00000592811.1
ENST00000586615.1 |
FOSB
|
FBJ murine osteosarcoma viral oncogene homolog B |
| chr20_+_42143053 | 7.58 |
ENST00000373135.3
ENST00000444063.1 |
L3MBTL1
|
l(3)mbt-like 1 (Drosophila) |
| chr16_-_55866997 | 7.57 |
ENST00000360526.3
ENST00000361503.4 |
CES1
|
carboxylesterase 1 |
| chr17_-_43138463 | 7.57 |
ENST00000310604.4
|
DCAKD
|
dephospho-CoA kinase domain containing |
| chr12_-_14721283 | 7.55 |
ENST00000240617.5
|
PLBD1
|
phospholipase B domain containing 1 |
| chr7_+_150498783 | 7.51 |
ENST00000475536.1
ENST00000468689.1 |
TMEM176A
|
transmembrane protein 176A |
| chr1_-_156217829 | 7.50 |
ENST00000356983.2
ENST00000335852.1 ENST00000340183.5 ENST00000540423.1 |
PAQR6
|
progestin and adipoQ receptor family member VI |
| chr10_+_124768482 | 7.48 |
ENST00000368869.4
ENST00000358776.4 |
ACADSB
|
acyl-CoA dehydrogenase, short/branched chain |
| chr19_-_13213662 | 7.47 |
ENST00000264824.4
|
LYL1
|
lymphoblastic leukemia derived sequence 1 |
| chr6_-_74161977 | 7.47 |
ENST00000370318.1
ENST00000370315.3 |
MB21D1
|
Mab-21 domain containing 1 |
| chr11_+_17756279 | 7.46 |
ENST00000265969.6
|
KCNC1
|
potassium voltage-gated channel, Shaw-related subfamily, member 1 |
| chr6_+_83903061 | 7.44 |
ENST00000369724.4
ENST00000539997.1 |
RWDD2A
|
RWD domain containing 2A |
| chr1_+_207627575 | 7.44 |
ENST00000367058.3
ENST00000367057.3 ENST00000367059.3 |
CR2
|
complement component (3d/Epstein Barr virus) receptor 2 |
| chr19_-_49137762 | 7.36 |
ENST00000593500.1
|
DBP
|
D site of albumin promoter (albumin D-box) binding protein |
| chr11_-_18034701 | 7.36 |
ENST00000265965.5
|
SERGEF
|
secretion regulating guanine nucleotide exchange factor |
| chr17_-_43568062 | 7.35 |
ENST00000421073.2
ENST00000584420.1 ENST00000589780.1 ENST00000430334.3 |
PLEKHM1
|
pleckstrin homology domain containing, family M (with RUN domain) member 1 |
| chr11_+_9595180 | 7.31 |
ENST00000450114.2
|
WEE1
|
WEE1 G2 checkpoint kinase |
| chr9_+_71939488 | 7.31 |
ENST00000455972.1
|
FAM189A2
|
family with sequence similarity 189, member A2 |
| chr17_-_42402138 | 7.30 |
ENST00000592857.1
ENST00000586016.1 ENST00000590194.1 ENST00000377095.5 ENST00000588049.1 ENST00000586633.1 ENST00000537904.2 ENST00000585636.1 ENST00000585523.1 ENST00000225308.8 |
SLC25A39
|
solute carrier family 25, member 39 |
| chr2_-_220110111 | 7.30 |
ENST00000428427.1
ENST00000356283.3 ENST00000432839.1 ENST00000424620.1 |
GLB1L
|
galactosidase, beta 1-like |
| chr15_-_45670924 | 7.28 |
ENST00000396659.3
|
GATM
|
glycine amidinotransferase (L-arginine:glycine amidinotransferase) |
| chr3_+_141121164 | 7.26 |
ENST00000510338.1
ENST00000504673.1 |
ZBTB38
|
zinc finger and BTB domain containing 38 |
| chr3_+_101568349 | 7.25 |
ENST00000326151.5
ENST00000326172.5 |
NFKBIZ
|
nuclear factor of kappa light polypeptide gene enhancer in B-cells inhibitor, zeta |
| chr4_-_57522598 | 7.22 |
ENST00000553379.2
|
HOPX
|
HOP homeobox |
| chr3_-_10749696 | 7.21 |
ENST00000397077.1
|
ATP2B2
|
ATPase, Ca++ transporting, plasma membrane 2 |
| chr1_-_113392399 | 7.20 |
ENST00000449572.2
ENST00000433505.1 |
RP11-426L16.8
|
RP11-426L16.8 |
| chr15_+_69222827 | 7.17 |
ENST00000310673.3
ENST00000448182.3 ENST00000260364.5 |
SPESP1
NOX5
|
sperm equatorial segment protein 1 NADPH oxidase, EF-hand calcium binding domain 5 |
| chr14_-_106330072 | 7.17 |
ENST00000488476.1
|
IGHJ5
|
immunoglobulin heavy joining 5 |
| chr19_+_53836985 | 7.16 |
ENST00000601857.1
ENST00000595091.1 ENST00000458035.1 |
ZNF845
|
zinc finger protein 845 |
| chr12_-_6798410 | 7.15 |
ENST00000361959.3
ENST00000436774.2 ENST00000544482.1 |
ZNF384
|
zinc finger protein 384 |
| chr7_-_150498426 | 7.14 |
ENST00000447204.2
|
TMEM176B
|
transmembrane protein 176B |
| chr18_+_2846972 | 7.12 |
ENST00000254528.3
|
EMILIN2
|
elastin microfibril interfacer 2 |
| chr4_-_2264015 | 7.11 |
ENST00000337190.2
|
MXD4
|
MAX dimerization protein 4 |
| chr1_+_207627697 | 7.10 |
ENST00000458541.2
|
CR2
|
complement component (3d/Epstein Barr virus) receptor 2 |
| chr11_-_47400062 | 7.10 |
ENST00000533030.1
|
SPI1
|
spleen focus forming virus (SFFV) proviral integration oncogene |
| chr1_+_22979676 | 7.09 |
ENST00000432749.2
ENST00000314933.6 |
C1QB
|
complement component 1, q subcomponent, B chain |
| chr6_+_31555045 | 7.05 |
ENST00000396101.3
ENST00000490742.1 |
LST1
|
leukocyte specific transcript 1 |
| chr11_+_64692143 | 7.02 |
ENST00000164133.2
ENST00000532850.1 |
PPP2R5B
|
protein phosphatase 2, regulatory subunit B', beta |
| chrX_-_153236819 | 7.00 |
ENST00000354233.3
|
HCFC1
|
host cell factor C1 (VP16-accessory protein) |
| chr19_+_18942761 | 6.99 |
ENST00000599848.1
|
UPF1
|
UPF1 regulator of nonsense transcripts homolog (yeast) |
| chr19_+_56186606 | 6.98 |
ENST00000085079.7
|
EPN1
|
epsin 1 |
| chr1_-_156217822 | 6.97 |
ENST00000368270.1
|
PAQR6
|
progestin and adipoQ receptor family member VI |
| chr1_-_156217875 | 6.97 |
ENST00000292291.5
|
PAQR6
|
progestin and adipoQ receptor family member VI |
| chr17_-_18218270 | 6.94 |
ENST00000321105.5
|
TOP3A
|
topoisomerase (DNA) III alpha |
| chr19_-_11373128 | 6.94 |
ENST00000294618.7
|
DOCK6
|
dedicator of cytokinesis 6 |
| chr1_-_11866034 | 6.93 |
ENST00000376590.3
|
MTHFR
|
methylenetetrahydrofolate reductase (NAD(P)H) |
| chr17_+_77751931 | 6.92 |
ENST00000310942.4
ENST00000269399.5 |
CBX2
|
chromobox homolog 2 |
| chr1_-_36948879 | 6.91 |
ENST00000373106.1
ENST00000373104.1 ENST00000373103.1 |
CSF3R
|
colony stimulating factor 3 receptor (granulocyte) |
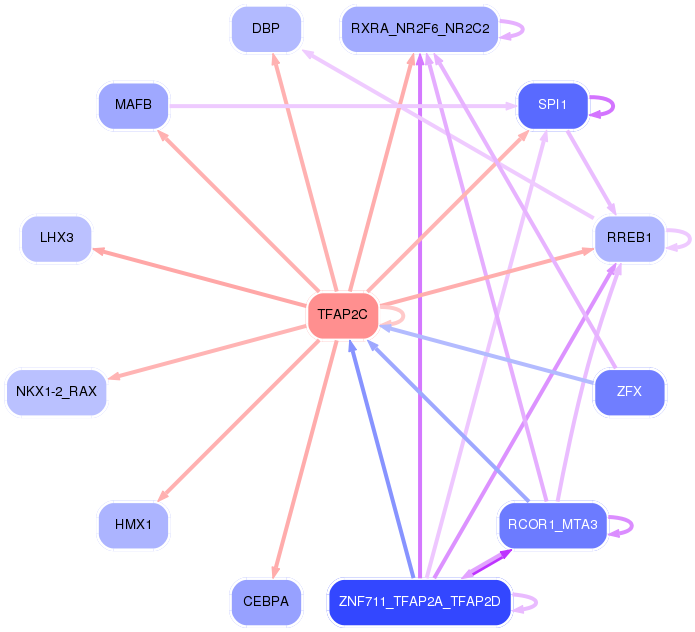
Network of associatons between targets according to the STRING database.

First level regulatory network of TFAP2C
Gene Ontology Analysis
Gene overrepresentation in biological_process category:
| Log-likelihood per target | Total log-likelihood | Term | Description |
|---|---|---|---|
| 6.0 | 17.9 | GO:0070940 | dephosphorylation of RNA polymerase II C-terminal domain(GO:0070940) |
| 6.0 | 17.9 | GO:0021966 | corticospinal neuron axon guidance(GO:0021966) |
| 5.7 | 5.7 | GO:1902361 | mitochondrial pyruvate transport(GO:0006850) mitochondrial pyruvate transmembrane transport(GO:1902361) |
| 5.1 | 20.4 | GO:0044027 | hypermethylation of CpG island(GO:0044027) |
| 4.8 | 19.2 | GO:0006542 | glutamine biosynthetic process(GO:0006542) |
| 4.6 | 13.9 | GO:0043012 | regulation of fusion of sperm to egg plasma membrane(GO:0043012) |
| 4.3 | 13.0 | GO:0033212 | iron assimilation(GO:0033212) iron assimilation by chelation and transport(GO:0033214) positive regulation of bone mineralization involved in bone maturation(GO:1900159) negative regulation of tumor necrosis factor (ligand) superfamily member 11 production(GO:2000308) |
| 4.3 | 12.9 | GO:1990922 | regulation of hepatic stellate cell proliferation(GO:1904897) positive regulation of hepatic stellate cell proliferation(GO:1904899) hepatic stellate cell proliferation(GO:1990922) |
| 4.3 | 25.5 | GO:0052565 | response to defense-related nitric oxide production by other organism involved in symbiotic interaction(GO:0052551) response to defense-related host nitric oxide production(GO:0052565) |
| 4.1 | 12.2 | GO:0002522 | leukocyte migration involved in immune response(GO:0002522) |
| 4.0 | 15.8 | GO:0018094 | protein polyglycylation(GO:0018094) |
| 3.9 | 11.6 | GO:0000294 | nuclear-transcribed mRNA catabolic process, endonucleolytic cleavage-dependent decay(GO:0000294) |
| 3.8 | 22.9 | GO:0021523 | somatic motor neuron differentiation(GO:0021523) |
| 3.8 | 15.1 | GO:0097676 | histone H3-K36 dimethylation(GO:0097676) |
| 3.8 | 15.1 | GO:0010900 | negative regulation of phosphatidylcholine catabolic process(GO:0010900) |
| 3.5 | 3.5 | GO:0061153 | trachea submucosa development(GO:0061152) trachea gland development(GO:0061153) |
| 3.5 | 10.4 | GO:0002894 | positive regulation of type IIa hypersensitivity(GO:0001798) positive regulation of type II hypersensitivity(GO:0002894) |
| 3.4 | 13.5 | GO:1903691 | positive regulation of wound healing, spreading of epidermal cells(GO:1903691) |
| 3.3 | 13.0 | GO:0014807 | regulation of somitogenesis(GO:0014807) |
| 3.2 | 9.7 | GO:0035284 | rhombomere 5 development(GO:0021571) central nervous system segmentation(GO:0035283) brain segmentation(GO:0035284) |
| 3.2 | 12.9 | GO:0070662 | mast cell proliferation(GO:0070662) |
| 3.1 | 9.4 | GO:0071409 | cellular response to cycloheximide(GO:0071409) |
| 3.1 | 31.2 | GO:0060052 | neurofilament cytoskeleton organization(GO:0060052) |
| 3.1 | 9.2 | GO:0032687 | negative regulation of interferon-alpha production(GO:0032687) |
| 3.0 | 11.9 | GO:0019046 | release from viral latency(GO:0019046) |
| 2.9 | 8.8 | GO:0061760 | antifungal innate immune response(GO:0061760) |
| 2.9 | 11.7 | GO:0006203 | dGTP catabolic process(GO:0006203) |
| 2.8 | 17.1 | GO:2000418 | positive regulation of eosinophil migration(GO:2000418) |
| 2.7 | 16.4 | GO:0010732 | protein glutathionylation(GO:0010731) regulation of protein glutathionylation(GO:0010732) negative regulation of protein glutathionylation(GO:0010734) |
| 2.7 | 13.7 | GO:1900454 | positive regulation of long term synaptic depression(GO:1900454) |
| 2.7 | 8.1 | GO:0071288 | cellular response to mercury ion(GO:0071288) |
| 2.7 | 8.0 | GO:0030718 | germ-line stem cell population maintenance(GO:0030718) |
| 2.7 | 16.0 | GO:0003056 | regulation of vascular smooth muscle contraction(GO:0003056) |
| 2.6 | 7.9 | GO:1902595 | regulation of DNA replication origin binding(GO:1902595) |
| 2.6 | 10.4 | GO:0033123 | positive regulation of cyclic nucleotide catabolic process(GO:0030807) positive regulation of cAMP catabolic process(GO:0030822) positive regulation of purine nucleotide catabolic process(GO:0033123) |
| 2.6 | 7.7 | GO:1904530 | negative regulation of actin filament binding(GO:1904530) negative regulation of actin binding(GO:1904617) |
| 2.6 | 7.7 | GO:0002661 | B cell tolerance induction(GO:0002514) regulation of B cell tolerance induction(GO:0002661) positive regulation of B cell tolerance induction(GO:0002663) |
| 2.5 | 5.0 | GO:0016080 | synaptic vesicle targeting(GO:0016080) |
| 2.5 | 7.5 | GO:1900104 | hyaluranon cable assembly(GO:0036118) regulation of hyaluranon cable assembly(GO:1900104) positive regulation of hyaluranon cable assembly(GO:1900106) |
| 2.5 | 17.3 | GO:0042670 | retinal cone cell differentiation(GO:0042670) retinal cone cell development(GO:0046549) |
| 2.5 | 12.3 | GO:0060024 | rhythmic synaptic transmission(GO:0060024) |
| 2.3 | 18.8 | GO:2001023 | regulation of response to drug(GO:2001023) |
| 2.3 | 9.3 | GO:0003335 | corneocyte development(GO:0003335) |
| 2.3 | 43.6 | GO:0002523 | leukocyte migration involved in inflammatory response(GO:0002523) |
| 2.3 | 2.3 | GO:0042560 | folic acid-containing compound catabolic process(GO:0009397) pteridine-containing compound catabolic process(GO:0042560) |
| 2.3 | 13.6 | GO:0046208 | spermine catabolic process(GO:0046208) |
| 2.3 | 6.8 | GO:1902809 | skeletal muscle fiber differentiation(GO:0098528) regulation of skeletal muscle fiber differentiation(GO:1902809) |
| 2.2 | 6.7 | GO:0008355 | olfactory learning(GO:0008355) |
| 2.2 | 6.6 | GO:1900075 | regulation of neuromuscular synaptic transmission(GO:1900073) positive regulation of neuromuscular synaptic transmission(GO:1900075) |
| 2.2 | 8.7 | GO:0033277 | abortive mitotic cell cycle(GO:0033277) |
| 2.2 | 6.5 | GO:0015670 | carbon dioxide transport(GO:0015670) |
| 2.1 | 2.1 | GO:0033025 | mast cell homeostasis(GO:0033023) mast cell apoptotic process(GO:0033024) regulation of mast cell apoptotic process(GO:0033025) |
| 2.1 | 19.1 | GO:0035583 | sequestering of TGFbeta in extracellular matrix(GO:0035583) |
| 2.1 | 4.2 | GO:0035606 | peptidyl-cysteine S-trans-nitrosylation(GO:0035606) |
| 2.1 | 8.2 | GO:0000023 | maltose metabolic process(GO:0000023) |
| 2.0 | 8.2 | GO:0042412 | taurine biosynthetic process(GO:0042412) |
| 2.0 | 6.1 | GO:0061534 | gamma-aminobutyric acid secretion, neurotransmission(GO:0061534) |
| 2.0 | 16.1 | GO:1901552 | positive regulation of endothelial cell development(GO:1901552) positive regulation of establishment of endothelial barrier(GO:1903142) |
| 2.0 | 24.0 | GO:2001199 | negative regulation of dendritic cell differentiation(GO:2001199) |
| 2.0 | 6.0 | GO:1904627 | response to phorbol 13-acetate 12-myristate(GO:1904627) cellular response to phorbol 13-acetate 12-myristate(GO:1904628) |
| 2.0 | 2.0 | GO:0030539 | male genitalia development(GO:0030539) |
| 2.0 | 5.9 | GO:1900369 | transcription, RNA-templated(GO:0001172) regulation of RNA interference(GO:1900368) negative regulation of RNA interference(GO:1900369) positive regulation of protein localization to nucleolus(GO:1904751) |
| 2.0 | 9.8 | GO:2001106 | regulation of Rho guanyl-nucleotide exchange factor activity(GO:2001106) |
| 1.9 | 21.4 | GO:0045945 | positive regulation of transcription from RNA polymerase III promoter(GO:0045945) |
| 1.9 | 9.7 | GO:0031580 | membrane raft polarization(GO:0001766) membrane raft distribution(GO:0031580) |
| 1.9 | 1.9 | GO:0036089 | cleavage furrow formation(GO:0036089) |
| 1.9 | 5.8 | GO:0070213 | protein auto-ADP-ribosylation(GO:0070213) |
| 1.9 | 7.7 | GO:1905071 | proepicardium development(GO:0003342) septum transversum development(GO:0003343) occluding junction disassembly(GO:1905071) regulation of occluding junction disassembly(GO:1905073) positive regulation of occluding junction disassembly(GO:1905075) |
| 1.9 | 17.3 | GO:0001955 | blood vessel maturation(GO:0001955) |
| 1.9 | 7.7 | GO:0019086 | late viral transcription(GO:0019086) |
| 1.9 | 5.7 | GO:0007518 | myoblast fate determination(GO:0007518) |
| 1.9 | 5.7 | GO:0070781 | response to biotin(GO:0070781) |
| 1.9 | 11.3 | GO:0070560 | protein secretion by platelet(GO:0070560) |
| 1.9 | 5.7 | GO:0098758 | response to interleukin-8(GO:0098758) cellular response to interleukin-8(GO:0098759) |
| 1.9 | 31.8 | GO:2000251 | positive regulation of actin cytoskeleton reorganization(GO:2000251) |
| 1.9 | 16.8 | GO:1904781 | positive regulation of protein localization to centrosome(GO:1904781) |
| 1.9 | 5.6 | GO:0033861 | negative regulation of NAD(P)H oxidase activity(GO:0033861) |
| 1.9 | 9.3 | GO:0006398 | mRNA 3'-end processing by stem-loop binding and cleavage(GO:0006398) |
| 1.9 | 7.4 | GO:1903208 | neuron death in response to hydrogen peroxide(GO:0036476) regulation of hydrogen peroxide-induced neuron death(GO:1903207) negative regulation of hydrogen peroxide-induced neuron death(GO:1903208) |
| 1.8 | 5.5 | GO:0051037 | histone displacement(GO:0001207) regulation of transcription involved in meiotic cell cycle(GO:0051037) positive regulation of transcription involved in meiotic cell cycle(GO:0051039) |
| 1.8 | 5.5 | GO:0031630 | regulation of synaptic vesicle fusion to presynaptic membrane(GO:0031630) |
| 1.8 | 5.5 | GO:0072137 | condensed mesenchymal cell proliferation(GO:0072137) |
| 1.8 | 5.4 | GO:1903526 | negative regulation of membrane tubulation(GO:1903526) |
| 1.8 | 5.4 | GO:0019072 | viral genome packaging(GO:0019072) viral RNA genome packaging(GO:0019074) |
| 1.8 | 5.3 | GO:0007497 | posterior midgut development(GO:0007497) |
| 1.8 | 3.5 | GO:0071279 | cellular response to cobalt ion(GO:0071279) |
| 1.8 | 1.8 | GO:0051586 | positive regulation of neurotransmitter uptake(GO:0051582) positive regulation of dopamine uptake involved in synaptic transmission(GO:0051586) positive regulation of catecholamine uptake involved in synaptic transmission(GO:0051944) |
| 1.8 | 7.0 | GO:0070317 | negative regulation of G0 to G1 transition(GO:0070317) |
| 1.7 | 7.0 | GO:0070257 | positive regulation of mucus secretion(GO:0070257) |
| 1.7 | 6.9 | GO:0002884 | regulation of type IV hypersensitivity(GO:0001807) negative regulation of hypersensitivity(GO:0002884) |
| 1.7 | 10.3 | GO:0050910 | detection of mechanical stimulus involved in sensory perception of sound(GO:0050910) |
| 1.7 | 12.1 | GO:0000160 | phosphorelay signal transduction system(GO:0000160) |
| 1.7 | 5.2 | GO:1990523 | negative regulation of neuromuscular junction development(GO:1904397) bone regeneration(GO:1990523) |
| 1.7 | 12.0 | GO:1902174 | positive regulation of keratinocyte apoptotic process(GO:1902174) |
| 1.7 | 13.3 | GO:0060770 | negative regulation of epithelial cell proliferation involved in prostate gland development(GO:0060770) |
| 1.7 | 10.0 | GO:0031022 | nuclear migration along microfilament(GO:0031022) |
| 1.7 | 3.3 | GO:0061010 | gall bladder development(GO:0061010) |
| 1.6 | 8.2 | GO:0032898 | neurotrophin production(GO:0032898) |
| 1.6 | 4.8 | GO:1990168 | protein K33-linked deubiquitination(GO:1990168) |
| 1.6 | 1.6 | GO:1901660 | calcium ion export(GO:1901660) calcium ion export from cell(GO:1990034) |
| 1.6 | 11.1 | GO:1903977 | positive regulation of glial cell migration(GO:1903977) |
| 1.6 | 4.7 | GO:0060168 | positive regulation of adenosine receptor signaling pathway(GO:0060168) |
| 1.6 | 11.1 | GO:1902746 | regulation of lens fiber cell differentiation(GO:1902746) |
| 1.6 | 4.7 | GO:0042137 | sequestering of neurotransmitter(GO:0042137) |
| 1.6 | 9.4 | GO:0006561 | proline biosynthetic process(GO:0006561) L-proline biosynthetic process(GO:0055129) |
| 1.5 | 4.6 | GO:0060667 | fibroblast growth factor receptor signaling pathway involved in negative regulation of apoptotic process in bone marrow(GO:0035602) fibroblast growth factor receptor signaling pathway involved in hemopoiesis(GO:0035603) fibroblast growth factor receptor signaling pathway involved in positive regulation of cell proliferation in bone marrow(GO:0035604) fibroblast growth factor receptor signaling pathway involved in mammary gland specification(GO:0060595) mammary gland bud formation(GO:0060615) branch elongation involved in salivary gland morphogenesis(GO:0060667) mesenchymal cell differentiation involved in lung development(GO:0060915) |
| 1.5 | 6.1 | GO:0021891 | olfactory bulb interneuron development(GO:0021891) |
| 1.5 | 7.7 | GO:0018101 | protein citrullination(GO:0018101) histone citrullination(GO:0036414) |
| 1.5 | 3.0 | GO:1900107 | regulation of nodal signaling pathway(GO:1900107) |
| 1.5 | 4.5 | GO:2000301 | negative regulation of synaptic vesicle exocytosis(GO:2000301) |
| 1.5 | 9.0 | GO:0051005 | negative regulation of lipoprotein lipase activity(GO:0051005) |
| 1.5 | 4.5 | GO:0019482 | beta-alanine metabolic process(GO:0019482) |
| 1.5 | 10.4 | GO:1903715 | regulation of aerobic respiration(GO:1903715) |
| 1.5 | 6.0 | GO:0003130 | BMP signaling pathway involved in heart induction(GO:0003130) endodermal-mesodermal cell signaling(GO:0003133) endodermal-mesodermal cell signaling involved in heart induction(GO:0003134) |
| 1.5 | 11.9 | GO:2000766 | negative regulation of cytoplasmic translation(GO:2000766) |
| 1.5 | 26.6 | GO:0097320 | membrane tubulation(GO:0097320) |
| 1.5 | 4.4 | GO:0043105 | regulation of GTP cyclohydrolase I activity(GO:0043095) negative regulation of GTP cyclohydrolase I activity(GO:0043105) |
| 1.5 | 8.8 | GO:0010519 | negative regulation of phospholipase activity(GO:0010519) |
| 1.5 | 10.2 | GO:0097396 | response to interleukin-17(GO:0097396) cellular response to interleukin-17(GO:0097398) |
| 1.5 | 4.4 | GO:0002731 | negative regulation of dendritic cell cytokine production(GO:0002731) |
| 1.5 | 2.9 | GO:0048619 | embryonic hindgut morphogenesis(GO:0048619) |
| 1.5 | 7.3 | GO:0001315 | age-dependent response to oxidative stress(GO:0001306) age-dependent response to reactive oxygen species(GO:0001315) regulation of systemic arterial blood pressure by acetylcholine(GO:0003068) vasodilation by acetylcholine involved in regulation of systemic arterial blood pressure(GO:0003069) regulation of systemic arterial blood pressure by neurotransmitter(GO:0003070) age-dependent general metabolic decline(GO:0007571) |
| 1.4 | 17.4 | GO:1901223 | negative regulation of NIK/NF-kappaB signaling(GO:1901223) |
| 1.4 | 5.7 | GO:0060022 | hard palate development(GO:0060022) |
| 1.4 | 8.6 | GO:0061518 | macrophage proliferation(GO:0061517) microglial cell proliferation(GO:0061518) regulation of neuronal signal transduction(GO:1902847) positive regulation of neurofibrillary tangle assembly(GO:1902998) |
| 1.4 | 2.9 | GO:2000182 | regulation of progesterone biosynthetic process(GO:2000182) |
| 1.4 | 4.3 | GO:2000342 | negative regulation of chemokine (C-X-C motif) ligand 2 production(GO:2000342) |
| 1.4 | 1.4 | GO:0070309 | lens fiber cell morphogenesis(GO:0070309) |
| 1.4 | 9.9 | GO:0006526 | arginine biosynthetic process(GO:0006526) |
| 1.4 | 8.5 | GO:0035609 | C-terminal protein deglutamylation(GO:0035609) |
| 1.4 | 8.4 | GO:0018095 | protein polyglutamylation(GO:0018095) |
| 1.4 | 2.8 | GO:0002384 | hepatic immune response(GO:0002384) |
| 1.4 | 5.6 | GO:0042335 | cuticle development(GO:0042335) |
| 1.4 | 6.9 | GO:0033274 | response to vitamin B2(GO:0033274) heterochromatin maintenance(GO:0070829) |
| 1.4 | 6.9 | GO:0021759 | globus pallidus development(GO:0021759) |
| 1.4 | 4.1 | GO:0034146 | toll-like receptor 5 signaling pathway(GO:0034146) |
| 1.4 | 12.4 | GO:0045054 | constitutive secretory pathway(GO:0045054) |
| 1.4 | 6.8 | GO:0071422 | succinate transport(GO:0015744) succinate transmembrane transport(GO:0071422) |
| 1.4 | 9.5 | GO:0039663 | fusion of virus membrane with host plasma membrane(GO:0019064) membrane fusion involved in viral entry into host cell(GO:0039663) multi-organism membrane fusion(GO:0044800) |
| 1.4 | 5.4 | GO:0002537 | nitric oxide production involved in inflammatory response(GO:0002537) |
| 1.4 | 5.4 | GO:0035021 | negative regulation of Rac protein signal transduction(GO:0035021) |
| 1.3 | 2.7 | GO:0060214 | endocardium formation(GO:0060214) |
| 1.3 | 4.0 | GO:0071529 | cementum mineralization(GO:0071529) |
| 1.3 | 1.3 | GO:0038107 | determination of left/right asymmetry in lateral mesoderm(GO:0003140) nodal signaling pathway involved in determination of left/right asymmetry(GO:0038107) regulation of transcription from RNA polymerase II promoter involved in determination of left/right symmetry(GO:1900094) nodal signaling pathway involved in determination of lateral mesoderm left/right asymmetry(GO:1900164) |
| 1.3 | 8.0 | GO:0017196 | N-terminal peptidyl-methionine acetylation(GO:0017196) |
| 1.3 | 4.0 | GO:0060352 | cell adhesion molecule production(GO:0060352) |
| 1.3 | 5.3 | GO:0061052 | negative regulation of cell growth involved in cardiac muscle cell development(GO:0061052) |
| 1.3 | 10.6 | GO:0021869 | forebrain ventricular zone progenitor cell division(GO:0021869) |
| 1.3 | 3.9 | GO:1904636 | response to ionomycin(GO:1904636) cellular response to ionomycin(GO:1904637) |
| 1.3 | 5.2 | GO:0035024 | negative regulation of Rho protein signal transduction(GO:0035024) |
| 1.3 | 5.2 | GO:0048861 | leukemia inhibitory factor signaling pathway(GO:0048861) |
| 1.3 | 7.8 | GO:1904381 | Golgi apparatus mannose trimming(GO:1904381) |
| 1.3 | 6.5 | GO:0060718 | chorionic trophoblast cell differentiation(GO:0060718) |
| 1.3 | 1.3 | GO:0033088 | negative regulation of immature T cell proliferation in thymus(GO:0033088) |
| 1.3 | 5.1 | GO:2001151 | regulation of renal water transport(GO:2001151) positive regulation of renal water transport(GO:2001153) |
| 1.3 | 1.3 | GO:0018879 | biphenyl metabolic process(GO:0018879) |
| 1.3 | 2.5 | GO:0006288 | base-excision repair, DNA ligation(GO:0006288) |
| 1.3 | 6.3 | GO:1904098 | regulation of protein O-linked glycosylation(GO:1904098) positive regulation of protein O-linked glycosylation(GO:1904100) |
| 1.3 | 5.1 | GO:0032849 | positive regulation of cellular pH reduction(GO:0032849) |
| 1.3 | 15.2 | GO:0006657 | CDP-choline pathway(GO:0006657) |
| 1.3 | 7.6 | GO:0006287 | base-excision repair, gap-filling(GO:0006287) |
| 1.3 | 1.3 | GO:2000705 | dense core granule biogenesis(GO:0061110) regulation of dense core granule biogenesis(GO:2000705) |
| 1.3 | 10.0 | GO:0042487 | osteoblast fate commitment(GO:0002051) regulation of odontogenesis of dentin-containing tooth(GO:0042487) |
| 1.2 | 5.0 | GO:1900166 | glial cell-derived neurotrophic factor secretion(GO:0044467) regulation of glial cell-derived neurotrophic factor secretion(GO:1900166) positive regulation of glial cell-derived neurotrophic factor secretion(GO:1900168) |
| 1.2 | 7.4 | GO:0098535 | de novo centriole assembly(GO:0098535) |
| 1.2 | 2.4 | GO:0002322 | B cell proliferation involved in immune response(GO:0002322) |
| 1.2 | 3.7 | GO:0006864 | pyrimidine nucleotide transport(GO:0006864) mitochondrial pyrimidine nucleotide import(GO:1990519) |
| 1.2 | 8.5 | GO:0034465 | response to carbon monoxide(GO:0034465) |
| 1.2 | 7.2 | GO:0006540 | glutamate decarboxylation to succinate(GO:0006540) |
| 1.2 | 3.6 | GO:1900224 | positive regulation of nodal signaling pathway involved in determination of lateral mesoderm left/right asymmetry(GO:1900224) |
| 1.2 | 3.6 | GO:0051710 | regulation of cytolysis in other organism(GO:0051710) |
| 1.2 | 1.2 | GO:0032714 | negative regulation of interleukin-5 production(GO:0032714) |
| 1.2 | 13.1 | GO:0030322 | stabilization of membrane potential(GO:0030322) |
| 1.2 | 7.1 | GO:0042789 | mRNA transcription from RNA polymerase II promoter(GO:0042789) |
| 1.2 | 4.7 | GO:0021938 | ventral midline development(GO:0007418) smoothened signaling pathway involved in regulation of cerebellar granule cell precursor cell proliferation(GO:0021938) |
| 1.2 | 3.5 | GO:0090283 | regulation of protein glycosylation in Golgi(GO:0090283) |
| 1.2 | 3.5 | GO:1990637 | response to prolactin(GO:1990637) |
| 1.2 | 3.5 | GO:1904430 | negative regulation of t-circle formation(GO:1904430) |
| 1.2 | 9.3 | GO:0034086 | maintenance of sister chromatid cohesion(GO:0034086) maintenance of mitotic sister chromatid cohesion(GO:0034088) |
| 1.2 | 1.2 | GO:0030205 | dermatan sulfate metabolic process(GO:0030205) dermatan sulfate proteoglycan metabolic process(GO:0050655) |
| 1.2 | 2.3 | GO:0001777 | T cell homeostatic proliferation(GO:0001777) |
| 1.2 | 2.3 | GO:0021957 | corticospinal tract morphogenesis(GO:0021957) |
| 1.2 | 2.3 | GO:0003285 | septum secundum development(GO:0003285) |
| 1.1 | 1.1 | GO:0014005 | microglia differentiation(GO:0014004) microglia development(GO:0014005) |
| 1.1 | 4.6 | GO:0021633 | optic nerve structural organization(GO:0021633) |
| 1.1 | 3.4 | GO:2000824 | negative regulation of androgen receptor activity(GO:2000824) |
| 1.1 | 3.4 | GO:0060398 | regulation of growth hormone receptor signaling pathway(GO:0060398) |
| 1.1 | 1.1 | GO:0099545 | trans-synaptic signaling by trans-synaptic complex(GO:0099545) |
| 1.1 | 3.4 | GO:0010025 | wax biosynthetic process(GO:0010025) wax metabolic process(GO:0010166) |
| 1.1 | 5.7 | GO:0038169 | somatostatin receptor signaling pathway(GO:0038169) somatostatin signaling pathway(GO:0038170) |
| 1.1 | 3.4 | GO:0030311 | poly-N-acetyllactosamine metabolic process(GO:0030309) poly-N-acetyllactosamine biosynthetic process(GO:0030311) |
| 1.1 | 5.6 | GO:0060741 | prostate gland stromal morphogenesis(GO:0060741) |
| 1.1 | 3.4 | GO:0017186 | peptidyl-pyroglutamic acid biosynthetic process, using glutaminyl-peptide cyclotransferase(GO:0017186) |
| 1.1 | 1.1 | GO:0060023 | soft palate development(GO:0060023) |
| 1.1 | 6.7 | GO:0071321 | cellular response to cGMP(GO:0071321) |
| 1.1 | 3.3 | GO:0097491 | sympathetic neuron projection extension(GO:0097490) sympathetic neuron projection guidance(GO:0097491) |
| 1.1 | 4.4 | GO:2000564 | CD8-positive, alpha-beta T cell proliferation(GO:0035740) positive regulation of interleukin-12 biosynthetic process(GO:0045084) regulation of CD8-positive, alpha-beta T cell proliferation(GO:2000564) |
| 1.1 | 3.3 | GO:0070316 | regulation of G0 to G1 transition(GO:0070316) |
| 1.1 | 3.3 | GO:0042700 | luteinizing hormone signaling pathway(GO:0042700) |
| 1.1 | 3.2 | GO:1904504 | regulation of lipophagy(GO:1904502) positive regulation of lipophagy(GO:1904504) |
| 1.1 | 3.2 | GO:0002881 | negative regulation of chronic inflammatory response to non-antigenic stimulus(GO:0002881) |
| 1.1 | 4.3 | GO:1904845 | response to L-glutamine(GO:1904844) cellular response to L-glutamine(GO:1904845) |
| 1.1 | 5.4 | GO:0032377 | regulation of intracellular lipid transport(GO:0032377) regulation of intracellular sterol transport(GO:0032380) regulation of intracellular cholesterol transport(GO:0032383) |
| 1.1 | 4.3 | GO:0019249 | lactate biosynthetic process(GO:0019249) |
| 1.1 | 4.3 | GO:0060010 | Sertoli cell fate commitment(GO:0060010) |
| 1.1 | 3.2 | GO:0090675 | intermicrovillar adhesion(GO:0090675) |
| 1.1 | 12.7 | GO:0060670 | branching involved in labyrinthine layer morphogenesis(GO:0060670) |
| 1.1 | 14.8 | GO:0032367 | intracellular sterol transport(GO:0032366) intracellular cholesterol transport(GO:0032367) |
| 1.1 | 5.3 | GO:0018125 | peptidyl-cysteine methylation(GO:0018125) |
| 1.1 | 2.1 | GO:0033602 | negative regulation of dopamine secretion(GO:0033602) |
| 1.1 | 3.2 | GO:0048250 | mitochondrial iron ion transport(GO:0048250) |
| 1.1 | 5.3 | GO:0030538 | embryonic genitalia morphogenesis(GO:0030538) |
| 1.1 | 8.4 | GO:0001574 | ganglioside biosynthetic process(GO:0001574) |
| 1.1 | 6.3 | GO:0030916 | otic vesicle formation(GO:0030916) |
| 1.1 | 2.1 | GO:0031133 | regulation of axon diameter(GO:0031133) |
| 1.1 | 7.4 | GO:0002414 | immunoglobulin transcytosis in epithelial cells(GO:0002414) |
| 1.1 | 3.2 | GO:0010002 | cardioblast differentiation(GO:0010002) |
| 1.0 | 8.4 | GO:0045905 | translational frameshifting(GO:0006452) positive regulation of translational termination(GO:0045905) |
| 1.0 | 1.0 | GO:0007296 | vitellogenesis(GO:0007296) |
| 1.0 | 3.1 | GO:0021919 | BMP signaling pathway involved in spinal cord dorsal/ventral patterning(GO:0021919) |
| 1.0 | 4.1 | GO:0032972 | regulation of muscle filament sliding speed(GO:0032972) |
| 1.0 | 4.1 | GO:0060800 | regulation of cell differentiation involved in embryonic placenta development(GO:0060800) |
| 1.0 | 5.1 | GO:0018231 | peptidyl-L-cysteine S-palmitoylation(GO:0018230) peptidyl-S-diacylglycerol-L-cysteine biosynthetic process from peptidyl-cysteine(GO:0018231) |
| 1.0 | 9.2 | GO:0016191 | synaptic vesicle uncoating(GO:0016191) |
| 1.0 | 5.1 | GO:0000189 | MAPK import into nucleus(GO:0000189) |
| 1.0 | 3.0 | GO:0002025 | vasodilation by norepinephrine-epinephrine involved in regulation of systemic arterial blood pressure(GO:0002025) |
| 1.0 | 2.0 | GO:0035441 | cell migration involved in vasculogenesis(GO:0035441) |
| 1.0 | 11.1 | GO:1903624 | regulation of DNA catabolic process(GO:1903624) |
| 1.0 | 3.0 | GO:0045824 | negative regulation of innate immune response(GO:0045824) |
| 1.0 | 9.1 | GO:0035434 | copper ion transmembrane transport(GO:0035434) |
| 1.0 | 2.0 | GO:0042982 | amyloid precursor protein metabolic process(GO:0042982) |
| 1.0 | 7.0 | GO:0000414 | regulation of histone H3-K36 methylation(GO:0000414) |
| 1.0 | 7.9 | GO:1904354 | negative regulation of telomere capping(GO:1904354) |
| 1.0 | 3.0 | GO:0035408 | histone H3-T6 phosphorylation(GO:0035408) |
| 1.0 | 3.0 | GO:0006438 | valyl-tRNA aminoacylation(GO:0006438) |
| 1.0 | 14.7 | GO:0002031 | G-protein coupled receptor internalization(GO:0002031) |
| 1.0 | 2.9 | GO:0038060 | nitric oxide-cGMP-mediated signaling pathway(GO:0038060) |
| 1.0 | 9.7 | GO:2000427 | positive regulation of apoptotic cell clearance(GO:2000427) |
| 1.0 | 2.9 | GO:0001826 | inner cell mass cell differentiation(GO:0001826) |
| 1.0 | 14.5 | GO:0002430 | complement receptor mediated signaling pathway(GO:0002430) |
| 1.0 | 5.8 | GO:0055059 | asymmetric neuroblast division(GO:0055059) |
| 1.0 | 3.8 | GO:1900738 | regulation of phospholipase C-activating G-protein coupled receptor signaling pathway(GO:1900736) positive regulation of phospholipase C-activating G-protein coupled receptor signaling pathway(GO:1900738) |
| 1.0 | 2.9 | GO:0003358 | noradrenergic neuron development(GO:0003358) |
| 1.0 | 2.9 | GO:0071301 | cellular response to vitamin B1(GO:0071301) response to formaldehyde(GO:1904404) |
| 1.0 | 2.9 | GO:0046619 | optic placode formation involved in camera-type eye formation(GO:0046619) |
| 0.9 | 2.8 | GO:0021555 | midbrain-hindbrain boundary morphogenesis(GO:0021555) |
| 0.9 | 7.5 | GO:0015693 | magnesium ion transport(GO:0015693) |
| 0.9 | 4.7 | GO:0006041 | glucosamine metabolic process(GO:0006041) glucose 1-phosphate metabolic process(GO:0019255) |
| 0.9 | 5.6 | GO:0008626 | granzyme-mediated apoptotic signaling pathway(GO:0008626) |
| 0.9 | 0.9 | GO:0060157 | urinary bladder development(GO:0060157) |
| 0.9 | 2.8 | GO:0086092 | regulation of the force of heart contraction by cardiac conduction(GO:0086092) |
| 0.9 | 1.9 | GO:0003219 | cardiac right ventricle formation(GO:0003219) |
| 0.9 | 3.7 | GO:0032607 | interferon-alpha production(GO:0032607) |
| 0.9 | 9.2 | GO:0043249 | erythrocyte maturation(GO:0043249) |
| 0.9 | 1.8 | GO:0055057 | neuronal stem cell division(GO:0036445) neuroblast division(GO:0055057) |
| 0.9 | 15.6 | GO:0006020 | inositol metabolic process(GO:0006020) |
| 0.9 | 7.3 | GO:0006013 | mannose metabolic process(GO:0006013) |
| 0.9 | 2.7 | GO:0061368 | behavioral response to chemical pain(GO:0061366) behavioral response to formalin induced pain(GO:0061368) |
| 0.9 | 9.1 | GO:0006069 | ethanol oxidation(GO:0006069) |
| 0.9 | 2.7 | GO:0007440 | foregut morphogenesis(GO:0007440) embryonic foregut morphogenesis(GO:0048617) |
| 0.9 | 4.5 | GO:0060136 | embryonic process involved in female pregnancy(GO:0060136) |
| 0.9 | 3.6 | GO:0061762 | CAMKK-AMPK signaling cascade(GO:0061762) |
| 0.9 | 25.4 | GO:0045730 | respiratory burst(GO:0045730) |
| 0.9 | 1.7 | GO:2000820 | negative regulation of transcription from RNA polymerase II promoter involved in smooth muscle cell differentiation(GO:2000820) |
| 0.9 | 13.1 | GO:0045475 | locomotor rhythm(GO:0045475) |
| 0.9 | 2.6 | GO:0032455 | nerve growth factor processing(GO:0032455) |
| 0.9 | 3.5 | GO:0060294 | cilium movement involved in cell motility(GO:0060294) |
| 0.9 | 5.2 | GO:0006741 | NADP biosynthetic process(GO:0006741) |
| 0.9 | 2.6 | GO:0090521 | glomerular visceral epithelial cell migration(GO:0090521) |
| 0.9 | 3.4 | GO:0046606 | negative regulation of centrosome duplication(GO:0010826) negative regulation of centrosome cycle(GO:0046606) |
| 0.8 | 2.5 | GO:1900042 | positive regulation of interleukin-2 secretion(GO:1900042) |
| 0.8 | 1.7 | GO:0000432 | carbon catabolite regulation of transcription from RNA polymerase II promoter(GO:0000429) regulation of transcription from RNA polymerase II promoter by glucose(GO:0000430) positive regulation of transcription from RNA polymerase II promoter by glucose(GO:0000432) carbon catabolite activation of transcription from RNA polymerase II promoter(GO:0000436) |
| 0.8 | 3.4 | GO:0090038 | negative regulation of protein kinase C signaling(GO:0090038) |
| 0.8 | 2.5 | GO:0050760 | negative regulation of thymidylate synthase biosynthetic process(GO:0050760) |
| 0.8 | 3.3 | GO:0048165 | ovarian cumulus expansion(GO:0001550) fused antrum stage(GO:0048165) |
| 0.8 | 20.6 | GO:2000369 | regulation of clathrin-mediated endocytosis(GO:2000369) |
| 0.8 | 7.4 | GO:0048712 | negative regulation of astrocyte differentiation(GO:0048712) |
| 0.8 | 4.9 | GO:0002760 | positive regulation of antimicrobial peptide production(GO:0002225) positive regulation of antimicrobial humoral response(GO:0002760) positive regulation of antibacterial peptide production(GO:0002803) |
| 0.8 | 3.3 | GO:0045079 | negative regulation of chemokine biosynthetic process(GO:0045079) |
| 0.8 | 4.9 | GO:0090043 | regulation of tubulin deacetylation(GO:0090043) |
| 0.8 | 4.9 | GO:0051122 | hepoxilin metabolic process(GO:0051121) hepoxilin biosynthetic process(GO:0051122) |
| 0.8 | 4.1 | GO:0090116 | C-5 methylation of cytosine(GO:0090116) |
| 0.8 | 3.2 | GO:0050680 | negative regulation of epithelial cell proliferation(GO:0050680) |
| 0.8 | 1.6 | GO:0043507 | positive regulation of JUN kinase activity(GO:0043507) |
| 0.8 | 3.2 | GO:0030037 | actin filament reorganization involved in cell cycle(GO:0030037) |
| 0.8 | 3.2 | GO:0072103 | glomerulus vasculature morphogenesis(GO:0072103) glomerular capillary formation(GO:0072104) |
| 0.8 | 2.4 | GO:2000562 | CD4-positive, alpha-beta T cell proliferation(GO:0035739) regulation of CD4-positive, alpha-beta T cell proliferation(GO:2000561) negative regulation of CD4-positive, alpha-beta T cell proliferation(GO:2000562) |
| 0.8 | 12.7 | GO:0032836 | glomerular basement membrane development(GO:0032836) |
| 0.8 | 4.0 | GO:0034334 | adherens junction maintenance(GO:0034334) |
| 0.8 | 4.7 | GO:0086036 | regulation of cardiac muscle cell membrane potential(GO:0086036) |
| 0.8 | 2.4 | GO:0010793 | regulation of mRNA export from nucleus(GO:0010793) |
| 0.8 | 5.5 | GO:0070164 | negative regulation of adiponectin secretion(GO:0070164) |
| 0.8 | 2.4 | GO:0006285 | base-excision repair, AP site formation(GO:0006285) depyrimidination(GO:0045008) |
| 0.8 | 5.5 | GO:0043117 | positive regulation of vascular permeability(GO:0043117) |
| 0.8 | 4.7 | GO:0006102 | isocitrate metabolic process(GO:0006102) |
| 0.8 | 13.3 | GO:0043562 | cellular response to nitrogen starvation(GO:0006995) cellular response to nitrogen levels(GO:0043562) |
| 0.8 | 5.5 | GO:0043201 | response to leucine(GO:0043201) |
| 0.8 | 2.3 | GO:0046125 | thymidine metabolic process(GO:0046104) pyrimidine deoxyribonucleoside metabolic process(GO:0046125) |
| 0.8 | 1.6 | GO:0099563 | modification of synaptic structure(GO:0099563) |
| 0.8 | 2.3 | GO:0038193 | thromboxane A2 signaling pathway(GO:0038193) |
| 0.8 | 1.5 | GO:0060160 | negative regulation of dopamine receptor signaling pathway(GO:0060160) |
| 0.8 | 2.3 | GO:0003430 | growth plate cartilage chondrocyte growth(GO:0003430) growth plate cartilage chondrocyte development(GO:0003431) |
| 0.8 | 4.6 | GO:0060158 | phospholipase C-activating dopamine receptor signaling pathway(GO:0060158) |
| 0.8 | 0.8 | GO:2000543 | positive regulation of gastrulation(GO:2000543) |
| 0.8 | 1.5 | GO:0016139 | glycoside catabolic process(GO:0016139) |
| 0.8 | 0.8 | GO:0044336 | canonical Wnt signaling pathway involved in negative regulation of apoptotic process(GO:0044336) |
| 0.8 | 0.8 | GO:1900426 | positive regulation of defense response to bacterium(GO:1900426) |
| 0.8 | 4.5 | GO:1904936 | cerebral cortex GABAergic interneuron migration(GO:0021853) interneuron migration(GO:1904936) |
| 0.7 | 2.2 | GO:0019287 | isopentenyl diphosphate biosynthetic process, mevalonate pathway(GO:0019287) |
| 0.7 | 3.0 | GO:0036289 | peptidyl-serine autophosphorylation(GO:0036289) |
| 0.7 | 13.3 | GO:0098828 | positive regulation of inhibitory postsynaptic potential(GO:0097151) modulation of inhibitory postsynaptic potential(GO:0098828) |
| 0.7 | 13.2 | GO:0019371 | cyclooxygenase pathway(GO:0019371) |
| 0.7 | 2.9 | GO:0050882 | voluntary musculoskeletal movement(GO:0050882) |
| 0.7 | 10.9 | GO:0051256 | mitotic spindle midzone assembly(GO:0051256) |
| 0.7 | 3.6 | GO:0009256 | 10-formyltetrahydrofolate metabolic process(GO:0009256) |
| 0.7 | 5.8 | GO:0097647 | calcitonin family receptor signaling pathway(GO:0097646) amylin receptor signaling pathway(GO:0097647) |
| 0.7 | 4.4 | GO:0070544 | histone H3-K36 demethylation(GO:0070544) |
| 0.7 | 10.8 | GO:0030854 | positive regulation of granulocyte differentiation(GO:0030854) |
| 0.7 | 12.2 | GO:0006265 | DNA topological change(GO:0006265) |
| 0.7 | 2.2 | GO:0032237 | activation of store-operated calcium channel activity(GO:0032237) positive regulation of store-operated calcium channel activity(GO:1901341) |
| 0.7 | 2.9 | GO:1901162 | primary amino compound biosynthetic process(GO:1901162) |
| 0.7 | 3.6 | GO:0030035 | microspike assembly(GO:0030035) |
| 0.7 | 12.9 | GO:0001829 | trophectodermal cell differentiation(GO:0001829) |
| 0.7 | 2.8 | GO:0097091 | synaptic vesicle clustering(GO:0097091) |
| 0.7 | 5.0 | GO:0051415 | interphase microtubule nucleation by interphase microtubule organizing center(GO:0051415) microtubule nucleation by microtubule organizing center(GO:0051418) |
| 0.7 | 2.1 | GO:0045607 | regulation of auditory receptor cell differentiation(GO:0045607) regulation of mechanoreceptor differentiation(GO:0045631) regulation of inner ear receptor cell differentiation(GO:2000980) |
| 0.7 | 0.7 | GO:0044240 | multicellular organism lipid catabolic process(GO:0044240) |
| 0.7 | 2.1 | GO:0075044 | autophagy of host cells involved in interaction with symbiont(GO:0075044) autophagy involved in symbiotic interaction(GO:0075071) |
| 0.7 | 4.9 | GO:2000124 | regulation of endocannabinoid signaling pathway(GO:2000124) |
| 0.7 | 3.5 | GO:0032119 | sequestering of zinc ion(GO:0032119) |
| 0.7 | 13.3 | GO:0036149 | phosphatidylinositol acyl-chain remodeling(GO:0036149) |
| 0.7 | 1.4 | GO:1904204 | regulation of skeletal muscle hypertrophy(GO:1904204) |
| 0.7 | 2.8 | GO:0038145 | macrophage colony-stimulating factor signaling pathway(GO:0038145) |
| 0.7 | 2.1 | GO:0019626 | short-chain fatty acid catabolic process(GO:0019626) |
| 0.7 | 47.6 | GO:0050672 | negative regulation of mononuclear cell proliferation(GO:0032945) negative regulation of lymphocyte proliferation(GO:0050672) |
| 0.7 | 2.1 | GO:0001544 | initiation of primordial ovarian follicle growth(GO:0001544) |
| 0.7 | 11.0 | GO:0030277 | maintenance of gastrointestinal epithelium(GO:0030277) |
| 0.7 | 1.4 | GO:0061073 | ciliary body morphogenesis(GO:0061073) |
| 0.7 | 15.6 | GO:0046597 | negative regulation of viral entry into host cell(GO:0046597) |
| 0.7 | 2.0 | GO:0090208 | positive regulation of triglyceride biosynthetic process(GO:0010867) positive regulation of triglyceride metabolic process(GO:0090208) |
| 0.7 | 4.1 | GO:0018343 | protein farnesylation(GO:0018343) |
| 0.7 | 4.7 | GO:2000781 | positive regulation of double-strand break repair(GO:2000781) |
| 0.7 | 1.3 | GO:0030826 | regulation of cGMP biosynthetic process(GO:0030826) positive regulation of cGMP biosynthetic process(GO:0030828) |
| 0.7 | 2.0 | GO:0038188 | cholecystokinin signaling pathway(GO:0038188) |
| 0.7 | 3.3 | GO:1904153 | negative regulation of protein exit from endoplasmic reticulum(GO:0070862) negative regulation of retrograde protein transport, ER to cytosol(GO:1904153) |
| 0.7 | 2.0 | GO:0014859 | negative regulation of skeletal muscle cell proliferation(GO:0014859) negative regulation of skeletal muscle satellite cell proliferation(GO:1902723) |
| 0.7 | 8.6 | GO:0006054 | N-acetylneuraminate metabolic process(GO:0006054) |
| 0.7 | 7.3 | GO:0006600 | creatine metabolic process(GO:0006600) |
| 0.7 | 4.0 | GO:0043578 | nuclear matrix organization(GO:0043578) nuclear matrix anchoring at nuclear membrane(GO:0090292) |
| 0.7 | 4.0 | GO:0030421 | defecation(GO:0030421) |
| 0.7 | 3.3 | GO:0033299 | secretion of lysosomal enzymes(GO:0033299) |
| 0.7 | 5.3 | GO:0006777 | Mo-molybdopterin cofactor biosynthetic process(GO:0006777) Mo-molybdopterin cofactor metabolic process(GO:0019720) |
| 0.7 | 6.6 | GO:0003263 | cardioblast proliferation(GO:0003263) regulation of cardioblast proliferation(GO:0003264) |
| 0.7 | 3.9 | GO:0048820 | hair follicle maturation(GO:0048820) |
| 0.7 | 4.6 | GO:0086048 | membrane depolarization during bundle of His cell action potential(GO:0086048) |
| 0.7 | 5.9 | GO:0035112 | genitalia morphogenesis(GO:0035112) |
| 0.7 | 1.3 | GO:0032049 | cardiolipin biosynthetic process(GO:0032049) |
| 0.6 | 5.8 | GO:0046477 | glycosylceramide catabolic process(GO:0046477) |
| 0.6 | 1.9 | GO:1904298 | positive regulation of neutrophil degranulation(GO:0043315) cellular response to gravity(GO:0071258) positive regulation of neutrophil activation(GO:1902565) regulation of transcytosis(GO:1904298) positive regulation of transcytosis(GO:1904300) regulation of maternal process involved in parturition(GO:1904301) positive regulation of maternal process involved in parturition(GO:1904303) response to 2-O-acetyl-1-O-hexadecyl-sn-glycero-3-phosphocholine(GO:1904316) cellular response to 2-O-acetyl-1-O-hexadecyl-sn-glycero-3-phosphocholine(GO:1904317) |
| 0.6 | 1.9 | GO:0070244 | negative regulation of thymocyte apoptotic process(GO:0070244) |
| 0.6 | 2.6 | GO:0032713 | negative regulation of interleukin-4 production(GO:0032713) |
| 0.6 | 2.6 | GO:0072180 | mesonephric duct morphogenesis(GO:0072180) |
| 0.6 | 6.4 | GO:1904424 | regulation of GTP binding(GO:1904424) |
| 0.6 | 4.5 | GO:0032494 | response to peptidoglycan(GO:0032494) |
| 0.6 | 4.5 | GO:0045647 | negative regulation of erythrocyte differentiation(GO:0045647) |
| 0.6 | 1.3 | GO:0007113 | endomitotic cell cycle(GO:0007113) |
| 0.6 | 5.1 | GO:0015705 | iodide transport(GO:0015705) |
| 0.6 | 3.8 | GO:0000707 | meiotic DNA recombinase assembly(GO:0000707) |
| 0.6 | 26.1 | GO:0007214 | gamma-aminobutyric acid signaling pathway(GO:0007214) |
| 0.6 | 10.8 | GO:0002244 | hematopoietic progenitor cell differentiation(GO:0002244) |
| 0.6 | 14.7 | GO:0007202 | activation of phospholipase C activity(GO:0007202) |
| 0.6 | 5.1 | GO:0098719 | sodium ion import across plasma membrane(GO:0098719) sodium ion import into cell(GO:1990118) |
| 0.6 | 3.1 | GO:0044351 | macropinocytosis(GO:0044351) |
| 0.6 | 5.0 | GO:0006116 | NADH oxidation(GO:0006116) |
| 0.6 | 7.5 | GO:0010991 | negative regulation of SMAD protein complex assembly(GO:0010991) |
| 0.6 | 1.3 | GO:0006883 | cellular sodium ion homeostasis(GO:0006883) |
| 0.6 | 3.8 | GO:0001825 | blastocyst formation(GO:0001825) |
| 0.6 | 11.2 | GO:0007141 | male meiosis I(GO:0007141) |
| 0.6 | 3.7 | GO:1903960 | regulation of plasma membrane long-chain fatty acid transport(GO:0010746) negative regulation of plasma membrane long-chain fatty acid transport(GO:0010748) negative regulation of anion transmembrane transport(GO:1903960) |
| 0.6 | 3.1 | GO:0010666 | positive regulation of striated muscle cell apoptotic process(GO:0010663) positive regulation of cardiac muscle cell apoptotic process(GO:0010666) |
| 0.6 | 1.9 | GO:0036058 | filtration diaphragm assembly(GO:0036058) slit diaphragm assembly(GO:0036060) negative regulation of retinal ganglion cell axon guidance(GO:0090260) |
| 0.6 | 2.5 | GO:0021510 | spinal cord development(GO:0021510) |
| 0.6 | 3.7 | GO:0033210 | leptin-mediated signaling pathway(GO:0033210) |
| 0.6 | 8.0 | GO:0045652 | regulation of megakaryocyte differentiation(GO:0045652) |
| 0.6 | 16.1 | GO:0034199 | activation of protein kinase A activity(GO:0034199) |
| 0.6 | 4.3 | GO:0060019 | radial glial cell differentiation(GO:0060019) |
| 0.6 | 9.3 | GO:0001976 | neurological system process involved in regulation of systemic arterial blood pressure(GO:0001976) |
| 0.6 | 3.1 | GO:0023041 | neuronal signal transduction(GO:0023041) |
| 0.6 | 1.8 | GO:0051102 | DNA ligation involved in DNA recombination(GO:0051102) |
| 0.6 | 2.4 | GO:2000671 | regulation of motor neuron apoptotic process(GO:2000671) negative regulation of motor neuron apoptotic process(GO:2000672) |
| 0.6 | 11.0 | GO:0097186 | amelogenesis(GO:0097186) |
| 0.6 | 12.8 | GO:0051004 | regulation of lipoprotein lipase activity(GO:0051004) |
| 0.6 | 4.8 | GO:0002480 | antigen processing and presentation of exogenous peptide antigen via MHC class I, TAP-independent(GO:0002480) |
| 0.6 | 0.6 | GO:0014734 | skeletal muscle hypertrophy(GO:0014734) |
| 0.6 | 3.0 | GO:0007256 | activation of JNKK activity(GO:0007256) |
| 0.6 | 1.8 | GO:0072139 | glomerular parietal epithelial cell differentiation(GO:0072139) |
| 0.6 | 5.4 | GO:0036066 | protein O-linked fucosylation(GO:0036066) |
| 0.6 | 4.8 | GO:1900112 | regulation of histone H3-K9 trimethylation(GO:1900112) |
| 0.6 | 2.4 | GO:1990504 | dense core granule exocytosis(GO:1990504) |
| 0.6 | 1.2 | GO:0098760 | interleukin-7-mediated signaling pathway(GO:0038111) response to interleukin-7(GO:0098760) cellular response to interleukin-7(GO:0098761) |
| 0.6 | 1.2 | GO:0048708 | astrocyte differentiation(GO:0048708) |
| 0.6 | 1.2 | GO:0045670 | regulation of osteoclast differentiation(GO:0045670) |
| 0.6 | 1.8 | GO:0061364 | apoptotic process involved in luteolysis(GO:0061364) |
| 0.6 | 4.1 | GO:0002710 | negative regulation of T cell mediated immunity(GO:0002710) |
| 0.6 | 6.5 | GO:0006030 | chitin metabolic process(GO:0006030) chitin catabolic process(GO:0006032) glucosamine-containing compound catabolic process(GO:1901072) |
| 0.6 | 4.1 | GO:0034380 | high-density lipoprotein particle assembly(GO:0034380) |
| 0.6 | 1.2 | GO:0034227 | tRNA thio-modification(GO:0034227) |
| 0.6 | 2.3 | GO:0051970 | negative regulation of transmission of nerve impulse(GO:0051970) |
| 0.6 | 1.2 | GO:0061056 | sclerotome development(GO:0061056) |
| 0.6 | 1.7 | GO:1902309 | negative regulation of peptidyl-serine dephosphorylation(GO:1902309) |
| 0.6 | 8.7 | GO:0090361 | platelet-derived growth factor production(GO:0090360) regulation of platelet-derived growth factor production(GO:0090361) |
| 0.6 | 4.0 | GO:2000304 | positive regulation of sphingolipid biosynthetic process(GO:0090154) positive regulation of ceramide biosynthetic process(GO:2000304) |
| 0.6 | 1.7 | GO:0002276 | basophil activation involved in immune response(GO:0002276) |
| 0.6 | 5.7 | GO:0021702 | cerebellar Purkinje cell layer formation(GO:0021694) cerebellar Purkinje cell differentiation(GO:0021702) |
| 0.6 | 5.1 | GO:0008343 | adult feeding behavior(GO:0008343) |
| 0.6 | 1.7 | GO:2000722 | nuclear fragmentation involved in apoptotic nuclear change(GO:0030264) regulation of cardiac vascular smooth muscle cell differentiation(GO:2000722) positive regulation of cardiac vascular smooth muscle cell differentiation(GO:2000724) |
| 0.6 | 1.1 | GO:0071104 | response to interleukin-9(GO:0071104) |
| 0.6 | 1.7 | GO:0030240 | skeletal muscle thin filament assembly(GO:0030240) |
| 0.6 | 1.1 | GO:0007621 | negative regulation of female receptivity(GO:0007621) |
| 0.6 | 0.6 | GO:0021692 | cerebellar Purkinje cell layer morphogenesis(GO:0021692) |
| 0.6 | 1.7 | GO:0007198 | adenylate cyclase-inhibiting serotonin receptor signaling pathway(GO:0007198) |
| 0.6 | 20.1 | GO:0019228 | neuronal action potential(GO:0019228) |
| 0.6 | 4.5 | GO:0097264 | self proteolysis(GO:0097264) |
| 0.6 | 1.1 | GO:0014707 | branchiomeric skeletal muscle development(GO:0014707) |
| 0.6 | 2.2 | GO:0043031 | negative regulation of macrophage activation(GO:0043031) |
| 0.6 | 2.8 | GO:2000323 | negative regulation of glucocorticoid receptor signaling pathway(GO:2000323) |
| 0.6 | 1.1 | GO:2000382 | positive regulation of mesoderm development(GO:2000382) |
| 0.6 | 2.8 | GO:0072364 | regulation of cellular ketone metabolic process by regulation of transcription from RNA polymerase II promoter(GO:0072364) |
| 0.6 | 3.9 | GO:0046604 | positive regulation of mitotic centrosome separation(GO:0046604) |
| 0.6 | 6.6 | GO:0030321 | transepithelial chloride transport(GO:0030321) |
| 0.5 | 8.2 | GO:0006957 | complement activation, alternative pathway(GO:0006957) |
| 0.5 | 11.5 | GO:1903861 | positive regulation of dendrite extension(GO:1903861) |
| 0.5 | 2.2 | GO:0001957 | intramembranous ossification(GO:0001957) direct ossification(GO:0036072) |
| 0.5 | 0.5 | GO:1901837 | negative regulation of transcription of nuclear large rRNA transcript from RNA polymerase I promoter(GO:1901837) |
| 0.5 | 2.2 | GO:0010807 | regulation of synaptic vesicle priming(GO:0010807) |
| 0.5 | 8.2 | GO:0033169 | histone H3-K9 demethylation(GO:0033169) |
| 0.5 | 2.2 | GO:0046348 | amino sugar catabolic process(GO:0046348) |
| 0.5 | 7.6 | GO:0098915 | membrane repolarization during ventricular cardiac muscle cell action potential(GO:0098915) |
| 0.5 | 1.6 | GO:0014022 | neural plate elongation(GO:0014022) convergent extension involved in neural plate elongation(GO:0022007) canonical Wnt signaling pathway involved in regulation of cell proliferation(GO:0044340) |
| 0.5 | 12.9 | GO:1904380 | endoplasmic reticulum mannose trimming(GO:1904380) |
| 0.5 | 2.2 | GO:0015808 | L-alanine transport(GO:0015808) |
| 0.5 | 0.5 | GO:0032423 | regulation of mismatch repair(GO:0032423) positive regulation of mismatch repair(GO:0032425) |
| 0.5 | 14.5 | GO:0045746 | negative regulation of Notch signaling pathway(GO:0045746) |
| 0.5 | 5.3 | GO:1900181 | negative regulation of protein import into nucleus(GO:0042308) negative regulation of protein localization to nucleus(GO:1900181) negative regulation of protein import(GO:1904590) |
| 0.5 | 3.7 | GO:0070779 | D-aspartate transport(GO:0070777) D-aspartate import(GO:0070779) |
| 0.5 | 1.6 | GO:0042631 | cellular response to water deprivation(GO:0042631) |
| 0.5 | 1.0 | GO:0006659 | phosphatidylserine biosynthetic process(GO:0006659) |
| 0.5 | 1.0 | GO:0035995 | detection of muscle stretch(GO:0035995) |
| 0.5 | 2.1 | GO:0055003 | cardiac myofibril assembly(GO:0055003) |
| 0.5 | 6.7 | GO:0018298 | protein-chromophore linkage(GO:0018298) |
| 0.5 | 2.6 | GO:1904152 | regulation of retrograde protein transport, ER to cytosol(GO:1904152) |
| 0.5 | 3.1 | GO:0006196 | AMP catabolic process(GO:0006196) |
| 0.5 | 3.1 | GO:0032364 | oxygen homeostasis(GO:0032364) |
| 0.5 | 1.5 | GO:1901994 | meiotic cell cycle phase transition(GO:0044771) regulation of meiotic cell cycle phase transition(GO:1901993) negative regulation of meiotic cell cycle phase transition(GO:1901994) |
| 0.5 | 4.1 | GO:0046512 | diol biosynthetic process(GO:0034312) sphingosine biosynthetic process(GO:0046512) sphingoid biosynthetic process(GO:0046520) |
| 0.5 | 1.0 | GO:2000321 | positive regulation of T-helper 17 cell differentiation(GO:2000321) |
| 0.5 | 3.6 | GO:0098532 | histone H3-K27 trimethylation(GO:0098532) |
| 0.5 | 1.0 | GO:0045616 | regulation of keratinocyte differentiation(GO:0045616) |
| 0.5 | 1.5 | GO:1903800 | positive regulation of production of miRNAs involved in gene silencing by miRNA(GO:1903800) |
| 0.5 | 2.5 | GO:0048842 | positive regulation of axon extension involved in axon guidance(GO:0048842) |
| 0.5 | 2.0 | GO:1900194 | negative regulation of oocyte maturation(GO:1900194) |
| 0.5 | 1.0 | GO:0046929 | negative regulation of neurotransmitter secretion(GO:0046929) |
| 0.5 | 5.5 | GO:0016576 | histone dephosphorylation(GO:0016576) |
| 0.5 | 3.5 | GO:0021842 | directional guidance of interneurons involved in migration from the subpallium to the cortex(GO:0021840) chemorepulsion involved in interneuron migration from the subpallium to the cortex(GO:0021842) |
| 0.5 | 5.5 | GO:0048298 | positive regulation of isotype switching to IgA isotypes(GO:0048298) |
| 0.5 | 1.5 | GO:0060017 | parathyroid gland development(GO:0060017) |
| 0.5 | 2.0 | GO:0060666 | dichotomous subdivision of terminal units involved in salivary gland branching(GO:0060666) |
| 0.5 | 1.0 | GO:0001866 | NK T cell proliferation(GO:0001866) |
| 0.5 | 1.5 | GO:0021984 | adenohypophysis development(GO:0021984) |
| 0.5 | 2.0 | GO:0003356 | regulation of cilium movement(GO:0003352) regulation of cilium beat frequency(GO:0003356) |
| 0.5 | 8.4 | GO:0002230 | positive regulation of defense response to virus by host(GO:0002230) |
| 0.5 | 5.9 | GO:0006975 | DNA damage induced protein phosphorylation(GO:0006975) |
| 0.5 | 11.3 | GO:0000185 | activation of MAPKKK activity(GO:0000185) |
| 0.5 | 2.4 | GO:0006489 | dolichyl diphosphate biosynthetic process(GO:0006489) dolichyl diphosphate metabolic process(GO:0046465) |
| 0.5 | 6.3 | GO:0042711 | maternal behavior(GO:0042711) parental behavior(GO:0060746) |
| 0.5 | 1.9 | GO:0045023 | G0 to G1 transition(GO:0045023) |
| 0.5 | 5.3 | GO:0033227 | dsRNA transport(GO:0033227) |
| 0.5 | 2.4 | GO:0090045 | positive regulation of deacetylase activity(GO:0090045) |
| 0.5 | 4.3 | GO:0003341 | cilium movement(GO:0003341) |
| 0.5 | 2.4 | GO:0007207 | adenylate cyclase-inhibiting G-protein coupled acetylcholine receptor signaling pathway(GO:0007197) phospholipase C-activating G-protein coupled acetylcholine receptor signaling pathway(GO:0007207) |
| 0.5 | 1.9 | GO:1900452 | regulation of long term synaptic depression(GO:1900452) |
| 0.5 | 4.2 | GO:0016081 | synaptic vesicle docking(GO:0016081) |
| 0.5 | 20.3 | GO:0033173 | calcineurin-NFAT signaling cascade(GO:0033173) |
| 0.5 | 2.8 | GO:0048280 | vesicle fusion with Golgi apparatus(GO:0048280) |
| 0.5 | 2.8 | GO:0007135 | meiosis II(GO:0007135) |
| 0.5 | 1.4 | GO:0014063 | negative regulation of serotonin secretion(GO:0014063) |
| 0.5 | 1.9 | GO:0051958 | methotrexate transport(GO:0051958) reduced folate transmembrane transport(GO:0098838) |
| 0.5 | 5.1 | GO:0070072 | proton-transporting V-type ATPase complex assembly(GO:0070070) vacuolar proton-transporting V-type ATPase complex assembly(GO:0070072) |
| 0.5 | 15.2 | GO:0019731 | antibacterial humoral response(GO:0019731) |
| 0.5 | 5.1 | GO:0034498 | early endosome to Golgi transport(GO:0034498) |
| 0.5 | 0.9 | GO:0019254 | carnitine metabolic process, CoA-linked(GO:0019254) |
| 0.5 | 4.6 | GO:2000009 | negative regulation of protein localization to cell surface(GO:2000009) |
| 0.5 | 2.3 | GO:0006701 | progesterone biosynthetic process(GO:0006701) |
| 0.4 | 1.3 | GO:0033135 | regulation of peptidyl-serine phosphorylation(GO:0033135) |
| 0.4 | 1.3 | GO:0019417 | sulfur oxidation(GO:0019417) |
| 0.4 | 4.4 | GO:0051481 | negative regulation of cytosolic calcium ion concentration(GO:0051481) |
| 0.4 | 1.3 | GO:0019835 | cytolysis(GO:0019835) |
| 0.4 | 14.1 | GO:0009083 | branched-chain amino acid metabolic process(GO:0009081) branched-chain amino acid catabolic process(GO:0009083) |
| 0.4 | 3.1 | GO:0015732 | prostaglandin transport(GO:0015732) |
| 0.4 | 3.1 | GO:1900017 | positive regulation of cytokine production involved in inflammatory response(GO:1900017) |
| 0.4 | 8.3 | GO:0045671 | negative regulation of osteoclast differentiation(GO:0045671) |
| 0.4 | 1.7 | GO:1900155 | regulation of bone trabecula formation(GO:1900154) negative regulation of bone trabecula formation(GO:1900155) |
| 0.4 | 1.3 | GO:0002371 | dendritic cell cytokine production(GO:0002371) |
| 0.4 | 1.3 | GO:1990253 | cellular response to leucine starvation(GO:1990253) |
| 0.4 | 4.7 | GO:0043981 | histone H4-K5 acetylation(GO:0043981) histone H4-K8 acetylation(GO:0043982) |
| 0.4 | 1.3 | GO:0051697 | protein delipidation(GO:0051697) |
| 0.4 | 8.5 | GO:0045332 | lipid translocation(GO:0034204) phospholipid translocation(GO:0045332) |
| 0.4 | 8.5 | GO:0060441 | epithelial tube branching involved in lung morphogenesis(GO:0060441) |
| 0.4 | 1.3 | GO:0090286 | cytoskeletal anchoring at nuclear membrane(GO:0090286) |
| 0.4 | 8.0 | GO:0042340 | keratan sulfate catabolic process(GO:0042340) |
| 0.4 | 1.3 | GO:0032286 | central nervous system myelin maintenance(GO:0032286) |
| 0.4 | 6.7 | GO:0000725 | double-strand break repair via homologous recombination(GO:0000724) recombinational repair(GO:0000725) |
| 0.4 | 4.6 | GO:0015812 | gamma-aminobutyric acid transport(GO:0015812) |
| 0.4 | 1.7 | GO:0090344 | negative regulation of cell aging(GO:0090344) |
| 0.4 | 0.8 | GO:0045415 | negative regulation of interleukin-8 biosynthetic process(GO:0045415) |
| 0.4 | 2.5 | GO:0002315 | marginal zone B cell differentiation(GO:0002315) |
| 0.4 | 1.2 | GO:0050915 | sensory perception of sour taste(GO:0050915) |
| 0.4 | 4.1 | GO:0032957 | inositol trisphosphate metabolic process(GO:0032957) |
| 0.4 | 0.8 | GO:0045915 | positive regulation of catecholamine metabolic process(GO:0045915) positive regulation of dopamine metabolic process(GO:0045964) |
| 0.4 | 2.8 | GO:0006216 | cytidine catabolic process(GO:0006216) cytidine deamination(GO:0009972) cytidine metabolic process(GO:0046087) |
| 0.4 | 1.2 | GO:0001554 | luteolysis(GO:0001554) |
| 0.4 | 3.2 | GO:0060008 | Sertoli cell differentiation(GO:0060008) |
| 0.4 | 1.2 | GO:0021954 | central nervous system neuron development(GO:0021954) |
| 0.4 | 2.4 | GO:0007212 | dopamine receptor signaling pathway(GO:0007212) |
| 0.4 | 0.8 | GO:0070253 | somatostatin secretion(GO:0070253) |
| 0.4 | 3.6 | GO:0072540 | T-helper 17 cell lineage commitment(GO:0072540) |
| 0.4 | 4.0 | GO:0050869 | negative regulation of B cell activation(GO:0050869) |
| 0.4 | 2.8 | GO:0031087 | nuclear-transcribed mRNA catabolic process, deadenylation-independent decay(GO:0031086) deadenylation-independent decapping of nuclear-transcribed mRNA(GO:0031087) |
| 0.4 | 6.7 | GO:0006590 | thyroid hormone generation(GO:0006590) |
| 0.4 | 4.3 | GO:0010603 | regulation of cytoplasmic mRNA processing body assembly(GO:0010603) |
| 0.4 | 7.5 | GO:0032012 | regulation of ARF protein signal transduction(GO:0032012) |
| 0.4 | 1.2 | GO:0048880 | sensory system development(GO:0048880) |
| 0.4 | 0.4 | GO:0097062 | dendritic spine maintenance(GO:0097062) |
| 0.4 | 4.3 | GO:0045351 | type I interferon biosynthetic process(GO:0045351) |
| 0.4 | 3.9 | GO:0033623 | regulation of integrin activation(GO:0033623) |
| 0.4 | 2.7 | GO:2000288 | positive regulation of myoblast proliferation(GO:2000288) |
| 0.4 | 2.3 | GO:0002943 | tRNA dihydrouridine synthesis(GO:0002943) |
| 0.4 | 2.7 | GO:0010591 | regulation of lamellipodium assembly(GO:0010591) |
| 0.4 | 8.0 | GO:0021854 | hypothalamus development(GO:0021854) |
| 0.4 | 7.2 | GO:0045199 | maintenance of apical/basal cell polarity(GO:0035090) maintenance of epithelial cell apical/basal polarity(GO:0045199) |
| 0.4 | 1.1 | GO:0048711 | positive regulation of astrocyte differentiation(GO:0048711) |
| 0.4 | 3.4 | GO:0038092 | nodal signaling pathway(GO:0038092) |
| 0.4 | 10.5 | GO:0042059 | negative regulation of epidermal growth factor receptor signaling pathway(GO:0042059) |
| 0.4 | 6.4 | GO:0045662 | negative regulation of myoblast differentiation(GO:0045662) |
| 0.4 | 3.0 | GO:0071376 | response to corticotropin-releasing hormone(GO:0043435) cellular response to corticotropin-releasing hormone stimulus(GO:0071376) |
| 0.4 | 0.7 | GO:0030318 | melanocyte differentiation(GO:0030318) |
| 0.4 | 1.1 | GO:0071361 | cellular response to ethanol(GO:0071361) |
| 0.4 | 20.5 | GO:0019933 | cAMP-mediated signaling(GO:0019933) |
| 0.4 | 1.9 | GO:0051694 | pointed-end actin filament capping(GO:0051694) |
| 0.4 | 1.1 | GO:0002541 | activation of plasma proteins involved in acute inflammatory response(GO:0002541) |
| 0.4 | 1.5 | GO:0010818 | T cell chemotaxis(GO:0010818) |
| 0.4 | 7.0 | GO:1901663 | ubiquinone metabolic process(GO:0006743) ubiquinone biosynthetic process(GO:0006744) quinone biosynthetic process(GO:1901663) |
| 0.4 | 1.5 | GO:0061343 | cell adhesion involved in heart morphogenesis(GO:0061343) |
| 0.4 | 1.8 | GO:0070278 | extracellular matrix constituent secretion(GO:0070278) |
| 0.4 | 3.3 | GO:0038028 | insulin receptor signaling pathway via phosphatidylinositol 3-kinase(GO:0038028) positive regulation of glycogen (starch) synthase activity(GO:2000467) |
| 0.4 | 13.1 | GO:0043552 | positive regulation of phosphatidylinositol 3-kinase activity(GO:0043552) |
| 0.4 | 19.2 | GO:0006953 | acute-phase response(GO:0006953) |
| 0.4 | 6.8 | GO:0046500 | S-adenosylmethionine metabolic process(GO:0046500) |
| 0.4 | 2.2 | GO:0060766 | negative regulation of androgen receptor signaling pathway(GO:0060766) |
| 0.4 | 2.2 | GO:2000010 | positive regulation of protein localization to cell surface(GO:2000010) |
| 0.4 | 3.9 | GO:0097150 | neuronal stem cell population maintenance(GO:0097150) |
| 0.4 | 7.5 | GO:0045063 | T-helper 1 cell differentiation(GO:0045063) |
| 0.4 | 1.4 | GO:0045654 | positive regulation of megakaryocyte differentiation(GO:0045654) |
| 0.4 | 3.2 | GO:2001241 | positive regulation of extrinsic apoptotic signaling pathway in absence of ligand(GO:2001241) |
| 0.4 | 42.3 | GO:0006958 | complement activation, classical pathway(GO:0006958) |
| 0.4 | 4.2 | GO:0002407 | dendritic cell chemotaxis(GO:0002407) |
| 0.4 | 0.7 | GO:1903772 | regulation of viral budding via host ESCRT complex(GO:1903772) |
| 0.4 | 5.3 | GO:0045717 | negative regulation of fatty acid biosynthetic process(GO:0045717) |
| 0.3 | 1.0 | GO:1901160 | serotonin metabolic process(GO:0042428) primary amino compound metabolic process(GO:1901160) |
| 0.3 | 5.9 | GO:0043508 | negative regulation of JUN kinase activity(GO:0043508) |
| 0.3 | 2.1 | GO:0061737 | leukotriene signaling pathway(GO:0061737) |
| 0.3 | 1.7 | GO:0035279 | mRNA cleavage involved in gene silencing by miRNA(GO:0035279) mRNA cleavage involved in gene silencing by siRNA(GO:0090625) mRNA cleavage involved in gene silencing(GO:0098795) |
| 0.3 | 2.4 | GO:0006572 | tyrosine catabolic process(GO:0006572) |
| 0.3 | 1.7 | GO:0033564 | anterior/posterior axon guidance(GO:0033564) |
| 0.3 | 1.0 | GO:0048203 | vesicle targeting, trans-Golgi to endosome(GO:0048203) |
| 0.3 | 1.0 | GO:0071681 | response to indole-3-methanol(GO:0071680) cellular response to indole-3-methanol(GO:0071681) |
| 0.3 | 2.4 | GO:1990416 | cellular response to brain-derived neurotrophic factor stimulus(GO:1990416) |
| 0.3 | 3.0 | GO:0032074 | negative regulation of nuclease activity(GO:0032074) |
| 0.3 | 5.7 | GO:0048642 | negative regulation of skeletal muscle tissue development(GO:0048642) |
| 0.3 | 1.0 | GO:0023035 | CD40 signaling pathway(GO:0023035) |
| 0.3 | 1.0 | GO:0042637 | regulation of monophenol monooxygenase activity(GO:0032771) positive regulation of monophenol monooxygenase activity(GO:0032773) catagen(GO:0042637) regulation of catagen(GO:0051794) negative regulation of catagen(GO:0051796) regulation of hair cycle by canonical Wnt signaling pathway(GO:0060901) positive regulation of melanosome transport(GO:1902910) |
| 0.3 | 1.6 | GO:0035063 | nuclear speck organization(GO:0035063) |
| 0.3 | 4.6 | GO:0015671 | oxygen transport(GO:0015671) |
| 0.3 | 1.3 | GO:2000786 | positive regulation of autophagosome assembly(GO:2000786) |
| 0.3 | 6.5 | GO:0006379 | mRNA cleavage(GO:0006379) |
| 0.3 | 1.3 | GO:0019448 | cysteine catabolic process(GO:0009093) L-cysteine catabolic process(GO:0019448) L-cysteine metabolic process(GO:0046439) |
| 0.3 | 1.0 | GO:0050861 | positive regulation of B cell receptor signaling pathway(GO:0050861) |
| 0.3 | 0.3 | GO:0043449 | cellular alkene metabolic process(GO:0043449) |
| 0.3 | 1.9 | GO:0017121 | phospholipid scrambling(GO:0017121) |
| 0.3 | 0.6 | GO:0051866 | general adaptation syndrome(GO:0051866) |
| 0.3 | 4.5 | GO:0036465 | synaptic vesicle recycling(GO:0036465) |
| 0.3 | 1.0 | GO:0001836 | release of cytochrome c from mitochondria(GO:0001836) regulation of release of cytochrome c from mitochondria(GO:0090199) positive regulation of release of cytochrome c from mitochondria(GO:0090200) |
| 0.3 | 6.4 | GO:0001947 | heart looping(GO:0001947) |
| 0.3 | 1.6 | GO:0032929 | negative regulation of superoxide anion generation(GO:0032929) |
| 0.3 | 1.6 | GO:1904714 | regulation of chaperone-mediated autophagy(GO:1904714) |
| 0.3 | 1.2 | GO:0033684 | regulation of luteinizing hormone secretion(GO:0033684) positive regulation of luteinizing hormone secretion(GO:0033686) regulation of follicle-stimulating hormone secretion(GO:0046880) positive regulation of follicle-stimulating hormone secretion(GO:0046881) follicle-stimulating hormone secretion(GO:0046884) |
| 0.3 | 9.6 | GO:0090140 | regulation of mitochondrial fission(GO:0090140) |
| 0.3 | 0.9 | GO:1902630 | regulation of membrane hyperpolarization(GO:1902630) |
| 0.3 | 2.8 | GO:0018027 | peptidyl-lysine dimethylation(GO:0018027) |
| 0.3 | 0.6 | GO:0061394 | regulation of transcription from RNA polymerase II promoter in response to arsenic-containing substance(GO:0061394) |
| 0.3 | 1.2 | GO:0071802 | negative regulation of podosome assembly(GO:0071802) |
| 0.3 | 12.0 | GO:0006904 | vesicle docking involved in exocytosis(GO:0006904) |
| 0.3 | 2.1 | GO:0051599 | response to hydrostatic pressure(GO:0051599) |
| 0.3 | 1.8 | GO:0001672 | regulation of chromatin assembly or disassembly(GO:0001672) |
| 0.3 | 1.8 | GO:0051593 | response to folic acid(GO:0051593) |
| 0.3 | 1.5 | GO:0042226 | interleukin-6 biosynthetic process(GO:0042226) |
| 0.3 | 3.6 | GO:0071688 | striated muscle myosin thick filament assembly(GO:0071688) |
| 0.3 | 1.5 | GO:0035878 | nail development(GO:0035878) |
| 0.3 | 2.4 | GO:0043011 | myeloid dendritic cell differentiation(GO:0043011) |
| 0.3 | 2.4 | GO:0051601 | exocyst localization(GO:0051601) |
| 0.3 | 1.8 | GO:0030213 | hyaluronan biosynthetic process(GO:0030213) |
| 0.3 | 2.4 | GO:0032516 | positive regulation of phosphoprotein phosphatase activity(GO:0032516) |
| 0.3 | 1.8 | GO:1903020 | positive regulation of glycoprotein metabolic process(GO:1903020) |
| 0.3 | 5.8 | GO:0031167 | rRNA methylation(GO:0031167) |
| 0.3 | 2.6 | GO:0060707 | trophoblast giant cell differentiation(GO:0060707) |
| 0.3 | 10.2 | GO:1904837 | beta-catenin-TCF complex assembly(GO:1904837) |
| 0.3 | 0.6 | GO:0060708 | spongiotrophoblast differentiation(GO:0060708) |
| 0.3 | 3.4 | GO:0036065 | fucosylation(GO:0036065) |
| 0.3 | 0.8 | GO:0043570 | maintenance of DNA repeat elements(GO:0043570) |
| 0.3 | 3.7 | GO:0044803 | multi-organism membrane organization(GO:0044803) |
| 0.3 | 1.7 | GO:0045471 | response to ethanol(GO:0045471) |
| 0.3 | 2.8 | GO:0045109 | intermediate filament organization(GO:0045109) |
| 0.3 | 3.1 | GO:1902018 | negative regulation of cilium assembly(GO:1902018) |
| 0.3 | 4.2 | GO:2000114 | regulation of establishment of cell polarity(GO:2000114) |
| 0.3 | 1.1 | GO:2000189 | positive regulation of cholesterol homeostasis(GO:2000189) |
| 0.3 | 1.4 | GO:0030382 | sperm mitochondrion organization(GO:0030382) |
| 0.3 | 2.5 | GO:0051823 | regulation of synapse structural plasticity(GO:0051823) |
| 0.3 | 0.3 | GO:0042490 | mechanoreceptor differentiation(GO:0042490) |
| 0.3 | 0.8 | GO:0009583 | detection of light stimulus(GO:0009583) |
| 0.3 | 6.0 | GO:0061337 | cardiac conduction(GO:0061337) |
| 0.3 | 5.2 | GO:0032728 | positive regulation of interferon-beta production(GO:0032728) |
| 0.3 | 0.5 | GO:0048739 | cardiac muscle fiber development(GO:0048739) |
| 0.3 | 1.3 | GO:1904879 | positive regulation of calcium ion transmembrane transport via high voltage-gated calcium channel(GO:1904879) |
| 0.3 | 3.2 | GO:0033539 | fatty acid beta-oxidation using acyl-CoA dehydrogenase(GO:0033539) |
| 0.3 | 7.7 | GO:0032729 | positive regulation of interferon-gamma production(GO:0032729) |
| 0.3 | 1.9 | GO:0051388 | positive regulation of neurotrophin TRK receptor signaling pathway(GO:0051388) |
| 0.3 | 3.4 | GO:0010762 | regulation of fibroblast migration(GO:0010762) |
| 0.3 | 13.4 | GO:0071277 | cellular response to calcium ion(GO:0071277) |
| 0.3 | 0.8 | GO:0002727 | natural killer cell cytokine production(GO:0002370) regulation of natural killer cell cytokine production(GO:0002727) |
| 0.3 | 1.0 | GO:0030041 | actin filament polymerization(GO:0030041) |
| 0.3 | 2.1 | GO:1902951 | negative regulation of dendritic spine maintenance(GO:1902951) |
| 0.3 | 13.8 | GO:0006584 | catecholamine metabolic process(GO:0006584) catechol-containing compound metabolic process(GO:0009712) |
| 0.3 | 11.9 | GO:0007029 | endoplasmic reticulum organization(GO:0007029) |
| 0.3 | 1.3 | GO:0014850 | response to muscle activity(GO:0014850) |
| 0.3 | 2.6 | GO:0030949 | positive regulation of vascular endothelial growth factor receptor signaling pathway(GO:0030949) |
| 0.3 | 0.8 | GO:0051152 | positive regulation of smooth muscle cell differentiation(GO:0051152) |
| 0.3 | 0.8 | GO:0007501 | mesodermal cell fate specification(GO:0007501) |
| 0.3 | 1.3 | GO:1902202 | regulation of hepatocyte growth factor receptor signaling pathway(GO:1902202) |
| 0.3 | 1.3 | GO:0019805 | quinolinate biosynthetic process(GO:0019805) |
| 0.3 | 1.3 | GO:0006546 | glycine catabolic process(GO:0006546) glycine decarboxylation via glycine cleavage system(GO:0019464) |
| 0.3 | 0.5 | GO:0090385 | phagosome-lysosome fusion(GO:0090385) |
| 0.3 | 0.8 | GO:1903348 | positive regulation of bicellular tight junction assembly(GO:1903348) |
| 0.2 | 11.5 | GO:0018149 | peptide cross-linking(GO:0018149) |
| 0.2 | 1.7 | GO:0043984 | histone H4-K16 acetylation(GO:0043984) |
| 0.2 | 2.5 | GO:0035493 | SNARE complex assembly(GO:0035493) |
| 0.2 | 6.4 | GO:0030279 | negative regulation of ossification(GO:0030279) |
| 0.2 | 0.5 | GO:0010536 | positive regulation of activation of Janus kinase activity(GO:0010536) |
| 0.2 | 2.2 | GO:0022010 | central nervous system myelination(GO:0022010) axon ensheathment in central nervous system(GO:0032291) |
| 0.2 | 0.5 | GO:0061386 | closure of optic fissure(GO:0061386) negative regulation of integrin-mediated signaling pathway(GO:2001045) |
| 0.2 | 0.7 | GO:0002644 | negative regulation of tolerance induction(GO:0002644) |
| 0.2 | 1.4 | GO:0032483 | regulation of Rab protein signal transduction(GO:0032483) |
| 0.2 | 1.4 | GO:0036101 | leukotriene catabolic process(GO:0036100) leukotriene B4 catabolic process(GO:0036101) leukotriene B4 metabolic process(GO:0036102) icosanoid catabolic process(GO:1901523) fatty acid derivative catabolic process(GO:1901569) |
| 0.2 | 2.6 | GO:0035970 | peptidyl-threonine dephosphorylation(GO:0035970) |
| 0.2 | 3.0 | GO:0043374 | CD8-positive, alpha-beta T cell activation(GO:0036037) CD8-positive, alpha-beta T cell differentiation(GO:0043374) |
| 0.2 | 2.1 | GO:1901409 | positive regulation of phosphorylation of RNA polymerase II C-terminal domain(GO:1901409) |
| 0.2 | 1.9 | GO:0043030 | regulation of macrophage activation(GO:0043030) |
| 0.2 | 2.1 | GO:0043162 | ubiquitin-dependent protein catabolic process via the multivesicular body sorting pathway(GO:0043162) |
| 0.2 | 1.4 | GO:0051493 | regulation of cytoskeleton organization(GO:0051493) |
| 0.2 | 2.7 | GO:1901185 | negative regulation of ERBB signaling pathway(GO:1901185) |
| 0.2 | 0.9 | GO:0015793 | glycerol transport(GO:0015793) |
| 0.2 | 3.8 | GO:0046037 | GMP metabolic process(GO:0046037) |
| 0.2 | 1.1 | GO:0009181 | purine nucleoside diphosphate catabolic process(GO:0009137) purine ribonucleoside diphosphate catabolic process(GO:0009181) |
| 0.2 | 2.4 | GO:1904886 | beta-catenin destruction complex disassembly(GO:1904886) |
| 0.2 | 0.9 | GO:0048680 | positive regulation of axon regeneration(GO:0048680) |
| 0.2 | 3.2 | GO:0097178 | ruffle assembly(GO:0097178) |
| 0.2 | 1.3 | GO:0090037 | positive regulation of protein kinase C signaling(GO:0090037) |
| 0.2 | 0.9 | GO:0071467 | cellular response to pH(GO:0071467) |
| 0.2 | 4.8 | GO:0016338 | calcium-independent cell-cell adhesion via plasma membrane cell-adhesion molecules(GO:0016338) |
| 0.2 | 8.7 | GO:0042100 | B cell proliferation(GO:0042100) |
| 0.2 | 1.4 | GO:0032472 | Golgi calcium ion transport(GO:0032472) |
| 0.2 | 0.6 | GO:0010735 | positive regulation of transcription via serum response element binding(GO:0010735) |
| 0.2 | 1.8 | GO:0035414 | negative regulation of catenin import into nucleus(GO:0035414) |
| 0.2 | 0.6 | GO:0051451 | myoblast migration(GO:0051451) |
| 0.2 | 0.8 | GO:0042357 | thiamine diphosphate metabolic process(GO:0042357) |
| 0.2 | 5.6 | GO:0010107 | potassium ion import(GO:0010107) |
| 0.2 | 2.2 | GO:0045104 | intermediate filament cytoskeleton organization(GO:0045104) |
| 0.2 | 0.8 | GO:0060573 | ventral spinal cord interneuron specification(GO:0021521) cell fate specification involved in pattern specification(GO:0060573) |
| 0.2 | 1.2 | GO:2000479 | regulation of cAMP-dependent protein kinase activity(GO:2000479) |
| 0.2 | 1.0 | GO:0033622 | integrin activation(GO:0033622) |
| 0.2 | 2.0 | GO:2000811 | negative regulation of anoikis(GO:2000811) |
| 0.2 | 0.8 | GO:0009953 | dorsal/ventral pattern formation(GO:0009953) |
| 0.2 | 3.1 | GO:0048791 | calcium ion-regulated exocytosis of neurotransmitter(GO:0048791) |
| 0.2 | 2.3 | GO:0006359 | regulation of transcription from RNA polymerase III promoter(GO:0006359) |
| 0.2 | 2.1 | GO:0043046 | DNA methylation involved in gamete generation(GO:0043046) |
| 0.2 | 3.1 | GO:0050885 | neuromuscular process controlling balance(GO:0050885) |
| 0.2 | 0.4 | GO:0034311 | sphingosine metabolic process(GO:0006670) diol metabolic process(GO:0034311) |
| 0.2 | 0.2 | GO:0045075 | interleukin-12 biosynthetic process(GO:0042090) regulation of interleukin-12 biosynthetic process(GO:0045075) |
| 0.2 | 1.5 | GO:0016540 | protein autoprocessing(GO:0016540) |
| 0.2 | 0.6 | GO:0031076 | embryonic camera-type eye development(GO:0031076) |
| 0.2 | 1.9 | GO:0060716 | labyrinthine layer blood vessel development(GO:0060716) |
| 0.2 | 0.9 | GO:0031018 | endocrine pancreas development(GO:0031018) |
| 0.2 | 1.6 | GO:1990403 | embryonic brain development(GO:1990403) |
| 0.2 | 0.5 | GO:0070235 | regulation of activation-induced cell death of T cells(GO:0070235) negative regulation of activation-induced cell death of T cells(GO:0070236) |
| 0.2 | 2.7 | GO:0042574 | retinal metabolic process(GO:0042574) |
| 0.2 | 1.6 | GO:0050860 | negative regulation of T cell receptor signaling pathway(GO:0050860) |
| 0.2 | 1.8 | GO:0015886 | heme transport(GO:0015886) |
| 0.2 | 0.7 | GO:0003084 | positive regulation of systemic arterial blood pressure(GO:0003084) |
| 0.2 | 4.1 | GO:0018108 | peptidyl-tyrosine phosphorylation(GO:0018108) peptidyl-tyrosine modification(GO:0018212) |
| 0.2 | 3.3 | GO:0002250 | adaptive immune response(GO:0002250) |
| 0.2 | 1.0 | GO:0006562 | proline metabolic process(GO:0006560) proline catabolic process(GO:0006562) proline catabolic process to glutamate(GO:0010133) |
| 0.2 | 2.6 | GO:0097503 | sialylation(GO:0097503) |
| 0.2 | 0.2 | GO:0046398 | UDP-glucuronate biosynthetic process(GO:0006065) UDP-glucuronate metabolic process(GO:0046398) |
| 0.2 | 0.8 | GO:0097623 | potassium ion export across plasma membrane(GO:0097623) |
| 0.2 | 2.5 | GO:0021904 | dorsal/ventral neural tube patterning(GO:0021904) |
| 0.2 | 0.7 | GO:0034378 | chylomicron assembly(GO:0034378) |
| 0.2 | 0.7 | GO:0001188 | RNA polymerase I transcriptional preinitiation complex assembly(GO:0001188) RNA polymerase I transcriptional preinitiation complex assembly at the promoter for the nuclear large rRNA transcript(GO:0001189) |
| 0.2 | 3.0 | GO:2000463 | positive regulation of excitatory postsynaptic potential(GO:2000463) |
| 0.2 | 0.8 | GO:0032224 | positive regulation of synaptic transmission, cholinergic(GO:0032224) |
| 0.2 | 2.1 | GO:0045745 | positive regulation of G-protein coupled receptor protein signaling pathway(GO:0045745) |
| 0.2 | 2.9 | GO:0019373 | epoxygenase P450 pathway(GO:0019373) |
| 0.2 | 0.8 | GO:0032509 | endosome transport via multivesicular body sorting pathway(GO:0032509) endosome to lysosome transport via multivesicular body sorting pathway(GO:0032510) |
| 0.2 | 1.0 | GO:0007023 | post-chaperonin tubulin folding pathway(GO:0007023) |
| 0.2 | 16.7 | GO:0071805 | cellular potassium ion transport(GO:0071804) potassium ion transmembrane transport(GO:0071805) |
| 0.2 | 0.6 | GO:0035879 | plasma membrane lactate transport(GO:0035879) |
| 0.2 | 4.4 | GO:0007205 | protein kinase C-activating G-protein coupled receptor signaling pathway(GO:0007205) |
| 0.2 | 93.5 | GO:0043547 | positive regulation of GTPase activity(GO:0043547) |
| 0.2 | 1.5 | GO:0010745 | negative regulation of macrophage derived foam cell differentiation(GO:0010745) |
| 0.2 | 1.1 | GO:0009650 | UV protection(GO:0009650) |
| 0.2 | 1.4 | GO:0045329 | carnitine biosynthetic process(GO:0045329) |
| 0.2 | 0.6 | GO:1902894 | negative regulation of pri-miRNA transcription from RNA polymerase II promoter(GO:1902894) |
| 0.2 | 1.5 | GO:0034975 | protein folding in endoplasmic reticulum(GO:0034975) |
| 0.2 | 1.4 | GO:0006682 | galactosylceramide biosynthetic process(GO:0006682) galactolipid biosynthetic process(GO:0019375) |
| 0.2 | 3.6 | GO:0019433 | triglyceride catabolic process(GO:0019433) |
| 0.2 | 5.0 | GO:0072488 | ammonium transmembrane transport(GO:0072488) |
| 0.1 | 5.2 | GO:0038083 | peptidyl-tyrosine autophosphorylation(GO:0038083) |
| 0.1 | 1.5 | GO:0014883 | transition between fast and slow fiber(GO:0014883) |
| 0.1 | 0.7 | GO:1902412 | regulation of mitotic cytokinesis(GO:1902412) |
| 0.1 | 2.6 | GO:0071425 | hematopoietic stem cell proliferation(GO:0071425) |
| 0.1 | 1.4 | GO:0003170 | heart valve development(GO:0003170) |
| 0.1 | 0.7 | GO:0010919 | regulation of inositol phosphate biosynthetic process(GO:0010919) inositol phosphate biosynthetic process(GO:0032958) positive regulation of inositol phosphate biosynthetic process(GO:0060732) |
| 0.1 | 2.2 | GO:0006825 | copper ion transport(GO:0006825) |
| 0.1 | 0.6 | GO:0042058 | regulation of epidermal growth factor receptor signaling pathway(GO:0042058) |
| 0.1 | 1.0 | GO:0032495 | response to muramyl dipeptide(GO:0032495) |
| 0.1 | 2.3 | GO:0019054 | modulation by virus of host process(GO:0019054) |
| 0.1 | 0.8 | GO:0034755 | iron ion transmembrane transport(GO:0034755) |
| 0.1 | 2.0 | GO:1900449 | regulation of glutamate receptor signaling pathway(GO:1900449) |
| 0.1 | 0.7 | GO:0060021 | palate development(GO:0060021) |
| 0.1 | 0.5 | GO:0036337 | Fas signaling pathway(GO:0036337) regulation of Fas signaling pathway(GO:1902044) positive regulation of blood vessel remodeling(GO:2000504) |
| 0.1 | 0.5 | GO:0035616 | histone H2B conserved C-terminal lysine deubiquitination(GO:0035616) |
| 0.1 | 1.2 | GO:1902916 | positive regulation of protein polyubiquitination(GO:1902916) |
| 0.1 | 1.1 | GO:0006068 | ethanol metabolic process(GO:0006067) ethanol catabolic process(GO:0006068) |
| 0.1 | 0.8 | GO:2001224 | positive regulation of neuron migration(GO:2001224) |
| 0.1 | 1.3 | GO:0060644 | mammary gland epithelial cell differentiation(GO:0060644) |
| 0.1 | 10.4 | GO:0006024 | aminoglycan biosynthetic process(GO:0006023) glycosaminoglycan biosynthetic process(GO:0006024) |
| 0.1 | 0.3 | GO:0009732 | detection of carbohydrate stimulus(GO:0009730) detection of hexose stimulus(GO:0009732) detection of monosaccharide stimulus(GO:0034287) detection of glucose(GO:0051594) |
| 0.1 | 0.6 | GO:0030263 | apoptotic chromosome condensation(GO:0030263) |
| 0.1 | 1.0 | GO:0097296 | activation of cysteine-type endopeptidase activity involved in apoptotic signaling pathway(GO:0097296) |
| 0.1 | 1.1 | GO:0014029 | neural crest formation(GO:0014029) |
| 0.1 | 1.4 | GO:0006833 | water transport(GO:0006833) |
| 0.1 | 1.7 | GO:0014075 | response to amine(GO:0014075) |
| 0.1 | 1.8 | GO:0032007 | negative regulation of TOR signaling(GO:0032007) |
| 0.1 | 0.1 | GO:2000696 | regulation of epithelial cell differentiation involved in kidney development(GO:2000696) |
| 0.1 | 0.5 | GO:0044387 | negative regulation of protein kinase activity by regulation of protein phosphorylation(GO:0044387) |
| 0.1 | 6.3 | GO:1902476 | chloride transmembrane transport(GO:1902476) |
| 0.1 | 3.0 | GO:0006022 | aminoglycan metabolic process(GO:0006022) glycosaminoglycan metabolic process(GO:0030203) |
| 0.1 | 0.9 | GO:2001239 | regulation of extrinsic apoptotic signaling pathway in absence of ligand(GO:2001239) |
| 0.1 | 2.1 | GO:0010172 | embryonic body morphogenesis(GO:0010172) |
| 0.1 | 1.3 | GO:0006198 | cAMP catabolic process(GO:0006198) |
| 0.1 | 6.6 | GO:0030574 | collagen catabolic process(GO:0030574) |
| 0.1 | 0.7 | GO:2000401 | regulation of lymphocyte migration(GO:2000401) |
| 0.1 | 0.8 | GO:0007506 | gonadal mesoderm development(GO:0007506) |
| 0.1 | 1.0 | GO:0032331 | negative regulation of chondrocyte differentiation(GO:0032331) |
| 0.1 | 2.5 | GO:0050779 | RNA destabilization(GO:0050779) |
| 0.1 | 1.3 | GO:0035590 | purinergic nucleotide receptor signaling pathway(GO:0035590) |
| 0.1 | 2.0 | GO:0007368 | determination of left/right symmetry(GO:0007368) |
| 0.1 | 1.1 | GO:0048003 | antigen processing and presentation of lipid antigen via MHC class Ib(GO:0048003) antigen processing and presentation, exogenous lipid antigen via MHC class Ib(GO:0048007) |
| 0.1 | 0.9 | GO:0036158 | outer dynein arm assembly(GO:0036158) |
| 0.1 | 0.3 | GO:2000848 | positive regulation of corticosteroid hormone secretion(GO:2000848) positive regulation of mineralocorticoid secretion(GO:2000857) positive regulation of aldosterone secretion(GO:2000860) |
| 0.1 | 1.3 | GO:0046513 | ceramide biosynthetic process(GO:0046513) |
| 0.1 | 0.3 | GO:0046900 | tetrahydrofolylpolyglutamate metabolic process(GO:0046900) |
| 0.1 | 3.7 | GO:0002088 | lens development in camera-type eye(GO:0002088) |
| 0.1 | 3.1 | GO:0060395 | SMAD protein signal transduction(GO:0060395) |
| 0.1 | 0.2 | GO:0097501 | stress response to metal ion(GO:0097501) |
| 0.1 | 1.3 | GO:0010761 | fibroblast migration(GO:0010761) |
| 0.1 | 3.0 | GO:0050715 | positive regulation of cytokine secretion(GO:0050715) |
| 0.1 | 4.9 | GO:0006968 | cellular defense response(GO:0006968) |
| 0.1 | 0.8 | GO:0098734 | macromolecule depalmitoylation(GO:0098734) |
| 0.1 | 0.5 | GO:0030800 | negative regulation of cyclic nucleotide metabolic process(GO:0030800) negative regulation of cAMP metabolic process(GO:0030815) |
| 0.1 | 0.3 | GO:0048305 | immunoglobulin secretion(GO:0048305) |
| 0.1 | 1.1 | GO:0071174 | mitotic spindle assembly checkpoint(GO:0007094) spindle checkpoint(GO:0031577) negative regulation of sister chromatid segregation(GO:0033046) negative regulation of mitotic sister chromatid segregation(GO:0033048) negative regulation of mitotic metaphase/anaphase transition(GO:0045841) negative regulation of chromosome segregation(GO:0051985) spindle assembly checkpoint(GO:0071173) mitotic spindle checkpoint(GO:0071174) negative regulation of metaphase/anaphase transition of cell cycle(GO:1902100) negative regulation of mitotic sister chromatid separation(GO:2000816) |
| 0.1 | 0.2 | GO:0060748 | tertiary branching involved in mammary gland duct morphogenesis(GO:0060748) |
| 0.1 | 1.5 | GO:0006895 | Golgi to endosome transport(GO:0006895) |
| 0.1 | 0.6 | GO:0031629 | synaptic vesicle fusion to presynaptic active zone membrane(GO:0031629) vesicle fusion to plasma membrane(GO:0099500) |
| 0.1 | 0.7 | GO:0045124 | regulation of bone resorption(GO:0045124) |
| 0.1 | 1.2 | GO:0007507 | heart development(GO:0007507) |
| 0.1 | 0.5 | GO:0036295 | cellular response to increased oxygen levels(GO:0036295) |
| 0.1 | 0.5 | GO:0001502 | cartilage condensation(GO:0001502) |
| 0.1 | 4.1 | GO:0006501 | C-terminal protein lipidation(GO:0006501) |
| 0.1 | 0.4 | GO:0006177 | GMP biosynthetic process(GO:0006177) |
| 0.1 | 0.1 | GO:0003418 | growth plate cartilage chondrocyte differentiation(GO:0003418) |
| 0.1 | 0.4 | GO:0050654 | chondroitin sulfate metabolic process(GO:0030204) chondroitin sulfate proteoglycan metabolic process(GO:0050654) |
| 0.1 | 4.7 | GO:0050776 | regulation of immune response(GO:0050776) |
| 0.1 | 0.6 | GO:0052696 | flavonoid glucuronidation(GO:0052696) xenobiotic glucuronidation(GO:0052697) |
| 0.1 | 3.3 | GO:0006400 | tRNA modification(GO:0006400) |
| 0.1 | 0.6 | GO:0034656 | nucleobase-containing small molecule catabolic process(GO:0034656) |
| 0.1 | 0.6 | GO:0032755 | positive regulation of interleukin-6 production(GO:0032755) |
| 0.1 | 2.8 | GO:0030218 | erythrocyte differentiation(GO:0030218) |
| 0.1 | 0.3 | GO:0045741 | positive regulation of epidermal growth factor-activated receptor activity(GO:0045741) |
| 0.1 | 0.9 | GO:0031532 | actin cytoskeleton reorganization(GO:0031532) |
| 0.1 | 0.3 | GO:0060033 | anatomical structure regression(GO:0060033) |
| 0.1 | 0.4 | GO:0032469 | endoplasmic reticulum calcium ion homeostasis(GO:0032469) |
| 0.1 | 0.5 | GO:0007257 | activation of JUN kinase activity(GO:0007257) |
| 0.1 | 0.4 | GO:0016559 | peroxisome fission(GO:0016559) |
| 0.1 | 0.8 | GO:0030517 | negative regulation of axon extension(GO:0030517) |
| 0.1 | 1.2 | GO:0014047 | glutamate secretion(GO:0014047) |
| 0.1 | 1.7 | GO:0009409 | response to cold(GO:0009409) |
| 0.1 | 1.1 | GO:0051482 | positive regulation of cytosolic calcium ion concentration involved in phospholipase C-activating G-protein coupled signaling pathway(GO:0051482) |
| 0.0 | 1.3 | GO:1903779 | regulation of cardiac conduction(GO:1903779) |
| 0.0 | 0.2 | GO:0033344 | cholesterol efflux(GO:0033344) |
| 0.0 | 1.8 | GO:0006687 | glycosphingolipid metabolic process(GO:0006687) |
| 0.0 | 2.7 | GO:0030010 | establishment of cell polarity(GO:0030010) |
| 0.0 | 0.4 | GO:0017187 | peptidyl-glutamic acid carboxylation(GO:0017187) protein carboxylation(GO:0018214) |
| 0.0 | 0.4 | GO:0045747 | positive regulation of Notch signaling pathway(GO:0045747) |
| 0.0 | 0.1 | GO:0097286 | iron ion import(GO:0097286) |
| 0.0 | 0.1 | GO:0090131 | mesenchyme migration(GO:0090131) |
| 0.0 | 0.3 | GO:0033137 | negative regulation of peptidyl-serine phosphorylation(GO:0033137) |
| 0.0 | 1.4 | GO:0015721 | bile acid and bile salt transport(GO:0015721) |
| 0.0 | 0.9 | GO:0060828 | regulation of canonical Wnt signaling pathway(GO:0060828) |
| 0.0 | 0.6 | GO:0007597 | blood coagulation, intrinsic pathway(GO:0007597) |
| 0.0 | 0.4 | GO:0051775 | response to redox state(GO:0051775) |
| 0.0 | 0.4 | GO:0035088 | establishment or maintenance of apical/basal cell polarity(GO:0035088) establishment or maintenance of bipolar cell polarity(GO:0061245) |
| 0.0 | 1.0 | GO:0050913 | sensory perception of bitter taste(GO:0050913) |
| 0.0 | 0.3 | GO:0001573 | ganglioside metabolic process(GO:0001573) |
| 0.0 | 0.3 | GO:0007616 | long-term memory(GO:0007616) |
| 0.0 | 0.2 | GO:0098780 | response to mitochondrial depolarisation(GO:0098780) |
| 0.0 | 0.2 | GO:0042472 | inner ear morphogenesis(GO:0042472) |
| 0.0 | 1.9 | GO:0007608 | sensory perception of smell(GO:0007608) |
| 0.0 | 0.4 | GO:0001541 | ovarian follicle development(GO:0001541) |
| 0.0 | 0.1 | GO:1903033 | regulation of microtubule plus-end binding(GO:1903031) positive regulation of microtubule plus-end binding(GO:1903033) positive regulation of microtubule binding(GO:1904528) |
| 0.0 | 0.5 | GO:0018198 | peptidyl-cysteine modification(GO:0018198) |
| 0.0 | 0.5 | GO:0000470 | maturation of LSU-rRNA(GO:0000470) |
| 0.0 | 1.5 | GO:0002431 | Fc receptor mediated stimulatory signaling pathway(GO:0002431) |
| 0.0 | 0.9 | GO:0019985 | translesion synthesis(GO:0019985) |
| 0.0 | 0.2 | GO:0000183 | chromatin silencing at rDNA(GO:0000183) |
| 0.0 | 0.5 | GO:0061178 | regulation of insulin secretion involved in cellular response to glucose stimulus(GO:0061178) |
| 0.0 | 0.2 | GO:0030970 | retrograde protein transport, ER to cytosol(GO:0030970) |
| 0.0 | 0.6 | GO:0007586 | digestion(GO:0007586) |
| 0.0 | 0.2 | GO:0000395 | mRNA 5'-splice site recognition(GO:0000395) |
| 0.0 | 1.2 | GO:0007224 | smoothened signaling pathway(GO:0007224) |
| 0.0 | 1.6 | GO:0006836 | neurotransmitter transport(GO:0006836) |
| 0.0 | 0.5 | GO:0015804 | neutral amino acid transport(GO:0015804) |
| 0.0 | 0.5 | GO:0000042 | protein targeting to Golgi(GO:0000042) |
| 0.0 | 0.3 | GO:0007173 | epidermal growth factor receptor signaling pathway(GO:0007173) |
| 0.0 | 0.2 | GO:0035082 | axoneme assembly(GO:0035082) |
| 0.0 | 1.0 | GO:0060333 | interferon-gamma-mediated signaling pathway(GO:0060333) |
| 0.0 | 0.0 | GO:0031223 | auditory behavior(GO:0031223) |
| 0.0 | 0.2 | GO:0016973 | poly(A)+ mRNA export from nucleus(GO:0016973) |
| 0.0 | 0.3 | GO:0034308 | primary alcohol metabolic process(GO:0034308) |
| 0.0 | 0.1 | GO:0043243 | positive regulation of protein complex disassembly(GO:0043243) |
| 0.0 | 0.1 | GO:0035640 | exploration behavior(GO:0035640) |
| 0.0 | 0.5 | GO:0043171 | peptide catabolic process(GO:0043171) |
| 0.0 | 0.1 | GO:0007200 | phospholipase C-activating G-protein coupled receptor signaling pathway(GO:0007200) |
Gene overrepresentation in cellular_component category:
| Log-likelihood per target | Total log-likelihood | Term | Description |
|---|---|---|---|
| 8.1 | 24.4 | GO:0060053 | neurofilament cytoskeleton(GO:0060053) |
| 6.7 | 33.5 | GO:0034688 | integrin alphaM-beta2 complex(GO:0034688) |
| 3.5 | 13.8 | GO:0000333 | telomerase catalytic core complex(GO:0000333) |
| 3.1 | 9.4 | GO:0002139 | stereocilia coupling link(GO:0002139) |
| 2.3 | 11.6 | GO:0005602 | complement component C1 complex(GO:0005602) |
| 2.3 | 11.4 | GO:1990761 | growth cone lamellipodium(GO:1990761) |
| 2.2 | 13.4 | GO:1990584 | cardiac Troponin complex(GO:1990584) |
| 2.2 | 6.5 | GO:0020005 | symbiont-containing vacuole(GO:0020003) symbiont-containing vacuole membrane(GO:0020005) |
| 2.2 | 8.7 | GO:0030132 | clathrin coat of coated pit(GO:0030132) |
| 2.1 | 6.3 | GO:0071745 | IgA immunoglobulin complex(GO:0071745) IgA immunoglobulin complex, circulating(GO:0071746) monomeric IgA immunoglobulin complex(GO:0071748) polymeric IgA immunoglobulin complex(GO:0071749) secretory IgA immunoglobulin complex(GO:0071751) |
| 1.9 | 47.6 | GO:0008074 | guanylate cyclase complex, soluble(GO:0008074) |
| 1.9 | 13.0 | GO:0097013 | phagocytic vesicle lumen(GO:0097013) |
| 1.8 | 7.1 | GO:0043293 | apoptosome(GO:0043293) |
| 1.8 | 22.9 | GO:0097433 | dense body(GO:0097433) |
| 1.8 | 5.3 | GO:0019008 | molybdopterin synthase complex(GO:0019008) |
| 1.8 | 35.1 | GO:0001891 | phagocytic cup(GO:0001891) |
| 1.7 | 8.5 | GO:0036398 | TCR signalosome(GO:0036398) |
| 1.7 | 6.8 | GO:0031417 | NatC complex(GO:0031417) |
| 1.6 | 11.5 | GO:0030061 | mitochondrial crista(GO:0030061) |
| 1.6 | 7.9 | GO:0060091 | kinocilium(GO:0060091) |
| 1.5 | 4.5 | GO:0019012 | virion(GO:0019012) virion part(GO:0044423) |
| 1.5 | 10.3 | GO:0000137 | Golgi cis cisterna(GO:0000137) |
| 1.5 | 14.7 | GO:0097197 | tetraspanin-enriched microdomain(GO:0097197) |
| 1.4 | 23.8 | GO:0001518 | voltage-gated sodium channel complex(GO:0001518) |
| 1.4 | 11.1 | GO:0032010 | phagolysosome(GO:0032010) |
| 1.4 | 6.9 | GO:0005947 | mitochondrial alpha-ketoglutarate dehydrogenase complex(GO:0005947) |
| 1.4 | 15.1 | GO:0060077 | inhibitory synapse(GO:0060077) |
| 1.4 | 20.4 | GO:0097386 | glial cell projection(GO:0097386) |
| 1.3 | 4.0 | GO:0065010 | extracellular membrane-bounded organelle(GO:0065010) |
| 1.3 | 18.1 | GO:0036038 | MKS complex(GO:0036038) |
| 1.3 | 26.9 | GO:0042613 | MHC class II protein complex(GO:0042613) |
| 1.3 | 3.8 | GO:0019034 | viral replication complex(GO:0019034) |
| 1.2 | 6.0 | GO:0044530 | supraspliceosomal complex(GO:0044530) |
| 1.2 | 16.7 | GO:0035102 | PRC1 complex(GO:0035102) |
| 1.2 | 8.2 | GO:0019815 | B cell receptor complex(GO:0019815) |
| 1.2 | 21.0 | GO:0005890 | sodium:potassium-exchanging ATPase complex(GO:0005890) |
| 1.1 | 9.2 | GO:0060203 | clathrin-sculpted glutamate transport vesicle(GO:0060199) clathrin-sculpted glutamate transport vesicle membrane(GO:0060203) |
| 1.1 | 3.4 | GO:0034686 | integrin alphav-beta8 complex(GO:0034686) |
| 1.1 | 4.5 | GO:0031256 | leading edge membrane(GO:0031256) |
| 1.1 | 31.9 | GO:0044298 | neuronal cell body membrane(GO:0032809) cell body membrane(GO:0044298) |
| 1.1 | 2.2 | GO:0070044 | synaptobrevin 2-SNAP-25-syntaxin-1a complex(GO:0070044) |
| 1.1 | 13.9 | GO:0034992 | microtubule organizing center attachment site(GO:0034992) LINC complex(GO:0034993) |
| 1.1 | 22.2 | GO:0014731 | spectrin-associated cytoskeleton(GO:0014731) |
| 1.0 | 3.1 | GO:0008282 | ATP-sensitive potassium channel complex(GO:0008282) |
| 1.0 | 5.1 | GO:0045298 | tubulin complex(GO:0045298) |
| 1.0 | 12.0 | GO:0098563 | integral component of synaptic vesicle membrane(GO:0030285) intrinsic component of synaptic vesicle membrane(GO:0098563) |
| 1.0 | 4.0 | GO:0005896 | interleukin-6 receptor complex(GO:0005896) |
| 1.0 | 5.0 | GO:0008275 | gamma-tubulin small complex(GO:0008275) |
| 1.0 | 2.0 | GO:0030863 | cortical cytoskeleton(GO:0030863) |
| 1.0 | 7.8 | GO:0042788 | polysomal ribosome(GO:0042788) |
| 1.0 | 3.8 | GO:1990604 | IRE1-TRAF2-ASK1 complex(GO:1990604) |
| 0.9 | 8.2 | GO:0005579 | membrane attack complex(GO:0005579) |
| 0.9 | 5.3 | GO:1990682 | CSF1-CSF1R complex(GO:1990682) |
| 0.9 | 8.8 | GO:0070775 | H3 histone acetyltransferase complex(GO:0070775) MOZ/MORF histone acetyltransferase complex(GO:0070776) |
| 0.9 | 21.1 | GO:0042627 | chylomicron(GO:0042627) |
| 0.9 | 4.4 | GO:0008622 | epsilon DNA polymerase complex(GO:0008622) |
| 0.9 | 6.1 | GO:0097165 | nuclear stress granule(GO:0097165) |
| 0.9 | 8.6 | GO:0034366 | spherical high-density lipoprotein particle(GO:0034366) |
| 0.9 | 7.7 | GO:0070022 | transforming growth factor beta receptor homodimeric complex(GO:0070022) |
| 0.8 | 5.9 | GO:0046581 | intercellular canaliculus(GO:0046581) |
| 0.8 | 5.8 | GO:1903440 | calcitonin family receptor complex(GO:1903439) amylin receptor complex(GO:1903440) |
| 0.8 | 1.7 | GO:0016013 | syntrophin complex(GO:0016013) |
| 0.8 | 9.1 | GO:0042105 | alpha-beta T cell receptor complex(GO:0042105) |
| 0.8 | 2.4 | GO:0097058 | CRLF-CLCF1 complex(GO:0097058) |
| 0.8 | 3.1 | GO:0036128 | CatSper complex(GO:0036128) |
| 0.8 | 6.2 | GO:0000322 | storage vacuole(GO:0000322) |
| 0.8 | 16.9 | GO:0043205 | microfibril(GO:0001527) fibril(GO:0043205) |
| 0.8 | 17.5 | GO:0032839 | dendrite cytoplasm(GO:0032839) |
| 0.8 | 6.1 | GO:0005827 | polar microtubule(GO:0005827) |
| 0.8 | 5.3 | GO:0072687 | meiotic spindle(GO:0072687) |
| 0.8 | 3.8 | GO:0005594 | collagen type IX trimer(GO:0005594) |
| 0.8 | 2.3 | GO:0097418 | neurofibrillary tangle(GO:0097418) |
| 0.8 | 2.3 | GO:0000438 | core TFIIH complex portion of holo TFIIH complex(GO:0000438) |
| 0.8 | 11.3 | GO:0031235 | intrinsic component of the cytoplasmic side of the plasma membrane(GO:0031235) |
| 0.7 | 9.0 | GO:0099634 | postsynaptic specialization membrane(GO:0099634) |
| 0.7 | 2.2 | GO:1990015 | mesaxon(GO:0097453) ensheathing process(GO:1990015) |
| 0.7 | 1.5 | GO:0098592 | cytoplasmic side of apical plasma membrane(GO:0098592) |
| 0.7 | 3.6 | GO:0042629 | mast cell granule(GO:0042629) |
| 0.7 | 7.2 | GO:0043190 | ATP-binding cassette (ABC) transporter complex(GO:0043190) |
| 0.7 | 13.3 | GO:0005885 | Arp2/3 protein complex(GO:0005885) |
| 0.7 | 4.9 | GO:0097209 | epidermal lamellar body(GO:0097209) |
| 0.7 | 8.4 | GO:0005642 | annulate lamellae(GO:0005642) |
| 0.7 | 11.1 | GO:0005671 | Ada2/Gcn5/Ada3 transcription activator complex(GO:0005671) |
| 0.7 | 70.0 | GO:0008076 | voltage-gated potassium channel complex(GO:0008076) potassium channel complex(GO:0034705) |
| 0.7 | 2.0 | GO:0071595 | Nem1-Spo7 phosphatase complex(GO:0071595) |
| 0.7 | 1.3 | GO:0031905 | early endosome lumen(GO:0031905) |
| 0.7 | 1.3 | GO:0034657 | GID complex(GO:0034657) |
| 0.7 | 17.6 | GO:0051233 | spindle midzone(GO:0051233) |
| 0.6 | 2.6 | GO:0071062 | alphav-beta3 integrin-vitronectin complex(GO:0071062) |
| 0.6 | 3.2 | GO:0089717 | spanning component of plasma membrane(GO:0044214) spanning component of membrane(GO:0089717) |
| 0.6 | 3.8 | GO:0033061 | DNA recombinase mediator complex(GO:0033061) Rad51B-Rad51C-Rad51D-XRCC2 complex(GO:0033063) |
| 0.6 | 3.8 | GO:1990316 | ATG1/ULK1 kinase complex(GO:1990316) |
| 0.6 | 10.0 | GO:0031089 | platelet dense granule lumen(GO:0031089) |
| 0.6 | 5.0 | GO:0035976 | AP1 complex(GO:0035976) |
| 0.6 | 5.6 | GO:0000220 | vacuolar proton-transporting V-type ATPase, V0 domain(GO:0000220) |
| 0.6 | 0.6 | GO:0036195 | muscle cell projection(GO:0036194) muscle cell projection membrane(GO:0036195) |
| 0.6 | 3.6 | GO:0032444 | activin responsive factor complex(GO:0032444) |
| 0.6 | 5.4 | GO:0005638 | lamin filament(GO:0005638) |
| 0.6 | 4.2 | GO:0097452 | GAIT complex(GO:0097452) |
| 0.6 | 3.5 | GO:0070436 | Grb2-EGFR complex(GO:0070436) |
| 0.6 | 14.6 | GO:0097381 | photoreceptor disc membrane(GO:0097381) |
| 0.6 | 7.0 | GO:0005905 | clathrin-coated pit(GO:0005905) |
| 0.6 | 27.2 | GO:0019814 | immunoglobulin complex(GO:0019814) |
| 0.6 | 1.7 | GO:0097440 | apical dendrite(GO:0097440) |
| 0.6 | 4.5 | GO:0043196 | varicosity(GO:0043196) |
| 0.5 | 4.9 | GO:0016461 | unconventional myosin complex(GO:0016461) |
| 0.5 | 7.1 | GO:0030478 | actin cap(GO:0030478) |
| 0.5 | 1.1 | GO:0030135 | coated vesicle(GO:0030135) COPI-coated vesicle(GO:0030137) |
| 0.5 | 13.3 | GO:0030658 | transport vesicle membrane(GO:0030658) |
| 0.5 | 4.6 | GO:0032797 | SMN complex(GO:0032797) |
| 0.5 | 5.5 | GO:0036513 | Derlin-1 retrotranslocation complex(GO:0036513) |
| 0.5 | 5.9 | GO:0043083 | synaptic cleft(GO:0043083) |
| 0.5 | 1.0 | GO:1990075 | periciliary membrane compartment(GO:1990075) |
| 0.5 | 2.9 | GO:0009331 | glycerol-3-phosphate dehydrogenase complex(GO:0009331) |
| 0.5 | 7.9 | GO:1990124 | messenger ribonucleoprotein complex(GO:1990124) |
| 0.5 | 8.3 | GO:0071141 | SMAD protein complex(GO:0071141) |
| 0.5 | 4.1 | GO:0008024 | cyclin/CDK positive transcription elongation factor complex(GO:0008024) |
| 0.4 | 3.1 | GO:0097361 | CIA complex(GO:0097361) |
| 0.4 | 3.9 | GO:0031464 | Cul4A-RING E3 ubiquitin ligase complex(GO:0031464) |
| 0.4 | 2.2 | GO:0032541 | cortical endoplasmic reticulum(GO:0032541) |
| 0.4 | 26.6 | GO:0031463 | Cul3-RING ubiquitin ligase complex(GO:0031463) |
| 0.4 | 28.9 | GO:0099501 | synaptic vesicle membrane(GO:0030672) exocytic vesicle membrane(GO:0099501) |
| 0.4 | 57.2 | GO:0032587 | ruffle membrane(GO:0032587) |
| 0.4 | 2.5 | GO:0032311 | angiogenin-PRI complex(GO:0032311) |
| 0.4 | 1.3 | GO:0005960 | glycine cleavage complex(GO:0005960) |
| 0.4 | 3.3 | GO:0033391 | chromatoid body(GO:0033391) |
| 0.4 | 4.9 | GO:0030666 | endocytic vesicle membrane(GO:0030666) |
| 0.4 | 2.0 | GO:0035867 | alphav-beta3 integrin-IGF-1-IGF1R complex(GO:0035867) |
| 0.4 | 2.8 | GO:1904949 | ATPase dependent transmembrane transport complex(GO:0098533) ATPase complex(GO:1904949) |
| 0.4 | 1.6 | GO:0042101 | T cell receptor complex(GO:0042101) |
| 0.4 | 33.2 | GO:0005796 | Golgi lumen(GO:0005796) |
| 0.4 | 10.8 | GO:0044322 | endoplasmic reticulum quality control compartment(GO:0044322) |
| 0.4 | 1.6 | GO:0032777 | Piccolo NuA4 histone acetyltransferase complex(GO:0032777) |
| 0.4 | 1.5 | GO:0043625 | delta DNA polymerase complex(GO:0043625) |
| 0.4 | 3.1 | GO:0090576 | RNA polymerase III transcription factor complex(GO:0090576) |
| 0.4 | 5.6 | GO:0001931 | uropod(GO:0001931) cell trailing edge(GO:0031254) |
| 0.4 | 1.5 | GO:0032144 | 4-aminobutyrate transaminase complex(GO:0032144) |
| 0.4 | 4.4 | GO:1990454 | L-type voltage-gated calcium channel complex(GO:1990454) |
| 0.4 | 6.9 | GO:0005849 | mRNA cleavage factor complex(GO:0005849) |
| 0.4 | 1.8 | GO:0032021 | NELF complex(GO:0032021) |
| 0.4 | 18.6 | GO:0005776 | autophagosome(GO:0005776) |
| 0.3 | 5.9 | GO:0030119 | AP-type membrane coat adaptor complex(GO:0030119) |
| 0.3 | 4.9 | GO:0031588 | nucleotide-activated protein kinase complex(GO:0031588) |
| 0.3 | 4.2 | GO:0071437 | invadopodium(GO:0071437) |
| 0.3 | 1.4 | GO:0042567 | insulin-like growth factor ternary complex(GO:0042567) |
| 0.3 | 1.0 | GO:1990635 | proximal dendrite(GO:1990635) |
| 0.3 | 1.0 | GO:0070081 | clathrin-sculpted monoamine transport vesicle(GO:0070081) clathrin-sculpted monoamine transport vesicle membrane(GO:0070083) |
| 0.3 | 2.7 | GO:0031462 | Cul2-RING ubiquitin ligase complex(GO:0031462) |
| 0.3 | 2.4 | GO:0005652 | nuclear lamina(GO:0005652) |
| 0.3 | 4.3 | GO:0043020 | NADPH oxidase complex(GO:0043020) |
| 0.3 | 3.3 | GO:1990712 | HFE-transferrin receptor complex(GO:1990712) |
| 0.3 | 1.6 | GO:0042575 | DNA polymerase complex(GO:0042575) |
| 0.3 | 3.9 | GO:0001772 | immunological synapse(GO:0001772) |
| 0.3 | 18.8 | GO:0036064 | ciliary basal body(GO:0036064) |
| 0.3 | 3.5 | GO:0042612 | MHC class I protein complex(GO:0042612) |
| 0.3 | 2.9 | GO:0016342 | catenin complex(GO:0016342) |
| 0.3 | 1.3 | GO:0044611 | nuclear pore inner ring(GO:0044611) |
| 0.3 | 8.2 | GO:0034451 | centriolar satellite(GO:0034451) |
| 0.3 | 1.3 | GO:0032391 | photoreceptor connecting cilium(GO:0032391) |
| 0.3 | 4.7 | GO:0031083 | BLOC-1 complex(GO:0031083) |
| 0.3 | 8.4 | GO:0031092 | platelet alpha granule membrane(GO:0031092) |
| 0.3 | 3.1 | GO:0042588 | zymogen granule(GO:0042588) |
| 0.3 | 0.6 | GO:1990622 | CHOP-ATF3 complex(GO:1990622) |
| 0.3 | 5.2 | GO:0046658 | anchored component of plasma membrane(GO:0046658) |
| 0.3 | 0.9 | GO:0030895 | apolipoprotein B mRNA editing enzyme complex(GO:0030895) |
| 0.3 | 1.8 | GO:0032807 | DNA-dependent protein kinase-DNA ligase 4 complex(GO:0005958) DNA ligase IV complex(GO:0032807) |
| 0.3 | 0.6 | GO:0033268 | node of Ranvier(GO:0033268) |
| 0.3 | 2.1 | GO:0044615 | nuclear pore nuclear basket(GO:0044615) |
| 0.3 | 16.9 | GO:0030134 | ER to Golgi transport vesicle(GO:0030134) |
| 0.3 | 42.1 | GO:0043202 | lysosomal lumen(GO:0043202) |
| 0.3 | 2.7 | GO:0001750 | photoreceptor outer segment(GO:0001750) |
| 0.3 | 4.7 | GO:0097546 | ciliary base(GO:0097546) |
| 0.3 | 6.7 | GO:0031527 | filopodium membrane(GO:0031527) |
| 0.3 | 2.9 | GO:0033116 | endoplasmic reticulum-Golgi intermediate compartment membrane(GO:0033116) |
| 0.3 | 1.1 | GO:0097513 | myosin II filament(GO:0097513) |
| 0.3 | 1.7 | GO:0044327 | dendritic spine head(GO:0044327) |
| 0.3 | 1.7 | GO:0005853 | eukaryotic translation elongation factor 1 complex(GO:0005853) |
| 0.3 | 10.9 | GO:0001726 | ruffle(GO:0001726) |
| 0.3 | 1.1 | GO:0005798 | Golgi-associated vesicle(GO:0005798) |
| 0.3 | 1.4 | GO:0046696 | lipopolysaccharide receptor complex(GO:0046696) |
| 0.3 | 2.5 | GO:0070652 | HAUS complex(GO:0070652) |
| 0.3 | 1.4 | GO:0032593 | insulin-responsive compartment(GO:0032593) |
| 0.3 | 7.5 | GO:0035327 | transcriptionally active chromatin(GO:0035327) |
| 0.3 | 46.5 | GO:0030136 | clathrin-coated vesicle(GO:0030136) |
| 0.3 | 5.0 | GO:0000145 | exocyst(GO:0000145) |
| 0.3 | 12.0 | GO:0001533 | cornified envelope(GO:0001533) |
| 0.2 | 9.2 | GO:0045095 | keratin filament(GO:0045095) |
| 0.2 | 1.7 | GO:0072487 | MSL complex(GO:0072487) |
| 0.2 | 1.0 | GO:1990796 | photoreceptor cell terminal bouton(GO:1990796) |
| 0.2 | 2.0 | GO:0031095 | platelet dense tubular network membrane(GO:0031095) |
| 0.2 | 0.7 | GO:1990851 | Wnt-Frizzled-LRP5/6 complex(GO:1990851) |
| 0.2 | 1.7 | GO:0000813 | ESCRT I complex(GO:0000813) |
| 0.2 | 3.5 | GO:0005662 | DNA replication factor A complex(GO:0005662) |
| 0.2 | 4.7 | GO:0030673 | axolemma(GO:0030673) |
| 0.2 | 1.4 | GO:0031105 | septin complex(GO:0031105) |
| 0.2 | 20.8 | GO:0035579 | specific granule membrane(GO:0035579) |
| 0.2 | 3.8 | GO:0032420 | stereocilium(GO:0032420) |
| 0.2 | 4.5 | GO:0005952 | cAMP-dependent protein kinase complex(GO:0005952) |
| 0.2 | 4.3 | GO:0043235 | receptor complex(GO:0043235) |
| 0.2 | 15.8 | GO:0016459 | myosin complex(GO:0016459) |
| 0.2 | 0.2 | GO:0000835 | ER ubiquitin ligase complex(GO:0000835) Hrd1p ubiquitin ligase complex(GO:0000836) |
| 0.2 | 5.5 | GO:0071565 | nBAF complex(GO:0071565) |
| 0.2 | 9.8 | GO:0031228 | intrinsic component of Golgi membrane(GO:0031228) |
| 0.2 | 30.7 | GO:0031234 | extrinsic component of cytoplasmic side of plasma membrane(GO:0031234) |
| 0.2 | 1.3 | GO:0098554 | cytoplasmic side of endoplasmic reticulum membrane(GO:0098554) |
| 0.2 | 11.5 | GO:0005902 | microvillus(GO:0005902) |
| 0.2 | 7.3 | GO:0048786 | presynaptic active zone(GO:0048786) |
| 0.2 | 7.7 | GO:0005891 | voltage-gated calcium channel complex(GO:0005891) |
| 0.2 | 27.0 | GO:0072562 | blood microparticle(GO:0072562) |
| 0.2 | 0.8 | GO:0033257 | Bcl3/NF-kappaB2 complex(GO:0033257) |
| 0.2 | 9.3 | GO:0030670 | phagocytic vesicle membrane(GO:0030670) |
| 0.2 | 1.0 | GO:0071797 | LUBAC complex(GO:0071797) |
| 0.2 | 13.4 | GO:0005581 | collagen trimer(GO:0005581) |
| 0.2 | 9.8 | GO:0035580 | specific granule lumen(GO:0035580) |
| 0.2 | 0.6 | GO:0000818 | nuclear MIS12/MIND complex(GO:0000818) |
| 0.2 | 11.2 | GO:0034707 | chloride channel complex(GO:0034707) |
| 0.2 | 4.8 | GO:0005801 | cis-Golgi network(GO:0005801) |
| 0.2 | 1.4 | GO:0071953 | elastic fiber(GO:0071953) |
| 0.2 | 0.5 | GO:0001652 | granular component(GO:0001652) |
| 0.2 | 7.4 | GO:0016235 | aggresome(GO:0016235) |
| 0.2 | 2.2 | GO:0000800 | lateral element(GO:0000800) |
| 0.2 | 0.5 | GO:0070195 | growth hormone receptor complex(GO:0070195) |
| 0.2 | 1.0 | GO:0002177 | manchette(GO:0002177) |
| 0.2 | 1.1 | GO:0043194 | axon initial segment(GO:0043194) |
| 0.2 | 1.0 | GO:0072558 | NLRP1 inflammasome complex(GO:0072558) |
| 0.2 | 1.7 | GO:0005614 | interstitial matrix(GO:0005614) |
| 0.2 | 0.6 | GO:0098984 | symmetric synapse(GO:0032280) neuron to neuron synapse(GO:0098984) |
| 0.2 | 2.5 | GO:0048475 | membrane coat(GO:0030117) coated membrane(GO:0048475) |
| 0.2 | 5.8 | GO:0016234 | inclusion body(GO:0016234) |
| 0.1 | 1.8 | GO:0005901 | caveola(GO:0005901) |
| 0.1 | 2.6 | GO:0005861 | troponin complex(GO:0005861) |
| 0.1 | 17.1 | GO:0016605 | PML body(GO:0016605) |
| 0.1 | 2.4 | GO:0044447 | axoneme part(GO:0044447) |
| 0.1 | 3.9 | GO:0031201 | SNARE complex(GO:0031201) |
| 0.1 | 1.0 | GO:0072559 | NLRP3 inflammasome complex(GO:0072559) |
| 0.1 | 0.7 | GO:0031082 | BLOC complex(GO:0031082) |
| 0.1 | 2.4 | GO:0005605 | basal lamina(GO:0005605) |
| 0.1 | 0.8 | GO:0043240 | Fanconi anaemia nuclear complex(GO:0043240) |
| 0.1 | 0.8 | GO:0005955 | calcineurin complex(GO:0005955) |
| 0.1 | 1.1 | GO:0031906 | late endosome lumen(GO:0031906) |
| 0.1 | 6.9 | GO:0045177 | apical part of cell(GO:0045177) |
| 0.1 | 2.2 | GO:0001917 | photoreceptor inner segment(GO:0001917) |
| 0.1 | 0.5 | GO:0034388 | Pwp2p-containing subcomplex of 90S preribosome(GO:0034388) |
| 0.1 | 0.7 | GO:0000120 | RNA polymerase I transcription factor complex(GO:0000120) |
| 0.1 | 0.5 | GO:0001740 | Barr body(GO:0001740) |
| 0.1 | 1.0 | GO:0016602 | CCAAT-binding factor complex(GO:0016602) |
| 0.1 | 0.3 | GO:0043218 | compact myelin(GO:0043218) |
| 0.1 | 2.3 | GO:0005882 | intermediate filament(GO:0005882) |
| 0.1 | 2.9 | GO:0005930 | axoneme(GO:0005930) ciliary plasm(GO:0097014) |
| 0.1 | 0.1 | GO:0070381 | endosome to plasma membrane transport vesicle(GO:0070381) |
| 0.1 | 8.8 | GO:0005923 | bicellular tight junction(GO:0005923) |
| 0.1 | 0.6 | GO:0008091 | spectrin(GO:0008091) |
| 0.1 | 284.2 | GO:0016021 | integral component of membrane(GO:0016021) |
| 0.1 | 1.0 | GO:0008290 | F-actin capping protein complex(GO:0008290) |
| 0.1 | 4.1 | GO:0045211 | postsynaptic membrane(GO:0045211) |
| 0.1 | 0.6 | GO:0033588 | Elongator holoenzyme complex(GO:0033588) |
| 0.1 | 2.7 | GO:0000786 | nucleosome(GO:0000786) |
| 0.1 | 3.9 | GO:0031225 | anchored component of membrane(GO:0031225) |
| 0.1 | 0.4 | GO:0060293 | P granule(GO:0043186) pole plasm(GO:0045495) germ plasm(GO:0060293) |
| 0.1 | 0.2 | GO:0031213 | RSF complex(GO:0031213) |
| 0.0 | 0.4 | GO:0005683 | U7 snRNP(GO:0005683) |
| 0.0 | 3.3 | GO:0030426 | growth cone(GO:0030426) |
| 0.0 | 0.7 | GO:0080008 | Cul4-RING E3 ubiquitin ligase complex(GO:0080008) |
| 0.0 | 1.0 | GO:0008023 | transcription elongation factor complex(GO:0008023) |
| 0.0 | 4.6 | GO:0001650 | fibrillar center(GO:0001650) |
| 0.0 | 0.9 | GO:0000159 | protein phosphatase type 2A complex(GO:0000159) |
| 0.0 | 0.1 | GO:0030904 | retromer complex(GO:0030904) |
| 0.0 | 0.6 | GO:0016323 | basolateral plasma membrane(GO:0016323) |
| 0.0 | 0.8 | GO:0005782 | peroxisomal matrix(GO:0005782) microbody lumen(GO:0031907) |
| 0.0 | 2.8 | GO:0005578 | proteinaceous extracellular matrix(GO:0005578) |
| 0.0 | 0.0 | GO:0090498 | extrinsic component of Golgi membrane(GO:0090498) |
Gene overrepresentation in molecular_function category:
| Log-likelihood per target | Total log-likelihood | Term | Description |
|---|---|---|---|
| 6.5 | 19.5 | GO:0086062 | voltage-gated sodium channel activity involved in Purkinje myocyte action potential(GO:0086062) |
| 5.7 | 28.7 | GO:0004703 | G-protein coupled receptor kinase activity(GO:0004703) |
| 4.8 | 19.2 | GO:0016211 | glutamate-ammonia ligase activity(GO:0004356) ammonia ligase activity(GO:0016211) acid-ammonia (or amide) ligase activity(GO:0016880) |
| 4.8 | 33.5 | GO:0030369 | ICAM-3 receptor activity(GO:0030369) |
| 4.6 | 23.2 | GO:0008420 | CTD phosphatase activity(GO:0008420) |
| 4.4 | 13.3 | GO:0032093 | SAM domain binding(GO:0032093) |
| 4.0 | 15.8 | GO:0070735 | protein-glycine ligase activity(GO:0070735) |
| 3.4 | 10.1 | GO:0035662 | Toll-like receptor 4 binding(GO:0035662) |
| 3.3 | 10.0 | GO:0098519 | nucleotide phosphatase activity, acting on free nucleotides(GO:0098519) |
| 3.3 | 26.1 | GO:0030023 | extracellular matrix constituent conferring elasticity(GO:0030023) |
| 3.1 | 3.1 | GO:0017098 | sulfonylurea receptor binding(GO:0017098) |
| 3.1 | 12.4 | GO:0004140 | dephospho-CoA kinase activity(GO:0004140) |
| 2.9 | 8.8 | GO:0042799 | histone methyltransferase activity (H4-K20 specific)(GO:0042799) |
| 2.9 | 8.7 | GO:0052895 | norspermine:oxygen oxidoreductase activity(GO:0052894) N1-acetylspermine:oxygen oxidoreductase (N1-acetylspermidine-forming) activity(GO:0052895) |
| 2.9 | 17.3 | GO:0004800 | thyroxine 5'-deiodinase activity(GO:0004800) |
| 2.9 | 8.6 | GO:0004796 | thromboxane-A synthase activity(GO:0004796) 12-hydroxyheptadecatrienoic acid synthase activity(GO:0036134) |
| 2.8 | 8.5 | GO:0004103 | choline kinase activity(GO:0004103) |
| 2.8 | 14.1 | GO:0004771 | sterol esterase activity(GO:0004771) |
| 2.7 | 8.2 | GO:0004574 | oligo-1,6-glucosidase activity(GO:0004574) |
| 2.7 | 8.0 | GO:0034584 | piRNA binding(GO:0034584) |
| 2.7 | 2.7 | GO:0001855 | complement component C4b binding(GO:0001855) |
| 2.6 | 15.5 | GO:0003917 | DNA topoisomerase type I activity(GO:0003917) |
| 2.6 | 15.4 | GO:0008467 | [heparan sulfate]-glucosamine 3-sulfotransferase 1 activity(GO:0008467) |
| 2.6 | 10.2 | GO:0016361 | activin receptor activity, type I(GO:0016361) |
| 2.5 | 15.1 | GO:0046975 | histone methyltransferase activity (H3-K36 specific)(GO:0046975) |
| 2.5 | 7.4 | GO:0035033 | histone deacetylase regulator activity(GO:0035033) |
| 2.4 | 4.9 | GO:0046592 | polyamine oxidase activity(GO:0046592) spermine:oxygen oxidoreductase (spermidine-forming) activity(GO:0052901) |
| 2.4 | 7.2 | GO:0047273 | galactosylgalactosylglucosylceramide beta-D-acetylgalactosaminyltransferase activity(GO:0047273) |
| 2.4 | 4.7 | GO:0016971 | flavin-linked sulfhydryl oxidase activity(GO:0016971) thiol oxidase activity(GO:0016972) |
| 2.4 | 2.4 | GO:0047977 | hepoxilin-epoxide hydrolase activity(GO:0047977) |
| 2.3 | 9.4 | GO:0004735 | pyrroline-5-carboxylate reductase activity(GO:0004735) |
| 2.3 | 13.9 | GO:0015252 | hydrogen ion channel activity(GO:0015252) |
| 2.3 | 6.9 | GO:0003863 | alpha-ketoacid dehydrogenase activity(GO:0003826) 3-methyl-2-oxobutanoate dehydrogenase (2-methylpropanoyl-transferring) activity(GO:0003863) |
| 2.3 | 6.8 | GO:0047150 | betaine-homocysteine S-methyltransferase activity(GO:0047150) |
| 2.2 | 6.6 | GO:0071209 | U7 snRNA binding(GO:0071209) |
| 2.2 | 6.5 | GO:0035379 | carbon dioxide transmembrane transporter activity(GO:0035379) |
| 2.2 | 8.7 | GO:0033829 | O-fucosylpeptide 3-beta-N-acetylglucosaminyltransferase activity(GO:0033829) |
| 2.1 | 8.5 | GO:1904493 | Ac-Asp-Glu binding(GO:1904492) tetrahydrofolyl-poly(glutamate) polymer binding(GO:1904493) |
| 2.1 | 14.6 | GO:0005087 | Ran guanyl-nucleotide exchange factor activity(GO:0005087) |
| 2.1 | 22.7 | GO:0051525 | NFAT protein binding(GO:0051525) |
| 2.0 | 12.1 | GO:0000155 | phosphorelay sensor kinase activity(GO:0000155) |
| 2.0 | 5.9 | GO:0003968 | RNA-directed RNA polymerase activity(GO:0003968) |
| 1.9 | 11.4 | GO:0008440 | inositol-1,4,5-trisphosphate 3-kinase activity(GO:0008440) |
| 1.9 | 47.6 | GO:0004383 | guanylate cyclase activity(GO:0004383) |
| 1.9 | 5.7 | GO:0019959 | interleukin-8 binding(GO:0019959) |
| 1.9 | 15.1 | GO:0060228 | phosphatidylcholine-sterol O-acyltransferase activator activity(GO:0060228) |
| 1.8 | 11.0 | GO:0005025 | transforming growth factor beta receptor activity, type I(GO:0005025) |
| 1.8 | 14.5 | GO:0004565 | beta-galactosidase activity(GO:0004565) |
| 1.8 | 7.2 | GO:0004351 | glutamate decarboxylase activity(GO:0004351) |
| 1.7 | 10.4 | GO:0043237 | laminin-1 binding(GO:0043237) |
| 1.7 | 6.9 | GO:0051916 | granulocyte colony-stimulating factor binding(GO:0051916) |
| 1.7 | 5.1 | GO:0050501 | hyaluronan synthase activity(GO:0050501) |
| 1.7 | 11.9 | GO:0043208 | glycosphingolipid binding(GO:0043208) |
| 1.7 | 13.5 | GO:0030172 | troponin C binding(GO:0030172) |
| 1.7 | 6.7 | GO:0005222 | intracellular cAMP activated cation channel activity(GO:0005222) |
| 1.7 | 11.7 | GO:0032554 | purine deoxyribonucleotide binding(GO:0032554) |
| 1.7 | 6.7 | GO:0004142 | diacylglycerol cholinephosphotransferase activity(GO:0004142) |
| 1.6 | 34.6 | GO:0050811 | GABA receptor binding(GO:0050811) |
| 1.6 | 11.4 | GO:0030368 | interleukin-17 receptor activity(GO:0030368) |
| 1.6 | 35.6 | GO:0005251 | delayed rectifier potassium channel activity(GO:0005251) |
| 1.6 | 4.8 | GO:0003835 | beta-galactoside alpha-2,6-sialyltransferase activity(GO:0003835) |
| 1.6 | 27.2 | GO:0019992 | diacylglycerol binding(GO:0019992) |
| 1.6 | 6.4 | GO:0050262 | ribosylnicotinamide kinase activity(GO:0050262) ribosylnicotinate kinase activity(GO:0061769) |
| 1.6 | 4.7 | GO:0035501 | MH1 domain binding(GO:0035501) |
| 1.6 | 7.9 | GO:0048039 | ubiquinone binding(GO:0048039) |
| 1.6 | 4.7 | GO:0051538 | 3 iron, 4 sulfur cluster binding(GO:0051538) |
| 1.5 | 9.3 | GO:0004522 | ribonuclease A activity(GO:0004522) |
| 1.5 | 3.1 | GO:0070653 | high-density lipoprotein particle receptor binding(GO:0070653) |
| 1.5 | 7.7 | GO:0004668 | protein-arginine deiminase activity(GO:0004668) |
| 1.5 | 4.5 | GO:0004157 | dihydropyrimidinase activity(GO:0004157) |
| 1.5 | 1.5 | GO:0005330 | dopamine:sodium symporter activity(GO:0005330) |
| 1.5 | 4.4 | GO:0044549 | GTP cyclohydrolase binding(GO:0044549) |
| 1.5 | 17.5 | GO:0032027 | myosin light chain binding(GO:0032027) |
| 1.4 | 2.8 | GO:0004915 | interleukin-6 receptor activity(GO:0004915) interleukin-6 binding(GO:0019981) |
| 1.4 | 6.9 | GO:0004591 | oxoglutarate dehydrogenase (succinyl-transferring) activity(GO:0004591) |
| 1.4 | 6.9 | GO:0004489 | methylenetetrahydrofolate reductase (NAD(P)H) activity(GO:0004489) |
| 1.4 | 5.5 | GO:0004782 | sulfinoalanine decarboxylase activity(GO:0004782) |
| 1.4 | 16.6 | GO:0046972 | histone acetyltransferase activity (H4-K5 specific)(GO:0043995) histone acetyltransferase activity (H4-K8 specific)(GO:0043996) histone acetyltransferase activity (H4-K16 specific)(GO:0046972) |
| 1.4 | 6.8 | GO:0017153 | succinate transmembrane transporter activity(GO:0015141) sodium:dicarboxylate symporter activity(GO:0017153) |
| 1.4 | 5.4 | GO:0019828 | aspartic-type endopeptidase inhibitor activity(GO:0019828) |
| 1.4 | 4.1 | GO:0015189 | L-lysine transmembrane transporter activity(GO:0015189) |
| 1.3 | 1.3 | GO:0047184 | 1-acylglycerophosphocholine O-acyltransferase activity(GO:0047184) |
| 1.3 | 5.2 | GO:0035939 | microsatellite binding(GO:0035939) |
| 1.3 | 3.8 | GO:0015275 | stretch-activated, cation-selective, calcium channel activity(GO:0015275) |
| 1.3 | 6.3 | GO:0061665 | SUMO ligase activity(GO:0061665) |
| 1.3 | 12.6 | GO:0005375 | copper ion transmembrane transporter activity(GO:0005375) |
| 1.3 | 3.8 | GO:0019961 | interferon binding(GO:0019961) |
| 1.3 | 8.8 | GO:0003828 | alpha-N-acetylneuraminate alpha-2,8-sialyltransferase activity(GO:0003828) |
| 1.2 | 12.3 | GO:0022841 | potassium ion leak channel activity(GO:0022841) |
| 1.2 | 3.7 | GO:0015218 | pyrimidine nucleotide transmembrane transporter activity(GO:0015218) |
| 1.2 | 66.9 | GO:0034987 | immunoglobulin receptor binding(GO:0034987) |
| 1.2 | 3.6 | GO:0004487 | methenyltetrahydrofolate cyclohydrolase activity(GO:0004477) methylenetetrahydrofolate dehydrogenase (NAD+) activity(GO:0004487) methylenetetrahydrofolate dehydrogenase (NADP+) activity(GO:0004488) |
| 1.2 | 8.5 | GO:0060072 | large conductance calcium-activated potassium channel activity(GO:0060072) |
| 1.2 | 3.6 | GO:0004967 | glucagon receptor activity(GO:0004967) |
| 1.2 | 2.4 | GO:0050431 | transforming growth factor beta binding(GO:0050431) |
| 1.2 | 4.7 | GO:0031685 | adenosine receptor binding(GO:0031685) |
| 1.2 | 4.7 | GO:0017040 | ceramidase activity(GO:0017040) |
| 1.2 | 4.7 | GO:0016892 | endoribonuclease activity, producing 3'-phosphomonoesters(GO:0016892) |
| 1.2 | 5.8 | GO:0000179 | rRNA (adenine-N6,N6-)-dimethyltransferase activity(GO:0000179) |
| 1.2 | 4.6 | GO:0004666 | prostaglandin-endoperoxide synthase activity(GO:0004666) |
| 1.1 | 6.9 | GO:0004198 | calcium-dependent cysteine-type endopeptidase activity(GO:0004198) |
| 1.1 | 3.4 | GO:0003829 | beta-1,3-galactosyl-O-glycosyl-glycoprotein beta-1,6-N-acetylglucosaminyltransferase activity(GO:0003829) |
| 1.1 | 3.4 | GO:0080019 | fatty-acyl-CoA reductase (alcohol-forming) activity(GO:0080019) |
| 1.1 | 5.7 | GO:0004994 | somatostatin receptor activity(GO:0004994) |
| 1.1 | 3.4 | GO:0047223 | N-acetyllactosaminide beta-1,3-N-acetylglucosaminyltransferase activity(GO:0008532) beta-1,3-galactosyl-O-glycosyl-glycoprotein beta-1,3-N-acetylglucosaminyltransferase activity(GO:0047223) |
| 1.1 | 11.3 | GO:0009374 | biotin binding(GO:0009374) |
| 1.1 | 3.4 | GO:0016603 | glutaminyl-peptide cyclotransferase activity(GO:0016603) |
| 1.1 | 4.5 | GO:0070290 | N-acylphosphatidylethanolamine-specific phospholipase D activity(GO:0070290) |
| 1.1 | 4.4 | GO:0003680 | AT DNA binding(GO:0003680) |
| 1.1 | 4.4 | GO:0016499 | orexin receptor activity(GO:0016499) |
| 1.1 | 3.3 | GO:0003976 | UDP-N-acetylglucosamine-lysosomal-enzyme N-acetylglucosaminephosphotransferase activity(GO:0003976) |
| 1.1 | 14.3 | GO:0015924 | mannosyl-oligosaccharide mannosidase activity(GO:0015924) |
| 1.1 | 3.3 | GO:0004676 | 3-phosphoinositide-dependent protein kinase activity(GO:0004676) |
| 1.1 | 3.2 | GO:0000995 | transcription factor activity, core RNA polymerase III binding(GO:0000995) |
| 1.1 | 3.2 | GO:0016495 | C-X3-C chemokine receptor activity(GO:0016495) |
| 1.1 | 6.4 | GO:0004741 | [pyruvate dehydrogenase (lipoamide)] phosphatase activity(GO:0004741) |
| 1.1 | 4.3 | GO:0019770 | IgG receptor activity(GO:0019770) |
| 1.1 | 8.5 | GO:1903136 | cuprous ion binding(GO:1903136) |
| 1.1 | 3.2 | GO:0052830 | inositol tetrakisphosphate 1-kinase activity(GO:0047325) inositol tetrakisphosphate kinase activity(GO:0051765) inositol-1,3,4-trisphosphate 6-kinase activity(GO:0052725) inositol-1,3,4-trisphosphate 5-kinase activity(GO:0052726) inositol-1,3,4,5,6-pentakisphosphate 1-phosphatase activity(GO:0052825) inositol-1,3,4,6-tetrakisphosphate 6-phosphatase activity(GO:0052830) inositol-1,3,4,6-tetrakisphosphate 1-phosphatase activity(GO:0052831) inositol-3,4,6-trisphosphate 1-kinase activity(GO:0052835) |
| 1.1 | 10.6 | GO:1990380 | Lys48-specific deubiquitinase activity(GO:1990380) |
| 1.0 | 4.2 | GO:0000702 | oxidized base lesion DNA N-glycosylase activity(GO:0000702) |
| 1.0 | 3.1 | GO:0015018 | galactosylgalactosylxylosylprotein 3-beta-glucuronosyltransferase activity(GO:0015018) |
| 1.0 | 6.2 | GO:1990829 | C-rich single-stranded DNA binding(GO:1990829) |
| 1.0 | 14.5 | GO:0004875 | complement receptor activity(GO:0004875) |
| 1.0 | 4.2 | GO:0005502 | 11-cis retinal binding(GO:0005502) |
| 1.0 | 11.3 | GO:0004030 | aldehyde dehydrogenase [NAD(P)+] activity(GO:0004030) |
| 1.0 | 6.2 | GO:0008597 | calcium-dependent protein serine/threonine phosphatase regulator activity(GO:0008597) |
| 1.0 | 11.2 | GO:0001135 | transcription factor activity, RNA polymerase II transcription factor recruiting(GO:0001135) |
| 1.0 | 3.0 | GO:0004939 | beta-adrenergic receptor activity(GO:0004939) |
| 1.0 | 9.0 | GO:0001225 | RNA polymerase II transcription coactivator binding(GO:0001225) |
| 1.0 | 3.0 | GO:0017129 | triglyceride binding(GO:0017129) |
| 1.0 | 3.0 | GO:0035403 | histone kinase activity (H3-T6 specific)(GO:0035403) |
| 1.0 | 3.0 | GO:0004832 | valine-tRNA ligase activity(GO:0004832) |
| 1.0 | 9.8 | GO:0005007 | fibroblast growth factor-activated receptor activity(GO:0005007) |
| 1.0 | 2.9 | GO:0061663 | NEDD8 ligase activity(GO:0061663) |
| 0.9 | 2.8 | GO:0047631 | ADP-ribose diphosphatase activity(GO:0047631) |
| 0.9 | 9.3 | GO:0016176 | superoxide-generating NADPH oxidase activator activity(GO:0016176) |
| 0.9 | 4.7 | GO:0004999 | vasoactive intestinal polypeptide receptor activity(GO:0004999) |
| 0.9 | 5.5 | GO:0004430 | 1-phosphatidylinositol 4-kinase activity(GO:0004430) |
| 0.9 | 18.3 | GO:0043495 | protein anchor(GO:0043495) |
| 0.9 | 2.7 | GO:0004045 | aminoacyl-tRNA hydrolase activity(GO:0004045) |
| 0.9 | 2.7 | GO:0017002 | activin-activated receptor activity(GO:0017002) |
| 0.9 | 3.6 | GO:0061628 | H3K27me3 modified histone binding(GO:0061628) |
| 0.9 | 7.1 | GO:0009008 | DNA-methyltransferase activity(GO:0009008) |
| 0.9 | 7.1 | GO:0035374 | chondroitin sulfate binding(GO:0035374) |
| 0.9 | 5.3 | GO:0051033 | nucleic acid transmembrane transporter activity(GO:0051032) RNA transmembrane transporter activity(GO:0051033) |
| 0.9 | 5.3 | GO:0005157 | macrophage colony-stimulating factor receptor binding(GO:0005157) |
| 0.9 | 2.6 | GO:0016833 | oxo-acid-lyase activity(GO:0016833) |
| 0.9 | 10.4 | GO:0017034 | Rap guanyl-nucleotide exchange factor activity(GO:0017034) |
| 0.9 | 4.3 | GO:0030275 | LRR domain binding(GO:0030275) |
| 0.9 | 11.3 | GO:0051011 | microtubule minus-end binding(GO:0051011) |
| 0.9 | 11.3 | GO:0032395 | MHC class II receptor activity(GO:0032395) |
| 0.9 | 5.1 | GO:0042577 | lipid phosphatase activity(GO:0042577) |
| 0.9 | 1.7 | GO:0015925 | galactosidase activity(GO:0015925) |
| 0.8 | 2.5 | GO:0050473 | arachidonate 15-lipoxygenase activity(GO:0050473) |
| 0.8 | 3.4 | GO:0051733 | ATP-dependent polydeoxyribonucleotide 5'-hydroxyl-kinase activity(GO:0046404) polydeoxyribonucleotide kinase activity(GO:0051733) ATP-dependent polynucleotide kinase activity(GO:0051734) |
| 0.8 | 5.8 | GO:0097643 | amylin receptor activity(GO:0097643) |
| 0.8 | 5.8 | GO:0001591 | dopamine neurotransmitter receptor activity, coupled via Gi/Go(GO:0001591) |
| 0.8 | 4.1 | GO:0042289 | MHC class II protein binding(GO:0042289) |
| 0.8 | 4.9 | GO:0030020 | extracellular matrix structural constituent conferring tensile strength(GO:0030020) |
| 0.8 | 3.3 | GO:0004963 | follicle-stimulating hormone receptor activity(GO:0004963) |
| 0.8 | 6.5 | GO:0046920 | alpha-(1->3)-fucosyltransferase activity(GO:0046920) |
| 0.8 | 7.3 | GO:0004784 | superoxide dismutase activity(GO:0004784) oxidoreductase activity, acting on superoxide radicals as acceptor(GO:0016721) |
| 0.8 | 5.7 | GO:0004035 | alkaline phosphatase activity(GO:0004035) |
| 0.8 | 8.0 | GO:0005078 | MAP-kinase scaffold activity(GO:0005078) |
| 0.8 | 7.9 | GO:0015385 | sodium:proton antiporter activity(GO:0015385) potassium:proton antiporter activity(GO:0015386) |
| 0.8 | 78.7 | GO:0005089 | Rho guanyl-nucleotide exchange factor activity(GO:0005089) |
| 0.8 | 4.7 | GO:0004614 | phosphoglucomutase activity(GO:0004614) |
| 0.8 | 2.3 | GO:0004137 | deoxycytidine kinase activity(GO:0004137) thymidine kinase activity(GO:0004797) |
| 0.8 | 3.9 | GO:0004920 | interleukin-10 receptor activity(GO:0004920) |
| 0.8 | 0.8 | GO:0016413 | O-acetyltransferase activity(GO:0016413) |
| 0.8 | 12.4 | GO:0031210 | phosphatidylcholine binding(GO:0031210) |
| 0.8 | 2.3 | GO:0004961 | thromboxane receptor activity(GO:0004960) thromboxane A2 receptor activity(GO:0004961) |
| 0.8 | 3.1 | GO:0019763 | immunoglobulin receptor activity(GO:0019763) |
| 0.8 | 7.0 | GO:0008526 | phosphatidylinositol transporter activity(GO:0008526) |
| 0.8 | 3.9 | GO:0003951 | NAD+ kinase activity(GO:0003951) |
| 0.8 | 4.6 | GO:0008853 | exodeoxyribonuclease III activity(GO:0008853) |
| 0.8 | 4.6 | GO:0005332 | gamma-aminobutyric acid:sodium symporter activity(GO:0005332) gamma-aminobutyric acid transmembrane transporter activity(GO:0015185) |
| 0.8 | 7.7 | GO:0048406 | nerve growth factor binding(GO:0048406) |
| 0.8 | 10.7 | GO:0055056 | D-glucose transmembrane transporter activity(GO:0055056) |
| 0.8 | 2.3 | GO:0030272 | 5-formyltetrahydrofolate cyclo-ligase activity(GO:0030272) |
| 0.8 | 3.0 | GO:0004706 | JUN kinase kinase kinase activity(GO:0004706) |
| 0.8 | 9.1 | GO:0019864 | IgG binding(GO:0019864) |
| 0.8 | 3.0 | GO:0070051 | fibrinogen binding(GO:0070051) |
| 0.7 | 4.5 | GO:0050656 | 3'-phosphoadenosine 5'-phosphosulfate binding(GO:0050656) |
| 0.7 | 4.4 | GO:0008310 | single-stranded DNA 3'-5' exodeoxyribonuclease activity(GO:0008310) |
| 0.7 | 1.5 | GO:0035650 | AP-1 adaptor complex binding(GO:0035650) |
| 0.7 | 2.2 | GO:0004613 | phosphoenolpyruvate carboxykinase activity(GO:0004611) phosphoenolpyruvate carboxykinase (GTP) activity(GO:0004613) |
| 0.7 | 2.9 | GO:0052591 | sn-glycerol-3-phosphate:ubiquinone oxidoreductase activity(GO:0052590) sn-glycerol-3-phosphate:ubiquinone-8 oxidoreductase activity(GO:0052591) |
| 0.7 | 3.5 | GO:0032813 | tumor necrosis factor receptor binding(GO:0005164) tumor necrosis factor receptor superfamily binding(GO:0032813) |
| 0.7 | 2.1 | GO:0004949 | cannabinoid receptor activity(GO:0004949) |
| 0.7 | 9.8 | GO:0030618 | transforming growth factor beta receptor, pathway-specific cytoplasmic mediator activity(GO:0030618) |
| 0.7 | 2.8 | GO:0070915 | lysophosphatidic acid receptor activity(GO:0070915) |
| 0.7 | 2.8 | GO:0001588 | dopamine neurotransmitter receptor activity, coupled via Gs(GO:0001588) |
| 0.7 | 2.1 | GO:0050405 | [hydroxymethylglutaryl-CoA reductase (NADPH)] kinase activity(GO:0047322) [acetyl-CoA carboxylase] kinase activity(GO:0050405) |
| 0.7 | 8.2 | GO:0019841 | retinol binding(GO:0019841) |
| 0.7 | 3.4 | GO:1990430 | extracellular matrix protein binding(GO:1990430) |
| 0.7 | 2.0 | GO:0004951 | cholecystokinin receptor activity(GO:0004951) |
| 0.7 | 2.0 | GO:0004603 | phenylethanolamine N-methyltransferase activity(GO:0004603) |
| 0.7 | 0.7 | GO:0016647 | oxidoreductase activity, acting on the CH-NH group of donors, oxygen as acceptor(GO:0016647) |
| 0.7 | 10.6 | GO:0035925 | mRNA 3'-UTR AU-rich region binding(GO:0035925) |
| 0.7 | 21.8 | GO:0043014 | alpha-tubulin binding(GO:0043014) |
| 0.6 | 3.9 | GO:0004447 | iodide peroxidase activity(GO:0004447) |
| 0.6 | 2.6 | GO:0060422 | peptidyl-dipeptidase inhibitor activity(GO:0060422) |
| 0.6 | 8.3 | GO:0070700 | BMP receptor binding(GO:0070700) |
| 0.6 | 5.7 | GO:0004969 | histamine receptor activity(GO:0004969) |
| 0.6 | 3.1 | GO:0035252 | UDP-xylosyltransferase activity(GO:0035252) xylosyltransferase activity(GO:0042285) |
| 0.6 | 15.6 | GO:0004012 | phospholipid-translocating ATPase activity(GO:0004012) |
| 0.6 | 13.5 | GO:0008327 | methyl-CpG binding(GO:0008327) |
| 0.6 | 2.4 | GO:0005127 | ciliary neurotrophic factor receptor binding(GO:0005127) |
| 0.6 | 4.2 | GO:0004126 | cytidine deaminase activity(GO:0004126) |
| 0.6 | 3.0 | GO:0015111 | iodide transmembrane transporter activity(GO:0015111) |
| 0.6 | 16.2 | GO:0042605 | peptide antigen binding(GO:0042605) |
| 0.6 | 1.8 | GO:0015439 | heme-transporting ATPase activity(GO:0015439) |
| 0.6 | 6.5 | GO:0008061 | chitinase activity(GO:0004568) chitin binding(GO:0008061) |
| 0.6 | 2.9 | GO:0043548 | phosphatidylinositol 3-kinase binding(GO:0043548) |
| 0.6 | 4.6 | GO:0004865 | protein serine/threonine phosphatase inhibitor activity(GO:0004865) |
| 0.6 | 10.9 | GO:0071837 | HMG box domain binding(GO:0071837) |
| 0.6 | 4.0 | GO:0048403 | brain-derived neurotrophic factor binding(GO:0048403) |
| 0.6 | 1.7 | GO:0017082 | mineralocorticoid receptor activity(GO:0017082) |
| 0.6 | 2.3 | GO:0019862 | IgA binding(GO:0019862) |
| 0.6 | 7.9 | GO:0015095 | magnesium ion transmembrane transporter activity(GO:0015095) |
| 0.6 | 2.8 | GO:0070728 | leucine binding(GO:0070728) |
| 0.6 | 4.5 | GO:0005143 | interleukin-12 receptor binding(GO:0005143) |
| 0.6 | 4.5 | GO:0097322 | 7SK snRNA binding(GO:0097322) |
| 0.6 | 2.8 | GO:0046974 | histone methyltransferase activity (H3-K9 specific)(GO:0046974) |
| 0.5 | 2.2 | GO:0001054 | RNA polymerase I activity(GO:0001054) |
| 0.5 | 2.2 | GO:0003827 | alpha-1,3-mannosylglycoprotein 2-beta-N-acetylglucosaminyltransferase activity(GO:0003827) |
| 0.5 | 4.4 | GO:0051864 | histone demethylase activity (H3-K36 specific)(GO:0051864) |
| 0.5 | 9.2 | GO:0031005 | filamin binding(GO:0031005) |
| 0.5 | 2.2 | GO:0022858 | L-alanine transmembrane transporter activity(GO:0015180) alanine transmembrane transporter activity(GO:0022858) |
| 0.5 | 4.3 | GO:0044323 | retinoic acid-responsive element binding(GO:0044323) |
| 0.5 | 2.1 | GO:0005138 | interleukin-6 receptor binding(GO:0005138) |
| 0.5 | 3.7 | GO:0001515 | opioid peptide activity(GO:0001515) |
| 0.5 | 2.1 | GO:0004559 | alpha-mannosidase activity(GO:0004559) |
| 0.5 | 3.7 | GO:0015501 | glutamate:sodium symporter activity(GO:0015501) |
| 0.5 | 59.0 | GO:0004222 | metalloendopeptidase activity(GO:0004222) |
| 0.5 | 5.2 | GO:0034452 | dynactin binding(GO:0034452) |
| 0.5 | 2.1 | GO:0050265 | RNA uridylyltransferase activity(GO:0050265) |
| 0.5 | 2.1 | GO:0015057 | thrombin receptor activity(GO:0015057) |
| 0.5 | 6.2 | GO:0005229 | intracellular calcium activated chloride channel activity(GO:0005229) |
| 0.5 | 8.8 | GO:0010857 | calcium-dependent protein kinase activity(GO:0010857) |
| 0.5 | 1.6 | GO:0042015 | interleukin-20 binding(GO:0042015) |
| 0.5 | 2.1 | GO:0001632 | leukotriene B4 receptor activity(GO:0001632) |
| 0.5 | 10.3 | GO:0015269 | calcium-activated potassium channel activity(GO:0015269) |
| 0.5 | 3.1 | GO:0005092 | GDP-dissociation inhibitor activity(GO:0005092) |
| 0.5 | 1.5 | GO:0050780 | dopamine receptor binding(GO:0050780) |
| 0.5 | 3.1 | GO:0052811 | 1-phosphatidylinositol-3-phosphate 4-kinase activity(GO:0052811) |
| 0.5 | 8.1 | GO:0004143 | diacylglycerol kinase activity(GO:0004143) |
| 0.5 | 13.6 | GO:0016922 | ligand-dependent nuclear receptor binding(GO:0016922) |
| 0.5 | 8.5 | GO:0003995 | acyl-CoA dehydrogenase activity(GO:0003995) |
| 0.5 | 6.0 | GO:0019911 | structural constituent of myelin sheath(GO:0019911) |
| 0.5 | 5.0 | GO:0051378 | amine binding(GO:0043176) serotonin binding(GO:0051378) |
| 0.5 | 2.5 | GO:0015168 | glycerol transmembrane transporter activity(GO:0015168) |
| 0.5 | 4.9 | GO:0047372 | acylglycerol lipase activity(GO:0047372) |
| 0.5 | 25.4 | GO:0043425 | bHLH transcription factor binding(GO:0043425) |
| 0.5 | 4.4 | GO:0003910 | DNA ligase (ATP) activity(GO:0003910) |
| 0.5 | 3.4 | GO:0050733 | RS domain binding(GO:0050733) |
| 0.5 | 3.4 | GO:0008417 | fucosyltransferase activity(GO:0008417) |
| 0.5 | 51.0 | GO:0003707 | steroid hormone receptor activity(GO:0003707) |
| 0.5 | 13.1 | GO:0001965 | G-protein alpha-subunit binding(GO:0001965) |
| 0.5 | 1.9 | GO:0017128 | phospholipid scramblase activity(GO:0017128) |
| 0.5 | 3.8 | GO:0000150 | recombinase activity(GO:0000150) |
| 0.5 | 2.4 | GO:0016907 | G-protein coupled acetylcholine receptor activity(GO:0016907) |
| 0.5 | 2.4 | GO:0001594 | trace-amine receptor activity(GO:0001594) |
| 0.5 | 6.7 | GO:0030306 | ADP-ribosylation factor binding(GO:0030306) |
| 0.5 | 4.7 | GO:0005432 | calcium:sodium antiporter activity(GO:0005432) |
| 0.5 | 4.7 | GO:0015250 | water channel activity(GO:0015250) |
| 0.5 | 1.4 | GO:0097258 | tocopherol omega-hydroxylase activity(GO:0052870) alpha-tocopherol omega-hydroxylase activity(GO:0052871) 20-hydroxy-leukotriene B4 omega oxidase activity(GO:0097258) 20-aldehyde-leukotriene B4 20-monooxygenase activity(GO:0097259) |
| 0.5 | 4.2 | GO:0032051 | clathrin light chain binding(GO:0032051) |
| 0.5 | 8.9 | GO:0045028 | G-protein coupled nucleotide receptor activity(GO:0001608) G-protein coupled purinergic nucleotide receptor activity(GO:0045028) |
| 0.5 | 9.4 | GO:0071949 | FAD binding(GO:0071949) |
| 0.5 | 3.8 | GO:0004873 | asialoglycoprotein receptor activity(GO:0004873) |
| 0.5 | 2.3 | GO:0016934 | extracellular-glycine-gated ion channel activity(GO:0016933) extracellular-glycine-gated chloride channel activity(GO:0016934) |
| 0.5 | 6.5 | GO:0045499 | chemorepellent activity(GO:0045499) |
| 0.5 | 6.0 | GO:0032454 | histone demethylase activity (H3-K9 specific)(GO:0032454) |
| 0.5 | 3.7 | GO:0035497 | cAMP response element binding(GO:0035497) |
| 0.5 | 1.9 | GO:0008518 | reduced folate carrier activity(GO:0008518) methotrexate transporter activity(GO:0015350) |
| 0.5 | 13.4 | GO:0005388 | calcium-transporting ATPase activity(GO:0005388) |
| 0.5 | 6.4 | GO:0005168 | neurotrophin TRKA receptor binding(GO:0005168) |
| 0.5 | 7.8 | GO:0004089 | carbonate dehydratase activity(GO:0004089) |
| 0.5 | 2.3 | GO:0044729 | hemi-methylated DNA-binding(GO:0044729) |
| 0.5 | 21.6 | GO:0030507 | spectrin binding(GO:0030507) |
| 0.4 | 2.7 | GO:1904929 | coreceptor activity involved in Wnt signaling pathway, planar cell polarity pathway(GO:1904929) |
| 0.4 | 2.2 | GO:0044736 | acid-sensing ion channel activity(GO:0044736) |
| 0.4 | 5.3 | GO:0032041 | histone deacetylase activity (H3-K14 specific)(GO:0031078) NAD-dependent histone deacetylase activity (H3-K14 specific)(GO:0032041) |
| 0.4 | 4.0 | GO:0005381 | iron ion transmembrane transporter activity(GO:0005381) |
| 0.4 | 11.8 | GO:0019198 | transmembrane receptor protein tyrosine phosphatase activity(GO:0005001) transmembrane receptor protein phosphatase activity(GO:0019198) |
| 0.4 | 18.3 | GO:0030332 | cyclin binding(GO:0030332) |
| 0.4 | 9.1 | GO:0050664 | oxidoreductase activity, acting on NAD(P)H, oxygen as acceptor(GO:0050664) |
| 0.4 | 1.7 | GO:0016842 | amidine-lyase activity(GO:0016842) |
| 0.4 | 2.1 | GO:1904315 | neurotransmitter receptor activity involved in regulation of postsynaptic membrane potential(GO:0099529) transmitter-gated ion channel activity involved in regulation of postsynaptic membrane potential(GO:1904315) |
| 0.4 | 29.5 | GO:0001540 | beta-amyloid binding(GO:0001540) |
| 0.4 | 2.1 | GO:0008273 | calcium, potassium:sodium antiporter activity(GO:0008273) |
| 0.4 | 2.5 | GO:0004536 | deoxyribonuclease activity(GO:0004536) |
| 0.4 | 5.3 | GO:0004596 | peptide alpha-N-acetyltransferase activity(GO:0004596) |
| 0.4 | 6.1 | GO:0004716 | receptor signaling protein tyrosine kinase activity(GO:0004716) |
| 0.4 | 11.0 | GO:0001530 | lipopolysaccharide binding(GO:0001530) |
| 0.4 | 4.5 | GO:0008020 | G-protein coupled photoreceptor activity(GO:0008020) |
| 0.4 | 2.8 | GO:0070573 | metallodipeptidase activity(GO:0070573) |
| 0.4 | 4.0 | GO:0004767 | sphingomyelin phosphodiesterase activity(GO:0004767) |
| 0.4 | 4.8 | GO:1904264 | ubiquitin protein ligase activity involved in ERAD pathway(GO:1904264) |
| 0.4 | 4.4 | GO:0086007 | voltage-gated calcium channel activity involved in cardiac muscle cell action potential(GO:0086007) |
| 0.4 | 1.6 | GO:0004980 | melanocyte-stimulating hormone receptor activity(GO:0004980) |
| 0.4 | 7.1 | GO:0008349 | MAP kinase kinase kinase kinase activity(GO:0008349) |
| 0.4 | 0.4 | GO:0005315 | inorganic phosphate transmembrane transporter activity(GO:0005315) |
| 0.4 | 9.4 | GO:0005086 | ARF guanyl-nucleotide exchange factor activity(GO:0005086) |
| 0.4 | 6.6 | GO:0005161 | platelet-derived growth factor receptor binding(GO:0005161) |
| 0.4 | 2.3 | GO:0017150 | tRNA dihydrouridine synthase activity(GO:0017150) |
| 0.4 | 1.5 | GO:0019826 | oxygen sensor activity(GO:0019826) |
| 0.4 | 2.7 | GO:0047894 | flavonol 3-sulfotransferase activity(GO:0047894) steroid sulfotransferase activity(GO:0050294) |
| 0.4 | 1.9 | GO:0015056 | corticotrophin-releasing factor receptor activity(GO:0015056) |
| 0.4 | 28.6 | GO:0005254 | chloride channel activity(GO:0005254) |
| 0.4 | 1.5 | GO:0032145 | 4-aminobutyrate transaminase activity(GO:0003867) succinate-semialdehyde dehydrogenase binding(GO:0032145) (S)-3-amino-2-methylpropionate transaminase activity(GO:0047298) |
| 0.4 | 10.8 | GO:0005245 | voltage-gated calcium channel activity(GO:0005245) |
| 0.4 | 2.2 | GO:0051021 | GDP-dissociation inhibitor binding(GO:0051021) Rho GDP-dissociation inhibitor binding(GO:0051022) |
| 0.4 | 7.7 | GO:0005545 | 1-phosphatidylinositol binding(GO:0005545) |
| 0.4 | 8.0 | GO:0070412 | R-SMAD binding(GO:0070412) |
| 0.4 | 2.2 | GO:0043236 | laminin binding(GO:0043236) |
| 0.4 | 18.7 | GO:0017112 | Rab guanyl-nucleotide exchange factor activity(GO:0017112) |
| 0.4 | 1.4 | GO:0004727 | prenylated protein tyrosine phosphatase activity(GO:0004727) |
| 0.4 | 0.4 | GO:0016262 | protein N-acetylglucosaminyltransferase activity(GO:0016262) |
| 0.4 | 2.8 | GO:0004679 | AMP-activated protein kinase activity(GO:0004679) |
| 0.4 | 4.6 | GO:0005344 | oxygen transporter activity(GO:0005344) |
| 0.3 | 1.4 | GO:0070097 | delta-catenin binding(GO:0070097) |
| 0.3 | 10.0 | GO:0004683 | calmodulin-dependent protein kinase activity(GO:0004683) |
| 0.3 | 4.1 | GO:0004691 | cAMP-dependent protein kinase activity(GO:0004691) |
| 0.3 | 1.4 | GO:0001733 | galactosylceramide sulfotransferase activity(GO:0001733) galactose 3-O-sulfotransferase activity(GO:0050694) |
| 0.3 | 1.0 | GO:0015222 | serotonin transmembrane transporter activity(GO:0015222) |
| 0.3 | 4.8 | GO:0030280 | structural constituent of epidermis(GO:0030280) |
| 0.3 | 3.7 | GO:0045125 | bioactive lipid receptor activity(GO:0045125) |
| 0.3 | 1.3 | GO:0022865 | transmembrane electron transfer carrier(GO:0022865) |
| 0.3 | 1.7 | GO:0010997 | anaphase-promoting complex binding(GO:0010997) |
| 0.3 | 1.7 | GO:0008499 | UDP-galactose:beta-N-acetylglucosamine beta-1,3-galactosyltransferase activity(GO:0008499) |
| 0.3 | 3.3 | GO:0045159 | myosin II binding(GO:0045159) |
| 0.3 | 1.6 | GO:0005000 | vasopressin receptor activity(GO:0005000) |
| 0.3 | 2.0 | GO:0070742 | C2H2 zinc finger domain binding(GO:0070742) |
| 0.3 | 1.9 | GO:0016715 | oxidoreductase activity, acting on paired donors, with incorporation or reduction of molecular oxygen, reduced ascorbate as one donor, and incorporation of one atom of oxygen(GO:0016715) |
| 0.3 | 5.1 | GO:0050321 | tau-protein kinase activity(GO:0050321) |
| 0.3 | 2.9 | GO:0016813 | hydrolase activity, acting on carbon-nitrogen (but not peptide) bonds, in linear amidines(GO:0016813) |
| 0.3 | 1.3 | GO:0004740 | pyruvate dehydrogenase (acetyl-transferring) kinase activity(GO:0004740) |
| 0.3 | 1.3 | GO:0016594 | glycine binding(GO:0016594) |
| 0.3 | 4.7 | GO:0017049 | GTP-Rho binding(GO:0017049) |
| 0.3 | 3.2 | GO:0019957 | C-C chemokine binding(GO:0019957) |
| 0.3 | 2.2 | GO:0033691 | sialic acid binding(GO:0033691) |
| 0.3 | 5.9 | GO:0016773 | phosphotransferase activity, alcohol group as acceptor(GO:0016773) |
| 0.3 | 2.5 | GO:0047144 | 2-acylglycerol-3-phosphate O-acyltransferase activity(GO:0047144) |
| 0.3 | 0.9 | GO:0016406 | carnitine O-acyltransferase activity(GO:0016406) |
| 0.3 | 41.9 | GO:0001078 | transcriptional repressor activity, RNA polymerase II core promoter proximal region sequence-specific binding(GO:0001078) |
| 0.3 | 6.7 | GO:0004115 | 3',5'-cyclic-AMP phosphodiesterase activity(GO:0004115) |
| 0.3 | 5.5 | GO:0019905 | syntaxin binding(GO:0019905) |
| 0.3 | 3.0 | GO:0045545 | syndecan binding(GO:0045545) |
| 0.3 | 3.9 | GO:0038191 | neuropilin binding(GO:0038191) |
| 0.3 | 1.2 | GO:0015220 | choline transmembrane transporter activity(GO:0015220) azole transporter activity(GO:0045118) |
| 0.3 | 7.9 | GO:0047555 | 3',5'-cyclic-GMP phosphodiesterase activity(GO:0047555) |
| 0.3 | 2.0 | GO:0008198 | ferrous iron binding(GO:0008198) |
| 0.3 | 8.1 | GO:0005031 | tumor necrosis factor-activated receptor activity(GO:0005031) death receptor activity(GO:0005035) |
| 0.3 | 4.4 | GO:0005248 | voltage-gated sodium channel activity(GO:0005248) voltage-gated ion channel activity involved in regulation of postsynaptic membrane potential(GO:1905030) |
| 0.3 | 4.9 | GO:0051019 | mitogen-activated protein kinase binding(GO:0051019) |
| 0.3 | 2.0 | GO:0000268 | peroxisome targeting sequence binding(GO:0000268) |
| 0.3 | 5.4 | GO:0008519 | ammonium transmembrane transporter activity(GO:0008519) |
| 0.3 | 1.1 | GO:0048156 | tau protein binding(GO:0048156) |
| 0.3 | 2.0 | GO:0016206 | catechol O-methyltransferase activity(GO:0016206) |
| 0.3 | 1.7 | GO:0036312 | phosphatidylinositol 3-kinase regulatory subunit binding(GO:0036312) |
| 0.3 | 2.0 | GO:0030169 | low-density lipoprotein particle binding(GO:0030169) |
| 0.3 | 7.5 | GO:0003950 | NAD+ ADP-ribosyltransferase activity(GO:0003950) |
| 0.3 | 0.8 | GO:0016215 | stearoyl-CoA 9-desaturase activity(GO:0004768) acyl-CoA desaturase activity(GO:0016215) |
| 0.3 | 10.5 | GO:0004623 | phospholipase A2 activity(GO:0004623) |
| 0.3 | 5.2 | GO:0005521 | lamin binding(GO:0005521) |
| 0.3 | 0.8 | GO:0002113 | interleukin-33 binding(GO:0002113) |
| 0.3 | 4.1 | GO:0004861 | cyclin-dependent protein serine/threonine kinase inhibitor activity(GO:0004861) |
| 0.3 | 3.8 | GO:0016706 | oxidoreductase activity, acting on paired donors, with incorporation or reduction of molecular oxygen, 2-oxoglutarate as one donor, and incorporation of one atom each of oxygen into both donors(GO:0016706) |
| 0.3 | 3.2 | GO:0031702 | type 1 angiotensin receptor binding(GO:0031702) |
| 0.3 | 4.5 | GO:0008569 | ATP-dependent microtubule motor activity, minus-end-directed(GO:0008569) |
| 0.3 | 2.4 | GO:0009975 | cyclase activity(GO:0009975) |
| 0.3 | 19.8 | GO:0004715 | non-membrane spanning protein tyrosine kinase activity(GO:0004715) |
| 0.3 | 1.0 | GO:0017169 | CDP-alcohol phosphatidyltransferase activity(GO:0017169) |
| 0.3 | 0.8 | GO:0001665 | alpha-N-acetylgalactosaminide alpha-2,6-sialyltransferase activity(GO:0001665) |
| 0.3 | 1.8 | GO:0015277 | kainate selective glutamate receptor activity(GO:0015277) |
| 0.3 | 0.8 | GO:0001007 | transcription factor activity, RNA polymerase III transcription factor binding(GO:0001007) |
| 0.3 | 4.1 | GO:0004707 | MAP kinase activity(GO:0004707) |
| 0.3 | 2.3 | GO:0043199 | sulfate binding(GO:0043199) |
| 0.3 | 3.6 | GO:0031432 | titin binding(GO:0031432) |
| 0.3 | 6.3 | GO:0008188 | neuropeptide receptor activity(GO:0008188) |
| 0.2 | 4.2 | GO:0070840 | dynein complex binding(GO:0070840) |
| 0.2 | 0.7 | GO:0061578 | Lys63-specific deubiquitinase activity(GO:0061578) |
| 0.2 | 5.7 | GO:0017075 | syntaxin-1 binding(GO:0017075) |
| 0.2 | 59.1 | GO:0004252 | serine-type endopeptidase activity(GO:0004252) |
| 0.2 | 4.4 | GO:0015467 | G-protein activated inward rectifier potassium channel activity(GO:0015467) |
| 0.2 | 1.5 | GO:0005504 | fatty acid binding(GO:0005504) |
| 0.2 | 1.0 | GO:0004699 | calcium-independent protein kinase C activity(GO:0004699) |
| 0.2 | 13.6 | GO:0035064 | methylated histone binding(GO:0035064) |
| 0.2 | 3.4 | GO:0017154 | semaphorin receptor activity(GO:0017154) |
| 0.2 | 2.2 | GO:0043522 | leucine zipper domain binding(GO:0043522) |
| 0.2 | 28.7 | GO:0001227 | transcriptional repressor activity, RNA polymerase II transcription regulatory region sequence-specific binding(GO:0001227) |
| 0.2 | 252.1 | GO:0003700 | nucleic acid binding transcription factor activity(GO:0001071) transcription factor activity, sequence-specific DNA binding(GO:0003700) |
| 0.2 | 10.0 | GO:0005484 | SNAP receptor activity(GO:0005484) |
| 0.2 | 68.0 | GO:0005096 | GTPase activator activity(GO:0005096) |
| 0.2 | 0.9 | GO:0008140 | cAMP response element binding protein binding(GO:0008140) |
| 0.2 | 0.7 | GO:0003845 | 11-beta-hydroxysteroid dehydrogenase [NAD(P)] activity(GO:0003845) |
| 0.2 | 1.6 | GO:0042609 | CD4 receptor binding(GO:0042609) |
| 0.2 | 5.6 | GO:0042288 | MHC class I protein binding(GO:0042288) |
| 0.2 | 21.8 | GO:0004867 | serine-type endopeptidase inhibitor activity(GO:0004867) |
| 0.2 | 1.3 | GO:0050291 | sphingosine N-acyltransferase activity(GO:0050291) |
| 0.2 | 3.9 | GO:0070330 | aromatase activity(GO:0070330) |
| 0.2 | 5.8 | GO:0003746 | translation elongation factor activity(GO:0003746) |
| 0.2 | 2.3 | GO:0043274 | phospholipase binding(GO:0043274) |
| 0.2 | 4.4 | GO:0008484 | sulfuric ester hydrolase activity(GO:0008484) |
| 0.2 | 5.1 | GO:0004181 | metallocarboxypeptidase activity(GO:0004181) |
| 0.2 | 1.6 | GO:0005005 | transmembrane-ephrin receptor activity(GO:0005005) |
| 0.2 | 1.6 | GO:0035035 | histone acetyltransferase binding(GO:0035035) |
| 0.2 | 1.8 | GO:0051428 | peptide hormone receptor binding(GO:0051428) |
| 0.2 | 14.0 | GO:0004004 | ATP-dependent RNA helicase activity(GO:0004004) |
| 0.2 | 5.4 | GO:0005184 | neuropeptide hormone activity(GO:0005184) |
| 0.2 | 2.1 | GO:0043015 | gamma-tubulin binding(GO:0043015) |
| 0.2 | 1.3 | GO:0038132 | neuregulin binding(GO:0038132) |
| 0.2 | 7.3 | GO:0005158 | insulin receptor binding(GO:0005158) |
| 0.2 | 4.8 | GO:0046961 | proton-transporting ATPase activity, rotational mechanism(GO:0046961) |
| 0.2 | 4.2 | GO:0016409 | palmitoyltransferase activity(GO:0016409) |
| 0.2 | 3.4 | GO:0030742 | GTP-dependent protein binding(GO:0030742) |
| 0.2 | 1.6 | GO:0004062 | aryl sulfotransferase activity(GO:0004062) |
| 0.2 | 2.3 | GO:0008373 | sialyltransferase activity(GO:0008373) |
| 0.2 | 1.0 | GO:0031014 | troponin T binding(GO:0031014) |
| 0.2 | 1.9 | GO:0015379 | potassium:chloride symporter activity(GO:0015379) potassium ion symporter activity(GO:0022820) |
| 0.2 | 1.0 | GO:0031433 | telethonin binding(GO:0031433) |
| 0.2 | 1.4 | GO:0003810 | protein-glutamine gamma-glutamyltransferase activity(GO:0003810) |
| 0.2 | 27.2 | GO:0005085 | guanyl-nucleotide exchange factor activity(GO:0005085) |
| 0.2 | 7.5 | GO:0022843 | voltage-gated cation channel activity(GO:0022843) |
| 0.2 | 2.5 | GO:0004435 | phosphatidylinositol phospholipase C activity(GO:0004435) |
| 0.2 | 1.3 | GO:0072349 | modified amino acid transmembrane transporter activity(GO:0072349) |
| 0.2 | 2.3 | GO:0016805 | dipeptidase activity(GO:0016805) |
| 0.2 | 0.5 | GO:0005148 | prolactin receptor binding(GO:0005148) |
| 0.2 | 5.7 | GO:0015347 | sodium-independent organic anion transmembrane transporter activity(GO:0015347) |
| 0.2 | 1.5 | GO:0043024 | ribosomal small subunit binding(GO:0043024) |
| 0.1 | 1.9 | GO:0017081 | chloride channel regulator activity(GO:0017081) |
| 0.1 | 0.3 | GO:0008376 | acetylgalactosaminyltransferase activity(GO:0008376) |
| 0.1 | 1.6 | GO:0051434 | BH3 domain binding(GO:0051434) |
| 0.1 | 2.5 | GO:0070006 | metalloaminopeptidase activity(GO:0070006) |
| 0.1 | 7.6 | GO:0004869 | cysteine-type endopeptidase inhibitor activity(GO:0004869) |
| 0.1 | 0.4 | GO:0061513 | hexose phosphate transmembrane transporter activity(GO:0015119) organophosphate:inorganic phosphate antiporter activity(GO:0015315) hexose-phosphate:inorganic phosphate antiporter activity(GO:0015526) glucose 6-phosphate:inorganic phosphate antiporter activity(GO:0061513) |
| 0.1 | 0.7 | GO:0004991 | parathyroid hormone receptor activity(GO:0004991) |
| 0.1 | 1.1 | GO:0046703 | natural killer cell lectin-like receptor binding(GO:0046703) |
| 0.1 | 2.2 | GO:0005522 | profilin binding(GO:0005522) |
| 0.1 | 1.7 | GO:0097109 | neuroligin family protein binding(GO:0097109) |
| 0.1 | 1.3 | GO:0035381 | extracellular ATP-gated cation channel activity(GO:0004931) ATP-gated ion channel activity(GO:0035381) |
| 0.1 | 3.2 | GO:0003887 | DNA-directed DNA polymerase activity(GO:0003887) |
| 0.1 | 1.3 | GO:0043395 | heparan sulfate proteoglycan binding(GO:0043395) |
| 0.1 | 0.6 | GO:0008607 | phosphorylase kinase regulator activity(GO:0008607) |
| 0.1 | 1.0 | GO:0042834 | peptidoglycan binding(GO:0042834) |
| 0.1 | 1.6 | GO:0071889 | 14-3-3 protein binding(GO:0071889) |
| 0.1 | 1.1 | GO:0030881 | beta-2-microglobulin binding(GO:0030881) |
| 0.1 | 1.8 | GO:0043325 | phosphatidylinositol-3,4-bisphosphate binding(GO:0043325) |
| 0.1 | 0.6 | GO:0051425 | PTB domain binding(GO:0051425) |
| 0.1 | 0.4 | GO:0003938 | IMP dehydrogenase activity(GO:0003938) |
| 0.1 | 8.5 | GO:0005261 | cation channel activity(GO:0005261) |
| 0.1 | 1.7 | GO:0030898 | actin-dependent ATPase activity(GO:0030898) |
| 0.1 | 0.8 | GO:0008474 | palmitoyl-(protein) hydrolase activity(GO:0008474) palmitoyl hydrolase activity(GO:0098599) |
| 0.1 | 1.9 | GO:0005523 | tropomyosin binding(GO:0005523) |
| 0.1 | 0.8 | GO:0004723 | calcium-dependent protein serine/threonine phosphatase activity(GO:0004723) |
| 0.1 | 3.0 | GO:0008139 | nuclear localization sequence binding(GO:0008139) |
| 0.1 | 1.2 | GO:0005391 | sodium:potassium-exchanging ATPase activity(GO:0005391) |
| 0.1 | 0.7 | GO:0004000 | adenosine deaminase activity(GO:0004000) |
| 0.1 | 0.2 | GO:0015165 | pyrimidine nucleotide-sugar transmembrane transporter activity(GO:0015165) |
| 0.1 | 0.8 | GO:0017091 | AU-rich element binding(GO:0017091) |
| 0.1 | 2.2 | GO:0004709 | MAP kinase kinase kinase activity(GO:0004709) |
| 0.1 | 0.8 | GO:0004128 | cytochrome-b5 reductase activity, acting on NAD(P)H(GO:0004128) |
| 0.1 | 0.4 | GO:0016427 | tRNA (cytosine) methyltransferase activity(GO:0016427) |
| 0.1 | 0.3 | GO:0004102 | choline O-acetyltransferase activity(GO:0004102) |
| 0.1 | 1.2 | GO:0016783 | sulfurtransferase activity(GO:0016783) |
| 0.1 | 1.8 | GO:0005123 | death receptor binding(GO:0005123) |
| 0.1 | 0.6 | GO:0015129 | lactate transmembrane transporter activity(GO:0015129) |
| 0.1 | 0.2 | GO:0097100 | supercoiled DNA binding(GO:0097100) |
| 0.1 | 1.2 | GO:0016854 | racemase and epimerase activity(GO:0016854) |
| 0.1 | 0.8 | GO:0001784 | phosphotyrosine binding(GO:0001784) |
| 0.1 | 0.2 | GO:0034041 | sterol-transporting ATPase activity(GO:0034041) |
| 0.1 | 0.5 | GO:1990782 | protein tyrosine kinase binding(GO:1990782) |
| 0.1 | 1.3 | GO:0008093 | cytoskeletal adaptor activity(GO:0008093) |
| 0.1 | 0.7 | GO:0008392 | arachidonic acid monooxygenase activity(GO:0008391) arachidonic acid epoxygenase activity(GO:0008392) |
| 0.1 | 0.7 | GO:0048018 | receptor agonist activity(GO:0048018) |
| 0.1 | 0.4 | GO:0016494 | C-X-C chemokine receptor activity(GO:0016494) |
| 0.1 | 10.2 | GO:0005125 | cytokine activity(GO:0005125) |
| 0.1 | 0.6 | GO:0046875 | ephrin receptor binding(GO:0046875) |
| 0.1 | 1.6 | GO:0031683 | G-protein beta/gamma-subunit complex binding(GO:0031683) |
| 0.1 | 0.6 | GO:0008603 | cAMP-dependent protein kinase regulator activity(GO:0008603) |
| 0.0 | 0.2 | GO:0043533 | inositol 1,3,4,5 tetrakisphosphate binding(GO:0043533) |
| 0.0 | 0.2 | GO:0046870 | cadmium ion binding(GO:0046870) |
| 0.0 | 0.7 | GO:0001103 | RNA polymerase II repressing transcription factor binding(GO:0001103) |
| 0.0 | 0.7 | GO:0004190 | aspartic-type endopeptidase activity(GO:0004190) aspartic-type peptidase activity(GO:0070001) |
| 0.0 | 0.3 | GO:0004439 | phosphatidylinositol-4,5-bisphosphate 5-phosphatase activity(GO:0004439) |
| 0.0 | 0.2 | GO:0043560 | insulin receptor substrate binding(GO:0043560) |
| 0.0 | 0.7 | GO:0017022 | myosin binding(GO:0017022) |
| 0.0 | 0.4 | GO:0000149 | SNARE binding(GO:0000149) |
| 0.0 | 1.2 | GO:0008138 | protein tyrosine/serine/threonine phosphatase activity(GO:0008138) |
| 0.0 | 0.4 | GO:0097602 | cullin family protein binding(GO:0097602) |
| 0.0 | 0.2 | GO:0017077 | oxidative phosphorylation uncoupler activity(GO:0017077) |
| 0.0 | 1.0 | GO:0042826 | histone deacetylase binding(GO:0042826) |
| 0.0 | 0.2 | GO:0004645 | phosphorylase activity(GO:0004645) |
| 0.0 | 0.5 | GO:0015175 | neutral amino acid transmembrane transporter activity(GO:0015175) |
| 0.0 | 0.4 | GO:0030331 | estrogen receptor binding(GO:0030331) |
| 0.0 | 0.4 | GO:0042813 | Wnt-activated receptor activity(GO:0042813) |
| 0.0 | 0.5 | GO:0042805 | actinin binding(GO:0042805) |
| 0.0 | 0.1 | GO:0003998 | acylphosphatase activity(GO:0003998) |
| 0.0 | 0.4 | GO:0005044 | scavenger receptor activity(GO:0005044) |
| 0.0 | 0.6 | GO:0003785 | actin monomer binding(GO:0003785) |
| 0.0 | 0.1 | GO:0016724 | ferroxidase activity(GO:0004322) oxidoreductase activity, oxidizing metal ions, oxygen as acceptor(GO:0016724) |
| 0.0 | 1.5 | GO:0019902 | phosphatase binding(GO:0019902) |
| 0.0 | 0.8 | GO:0005201 | extracellular matrix structural constituent(GO:0005201) |
Gene overrepresentation in C2:CP category:
| Log-likelihood per target | Total log-likelihood | Term | Description |
|---|---|---|---|
| 2.6 | 5.2 | PID IL8 CXCR2 PATHWAY | IL8- and CXCR2-mediated signaling events |
| 1.5 | 7.3 | SA G2 AND M PHASES | Cdc25 activates the cdc2/cyclin B complex to induce the G2/M transition. |
| 1.4 | 5.5 | PID ARF6 DOWNSTREAM PATHWAY | Arf6 downstream pathway |
| 1.3 | 13.8 | ST PAC1 RECEPTOR PATHWAY | PAC1 Receptor Pathway |
| 1.2 | 28.2 | PID INTEGRIN5 PATHWAY | Beta5 beta6 beta7 and beta8 integrin cell surface interactions |
| 1.1 | 44.7 | PID IL8 CXCR1 PATHWAY | IL8- and CXCR1-mediated signaling events |
| 0.8 | 7.3 | PID FOXO PATHWAY | FoxO family signaling |
| 0.8 | 41.5 | PID INTEGRIN2 PATHWAY | Beta2 integrin cell surface interactions |
| 0.8 | 18.7 | PID LPA4 PATHWAY | LPA4-mediated signaling events |
| 0.8 | 6.2 | PID TCR CALCIUM PATHWAY | Calcium signaling in the CD4+ TCR pathway |
| 0.8 | 5.3 | SA TRKA RECEPTOR | The TrkA receptor binds nerve growth factor to activate MAP kinase pathways and promote cell growth. |
| 0.7 | 14.2 | PID S1P S1P4 PATHWAY | S1P4 pathway |
| 0.7 | 17.5 | SA PROGRAMMED CELL DEATH | Programmed cell death, or apoptosis, eliminates damaged or unneeded cells. |
| 0.7 | 2.2 | ST IL 13 PATHWAY | Interleukin 13 (IL-13) Pathway |
| 0.7 | 3.5 | PID AR NONGENOMIC PATHWAY | Nongenotropic Androgen signaling |
| 0.7 | 64.5 | PID IL4 2PATHWAY | IL4-mediated signaling events |
| 0.7 | 4.1 | PID IL5 PATHWAY | IL5-mediated signaling events |
| 0.6 | 18.1 | PID EPO PATHWAY | EPO signaling pathway |
| 0.6 | 20.9 | SA MMP CYTOKINE CONNECTION | Cytokines can induce activation of matrix metalloproteinases, which degrade extracellular matrix. |
| 0.6 | 24.4 | PID RAS PATHWAY | Regulation of Ras family activation |
| 0.6 | 17.7 | PID SMAD2 3PATHWAY | Regulation of cytoplasmic and nuclear SMAD2/3 signaling |
| 0.6 | 8.6 | ST MYOCYTE AD PATHWAY | Myocyte Adrenergic Pathway is a specific case of the generalized Adrenergic Pathway. |
| 0.6 | 6.6 | PID P38 MK2 PATHWAY | p38 signaling mediated by MAPKAP kinases |
| 0.5 | 9.3 | PID ERBB1 RECEPTOR PROXIMAL PATHWAY | EGF receptor (ErbB1) signaling pathway |
| 0.5 | 3.8 | ST TYPE I INTERFERON PATHWAY | Type I Interferon (alpha/beta IFN) Pathway |
| 0.5 | 10.2 | ST G ALPHA S PATHWAY | G alpha s Pathway |
| 0.5 | 10.0 | PID FAK PATHWAY | Signaling events mediated by focal adhesion kinase |
| 0.5 | 7.7 | PID HEDGEHOG GLI PATHWAY | Hedgehog signaling events mediated by Gli proteins |
| 0.5 | 16.5 | PID ERBB1 INTERNALIZATION PATHWAY | Internalization of ErbB1 |
| 0.5 | 3.4 | PID EPHRINB REV PATHWAY | Ephrin B reverse signaling |
| 0.5 | 1.4 | ST GRANULE CELL SURVIVAL PATHWAY | Granule Cell Survival Pathway is a specific case of more general PAC1 Receptor Pathway. |
| 0.5 | 5.0 | PID ERBB2 ERBB3 PATHWAY | ErbB2/ErbB3 signaling events |
| 0.4 | 5.8 | PID RANBP2 PATHWAY | Sumoylation by RanBP2 regulates transcriptional repression |
| 0.4 | 11.7 | ST GA12 PATHWAY | G alpha 12 Pathway |
| 0.4 | 2.5 | PID NFAT 3PATHWAY | Role of Calcineurin-dependent NFAT signaling in lymphocytes |
| 0.4 | 8.8 | ST WNT CA2 CYCLIC GMP PATHWAY | Wnt/Ca2+/cyclic GMP signaling. |
| 0.4 | 0.8 | PID NFKAPPAB ATYPICAL PATHWAY | Atypical NF-kappaB pathway |
| 0.4 | 22.0 | PID CDC42 REG PATHWAY | Regulation of CDC42 activity |
| 0.4 | 16.3 | PID LIS1 PATHWAY | Lissencephaly gene (LIS1) in neuronal migration and development |
| 0.4 | 17.6 | ST JNK MAPK PATHWAY | JNK MAPK Pathway |
| 0.4 | 25.6 | PID RAC1 PATHWAY | RAC1 signaling pathway |
| 0.4 | 4.4 | PID IFNG PATHWAY | IFN-gamma pathway |
| 0.4 | 3.3 | PID BMP PATHWAY | BMP receptor signaling |
| 0.4 | 17.6 | SIG BCR SIGNALING PATHWAY | Members of the BCR signaling pathway |
| 0.4 | 18.3 | PID ERBB4 PATHWAY | ErbB4 signaling events |
| 0.4 | 12.0 | PID RAC1 REG PATHWAY | Regulation of RAC1 activity |
| 0.4 | 1.8 | PID LYMPH ANGIOGENESIS PATHWAY | VEGFR3 signaling in lymphatic endothelium |
| 0.4 | 19.4 | PID FGF PATHWAY | FGF signaling pathway |
| 0.3 | 12.2 | PID ARF6 PATHWAY | Arf6 signaling events |
| 0.3 | 24.1 | PID HNF3A PATHWAY | FOXA1 transcription factor network |
| 0.3 | 12.3 | PID RXR VDR PATHWAY | RXR and RAR heterodimerization with other nuclear receptor |
| 0.3 | 8.4 | PID BCR 5PATHWAY | BCR signaling pathway |
| 0.3 | 5.5 | PID BETA CATENIN NUC PATHWAY | Regulation of nuclear beta catenin signaling and target gene transcription |
| 0.3 | 4.6 | PID S1P S1P3 PATHWAY | S1P3 pathway |
| 0.3 | 4.9 | PID LYSOPHOSPHOLIPID PATHWAY | LPA receptor mediated events |
| 0.3 | 7.4 | PID CIRCADIAN PATHWAY | Circadian rhythm pathway |
| 0.3 | 1.2 | PID IL27 PATHWAY | IL27-mediated signaling events |
| 0.3 | 2.9 | PID NETRIN PATHWAY | Netrin-mediated signaling events |
| 0.3 | 45.7 | NABA ECM AFFILIATED | Genes encoding proteins affiliated structurally or functionally to extracellular matrix proteins |
| 0.3 | 14.6 | PID AVB3 INTEGRIN PATHWAY | Integrins in angiogenesis |
| 0.3 | 4.7 | PID HEDGEHOG 2PATHWAY | Signaling events mediated by the Hedgehog family |
| 0.3 | 13.5 | NABA BASEMENT MEMBRANES | Genes encoding structural components of basement membranes |
| 0.3 | 6.5 | SIG CD40PATHWAYMAP | Genes related to CD40 signaling |
| 0.3 | 14.7 | PID HNF3B PATHWAY | FOXA2 and FOXA3 transcription factor networks |
| 0.3 | 1.1 | PID AVB3 OPN PATHWAY | Osteopontin-mediated events |
| 0.3 | 5.7 | PID WNT SIGNALING PATHWAY | Wnt signaling network |
| 0.3 | 5.5 | PID INTEGRIN A9B1 PATHWAY | Alpha9 beta1 integrin signaling events |
| 0.2 | 7.7 | PID KIT PATHWAY | Signaling events mediated by Stem cell factor receptor (c-Kit) |
| 0.2 | 4.2 | PID RET PATHWAY | Signaling events regulated by Ret tyrosine kinase |
| 0.2 | 2.4 | PID NECTIN PATHWAY | Nectin adhesion pathway |
| 0.2 | 14.9 | PID IL12 2PATHWAY | IL12-mediated signaling events |
| 0.2 | 1.2 | PID IL2 PI3K PATHWAY | IL2 signaling events mediated by PI3K |
| 0.2 | 4.6 | PID ECADHERIN STABILIZATION PATHWAY | Stabilization and expansion of the E-cadherin adherens junction |
| 0.2 | 8.9 | PID CERAMIDE PATHWAY | Ceramide signaling pathway |
| 0.2 | 10.4 | PID FANCONI PATHWAY | Fanconi anemia pathway |
| 0.2 | 5.5 | ST WNT BETA CATENIN PATHWAY | Wnt/beta-catenin Pathway |
| 0.2 | 1.0 | PID ANTHRAX PATHWAY | Cellular roles of Anthrax toxin |
| 0.2 | 18.1 | PID MYC REPRESS PATHWAY | Validated targets of C-MYC transcriptional repression |
| 0.2 | 61.5 | NABA SECRETED FACTORS | Genes encoding secreted soluble factors |
| 0.2 | 3.5 | PID ENDOTHELIN PATHWAY | Endothelins |
| 0.2 | 5.7 | PID FCER1 PATHWAY | Fc-epsilon receptor I signaling in mast cells |
| 0.2 | 9.8 | PID ERA GENOMIC PATHWAY | Validated nuclear estrogen receptor alpha network |
| 0.2 | 41.2 | NABA ECM REGULATORS | Genes encoding enzymes and their regulators involved in the remodeling of the extracellular matrix |
| 0.2 | 2.4 | PID IL2 1PATHWAY | IL2-mediated signaling events |
| 0.2 | 3.1 | PID NCADHERIN PATHWAY | N-cadherin signaling events |
| 0.2 | 2.0 | PID FAS PATHWAY | FAS (CD95) signaling pathway |
| 0.1 | 1.6 | PID EPHA FWDPATHWAY | EPHA forward signaling |
| 0.1 | 3.0 | ST ERK1 ERK2 MAPK PATHWAY | ERK1/ERK2 MAPK Pathway |
| 0.1 | 1.8 | SA REG CASCADE OF CYCLIN EXPR | Expression of cyclins regulates progression through the cell cycle by activating cyclin-dependent kinases. |
| 0.1 | 1.6 | PID BETA CATENIN DEG PATHWAY | Degradation of beta catenin |
| 0.1 | 1.3 | PID INTEGRIN1 PATHWAY | Beta1 integrin cell surface interactions |
| 0.1 | 1.4 | PID ALK1 PATHWAY | ALK1 signaling events |
| 0.1 | 1.3 | PID EPHB FWD PATHWAY | EPHB forward signaling |
| 0.1 | 1.5 | PID IL2 STAT5 PATHWAY | IL2 signaling events mediated by STAT5 |
| 0.1 | 2.1 | PID CONE PATHWAY | Visual signal transduction: Cones |
| 0.1 | 1.6 | PID THROMBIN PAR1 PATHWAY | PAR1-mediated thrombin signaling events |
| 0.1 | 4.0 | PID RHOA REG PATHWAY | Regulation of RhoA activity |
| 0.1 | 3.4 | PID RB 1PATHWAY | Regulation of retinoblastoma protein |
| 0.1 | 2.4 | PID P73PATHWAY | p73 transcription factor network |
| 0.1 | 2.1 | PID LKB1 PATHWAY | LKB1 signaling events |
| 0.1 | 0.7 | PID SHP2 PATHWAY | SHP2 signaling |
| 0.1 | 0.6 | PID INTEGRIN A4B1 PATHWAY | Alpha4 beta1 integrin signaling events |
| 0.1 | 3.4 | NABA PROTEOGLYCANS | Genes encoding proteoglycans |
| 0.1 | 2.1 | PID NFAT TFPATHWAY | Calcineurin-regulated NFAT-dependent transcription in lymphocytes |
| 0.1 | 0.4 | PID CXCR3 PATHWAY | CXCR3-mediated signaling events |
| 0.0 | 1.9 | PID AR TF PATHWAY | Regulation of Androgen receptor activity |
| 0.0 | 0.6 | PID CXCR4 PATHWAY | CXCR4-mediated signaling events |
| 0.0 | 0.7 | PID FRA PATHWAY | Validated transcriptional targets of AP1 family members Fra1 and Fra2 |
| 0.0 | 0.6 | PID TAP63 PATHWAY | Validated transcriptional targets of TAp63 isoforms |
Gene overrepresentation in C2:CP:REACTOME category:
| Log-likelihood per target | Total log-likelihood | Term | Description |
|---|---|---|---|
| 2.0 | 6.1 | REACTOME REGULATION OF KIT SIGNALING | Genes involved in Regulation of KIT signaling |
| 1.9 | 9.5 | REACTOME BINDING AND ENTRY OF HIV VIRION | Genes involved in Binding and entry of HIV virion |
| 1.8 | 36.4 | REACTOME SEMA3A PLEXIN REPULSION SIGNALING BY INHIBITING INTEGRIN ADHESION | Genes involved in SEMA3A-Plexin repulsion signaling by inhibiting Integrin adhesion |
| 1.6 | 33.4 | REACTOME INITIAL TRIGGERING OF COMPLEMENT | Genes involved in Initial triggering of complement |
| 1.3 | 15.6 | REACTOME ADENYLATE CYCLASE ACTIVATING PATHWAY | Genes involved in Adenylate cyclase activating pathway |
| 1.1 | 12.6 | REACTOME RECEPTOR LIGAND BINDING INITIATES THE SECOND PROTEOLYTIC CLEAVAGE OF NOTCH RECEPTOR | Genes involved in Receptor-ligand binding initiates the second proteolytic cleavage of Notch receptor |
| 1.1 | 27.4 | REACTOME AMINE DERIVED HORMONES | Genes involved in Amine-derived hormones |
| 1.1 | 9.1 | REACTOME ETHANOL OXIDATION | Genes involved in Ethanol oxidation |
| 1.1 | 25.2 | REACTOME PLATELET SENSITIZATION BY LDL | Genes involved in Platelet sensitization by LDL |
| 1.1 | 5.4 | REACTOME A TETRASACCHARIDE LINKER SEQUENCE IS REQUIRED FOR GAG SYNTHESIS | Genes involved in A tetrasaccharide linker sequence is required for GAG synthesis |
| 1.1 | 18.3 | REACTOME DSCAM INTERACTIONS | Genes involved in DSCAM interactions |
| 1.0 | 50.3 | REACTOME VOLTAGE GATED POTASSIUM CHANNELS | Genes involved in Voltage gated Potassium channels |
| 1.0 | 3.0 | REACTOME G ALPHA Z SIGNALLING EVENTS | Genes involved in G alpha (z) signalling events |
| 1.0 | 13.8 | REACTOME PASSIVE TRANSPORT BY AQUAPORINS | Genes involved in Passive Transport by Aquaporins |
| 1.0 | 9.7 | REACTOME CTNNB1 PHOSPHORYLATION CASCADE | Genes involved in Beta-catenin phosphorylation cascade |
| 0.9 | 30.3 | REACTOME INTERACTION BETWEEN L1 AND ANKYRINS | Genes involved in Interaction between L1 and Ankyrins |
| 0.9 | 0.9 | REACTOME VIF MEDIATED DEGRADATION OF APOBEC3G | Genes involved in Vif-mediated degradation of APOBEC3G |
| 0.9 | 11.0 | REACTOME PLATELET CALCIUM HOMEOSTASIS | Genes involved in Platelet calcium homeostasis |
| 0.9 | 19.6 | REACTOME TRANSLOCATION OF ZAP 70 TO IMMUNOLOGICAL SYNAPSE | Genes involved in Translocation of ZAP-70 to Immunological synapse |
| 0.9 | 17.5 | REACTOME PRE NOTCH PROCESSING IN GOLGI | Genes involved in Pre-NOTCH Processing in Golgi |
| 0.9 | 37.3 | REACTOME EFFECTS OF PIP2 HYDROLYSIS | Genes involved in Effects of PIP2 hydrolysis |
| 0.9 | 46.9 | REACTOME NITRIC OXIDE STIMULATES GUANYLATE CYCLASE | Genes involved in Nitric oxide stimulates guanylate cyclase |
| 0.8 | 32.7 | REACTOME LATENT INFECTION OF HOMO SAPIENS WITH MYCOBACTERIUM TUBERCULOSIS | Genes involved in Latent infection of Homo sapiens with Mycobacterium tuberculosis |
| 0.8 | 16.9 | REACTOME YAP1 AND WWTR1 TAZ STIMULATED GENE EXPRESSION | Genes involved in YAP1- and WWTR1 (TAZ)-stimulated gene expression |
| 0.8 | 15.1 | REACTOME TERMINATION OF O GLYCAN BIOSYNTHESIS | Genes involved in Termination of O-glycan biosynthesis |
| 0.8 | 7.0 | REACTOME RETROGRADE NEUROTROPHIN SIGNALLING | Genes involved in Retrograde neurotrophin signalling |
| 0.8 | 13.2 | REACTOME SPRY REGULATION OF FGF SIGNALING | Genes involved in Spry regulation of FGF signaling |
| 0.8 | 10.8 | REACTOME CRMPS IN SEMA3A SIGNALING | Genes involved in CRMPs in Sema3A signaling |
| 0.7 | 13.3 | REACTOME ACYL CHAIN REMODELLING OF PI | Genes involved in Acyl chain remodelling of PI |
| 0.7 | 8.9 | REACTOME ROLE OF DCC IN REGULATING APOPTOSIS | Genes involved in Role of DCC in regulating apoptosis |
| 0.7 | 3.9 | REACTOME TETRAHYDROBIOPTERIN BH4 SYNTHESIS RECYCLING SALVAGE AND REGULATION | Genes involved in Tetrahydrobiopterin (BH4) synthesis, recycling, salvage and regulation |
| 0.6 | 3.9 | REACTOME ACTIVATION OF RAC | Genes involved in Activation of Rac |
| 0.6 | 53.8 | REACTOME IMMUNOREGULATORY INTERACTIONS BETWEEN A LYMPHOID AND A NON LYMPHOID CELL | Genes involved in Immunoregulatory interactions between a Lymphoid and a non-Lymphoid cell |
| 0.6 | 14.7 | REACTOME REGULATION OF AMPK ACTIVITY VIA LKB1 | Genes involved in Regulation of AMPK activity via LKB1 |
| 0.6 | 11.3 | REACTOME SYNTHESIS OF PE | Genes involved in Synthesis of PE |
| 0.6 | 17.6 | REACTOME GABA A RECEPTOR ACTIVATION | Genes involved in GABA A receptor activation |
| 0.6 | 7.4 | REACTOME SEROTONIN RECEPTORS | Genes involved in Serotonin receptors |
| 0.6 | 6.6 | REACTOME PLATELET ADHESION TO EXPOSED COLLAGEN | Genes involved in Platelet Adhesion to exposed collagen |
| 0.6 | 5.5 | REACTOME CA DEPENDENT EVENTS | Genes involved in Ca-dependent events |
| 0.6 | 8.3 | REACTOME REVERSIBLE HYDRATION OF CARBON DIOXIDE | Genes involved in Reversible Hydration of Carbon Dioxide |
| 0.5 | 3.7 | REACTOME TANDEM PORE DOMAIN POTASSIUM CHANNELS | Genes involved in Tandem pore domain potassium channels |
| 0.5 | 7.4 | REACTOME HORMONE LIGAND BINDING RECEPTORS | Genes involved in Hormone ligand-binding receptors |
| 0.5 | 2.6 | REACTOME ADENYLATE CYCLASE INHIBITORY PATHWAY | Genes involved in Adenylate cyclase inhibitory pathway |
| 0.5 | 14.8 | REACTOME SIGNALING BY NODAL | Genes involved in Signaling by NODAL |
| 0.5 | 9.1 | REACTOME NOREPINEPHRINE NEUROTRANSMITTER RELEASE CYCLE | Genes involved in Norepinephrine Neurotransmitter Release Cycle |
| 0.5 | 7.5 | REACTOME BILE SALT AND ORGANIC ANION SLC TRANSPORTERS | Genes involved in Bile salt and organic anion SLC transporters |
| 0.5 | 10.4 | REACTOME FACILITATIVE NA INDEPENDENT GLUCOSE TRANSPORTERS | Genes involved in Facilitative Na+-independent glucose transporters |
| 0.5 | 14.1 | REACTOME NEGATIVE REGULATION OF FGFR SIGNALING | Genes involved in Negative regulation of FGFR signaling |
| 0.4 | 12.5 | REACTOME AMINO ACID SYNTHESIS AND INTERCONVERSION TRANSAMINATION | Genes involved in Amino acid synthesis and interconversion (transamination) |
| 0.4 | 3.6 | REACTOME THROMBIN SIGNALLING THROUGH PROTEINASE ACTIVATED RECEPTORS PARS | Genes involved in Thrombin signalling through proteinase activated receptors (PARs) |
| 0.4 | 1.3 | REACTOME ENDOSOMAL VACUOLAR PATHWAY | Genes involved in Endosomal/Vacuolar pathway |
| 0.4 | 22.7 | REACTOME BMAL1 CLOCK NPAS2 ACTIVATES CIRCADIAN EXPRESSION | Genes involved in BMAL1:CLOCK/NPAS2 Activates Circadian Expression |
| 0.4 | 13.4 | REACTOME EGFR DOWNREGULATION | Genes involved in EGFR downregulation |
| 0.4 | 15.0 | REACTOME POTASSIUM CHANNELS | Genes involved in Potassium Channels |
| 0.4 | 11.5 | REACTOME BRANCHED CHAIN AMINO ACID CATABOLISM | Genes involved in Branched-chain amino acid catabolism |
| 0.4 | 8.0 | REACTOME OTHER SEMAPHORIN INTERACTIONS | Genes involved in Other semaphorin interactions |
| 0.4 | 18.5 | REACTOME ELONGATION ARREST AND RECOVERY | Genes involved in Elongation arrest and recovery |
| 0.4 | 7.1 | REACTOME KERATAN SULFATE BIOSYNTHESIS | Genes involved in Keratan sulfate biosynthesis |
| 0.4 | 1.3 | REACTOME INTEGRATION OF ENERGY METABOLISM | Genes involved in Integration of energy metabolism |
| 0.4 | 5.0 | REACTOME NGF SIGNALLING VIA TRKA FROM THE PLASMA MEMBRANE | Genes involved in NGF signalling via TRKA from the plasma membrane |
| 0.4 | 4.6 | REACTOME REGULATION OF INSULIN SECRETION BY ACETYLCHOLINE | Genes involved in Regulation of Insulin Secretion by Acetylcholine |
| 0.4 | 13.1 | REACTOME HS GAG BIOSYNTHESIS | Genes involved in HS-GAG biosynthesis |
| 0.4 | 4.5 | REACTOME OPSINS | Genes involved in Opsins |
| 0.4 | 12.2 | REACTOME AMINE LIGAND BINDING RECEPTORS | Genes involved in Amine ligand-binding receptors |
| 0.4 | 8.1 | REACTOME GABA SYNTHESIS RELEASE REUPTAKE AND DEGRADATION | Genes involved in GABA synthesis, release, reuptake and degradation |
| 0.4 | 10.5 | REACTOME ADHERENS JUNCTIONS INTERACTIONS | Genes involved in Adherens junctions interactions |
| 0.4 | 6.8 | REACTOME TRAF3 DEPENDENT IRF ACTIVATION PATHWAY | Genes involved in TRAF3-dependent IRF activation pathway |
| 0.4 | 8.4 | REACTOME CHYLOMICRON MEDIATED LIPID TRANSPORT | Genes involved in Chylomicron-mediated lipid transport |
| 0.4 | 15.0 | REACTOME TIGHT JUNCTION INTERACTIONS | Genes involved in Tight junction interactions |
| 0.4 | 16.2 | REACTOME ION TRANSPORT BY P TYPE ATPASES | Genes involved in Ion transport by P-type ATPases |
| 0.4 | 3.0 | REACTOME GLUTAMATE NEUROTRANSMITTER RELEASE CYCLE | Genes involved in Glutamate Neurotransmitter Release Cycle |
| 0.3 | 5.9 | REACTOME REPAIR SYNTHESIS FOR GAP FILLING BY DNA POL IN TC NER | Genes involved in Repair synthesis for gap-filling by DNA polymerase in TC-NER |
| 0.3 | 27.1 | REACTOME PHASE1 FUNCTIONALIZATION OF COMPOUNDS | Genes involved in Phase 1 - Functionalization of compounds |
| 0.3 | 3.8 | REACTOME DCC MEDIATED ATTRACTIVE SIGNALING | Genes involved in DCC mediated attractive signaling |
| 0.3 | 12.3 | REACTOME PTM GAMMA CARBOXYLATION HYPUSINE FORMATION AND ARYLSULFATASE ACTIVATION | Genes involved in PTM: gamma carboxylation, hypusine formation and arylsulfatase activation |
| 0.3 | 13.2 | REACTOME INTEGRIN ALPHAIIB BETA3 SIGNALING | Genes involved in Integrin alphaIIb beta3 signaling |
| 0.3 | 5.6 | REACTOME IL 6 SIGNALING | Genes involved in Interleukin-6 signaling |
| 0.3 | 4.5 | REACTOME PYRIMIDINE CATABOLISM | Genes involved in Pyrimidine catabolism |
| 0.3 | 6.6 | REACTOME TRANSPORT OF ORGANIC ANIONS | Genes involved in Transport of organic anions |
| 0.3 | 0.6 | REACTOME INSULIN RECEPTOR RECYCLING | Genes involved in Insulin receptor recycling |
| 0.3 | 5.2 | REACTOME ACTIVATION OF CHAPERONES BY ATF6 ALPHA | Genes involved in Activation of Chaperones by ATF6-alpha |
| 0.3 | 9.2 | REACTOME REGULATION OF BETA CELL DEVELOPMENT | Genes involved in Regulation of beta-cell development |
| 0.3 | 7.6 | REACTOME SMAD2 SMAD3 SMAD4 HETEROTRIMER REGULATES TRANSCRIPTION | Genes involved in SMAD2/SMAD3:SMAD4 heterotrimer regulates transcription |
| 0.3 | 3.3 | REACTOME SIGNAL ATTENUATION | Genes involved in Signal attenuation |
| 0.3 | 50.9 | REACTOME SIGNALING BY RHO GTPASES | Genes involved in Signaling by Rho GTPases |
| 0.3 | 4.9 | REACTOME P38MAPK EVENTS | Genes involved in p38MAPK events |
| 0.3 | 7.4 | REACTOME N GLYCAN ANTENNAE ELONGATION IN THE MEDIAL TRANS GOLGI | Genes involved in N-glycan antennae elongation in the medial/trans-Golgi |
| 0.3 | 7.9 | REACTOME COMPLEMENT CASCADE | Genes involved in Complement cascade |
| 0.3 | 78.6 | REACTOME GENERIC TRANSCRIPTION PATHWAY | Genes involved in Generic Transcription Pathway |
| 0.3 | 5.3 | REACTOME P2Y RECEPTORS | Genes involved in P2Y receptors |
| 0.3 | 6.3 | REACTOME DOWNREGULATION OF ERBB2 ERBB3 SIGNALING | Genes involved in Downregulation of ERBB2:ERBB3 signaling |
| 0.3 | 1.9 | REACTOME SYNTHESIS OF BILE ACIDS AND BILE SALTS VIA 24 HYDROXYCHOLESTEROL | Genes involved in Synthesis of bile acids and bile salts via 24-hydroxycholesterol |
| 0.3 | 7.0 | REACTOME CS DS DEGRADATION | Genes involved in CS/DS degradation |
| 0.3 | 15.8 | REACTOME NOTCH1 INTRACELLULAR DOMAIN REGULATES TRANSCRIPTION | Genes involved in NOTCH1 Intracellular Domain Regulates Transcription |
| 0.3 | 2.9 | REACTOME AKT PHOSPHORYLATES TARGETS IN THE CYTOSOL | Genes involved in AKT phosphorylates targets in the cytosol |
| 0.2 | 2.2 | REACTOME SYNTHESIS OF PIPS AT THE GOLGI MEMBRANE | Genes involved in Synthesis of PIPs at the Golgi membrane |
| 0.2 | 15.1 | REACTOME CHEMOKINE RECEPTORS BIND CHEMOKINES | Genes involved in Chemokine receptors bind chemokines |
| 0.2 | 13.2 | REACTOME AMINO ACID AND OLIGOPEPTIDE SLC TRANSPORTERS | Genes involved in Amino acid and oligopeptide SLC transporters |
| 0.2 | 3.9 | REACTOME EICOSANOID LIGAND BINDING RECEPTORS | Genes involved in Eicosanoid ligand-binding receptors |
| 0.2 | 0.7 | REACTOME PD1 SIGNALING | Genes involved in PD-1 signaling |
| 0.2 | 2.6 | REACTOME TRAFFICKING AND PROCESSING OF ENDOSOMAL TLR | Genes involved in Trafficking and processing of endosomal TLR |
| 0.2 | 2.3 | REACTOME LIGAND GATED ION CHANNEL TRANSPORT | Genes involved in Ligand-gated ion channel transport |
| 0.2 | 1.4 | REACTOME ACTIVATION OF IRF3 IRF7 MEDIATED BY TBK1 IKK EPSILON | Genes involved in Activation of IRF3/IRF7 mediated by TBK1/IKK epsilon |
| 0.2 | 5.5 | REACTOME UNBLOCKING OF NMDA RECEPTOR GLUTAMATE BINDING AND ACTIVATION | Genes involved in Unblocking of NMDA receptor, glutamate binding and activation |
| 0.2 | 14.5 | REACTOME INTERFERON ALPHA BETA SIGNALING | Genes involved in Interferon alpha/beta signaling |
| 0.2 | 3.7 | REACTOME SIGNAL REGULATORY PROTEIN SIRP FAMILY INTERACTIONS | Genes involved in Signal regulatory protein (SIRP) family interactions |
| 0.2 | 19.9 | REACTOME MEIOTIC SYNAPSIS | Genes involved in Meiotic Synapsis |
| 0.2 | 0.9 | REACTOME CROSS PRESENTATION OF SOLUBLE EXOGENOUS ANTIGENS ENDOSOMES | Genes involved in Cross-presentation of soluble exogenous antigens (endosomes) |
| 0.2 | 8.9 | REACTOME MEIOSIS | Genes involved in Meiosis |
| 0.2 | 10.4 | REACTOME INTEGRIN CELL SURFACE INTERACTIONS | Genes involved in Integrin cell surface interactions |
| 0.2 | 4.3 | REACTOME RNA POL III TRANSCRIPTION INITIATION FROM TYPE 2 PROMOTER | Genes involved in RNA Polymerase III Transcription Initiation From Type 2 Promoter |
| 0.2 | 0.2 | REACTOME TRANSPORT OF MATURE TRANSCRIPT TO CYTOPLASM | Genes involved in Transport of Mature Transcript to Cytoplasm |
| 0.2 | 2.4 | REACTOME OXYGEN DEPENDENT PROLINE HYDROXYLATION OF HYPOXIA INDUCIBLE FACTOR ALPHA | Genes involved in Oxygen-dependent Proline Hydroxylation of Hypoxia-inducible Factor Alpha |
| 0.2 | 1.5 | REACTOME REGULATION OF HYPOXIA INDUCIBLE FACTOR HIF BY OXYGEN | Genes involved in Regulation of Hypoxia-inducible Factor (HIF) by Oxygen |
| 0.2 | 22.9 | REACTOME FACTORS INVOLVED IN MEGAKARYOCYTE DEVELOPMENT AND PLATELET PRODUCTION | Genes involved in Factors involved in megakaryocyte development and platelet production |
| 0.2 | 1.7 | REACTOME GLYCOPROTEIN HORMONES | Genes involved in Glycoprotein hormones |
| 0.2 | 3.4 | REACTOME IL 7 SIGNALING | Genes involved in Interleukin-7 signaling |
| 0.2 | 5.7 | REACTOME RNA POL I TRANSCRIPTION INITIATION | Genes involved in RNA Polymerase I Transcription Initiation |
| 0.2 | 3.7 | REACTOME DARPP 32 EVENTS | Genes involved in DARPP-32 events |
| 0.2 | 3.7 | REACTOME ANTIGEN ACTIVATES B CELL RECEPTOR LEADING TO GENERATION OF SECOND MESSENGERS | Genes involved in Antigen Activates B Cell Receptor Leading to Generation of Second Messengers |
| 0.2 | 5.2 | REACTOME TRANSPORT TO THE GOLGI AND SUBSEQUENT MODIFICATION | Genes involved in Transport to the Golgi and subsequent modification |
| 0.2 | 1.7 | REACTOME BASIGIN INTERACTIONS | Genes involved in Basigin interactions |
| 0.2 | 1.3 | REACTOME INHIBITION OF INSULIN SECRETION BY ADRENALINE NORADRENALINE | Genes involved in Inhibition of Insulin Secretion by Adrenaline/Noradrenaline |
| 0.2 | 0.8 | REACTOME TRANSFERRIN ENDOCYTOSIS AND RECYCLING | Genes involved in Transferrin endocytosis and recycling |
| 0.2 | 8.9 | REACTOME COLLAGEN FORMATION | Genes involved in Collagen formation |
| 0.2 | 4.5 | REACTOME CYTOSOLIC SULFONATION OF SMALL MOLECULES | Genes involved in Cytosolic sulfonation of small molecules |
| 0.2 | 5.6 | REACTOME EXTRACELLULAR MATRIX ORGANIZATION | Genes involved in Extracellular matrix organization |
| 0.2 | 2.7 | REACTOME CIRCADIAN CLOCK | Genes involved in Circadian Clock |
| 0.1 | 1.5 | REACTOME NA CL DEPENDENT NEUROTRANSMITTER TRANSPORTERS | Genes involved in Na+/Cl- dependent neurotransmitter transporters |
| 0.1 | 0.6 | REACTOME HORMONE SENSITIVE LIPASE HSL MEDIATED TRIACYLGLYCEROL HYDROLYSIS | Genes involved in Hormone-sensitive lipase (HSL)-mediated triacylglycerol hydrolysis |
| 0.1 | 6.1 | REACTOME TRANSCRIPTIONAL REGULATION OF WHITE ADIPOCYTE DIFFERENTIATION | Genes involved in Transcriptional Regulation of White Adipocyte Differentiation |
| 0.1 | 1.8 | REACTOME SEMA3A PAK DEPENDENT AXON REPULSION | Genes involved in Sema3A PAK dependent Axon repulsion |
| 0.1 | 1.2 | REACTOME AMINE COMPOUND SLC TRANSPORTERS | Genes involved in Amine compound SLC transporters |
| 0.1 | 4.0 | REACTOME MYOGENESIS | Genes involved in Myogenesis |
| 0.1 | 1.2 | REACTOME NOD1 2 SIGNALING PATHWAY | Genes involved in NOD1/2 Signaling Pathway |
| 0.1 | 2.9 | REACTOME PROTEOLYTIC CLEAVAGE OF SNARE COMPLEX PROTEINS | Genes involved in Proteolytic cleavage of SNARE complex proteins |
| 0.1 | 1.7 | REACTOME SYNTHESIS OF PIPS AT THE EARLY ENDOSOME MEMBRANE | Genes involved in Synthesis of PIPs at the early endosome membrane |
| 0.1 | 1.9 | REACTOME PI 3K CASCADE | Genes involved in PI-3K cascade |
| 0.1 | 1.6 | REACTOME SIGNALING BY PDGF | Genes involved in Signaling by PDGF |
| 0.1 | 4.6 | REACTOME G ALPHA Q SIGNALLING EVENTS | Genes involved in G alpha (q) signalling events |
| 0.1 | 0.7 | REACTOME SIGNALING BY SCF KIT | Genes involved in Signaling by SCF-KIT |
| 0.1 | 3.2 | REACTOME SPHINGOLIPID DE NOVO BIOSYNTHESIS | Genes involved in Sphingolipid de novo biosynthesis |
| 0.1 | 11.9 | REACTOME PEPTIDE LIGAND BINDING RECEPTORS | Genes involved in Peptide ligand-binding receptors |
| 0.1 | 5.8 | REACTOME STRIATED MUSCLE CONTRACTION | Genes involved in Striated Muscle Contraction |
| 0.1 | 0.8 | REACTOME ACTIVATED NOTCH1 TRANSMITS SIGNAL TO THE NUCLEUS | Genes involved in Activated NOTCH1 Transmits Signal to the Nucleus |
| 0.1 | 1.5 | REACTOME O LINKED GLYCOSYLATION OF MUCINS | Genes involved in O-linked glycosylation of mucins |
| 0.1 | 1.6 | REACTOME SIGNALING BY BMP | Genes involved in Signaling by BMP |
| 0.1 | 1.1 | REACTOME CALNEXIN CALRETICULIN CYCLE | Genes involved in Calnexin/calreticulin cycle |
| 0.1 | 0.3 | REACTOME N GLYCAN TRIMMING IN THE ER AND CALNEXIN CALRETICULIN CYCLE | Genes involved in N-glycan trimming in the ER and Calnexin/Calreticulin cycle |
| 0.1 | 1.9 | REACTOME AMYLOIDS | Genes involved in Amyloids |
| 0.1 | 1.8 | REACTOME SYNTHESIS OF PIPS AT THE PLASMA MEMBRANE | Genes involved in Synthesis of PIPs at the plasma membrane |
| 0.1 | 0.8 | REACTOME REGULATION OF IFNG SIGNALING | Genes involved in Regulation of IFNG signaling |
| 0.1 | 1.1 | REACTOME FORMATION OF FIBRIN CLOT CLOTTING CASCADE | Genes involved in Formation of Fibrin Clot (Clotting Cascade) |
| 0.1 | 0.3 | REACTOME NEUROTRANSMITTER RELEASE CYCLE | Genes involved in Neurotransmitter Release Cycle |
| 0.1 | 1.5 | REACTOME SIGNALING BY HIPPO | Genes involved in Signaling by Hippo |
| 0.1 | 5.4 | REACTOME CLASS B 2 SECRETIN FAMILY RECEPTORS | Genes involved in Class B/2 (Secretin family receptors) |
| 0.0 | 0.5 | REACTOME SYNTHESIS SECRETION AND DEACYLATION OF GHRELIN | Genes involved in Synthesis, Secretion, and Deacylation of Ghrelin |
| 0.0 | 0.5 | REACTOME IL RECEPTOR SHC SIGNALING | Genes involved in Interleukin receptor SHC signaling |
| 0.0 | 1.0 | REACTOME EXTRINSIC PATHWAY FOR APOPTOSIS | Genes involved in Extrinsic Pathway for Apoptosis |
| 0.0 | 0.7 | REACTOME REGULATION OF INSULIN LIKE GROWTH FACTOR IGF ACTIVITY BY INSULIN LIKE GROWTH FACTOR BINDING PROTEINS IGFBPS | Genes involved in Regulation of Insulin-like Growth Factor (IGF) Activity by Insulin-like Growth Factor Binding Proteins (IGFBPs) |
| 0.0 | 0.4 | REACTOME GENERATION OF SECOND MESSENGER MOLECULES | Genes involved in Generation of second messenger molecules |
| 0.0 | 0.3 | REACTOME GPVI MEDIATED ACTIVATION CASCADE | Genes involved in GPVI-mediated activation cascade |
| 0.0 | 0.3 | REACTOME IONOTROPIC ACTIVITY OF KAINATE RECEPTORS | Genes involved in Ionotropic activity of Kainate Receptors |
| 0.0 | 0.4 | REACTOME SPHINGOLIPID METABOLISM | Genes involved in Sphingolipid metabolism |
| 0.0 | 0.3 | REACTOME GLUCURONIDATION | Genes involved in Glucuronidation |