Project
GNF SymAtlas + NCI-60 cancer cell lines, comparison of cancers vs non-cancers, human (Su, 2004; Ross, 2000)
Navigation
Downloads
Results for TFAP4_MSC
Z-value: 0.12
Motif logo
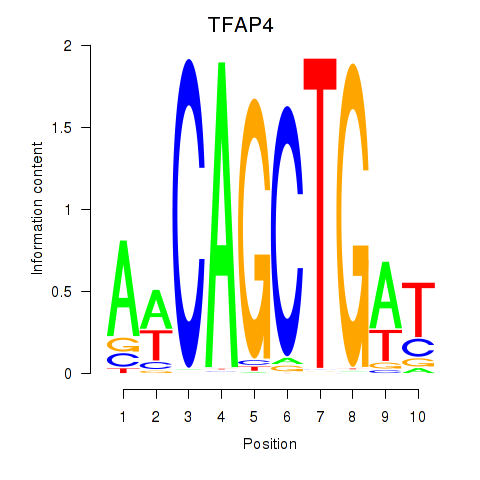
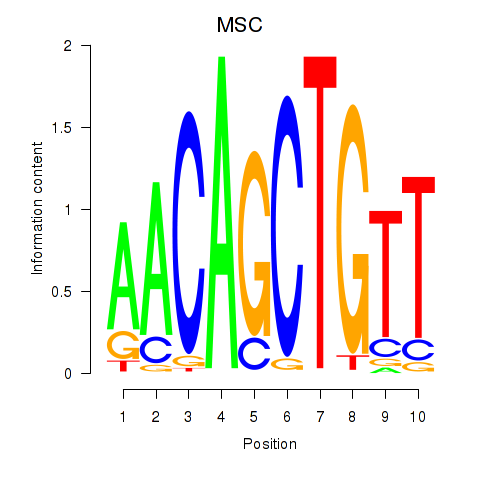
Transcription factors associated with TFAP4_MSC
| Gene Symbol | Gene ID | Gene Info |
|---|---|---|
|
TFAP4
|
ENSG00000090447.7 | transcription factor AP-4 |
|
MSC
|
ENSG00000178860.8 | musculin |
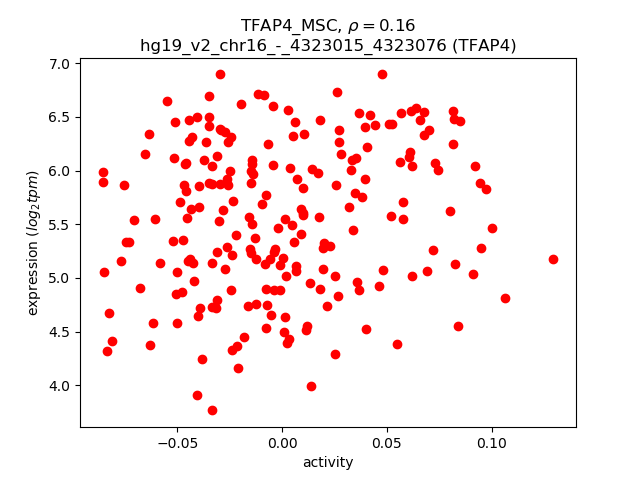
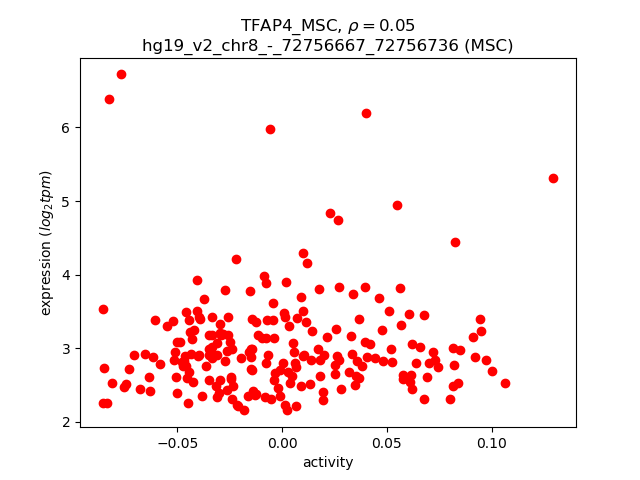
Activity-expression correlation:
| Gene | Promoter | Pearson corr. coef. | P-value | Plot |
|---|---|---|---|---|
| TFAP4 | hg19_v2_chr16_-_4323015_4323076 | 0.16 | 1.5e-02 | Click! |
| MSC | hg19_v2_chr8_-_72756667_72756736 | 0.05 | 4.7e-01 | Click! |
Activity profile of TFAP4_MSC motif
Sorted Z-values of TFAP4_MSC motif
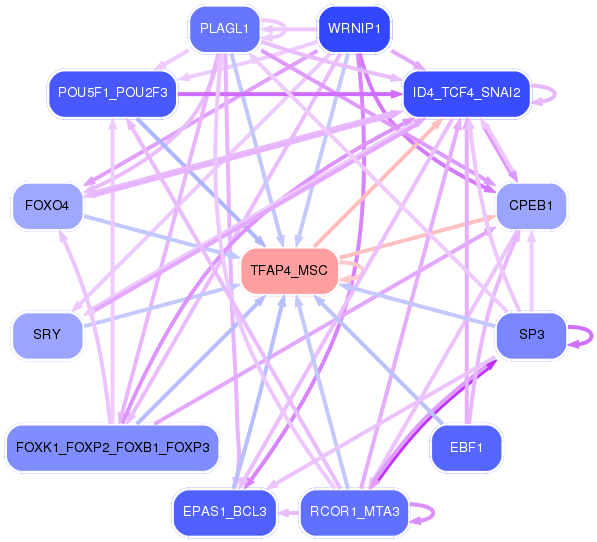
Network of associatons between targets according to the STRING database.

First level regulatory network of TFAP4_MSC
Gene Ontology Analysis
Gene overrepresentation in biological_process category:
| Log-likelihood per target | Total log-likelihood | Term | Description |
|---|---|---|---|
| 14.9 | 59.7 | GO:0018032 | peptide amidation(GO:0001519) protein amidation(GO:0018032) peptide modification(GO:0031179) |
| 7.0 | 20.9 | GO:1904647 | response to rotenone(GO:1904647) |
| 4.8 | 28.8 | GO:0070315 | G1 to G0 transition involved in cell differentiation(GO:0070315) |
| 3.7 | 14.8 | GO:0006218 | uridine catabolic process(GO:0006218) uridine metabolic process(GO:0046108) |
| 3.3 | 10.0 | GO:0070563 | negative regulation of vitamin D receptor signaling pathway(GO:0070563) |
| 3.1 | 15.7 | GO:0071874 | cellular response to norepinephrine stimulus(GO:0071874) |
| 3.0 | 9.0 | GO:0021966 | corticospinal neuron axon guidance(GO:0021966) |
| 2.8 | 14.1 | GO:1904209 | regulation of chemokine (C-C motif) ligand 2 secretion(GO:1904207) positive regulation of chemokine (C-C motif) ligand 2 secretion(GO:1904209) |
| 2.7 | 8.1 | GO:0019074 | viral genome packaging(GO:0019072) viral RNA genome packaging(GO:0019074) |
| 2.4 | 19.3 | GO:1903690 | negative regulation of wound healing, spreading of epidermal cells(GO:1903690) |
| 2.2 | 20.2 | GO:0061302 | smooth muscle cell-matrix adhesion(GO:0061302) |
| 2.1 | 6.4 | GO:0070213 | protein auto-ADP-ribosylation(GO:0070213) |
| 1.6 | 17.7 | GO:0006554 | lysine catabolic process(GO:0006554) |
| 1.5 | 1.5 | GO:0048203 | vesicle targeting, trans-Golgi to endosome(GO:0048203) |
| 1.4 | 6.8 | GO:0051620 | negative regulation of dopamine uptake involved in synaptic transmission(GO:0051585) norepinephrine uptake(GO:0051620) regulation of norepinephrine uptake(GO:0051621) negative regulation of norepinephrine uptake(GO:0051622) negative regulation of catecholamine uptake involved in synaptic transmission(GO:0051945) regulation of glutathione peroxidase activity(GO:1903282) positive regulation of glutathione peroxidase activity(GO:1903284) positive regulation of hydrogen peroxide catabolic process(GO:1903285) regulation of peroxidase activity(GO:2000468) positive regulation of peroxidase activity(GO:2000470) |
| 1.4 | 5.4 | GO:0002317 | plasma cell differentiation(GO:0002317) |
| 1.3 | 24.2 | GO:0007021 | tubulin complex assembly(GO:0007021) |
| 1.3 | 10.6 | GO:0002036 | regulation of L-glutamate transport(GO:0002036) |
| 1.3 | 4.0 | GO:0036371 | protein localization to M-band(GO:0036309) protein localization to T-tubule(GO:0036371) |
| 1.3 | 10.5 | GO:0001920 | negative regulation of receptor recycling(GO:0001920) |
| 1.3 | 6.5 | GO:2000639 | regulation of SREBP signaling pathway(GO:2000638) negative regulation of SREBP signaling pathway(GO:2000639) |
| 1.3 | 5.2 | GO:0072658 | positive regulation of cell communication by electrical coupling(GO:0010650) maintenance of protein location in membrane(GO:0072658) maintenance of protein location in plasma membrane(GO:0072660) positive regulation of membrane depolarization during cardiac muscle cell action potential(GO:1900827) |
| 1.2 | 4.9 | GO:0042441 | eye pigment biosynthetic process(GO:0006726) eye pigment metabolic process(GO:0042441) pigment metabolic process involved in developmental pigmentation(GO:0043324) pigment metabolic process involved in pigmentation(GO:0043474) |
| 1.2 | 4.9 | GO:0006072 | glycerol-3-phosphate metabolic process(GO:0006072) |
| 1.2 | 3.7 | GO:0043314 | negative regulation of neutrophil degranulation(GO:0043314) |
| 1.1 | 3.2 | GO:0006533 | aspartate catabolic process(GO:0006533) |
| 1.0 | 14.4 | GO:0021702 | cerebellar Purkinje cell layer formation(GO:0021694) cerebellar Purkinje cell differentiation(GO:0021702) |
| 1.0 | 11.4 | GO:1901387 | positive regulation of voltage-gated calcium channel activity(GO:1901387) |
| 0.9 | 8.7 | GO:0042373 | vitamin K metabolic process(GO:0042373) |
| 0.8 | 4.0 | GO:1990834 | response to odorant(GO:1990834) |
| 0.8 | 0.8 | GO:0014901 | regulation of satellite cell activation involved in skeletal muscle regeneration(GO:0014717) positive regulation of satellite cell activation involved in skeletal muscle regeneration(GO:0014718) satellite cell activation involved in skeletal muscle regeneration(GO:0014901) |
| 0.8 | 6.9 | GO:0030091 | protein repair(GO:0030091) |
| 0.8 | 9.9 | GO:1900038 | negative regulation of cellular response to hypoxia(GO:1900038) |
| 0.7 | 2.2 | GO:1904404 | cellular response to vitamin B1(GO:0071301) response to formaldehyde(GO:1904404) |
| 0.7 | 4.9 | GO:0071442 | positive regulation of histone H3-K14 acetylation(GO:0071442) |
| 0.6 | 2.6 | GO:0006542 | glutamine biosynthetic process(GO:0006542) |
| 0.6 | 4.9 | GO:0090063 | positive regulation of microtubule nucleation(GO:0090063) |
| 0.6 | 3.1 | GO:0048690 | regulation of sprouting of injured axon(GO:0048686) regulation of axon extension involved in regeneration(GO:0048690) |
| 0.6 | 5.3 | GO:0072513 | positive regulation of secondary heart field cardioblast proliferation(GO:0072513) |
| 0.6 | 4.0 | GO:0002175 | protein localization to paranode region of axon(GO:0002175) |
| 0.6 | 2.3 | GO:0051866 | general adaptation syndrome(GO:0051866) |
| 0.6 | 5.7 | GO:2000601 | positive regulation of Arp2/3 complex-mediated actin nucleation(GO:2000601) |
| 0.6 | 4.5 | GO:2000766 | negative regulation of cytoplasmic translation(GO:2000766) |
| 0.6 | 1.7 | GO:0021778 | spinal cord oligodendrocyte cell differentiation(GO:0021529) spinal cord oligodendrocyte cell fate specification(GO:0021530) oligodendrocyte cell fate specification(GO:0021778) oligodendrocyte cell fate commitment(GO:0021779) glial cell fate specification(GO:0021780) |
| 0.6 | 2.2 | GO:0019087 | transformation of host cell by virus(GO:0019087) |
| 0.6 | 11.7 | GO:0070886 | positive regulation of calcineurin-NFAT signaling cascade(GO:0070886) |
| 0.5 | 1.6 | GO:1903401 | L-lysine transmembrane transport(GO:1903401) |
| 0.5 | 3.6 | GO:0010454 | negative regulation of cell fate commitment(GO:0010454) lung goblet cell differentiation(GO:0060480) |
| 0.5 | 2.0 | GO:1904715 | negative regulation of chaperone-mediated autophagy(GO:1904715) |
| 0.5 | 3.1 | GO:0042866 | pyruvate biosynthetic process(GO:0042866) |
| 0.5 | 2.4 | GO:0010637 | negative regulation of mitochondrial fusion(GO:0010637) |
| 0.5 | 3.8 | GO:0003065 | positive regulation of heart rate by epinephrine(GO:0003065) |
| 0.5 | 12.7 | GO:0045725 | positive regulation of glycogen biosynthetic process(GO:0045725) |
| 0.5 | 15.8 | GO:0090383 | phagosome acidification(GO:0090383) |
| 0.5 | 2.8 | GO:0010807 | regulation of synaptic vesicle priming(GO:0010807) |
| 0.5 | 1.4 | GO:0097056 | seryl-tRNA aminoacylation(GO:0006434) selenocysteinyl-tRNA(Sec) biosynthetic process(GO:0097056) |
| 0.4 | 2.2 | GO:2001288 | positive regulation of caveolin-mediated endocytosis(GO:2001288) |
| 0.4 | 1.3 | GO:1903336 | negative regulation of vacuolar transport(GO:1903336) |
| 0.4 | 26.7 | GO:2000649 | regulation of sodium ion transmembrane transporter activity(GO:2000649) |
| 0.4 | 2.1 | GO:0036115 | fatty-acyl-CoA catabolic process(GO:0036115) malonyl-CoA metabolic process(GO:2001293) |
| 0.4 | 5.0 | GO:0042118 | endothelial cell activation(GO:0042118) |
| 0.4 | 3.2 | GO:0007258 | JUN phosphorylation(GO:0007258) |
| 0.4 | 1.6 | GO:1902954 | regulation of early endosome to recycling endosome transport(GO:1902954) |
| 0.4 | 2.7 | GO:0016080 | synaptic vesicle targeting(GO:0016080) |
| 0.4 | 1.9 | GO:0048478 | replication fork protection(GO:0048478) |
| 0.4 | 1.2 | GO:0030575 | nuclear body organization(GO:0030575) |
| 0.4 | 3.4 | GO:1902474 | positive regulation of protein localization to synapse(GO:1902474) |
| 0.4 | 4.7 | GO:0010839 | negative regulation of keratinocyte proliferation(GO:0010839) |
| 0.3 | 1.7 | GO:0035063 | nuclear speck organization(GO:0035063) |
| 0.3 | 5.1 | GO:1900119 | positive regulation of execution phase of apoptosis(GO:1900119) |
| 0.3 | 3.7 | GO:0055072 | iron ion homeostasis(GO:0055072) |
| 0.3 | 2.3 | GO:0031642 | negative regulation of myelination(GO:0031642) |
| 0.3 | 1.0 | GO:0072709 | cellular response to sorbitol(GO:0072709) |
| 0.3 | 3.7 | GO:0097084 | vascular smooth muscle cell development(GO:0097084) |
| 0.3 | 6.1 | GO:0060742 | epithelial cell differentiation involved in prostate gland development(GO:0060742) |
| 0.3 | 1.2 | GO:0007525 | somatic muscle development(GO:0007525) |
| 0.3 | 3.6 | GO:0002315 | marginal zone B cell differentiation(GO:0002315) |
| 0.3 | 2.4 | GO:0030578 | PML body organization(GO:0030578) |
| 0.3 | 6.2 | GO:0019800 | peptide cross-linking via chondroitin 4-sulfate glycosaminoglycan(GO:0019800) |
| 0.3 | 3.5 | GO:0036500 | ATF6-mediated unfolded protein response(GO:0036500) |
| 0.3 | 1.2 | GO:0006050 | mannosamine metabolic process(GO:0006050) N-acetylmannosamine metabolic process(GO:0006051) |
| 0.3 | 1.1 | GO:2001197 | regulation of basement membrane assembly involved in embryonic body morphogenesis(GO:1904259) positive regulation of basement membrane assembly involved in embryonic body morphogenesis(GO:1904261) basement membrane assembly involved in embryonic body morphogenesis(GO:2001197) |
| 0.3 | 0.6 | GO:0038163 | thrombopoietin-mediated signaling pathway(GO:0038163) |
| 0.3 | 3.2 | GO:0048194 | Golgi vesicle budding(GO:0048194) |
| 0.3 | 0.8 | GO:0060168 | positive regulation of adenosine receptor signaling pathway(GO:0060168) |
| 0.3 | 2.6 | GO:0033327 | Leydig cell differentiation(GO:0033327) |
| 0.2 | 1.5 | GO:0090050 | positive regulation of cell migration involved in sprouting angiogenesis(GO:0090050) |
| 0.2 | 5.1 | GO:0006895 | Golgi to endosome transport(GO:0006895) |
| 0.2 | 1.0 | GO:1902774 | late endosome to lysosome transport(GO:1902774) |
| 0.2 | 0.7 | GO:0006420 | arginyl-tRNA aminoacylation(GO:0006420) |
| 0.2 | 4.0 | GO:0036010 | protein localization to endosome(GO:0036010) |
| 0.2 | 1.4 | GO:0023021 | termination of signal transduction(GO:0023021) |
| 0.2 | 1.2 | GO:0097498 | endothelial tube lumen extension(GO:0097498) |
| 0.2 | 14.4 | GO:0051489 | regulation of filopodium assembly(GO:0051489) |
| 0.2 | 2.9 | GO:0035372 | protein localization to microtubule(GO:0035372) |
| 0.2 | 1.8 | GO:0048630 | skeletal muscle tissue growth(GO:0048630) |
| 0.2 | 2.2 | GO:0098914 | membrane repolarization during atrial cardiac muscle cell action potential(GO:0098914) |
| 0.2 | 5.2 | GO:0034389 | lipid particle organization(GO:0034389) |
| 0.2 | 2.8 | GO:0030321 | transepithelial chloride transport(GO:0030321) |
| 0.2 | 2.4 | GO:2000680 | rubidium ion transport(GO:0035826) regulation of rubidium ion transport(GO:2000680) |
| 0.2 | 2.2 | GO:0016559 | peroxisome fission(GO:0016559) |
| 0.2 | 1.0 | GO:0006651 | diacylglycerol biosynthetic process(GO:0006651) |
| 0.2 | 2.1 | GO:1902959 | regulation of aspartic-type endopeptidase activity involved in amyloid precursor protein catabolic process(GO:1902959) positive regulation of aspartic-type endopeptidase activity involved in amyloid precursor protein catabolic process(GO:1902961) regulation of aspartic-type peptidase activity(GO:1905245) positive regulation of aspartic-type peptidase activity(GO:1905247) |
| 0.2 | 2.5 | GO:0051386 | regulation of neurotrophin TRK receptor signaling pathway(GO:0051386) |
| 0.2 | 1.1 | GO:0002495 | antigen processing and presentation of peptide antigen via MHC class II(GO:0002495) antigen processing and presentation of peptide or polysaccharide antigen via MHC class II(GO:0002504) |
| 0.2 | 1.8 | GO:1902083 | negative regulation of peptidyl-cysteine S-nitrosylation(GO:1902083) |
| 0.2 | 2.1 | GO:0048298 | positive regulation of isotype switching to IgA isotypes(GO:0048298) |
| 0.2 | 0.7 | GO:0019086 | late viral transcription(GO:0019086) |
| 0.2 | 2.2 | GO:0034638 | phosphatidylcholine catabolic process(GO:0034638) |
| 0.2 | 2.0 | GO:0010457 | centriole-centriole cohesion(GO:0010457) |
| 0.2 | 4.8 | GO:0000470 | maturation of LSU-rRNA(GO:0000470) |
| 0.2 | 0.3 | GO:0060574 | intestinal epithelial cell maturation(GO:0060574) |
| 0.2 | 1.3 | GO:0070236 | regulation of activation-induced cell death of T cells(GO:0070235) negative regulation of activation-induced cell death of T cells(GO:0070236) |
| 0.2 | 1.1 | GO:1905146 | lysosomal lumen acidification(GO:0007042) lysosomal protein catabolic process(GO:1905146) |
| 0.2 | 0.9 | GO:0015811 | L-cystine transport(GO:0015811) |
| 0.2 | 1.2 | GO:0035414 | negative regulation of catenin import into nucleus(GO:0035414) |
| 0.2 | 0.6 | GO:0010961 | cellular magnesium ion homeostasis(GO:0010961) |
| 0.1 | 0.4 | GO:0090675 | intermicrovillar adhesion(GO:0090675) |
| 0.1 | 1.0 | GO:0061577 | calcium ion transmembrane transport via high voltage-gated calcium channel(GO:0061577) |
| 0.1 | 1.8 | GO:0042354 | fucose catabolic process(GO:0019317) L-fucose metabolic process(GO:0042354) L-fucose catabolic process(GO:0042355) |
| 0.1 | 3.1 | GO:0035066 | positive regulation of histone acetylation(GO:0035066) |
| 0.1 | 6.1 | GO:0007214 | gamma-aminobutyric acid signaling pathway(GO:0007214) |
| 0.1 | 2.3 | GO:0002467 | germinal center formation(GO:0002467) |
| 0.1 | 2.4 | GO:0006995 | cellular response to nitrogen starvation(GO:0006995) cellular response to nitrogen levels(GO:0043562) |
| 0.1 | 0.6 | GO:0090080 | positive regulation of MAPKKK cascade by fibroblast growth factor receptor signaling pathway(GO:0090080) |
| 0.1 | 8.3 | GO:0060997 | dendritic spine morphogenesis(GO:0060997) |
| 0.1 | 0.7 | GO:0010966 | regulation of phosphate transport(GO:0010966) |
| 0.1 | 2.7 | GO:0089711 | L-glutamate transmembrane transport(GO:0089711) |
| 0.1 | 0.4 | GO:0006788 | heme oxidation(GO:0006788) smooth muscle hyperplasia(GO:0014806) |
| 0.1 | 1.6 | GO:0034605 | cellular response to heat(GO:0034605) |
| 0.1 | 1.3 | GO:0006730 | one-carbon metabolic process(GO:0006730) |
| 0.1 | 0.7 | GO:1901029 | negative regulation of mitochondrial outer membrane permeabilization involved in apoptotic signaling pathway(GO:1901029) |
| 0.1 | 2.2 | GO:0010510 | regulation of acetyl-CoA biosynthetic process from pyruvate(GO:0010510) regulation of acyl-CoA biosynthetic process(GO:0050812) |
| 0.1 | 0.5 | GO:0070253 | somatostatin secretion(GO:0070253) oligodendrocyte progenitor proliferation(GO:0070444) regulation of oligodendrocyte progenitor proliferation(GO:0070445) |
| 0.1 | 3.0 | GO:2000369 | regulation of clathrin-mediated endocytosis(GO:2000369) |
| 0.1 | 3.2 | GO:0010107 | potassium ion import(GO:0010107) |
| 0.1 | 4.4 | GO:0043268 | positive regulation of potassium ion transport(GO:0043268) |
| 0.1 | 0.6 | GO:0070980 | biphenyl catabolic process(GO:0070980) |
| 0.1 | 1.4 | GO:0097062 | dendritic spine maintenance(GO:0097062) |
| 0.1 | 1.8 | GO:0090162 | establishment of epithelial cell polarity(GO:0090162) |
| 0.1 | 1.6 | GO:1902237 | positive regulation of endoplasmic reticulum stress-induced intrinsic apoptotic signaling pathway(GO:1902237) |
| 0.1 | 1.7 | GO:0045116 | protein neddylation(GO:0045116) |
| 0.1 | 6.0 | GO:0046677 | response to antibiotic(GO:0046677) |
| 0.1 | 1.6 | GO:2000480 | negative regulation of cAMP-dependent protein kinase activity(GO:2000480) |
| 0.1 | 1.5 | GO:0033572 | transferrin transport(GO:0033572) |
| 0.1 | 1.3 | GO:0043922 | negative regulation by host of viral transcription(GO:0043922) |
| 0.1 | 10.0 | GO:0072332 | intrinsic apoptotic signaling pathway by p53 class mediator(GO:0072332) |
| 0.1 | 7.8 | GO:0061178 | regulation of insulin secretion involved in cellular response to glucose stimulus(GO:0061178) |
| 0.1 | 0.8 | GO:0035457 | cellular response to interferon-alpha(GO:0035457) |
| 0.1 | 10.7 | GO:0008286 | insulin receptor signaling pathway(GO:0008286) |
| 0.1 | 0.7 | GO:0034356 | NAD biosynthesis via nicotinamide riboside salvage pathway(GO:0034356) |
| 0.1 | 0.4 | GO:0090131 | mesenchyme migration(GO:0090131) |
| 0.1 | 0.3 | GO:0060283 | negative regulation of oocyte development(GO:0060283) negative regulation of oocyte maturation(GO:1900194) |
| 0.1 | 2.1 | GO:1901522 | positive regulation of transcription from RNA polymerase II promoter involved in cellular response to chemical stimulus(GO:1901522) |
| 0.1 | 3.4 | GO:0071377 | cellular response to glucagon stimulus(GO:0071377) |
| 0.1 | 0.8 | GO:0086024 | adrenergic receptor signaling pathway involved in positive regulation of heart rate(GO:0086024) |
| 0.1 | 3.7 | GO:0045214 | sarcomere organization(GO:0045214) |
| 0.1 | 3.6 | GO:0060976 | coronary vasculature development(GO:0060976) |
| 0.1 | 12.9 | GO:0006261 | DNA-dependent DNA replication(GO:0006261) |
| 0.1 | 1.5 | GO:0016540 | protein autoprocessing(GO:0016540) |
| 0.1 | 5.1 | GO:0051865 | protein autoubiquitination(GO:0051865) |
| 0.1 | 2.1 | GO:0043949 | regulation of cAMP-mediated signaling(GO:0043949) |
| 0.1 | 1.3 | GO:0071625 | vocalization behavior(GO:0071625) |
| 0.1 | 3.3 | GO:0035418 | protein localization to synapse(GO:0035418) |
| 0.1 | 0.8 | GO:0034312 | diol biosynthetic process(GO:0034312) sphingosine biosynthetic process(GO:0046512) sphingoid biosynthetic process(GO:0046520) |
| 0.1 | 0.2 | GO:1902723 | negative regulation of skeletal muscle cell proliferation(GO:0014859) negative regulation of skeletal muscle satellite cell proliferation(GO:1902723) |
| 0.1 | 3.5 | GO:0032784 | regulation of DNA-templated transcription, elongation(GO:0032784) |
| 0.1 | 5.4 | GO:0030574 | collagen catabolic process(GO:0030574) |
| 0.1 | 0.7 | GO:0010815 | bradykinin catabolic process(GO:0010815) |
| 0.1 | 0.4 | GO:0061299 | retina vasculature morphogenesis in camera-type eye(GO:0061299) |
| 0.1 | 0.4 | GO:1903232 | melanosome assembly(GO:1903232) |
| 0.1 | 0.4 | GO:0014722 | regulation of skeletal muscle contraction by calcium ion signaling(GO:0014722) |
| 0.1 | 0.5 | GO:0043353 | enucleate erythrocyte differentiation(GO:0043353) |
| 0.1 | 0.2 | GO:0061743 | motor learning(GO:0061743) |
| 0.1 | 0.8 | GO:0051775 | response to redox state(GO:0051775) |
| 0.1 | 1.2 | GO:0033141 | positive regulation of peptidyl-serine phosphorylation of STAT protein(GO:0033141) |
| 0.1 | 1.5 | GO:0007216 | G-protein coupled glutamate receptor signaling pathway(GO:0007216) |
| 0.1 | 0.5 | GO:0051895 | negative regulation of focal adhesion assembly(GO:0051895) negative regulation of adherens junction organization(GO:1903392) |
| 0.1 | 1.8 | GO:0007050 | cell cycle arrest(GO:0007050) |
| 0.1 | 1.0 | GO:0006986 | response to unfolded protein(GO:0006986) |
| 0.1 | 0.4 | GO:0090161 | Golgi ribbon formation(GO:0090161) |
| 0.0 | 4.6 | GO:0007422 | peripheral nervous system development(GO:0007422) |
| 0.0 | 5.4 | GO:0070268 | cornification(GO:0070268) |
| 0.0 | 1.7 | GO:0080171 | lysosome organization(GO:0007040) lytic vacuole organization(GO:0080171) |
| 0.0 | 0.5 | GO:0033234 | negative regulation of protein sumoylation(GO:0033234) |
| 0.0 | 2.1 | GO:0030835 | negative regulation of actin filament depolymerization(GO:0030835) |
| 0.0 | 0.7 | GO:0060177 | regulation of angiotensin levels in blood(GO:0002002) angiotensin maturation(GO:0002003) regulation of angiotensin metabolic process(GO:0060177) |
| 0.0 | 0.9 | GO:0010719 | negative regulation of epithelial to mesenchymal transition(GO:0010719) |
| 0.0 | 1.8 | GO:0000188 | inactivation of MAPK activity(GO:0000188) |
| 0.0 | 4.4 | GO:0007030 | Golgi organization(GO:0007030) |
| 0.0 | 1.2 | GO:0071353 | cellular response to interleukin-4(GO:0071353) |
| 0.0 | 6.3 | GO:0030518 | intracellular steroid hormone receptor signaling pathway(GO:0030518) |
| 0.0 | 0.7 | GO:0051457 | maintenance of protein location in nucleus(GO:0051457) |
| 0.0 | 1.0 | GO:0032481 | positive regulation of type I interferon production(GO:0032481) |
| 0.0 | 0.1 | GO:0060484 | lung-associated mesenchyme development(GO:0060484) |
| 0.0 | 0.4 | GO:0001953 | negative regulation of cell-matrix adhesion(GO:0001953) |
| 0.0 | 1.3 | GO:0006904 | vesicle docking involved in exocytosis(GO:0006904) |
| 0.0 | 0.9 | GO:0032411 | positive regulation of transporter activity(GO:0032411) |
| 0.0 | 0.2 | GO:1904706 | negative regulation of vascular smooth muscle cell proliferation(GO:1904706) |
| 0.0 | 2.1 | GO:0070125 | mitochondrial translational elongation(GO:0070125) |
| 0.0 | 1.0 | GO:0019433 | triglyceride catabolic process(GO:0019433) |
| 0.0 | 0.5 | GO:0007342 | fusion of sperm to egg plasma membrane(GO:0007342) |
| 0.0 | 0.2 | GO:2000507 | positive regulation of energy homeostasis(GO:2000507) |
| 0.0 | 0.2 | GO:0090140 | regulation of mitochondrial fission(GO:0090140) |
| 0.0 | 0.3 | GO:0018345 | protein palmitoylation(GO:0018345) |
| 0.0 | 0.2 | GO:0007172 | signal complex assembly(GO:0007172) |
| 0.0 | 3.0 | GO:0043523 | regulation of neuron apoptotic process(GO:0043523) |
| 0.0 | 1.2 | GO:0071260 | cellular response to mechanical stimulus(GO:0071260) |
| 0.0 | 0.0 | GO:0045332 | lipid translocation(GO:0034204) phospholipid translocation(GO:0045332) |
| 0.0 | 0.9 | GO:0042147 | retrograde transport, endosome to Golgi(GO:0042147) |
| 0.0 | 1.5 | GO:0017156 | calcium ion regulated exocytosis(GO:0017156) |
| 0.0 | 0.5 | GO:0015721 | bile acid and bile salt transport(GO:0015721) |
| 0.0 | 0.7 | GO:0046785 | microtubule polymerization(GO:0046785) |
| 0.0 | 0.5 | GO:0007223 | Wnt signaling pathway, calcium modulating pathway(GO:0007223) |
| 0.0 | 0.3 | GO:0090023 | positive regulation of neutrophil chemotaxis(GO:0090023) |
| 0.0 | 0.8 | GO:0036498 | IRE1-mediated unfolded protein response(GO:0036498) |
| 0.0 | 0.3 | GO:0033006 | regulation of mast cell activation involved in immune response(GO:0033006) regulation of mast cell degranulation(GO:0043304) |
Gene overrepresentation in cellular_component category:
| Log-likelihood per target | Total log-likelihood | Term | Description |
|---|---|---|---|
| 2.8 | 13.8 | GO:0005899 | insulin receptor complex(GO:0005899) |
| 2.0 | 14.1 | GO:0033269 | internode region of axon(GO:0033269) |
| 1.9 | 19.3 | GO:0045180 | basal cortex(GO:0045180) |
| 1.7 | 15.7 | GO:1990812 | growth cone lamellipodium(GO:1990761) growth cone filopodium(GO:1990812) |
| 1.5 | 24.2 | GO:0097512 | cardiac myofibril(GO:0097512) |
| 1.0 | 3.1 | GO:0072534 | perineuronal net(GO:0072534) |
| 0.9 | 6.5 | GO:1990452 | Parkin-FBXW7-Cul1 ubiquitin ligase complex(GO:1990452) |
| 0.9 | 4.6 | GO:0000221 | vacuolar proton-transporting V-type ATPase, V1 domain(GO:0000221) |
| 0.9 | 5.1 | GO:0000138 | Golgi trans cisterna(GO:0000138) |
| 0.8 | 4.9 | GO:0009331 | glycerol-3-phosphate dehydrogenase complex(GO:0009331) |
| 0.8 | 4.0 | GO:0045323 | interleukin-1 receptor complex(GO:0045323) |
| 0.8 | 4.8 | GO:0070545 | PeBoW complex(GO:0070545) |
| 0.8 | 13.6 | GO:0032433 | filopodium tip(GO:0032433) |
| 0.7 | 9.2 | GO:0097433 | dense body(GO:0097433) |
| 0.7 | 2.8 | GO:0070044 | synaptobrevin 2-SNAP-25-syntaxin-1a complex(GO:0070044) |
| 0.6 | 3.1 | GO:0033162 | melanosome membrane(GO:0033162) chitosome(GO:0045009) |
| 0.6 | 47.5 | GO:0030315 | T-tubule(GO:0030315) |
| 0.5 | 8.3 | GO:0098563 | integral component of synaptic vesicle membrane(GO:0030285) intrinsic component of synaptic vesicle membrane(GO:0098563) |
| 0.5 | 4.8 | GO:0016011 | dystroglycan complex(GO:0016011) |
| 0.5 | 3.2 | GO:0044294 | dendritic growth cone(GO:0044294) |
| 0.5 | 1.4 | GO:0034667 | integrin alpha3-beta1 complex(GO:0034667) |
| 0.5 | 12.3 | GO:0033176 | proton-transporting V-type ATPase complex(GO:0033176) |
| 0.4 | 5.7 | GO:0031209 | SCAR complex(GO:0031209) |
| 0.4 | 64.4 | GO:0043204 | perikaryon(GO:0043204) |
| 0.4 | 2.4 | GO:0042406 | extrinsic component of endoplasmic reticulum membrane(GO:0042406) |
| 0.4 | 22.0 | GO:0031907 | peroxisomal matrix(GO:0005782) microbody lumen(GO:0031907) |
| 0.4 | 18.1 | GO:1904115 | axon cytoplasm(GO:1904115) |
| 0.4 | 4.0 | GO:0033270 | paranode region of axon(GO:0033270) |
| 0.4 | 5.6 | GO:0097431 | mitotic spindle pole(GO:0097431) |
| 0.3 | 4.9 | GO:0005869 | dynactin complex(GO:0005869) |
| 0.3 | 2.0 | GO:0098575 | lumenal side of lysosomal membrane(GO:0098575) |
| 0.3 | 6.9 | GO:0031143 | pseudopodium(GO:0031143) |
| 0.3 | 4.5 | GO:1990124 | messenger ribonucleoprotein complex(GO:1990124) |
| 0.2 | 1.9 | GO:0043596 | nuclear replication fork(GO:0043596) |
| 0.2 | 0.7 | GO:0097427 | microtubule bundle(GO:0097427) |
| 0.2 | 1.6 | GO:0071203 | WASH complex(GO:0071203) |
| 0.2 | 7.7 | GO:0000159 | protein phosphatase type 2A complex(GO:0000159) |
| 0.2 | 3.8 | GO:0032059 | bleb(GO:0032059) |
| 0.2 | 7.9 | GO:0031430 | M band(GO:0031430) |
| 0.2 | 1.1 | GO:0042272 | nuclear RNA export factor complex(GO:0042272) |
| 0.2 | 7.2 | GO:0005640 | nuclear outer membrane(GO:0005640) |
| 0.2 | 4.9 | GO:0030057 | desmosome(GO:0030057) |
| 0.2 | 1.8 | GO:0042788 | polysomal ribosome(GO:0042788) |
| 0.2 | 1.0 | GO:0030123 | AP-3 adaptor complex(GO:0030123) |
| 0.2 | 3.1 | GO:0030914 | STAGA complex(GO:0030914) |
| 0.2 | 13.6 | GO:0016328 | lateral plasma membrane(GO:0016328) |
| 0.2 | 1.7 | GO:1990752 | microtubule end(GO:1990752) |
| 0.1 | 1.3 | GO:0032009 | early phagosome(GO:0032009) |
| 0.1 | 2.4 | GO:0031088 | platelet dense granule membrane(GO:0031088) |
| 0.1 | 2.2 | GO:0031362 | anchored component of external side of plasma membrane(GO:0031362) |
| 0.1 | 14.5 | GO:0005776 | autophagosome(GO:0005776) |
| 0.1 | 7.6 | GO:0005881 | cytoplasmic microtubule(GO:0005881) |
| 0.1 | 0.6 | GO:0098554 | cytoplasmic side of endoplasmic reticulum membrane(GO:0098554) |
| 0.1 | 5.2 | GO:0035577 | azurophil granule membrane(GO:0035577) |
| 0.1 | 1.4 | GO:0043220 | Schmidt-Lanterman incisure(GO:0043220) |
| 0.1 | 1.3 | GO:0032045 | guanyl-nucleotide exchange factor complex(GO:0032045) |
| 0.1 | 0.4 | GO:0031085 | BLOC-3 complex(GO:0031085) |
| 0.1 | 3.4 | GO:0031201 | SNARE complex(GO:0031201) |
| 0.1 | 2.4 | GO:0099738 | cell cortex region(GO:0099738) |
| 0.1 | 11.2 | GO:0031985 | Golgi cisterna(GO:0031985) |
| 0.1 | 0.4 | GO:0089717 | spanning component of plasma membrane(GO:0044214) spanning component of membrane(GO:0089717) |
| 0.1 | 0.9 | GO:0005883 | neurofilament(GO:0005883) |
| 0.1 | 6.3 | GO:0043195 | terminal bouton(GO:0043195) |
| 0.1 | 1.4 | GO:0042599 | lamellar body(GO:0042599) |
| 0.1 | 28.0 | GO:0031965 | nuclear membrane(GO:0031965) |
| 0.1 | 2.1 | GO:0071011 | U5 snRNP(GO:0005682) precatalytic spliceosome(GO:0071011) |
| 0.1 | 11.7 | GO:0043197 | dendritic spine(GO:0043197) |
| 0.1 | 3.5 | GO:0005834 | heterotrimeric G-protein complex(GO:0005834) |
| 0.1 | 0.9 | GO:0044224 | juxtaparanode region of axon(GO:0044224) |
| 0.1 | 5.5 | GO:0005901 | caveola(GO:0005901) |
| 0.1 | 4.4 | GO:0005811 | lipid particle(GO:0005811) |
| 0.1 | 4.9 | GO:0032588 | trans-Golgi network membrane(GO:0032588) |
| 0.1 | 2.1 | GO:0097610 | cleavage furrow(GO:0032154) cell surface furrow(GO:0097610) |
| 0.0 | 3.1 | GO:0031463 | Cul3-RING ubiquitin ligase complex(GO:0031463) |
| 0.0 | 1.5 | GO:0031594 | neuromuscular junction(GO:0031594) |
| 0.0 | 4.1 | GO:0008021 | synaptic vesicle(GO:0008021) |
| 0.0 | 27.6 | GO:0048471 | perinuclear region of cytoplasm(GO:0048471) |
| 0.0 | 4.8 | GO:0055037 | recycling endosome(GO:0055037) |
| 0.0 | 1.1 | GO:0045178 | basal part of cell(GO:0045178) |
| 0.0 | 5.2 | GO:0030176 | integral component of endoplasmic reticulum membrane(GO:0030176) |
| 0.0 | 9.6 | GO:0045121 | membrane raft(GO:0045121) membrane microdomain(GO:0098857) |
| 0.0 | 2.4 | GO:0008023 | transcription elongation factor complex(GO:0008023) |
| 0.0 | 0.5 | GO:0005689 | U12-type spliceosomal complex(GO:0005689) |
| 0.0 | 14.6 | GO:0000790 | nuclear chromatin(GO:0000790) |
| 0.0 | 2.3 | GO:0016363 | nuclear matrix(GO:0016363) |
| 0.0 | 0.5 | GO:0032420 | stereocilium(GO:0032420) |
| 0.0 | 0.4 | GO:0032982 | myosin filament(GO:0032982) |
| 0.0 | 2.5 | GO:0005814 | centriole(GO:0005814) |
| 0.0 | 0.5 | GO:0097381 | photoreceptor disc membrane(GO:0097381) |
| 0.0 | 0.4 | GO:0016010 | dystrophin-associated glycoprotein complex(GO:0016010) glycoprotein complex(GO:0090665) |
| 0.0 | 3.1 | GO:0043209 | myelin sheath(GO:0043209) |
| 0.0 | 2.2 | GO:0030666 | endocytic vesicle membrane(GO:0030666) |
| 0.0 | 3.4 | GO:0030424 | axon(GO:0030424) |
| 0.0 | 0.6 | GO:0070069 | cytochrome complex(GO:0070069) |
| 0.0 | 0.9 | GO:0030133 | transport vesicle(GO:0030133) |
| 0.0 | 0.5 | GO:0001533 | cornified envelope(GO:0001533) |
| 0.0 | 0.3 | GO:0008074 | guanylate cyclase complex, soluble(GO:0008074) |
| 0.0 | 0.9 | GO:0034705 | voltage-gated potassium channel complex(GO:0008076) potassium channel complex(GO:0034705) |
| 0.0 | 1.9 | GO:0031968 | organelle outer membrane(GO:0031968) |
| 0.0 | 5.9 | GO:0031966 | mitochondrial membrane(GO:0031966) |
| 0.0 | 1.4 | GO:0043202 | lysosomal lumen(GO:0043202) |
| 0.0 | 0.2 | GO:0016281 | eukaryotic translation initiation factor 4F complex(GO:0016281) |
| 0.0 | 0.7 | GO:0034707 | chloride channel complex(GO:0034707) |
| 0.0 | 1.5 | GO:0032993 | protein-DNA complex(GO:0032993) |
Gene overrepresentation in molecular_function category:
| Log-likelihood per target | Total log-likelihood | Term | Description |
|---|---|---|---|
| 14.9 | 59.7 | GO:0004598 | peptidylglycine monooxygenase activity(GO:0004504) peptidylamidoglycolate lyase activity(GO:0004598) |
| 4.4 | 17.7 | GO:0016639 | oxidoreductase activity, acting on the CH-NH2 group of donors, NAD or NADP as acceptor(GO:0016639) |
| 4.0 | 20.2 | GO:0038062 | protein tyrosine kinase collagen receptor activity(GO:0038062) |
| 3.7 | 14.8 | GO:0004850 | uridine phosphorylase activity(GO:0004850) |
| 3.0 | 9.0 | GO:0086062 | voltage-gated sodium channel activity involved in Purkinje myocyte action potential(GO:0086062) |
| 2.2 | 8.7 | GO:0047057 | oxidoreductase activity, acting on the CH-OH group of donors, disulfide as acceptor(GO:0016900) vitamin-K-epoxide reductase (warfarin-sensitive) activity(GO:0047057) |
| 2.1 | 12.9 | GO:0003998 | acylphosphatase activity(GO:0003998) |
| 2.0 | 28.2 | GO:0031432 | titin binding(GO:0031432) |
| 2.0 | 6.0 | GO:0004719 | protein-L-isoaspartate (D-aspartate) O-methyltransferase activity(GO:0004719) |
| 1.8 | 5.4 | GO:0048030 | disaccharide binding(GO:0048030) |
| 1.7 | 43.9 | GO:0016805 | dipeptidase activity(GO:0016805) |
| 1.5 | 13.6 | GO:0060002 | plus-end directed microfilament motor activity(GO:0060002) |
| 1.4 | 6.8 | GO:0060961 | phospholipase D inhibitor activity(GO:0060961) |
| 1.3 | 4.0 | GO:0005150 | interleukin-1, Type I receptor binding(GO:0005150) |
| 1.3 | 7.8 | GO:0008553 | hydrogen-exporting ATPase activity, phosphorylative mechanism(GO:0008553) |
| 1.2 | 12.5 | GO:0051425 | PTB domain binding(GO:0051425) |
| 1.2 | 14.1 | GO:0019911 | structural constituent of myelin sheath(GO:0019911) |
| 0.9 | 20.5 | GO:0002162 | dystroglycan binding(GO:0002162) |
| 0.8 | 11.0 | GO:0038132 | neuregulin binding(GO:0038132) |
| 0.8 | 6.5 | GO:0050816 | phosphothreonine binding(GO:0050816) |
| 0.8 | 41.6 | GO:0017080 | sodium channel regulator activity(GO:0017080) |
| 0.8 | 8.1 | GO:0009374 | biotin carboxylase activity(GO:0004075) biotin binding(GO:0009374) |
| 0.8 | 23.8 | GO:0005212 | structural constituent of eye lens(GO:0005212) |
| 0.8 | 3.1 | GO:0004743 | pyruvate kinase activity(GO:0004743) |
| 0.8 | 6.1 | GO:0004565 | beta-galactosidase activity(GO:0004565) |
| 0.7 | 2.2 | GO:0061663 | NEDD8 ligase activity(GO:0061663) |
| 0.7 | 25.0 | GO:0070182 | DNA polymerase binding(GO:0070182) |
| 0.7 | 33.4 | GO:0019894 | kinesin binding(GO:0019894) |
| 0.6 | 2.6 | GO:0016211 | glutamate-ammonia ligase activity(GO:0004356) ammonia ligase activity(GO:0016211) acid-ammonia (or amide) ligase activity(GO:0016880) |
| 0.6 | 8.3 | GO:0022851 | GABA-gated chloride ion channel activity(GO:0022851) |
| 0.6 | 12.5 | GO:0070530 | K63-linked polyubiquitin binding(GO:0070530) |
| 0.6 | 1.2 | GO:0070097 | delta-catenin binding(GO:0070097) |
| 0.6 | 2.3 | GO:0043812 | phosphatidylinositol-4-phosphate phosphatase activity(GO:0043812) |
| 0.6 | 2.2 | GO:0033906 | protein tyrosine kinase inhibitor activity(GO:0030292) hyaluronoglucuronidase activity(GO:0033906) |
| 0.5 | 1.6 | GO:0015189 | L-lysine transmembrane transporter activity(GO:0015189) |
| 0.5 | 2.1 | GO:0004886 | 9-cis retinoic acid receptor activity(GO:0004886) |
| 0.5 | 3.2 | GO:0004046 | aminoacylase activity(GO:0004046) |
| 0.5 | 1.4 | GO:0004828 | serine-tRNA ligase activity(GO:0004828) |
| 0.5 | 9.5 | GO:0044548 | S100 protein binding(GO:0044548) |
| 0.4 | 1.2 | GO:0010698 | acetyltransferase activator activity(GO:0010698) |
| 0.4 | 4.4 | GO:0045295 | gamma-catenin binding(GO:0045295) |
| 0.4 | 2.2 | GO:0004741 | [pyruvate dehydrogenase (lipoamide)] phosphatase activity(GO:0004741) |
| 0.4 | 1.1 | GO:0034046 | poly(G) binding(GO:0034046) |
| 0.3 | 1.7 | GO:0019788 | NEDD8 transferase activity(GO:0019788) |
| 0.3 | 2.0 | GO:0016997 | exo-alpha-sialidase activity(GO:0004308) alpha-sialidase activity(GO:0016997) |
| 0.3 | 2.3 | GO:0001515 | opioid peptide activity(GO:0001515) |
| 0.3 | 6.3 | GO:0070016 | armadillo repeat domain binding(GO:0070016) |
| 0.3 | 3.4 | GO:0019869 | chloride channel inhibitor activity(GO:0019869) |
| 0.3 | 5.4 | GO:0031702 | type 1 angiotensin receptor binding(GO:0031702) |
| 0.3 | 5.9 | GO:0070273 | phosphatidylinositol-4-phosphate binding(GO:0070273) |
| 0.3 | 4.5 | GO:0035925 | mRNA 3'-UTR AU-rich region binding(GO:0035925) |
| 0.3 | 14.6 | GO:0005158 | insulin receptor binding(GO:0005158) |
| 0.2 | 2.7 | GO:0005314 | high-affinity glutamate transmembrane transporter activity(GO:0005314) |
| 0.2 | 6.2 | GO:0008191 | metalloendopeptidase inhibitor activity(GO:0008191) |
| 0.2 | 2.2 | GO:0047499 | calcium-independent phospholipase A2 activity(GO:0047499) |
| 0.2 | 3.1 | GO:0051011 | microtubule minus-end binding(GO:0051011) |
| 0.2 | 0.7 | GO:0004814 | arginine-tRNA ligase activity(GO:0004814) |
| 0.2 | 1.0 | GO:0003726 | double-stranded RNA adenosine deaminase activity(GO:0003726) |
| 0.2 | 4.9 | GO:0070840 | dynein complex binding(GO:0070840) |
| 0.2 | 1.8 | GO:0046920 | alpha-(1->3)-fucosyltransferase activity(GO:0046920) |
| 0.2 | 2.1 | GO:0005005 | transmembrane-ephrin receptor activity(GO:0005005) |
| 0.2 | 1.5 | GO:0035256 | G-protein coupled glutamate receptor binding(GO:0035256) |
| 0.2 | 2.2 | GO:0016290 | palmitoyl-CoA hydrolase activity(GO:0016290) |
| 0.2 | 0.8 | GO:0017040 | ceramidase activity(GO:0017040) |
| 0.2 | 1.3 | GO:0030160 | GKAP/Homer scaffold activity(GO:0030160) |
| 0.2 | 0.7 | GO:0008449 | N-acetylglucosamine-6-sulfatase activity(GO:0008449) |
| 0.2 | 3.2 | GO:0015467 | G-protein activated inward rectifier potassium channel activity(GO:0015467) |
| 0.2 | 2.5 | GO:0003993 | acid phosphatase activity(GO:0003993) |
| 0.2 | 1.6 | GO:0004862 | cAMP-dependent protein kinase inhibitor activity(GO:0004862) |
| 0.2 | 0.8 | GO:0050508 | glucuronosyl-N-acetylglucosaminyl-proteoglycan 4-alpha-N-acetylglucosaminyltransferase activity(GO:0050508) |
| 0.2 | 26.3 | GO:0044325 | ion channel binding(GO:0044325) |
| 0.2 | 1.9 | GO:0035612 | AP-2 adaptor complex binding(GO:0035612) |
| 0.2 | 2.4 | GO:0017017 | MAP kinase tyrosine/serine/threonine phosphatase activity(GO:0017017) |
| 0.2 | 0.6 | GO:0042500 | aspartic endopeptidase activity, intramembrane cleaving(GO:0042500) |
| 0.2 | 0.9 | GO:0015184 | L-cystine transmembrane transporter activity(GO:0015184) |
| 0.1 | 0.4 | GO:0008502 | melatonin receptor activity(GO:0008502) |
| 0.1 | 1.2 | GO:0097322 | 7SK snRNA binding(GO:0097322) |
| 0.1 | 2.2 | GO:0005229 | intracellular calcium activated chloride channel activity(GO:0005229) |
| 0.1 | 1.4 | GO:0004767 | sphingomyelin phosphodiesterase activity(GO:0004767) |
| 0.1 | 0.6 | GO:0008422 | beta-glucosidase activity(GO:0008422) |
| 0.1 | 2.4 | GO:0005522 | profilin binding(GO:0005522) |
| 0.1 | 10.8 | GO:0002039 | p53 binding(GO:0002039) |
| 0.1 | 0.4 | GO:0004392 | heme oxygenase (decyclizing) activity(GO:0004392) |
| 0.1 | 2.4 | GO:0050811 | GABA receptor binding(GO:0050811) |
| 0.1 | 6.2 | GO:0005080 | protein kinase C binding(GO:0005080) |
| 0.1 | 2.9 | GO:0071889 | 14-3-3 protein binding(GO:0071889) |
| 0.1 | 2.9 | GO:0070006 | metalloaminopeptidase activity(GO:0070006) |
| 0.1 | 0.4 | GO:0070984 | SET domain binding(GO:0070984) |
| 0.1 | 0.6 | GO:0031708 | endothelin B receptor binding(GO:0031708) |
| 0.1 | 0.9 | GO:0086056 | voltage-gated calcium channel activity involved in AV node cell action potential(GO:0086056) |
| 0.1 | 11.3 | GO:0017048 | Rho GTPase binding(GO:0017048) |
| 0.1 | 3.6 | GO:0030552 | cAMP binding(GO:0030552) |
| 0.1 | 1.2 | GO:0035240 | dopamine binding(GO:0035240) |
| 0.1 | 1.2 | GO:0016857 | racemase and epimerase activity, acting on carbohydrates and derivatives(GO:0016857) |
| 0.1 | 7.3 | GO:0008013 | beta-catenin binding(GO:0008013) |
| 0.1 | 1.5 | GO:0005381 | iron ion transmembrane transporter activity(GO:0005381) |
| 0.1 | 1.2 | GO:0005132 | type I interferon receptor binding(GO:0005132) |
| 0.1 | 1.5 | GO:0070001 | aspartic-type endopeptidase activity(GO:0004190) aspartic-type peptidase activity(GO:0070001) |
| 0.1 | 1.5 | GO:0032266 | phosphatidylinositol-3-phosphate binding(GO:0032266) |
| 0.1 | 1.3 | GO:0019992 | diacylglycerol binding(GO:0019992) |
| 0.1 | 1.8 | GO:0000217 | DNA secondary structure binding(GO:0000217) |
| 0.1 | 2.0 | GO:0005547 | phosphatidylinositol-3,4,5-trisphosphate binding(GO:0005547) |
| 0.1 | 1.0 | GO:0032183 | SUMO binding(GO:0032183) |
| 0.1 | 1.9 | GO:0004602 | glutathione peroxidase activity(GO:0004602) |
| 0.1 | 8.8 | GO:0005200 | structural constituent of cytoskeleton(GO:0005200) |
| 0.1 | 1.9 | GO:0003950 | NAD+ ADP-ribosyltransferase activity(GO:0003950) |
| 0.1 | 7.8 | GO:0017124 | SH3 domain binding(GO:0017124) |
| 0.1 | 0.3 | GO:0016941 | natriuretic peptide receptor activity(GO:0016941) |
| 0.1 | 0.3 | GO:0036042 | long-chain fatty acyl-CoA binding(GO:0036042) |
| 0.1 | 0.7 | GO:0008331 | high voltage-gated calcium channel activity(GO:0008331) |
| 0.1 | 0.2 | GO:0008431 | vitamin E binding(GO:0008431) |
| 0.1 | 1.6 | GO:0008307 | structural constituent of muscle(GO:0008307) |
| 0.1 | 1.3 | GO:0005272 | sodium channel activity(GO:0005272) |
| 0.1 | 2.1 | GO:0042169 | SH2 domain binding(GO:0042169) |
| 0.1 | 1.5 | GO:0004198 | calcium-dependent cysteine-type endopeptidase activity(GO:0004198) |
| 0.0 | 0.1 | GO:0015361 | low-affinity sodium:dicarboxylate symporter activity(GO:0015361) |
| 0.0 | 2.1 | GO:0004842 | ubiquitin-protein transferase activity(GO:0004842) ubiquitin-like protein transferase activity(GO:0019787) |
| 0.0 | 4.9 | GO:0031490 | chromatin DNA binding(GO:0031490) |
| 0.0 | 1.1 | GO:0071837 | HMG box domain binding(GO:0071837) |
| 0.0 | 2.1 | GO:0005164 | tumor necrosis factor receptor binding(GO:0005164) |
| 0.0 | 0.3 | GO:1901612 | cardiolipin binding(GO:1901612) |
| 0.0 | 1.0 | GO:0004806 | triglyceride lipase activity(GO:0004806) |
| 0.0 | 0.7 | GO:0015101 | organic cation transmembrane transporter activity(GO:0015101) |
| 0.0 | 2.1 | GO:0016831 | carboxy-lyase activity(GO:0016831) |
| 0.0 | 0.3 | GO:0004321 | fatty-acyl-CoA synthase activity(GO:0004321) |
| 0.0 | 0.5 | GO:0005344 | oxygen transporter activity(GO:0005344) |
| 0.0 | 1.0 | GO:0004435 | phosphatidylinositol phospholipase C activity(GO:0004435) |
| 0.0 | 2.2 | GO:0051219 | phosphoprotein binding(GO:0051219) |
| 0.0 | 1.0 | GO:0004708 | MAP kinase kinase activity(GO:0004708) |
| 0.0 | 3.6 | GO:0004867 | serine-type endopeptidase inhibitor activity(GO:0004867) |
| 0.0 | 0.9 | GO:0004181 | metallocarboxypeptidase activity(GO:0004181) |
| 0.0 | 0.3 | GO:0090599 | alpha-glucosidase activity(GO:0090599) |
| 0.0 | 2.0 | GO:0004402 | histone acetyltransferase activity(GO:0004402) |
| 0.0 | 2.6 | GO:0003730 | mRNA 3'-UTR binding(GO:0003730) |
| 0.0 | 0.4 | GO:0030215 | semaphorin receptor binding(GO:0030215) |
| 0.0 | 0.2 | GO:0003945 | N-acetyllactosamine synthase activity(GO:0003945) |
| 0.0 | 0.9 | GO:0004385 | guanylate kinase activity(GO:0004385) |
| 0.0 | 0.2 | GO:0003774 | motor activity(GO:0003774) |
| 0.0 | 1.1 | GO:0042287 | MHC protein binding(GO:0042287) |
| 0.0 | 2.1 | GO:0004722 | protein serine/threonine phosphatase activity(GO:0004722) |
| 0.0 | 0.5 | GO:0047555 | 3',5'-cyclic-GMP phosphodiesterase activity(GO:0047555) |
| 0.0 | 0.8 | GO:0051879 | Hsp90 protein binding(GO:0051879) |
| 0.0 | 0.5 | GO:0051428 | peptide hormone receptor binding(GO:0051428) |
| 0.0 | 0.5 | GO:0015125 | bile acid transmembrane transporter activity(GO:0015125) |
| 0.0 | 2.6 | GO:0003705 | transcription factor activity, RNA polymerase II distal enhancer sequence-specific binding(GO:0003705) |
| 0.0 | 2.1 | GO:0042626 | ATPase activity, coupled to transmembrane movement of substances(GO:0042626) |
| 0.0 | 0.3 | GO:0045236 | CXCR chemokine receptor binding(GO:0045236) |
| 0.0 | 0.5 | GO:0001972 | retinoic acid binding(GO:0001972) |
| 0.0 | 1.3 | GO:0002020 | protease binding(GO:0002020) |
| 0.0 | 0.2 | GO:0008190 | eukaryotic initiation factor 4E binding(GO:0008190) |
| 0.0 | 0.1 | GO:0000990 | transcription factor activity, core RNA polymerase binding(GO:0000990) |
| 0.0 | 0.4 | GO:0004364 | glutathione transferase activity(GO:0004364) |
| 0.0 | 0.9 | GO:0019905 | syntaxin binding(GO:0019905) |
Gene overrepresentation in C2:CP category:
| Log-likelihood per target | Total log-likelihood | Term | Description |
|---|---|---|---|
| 0.4 | 38.9 | ST FAS SIGNALING PATHWAY | Fas Signaling Pathway |
| 0.4 | 11.0 | PID ERBB NETWORK PATHWAY | ErbB receptor signaling network |
| 0.3 | 15.7 | PID GLYPICAN 1PATHWAY | Glypican 1 network |
| 0.3 | 13.6 | PID NETRIN PATHWAY | Netrin-mediated signaling events |
| 0.2 | 13.8 | PID INSULIN PATHWAY | Insulin Pathway |
| 0.2 | 7.0 | PID RAS PATHWAY | Regulation of Ras family activation |
| 0.2 | 8.7 | PID KIT PATHWAY | Signaling events mediated by Stem cell factor receptor (c-Kit) |
| 0.2 | 7.7 | ST T CELL SIGNAL TRANSDUCTION | T Cell Signal Transduction |
| 0.2 | 3.5 | PID ERB GENOMIC PATHWAY | Validated nuclear estrogen receptor beta network |
| 0.2 | 6.6 | PID AURORA A PATHWAY | Aurora A signaling |
| 0.2 | 6.8 | PID ALPHA SYNUCLEIN PATHWAY | Alpha-synuclein signaling |
| 0.1 | 7.8 | PID CDC42 REG PATHWAY | Regulation of CDC42 activity |
| 0.1 | 9.3 | PID RHOA REG PATHWAY | Regulation of RhoA activity |
| 0.1 | 5.2 | PID ECADHERIN NASCENT AJ PATHWAY | E-cadherin signaling in the nascent adherens junction |
| 0.1 | 4.9 | PID NCADHERIN PATHWAY | N-cadherin signaling events |
| 0.1 | 3.3 | PID P38 ALPHA BETA PATHWAY | Regulation of p38-alpha and p38-beta |
| 0.1 | 2.1 | PID EPHA FWDPATHWAY | EPHA forward signaling |
| 0.1 | 6.2 | PID TGFBR PATHWAY | TGF-beta receptor signaling |
| 0.1 | 2.4 | PID PRL SIGNALING EVENTS PATHWAY | Signaling events mediated by PRL |
| 0.1 | 4.8 | PID RHOA PATHWAY | RhoA signaling pathway |
| 0.1 | 5.3 | NABA PROTEOGLYCANS | Genes encoding proteoglycans |
| 0.1 | 2.1 | PID RETINOIC ACID PATHWAY | Retinoic acid receptors-mediated signaling |
| 0.1 | 6.5 | PID ERA GENOMIC PATHWAY | Validated nuclear estrogen receptor alpha network |
| 0.1 | 1.5 | PID ERBB2 ERBB3 PATHWAY | ErbB2/ErbB3 signaling events |
| 0.1 | 2.1 | PID RET PATHWAY | Signaling events regulated by Ret tyrosine kinase |
| 0.1 | 0.5 | PID PDGFRA PATHWAY | PDGFR-alpha signaling pathway |
| 0.1 | 1.5 | PID FAK PATHWAY | Signaling events mediated by focal adhesion kinase |
| 0.0 | 1.6 | PID IL1 PATHWAY | IL1-mediated signaling events |
| 0.0 | 1.4 | PID INTEGRIN CS PATHWAY | Integrin family cell surface interactions |
| 0.0 | 2.9 | PID NFAT TFPATHWAY | Calcineurin-regulated NFAT-dependent transcription in lymphocytes |
| 0.0 | 0.8 | PID CIRCADIAN PATHWAY | Circadian rhythm pathway |
| 0.0 | 1.6 | PID HEDGEHOG GLI PATHWAY | Hedgehog signaling events mediated by Gli proteins |
| 0.0 | 2.9 | PID TELOMERASE PATHWAY | Regulation of Telomerase |
| 0.0 | 0.5 | ST WNT CA2 CYCLIC GMP PATHWAY | Wnt/Ca2+/cyclic GMP signaling. |
| 0.0 | 0.2 | ST TYPE I INTERFERON PATHWAY | Type I Interferon (alpha/beta IFN) Pathway |
| 0.0 | 2.4 | PID MYC REPRESS PATHWAY | Validated targets of C-MYC transcriptional repression |
| 0.0 | 0.3 | PID VEGFR1 PATHWAY | VEGFR1 specific signals |
| 0.0 | 0.8 | PID CD8 TCR DOWNSTREAM PATHWAY | Downstream signaling in naïve CD8+ T cells |
| 0.0 | 0.5 | PID INTEGRIN A9B1 PATHWAY | Alpha9 beta1 integrin signaling events |
| 0.0 | 0.7 | PID FGF PATHWAY | FGF signaling pathway |
| 0.0 | 0.6 | PID ENDOTHELIN PATHWAY | Endothelins |
| 0.0 | 0.4 | PID AP1 PATHWAY | AP-1 transcription factor network |
| 0.0 | 2.6 | NABA ECM AFFILIATED | Genes encoding proteins affiliated structurally or functionally to extracellular matrix proteins |
| 0.0 | 0.4 | PID FRA PATHWAY | Validated transcriptional targets of AP1 family members Fra1 and Fra2 |
| 0.0 | 0.7 | PID AR TF PATHWAY | Regulation of Androgen receptor activity |
| 0.0 | 0.5 | PID HDAC CLASSII PATHWAY | Signaling events mediated by HDAC Class II |
| 0.0 | 3.5 | NABA SECRETED FACTORS | Genes encoding secreted soluble factors |
Gene overrepresentation in C2:CP:REACTOME category:
| Log-likelihood per target | Total log-likelihood | Term | Description |
|---|---|---|---|
| 1.1 | 14.8 | REACTOME PYRIMIDINE CATABOLISM | Genes involved in Pyrimidine catabolism |
| 0.8 | 15.7 | REACTOME THE NLRP3 INFLAMMASOME | Genes involved in The NLRP3 inflammasome |
| 0.6 | 8.7 | REACTOME GAMMA CARBOXYLATION TRANSPORT AND AMINO TERMINAL CLEAVAGE OF PROTEINS | Genes involved in Gamma-carboxylation, transport, and amino-terminal cleavage of proteins |
| 0.5 | 15.8 | REACTOME INSULIN RECEPTOR RECYCLING | Genes involved in Insulin receptor recycling |
| 0.5 | 12.5 | REACTOME TETRAHYDROBIOPTERIN BH4 SYNTHESIS RECYCLING SALVAGE AND REGULATION | Genes involved in Tetrahydrobiopterin (BH4) synthesis, recycling, salvage and regulation |
| 0.5 | 7.7 | REACTOME ERKS ARE INACTIVATED | Genes involved in ERKs are inactivated |
| 0.4 | 11.0 | REACTOME DOWNREGULATION OF ERBB2 ERBB3 SIGNALING | Genes involved in Downregulation of ERBB2:ERBB3 signaling |
| 0.4 | 12.8 | REACTOME INTERACTION BETWEEN L1 AND ANKYRINS | Genes involved in Interaction between L1 and Ankyrins |
| 0.3 | 16.7 | REACTOME SMOOTH MUSCLE CONTRACTION | Genes involved in Smooth Muscle Contraction |
| 0.3 | 1.5 | REACTOME TRANSFERRIN ENDOCYTOSIS AND RECYCLING | Genes involved in Transferrin endocytosis and recycling |
| 0.2 | 2.3 | REACTOME SYNTHESIS OF PIPS AT THE LATE ENDOSOME MEMBRANE | Genes involved in Synthesis of PIPs at the late endosome membrane |
| 0.2 | 13.6 | REACTOME NETRIN1 SIGNALING | Genes involved in Netrin-1 signaling |
| 0.2 | 3.5 | REACTOME ACTIVATION OF CHAPERONES BY ATF6 ALPHA | Genes involved in Activation of Chaperones by ATF6-alpha |
| 0.2 | 9.5 | REACTOME GLYCOSPHINGOLIPID METABOLISM | Genes involved in Glycosphingolipid metabolism |
| 0.2 | 6.5 | REACTOME ASSOCIATION OF TRIC CCT WITH TARGET PROTEINS DURING BIOSYNTHESIS | Genes involved in Association of TriC/CCT with target proteins during biosynthesis |
| 0.2 | 6.1 | REACTOME GABA A RECEPTOR ACTIVATION | Genes involved in GABA A receptor activation |
| 0.2 | 2.2 | REACTOME ACYL CHAIN REMODELLING OF PE | Genes involved in Acyl chain remodelling of PE |
| 0.2 | 2.2 | REACTOME AKT PHOSPHORYLATES TARGETS IN THE CYTOSOL | Genes involved in AKT phosphorylates targets in the cytosol |
| 0.2 | 4.9 | REACTOME SYNTHESIS OF PA | Genes involved in Synthesis of PA |
| 0.1 | 5.2 | REACTOME INHIBITION OF VOLTAGE GATED CA2 CHANNELS VIA GBETA GAMMA SUBUNITS | Genes involved in Inhibition of voltage gated Ca2+ channels via Gbeta/gamma subunits |
| 0.1 | 2.2 | REACTOME HYALURONAN UPTAKE AND DEGRADATION | Genes involved in Hyaluronan uptake and degradation |
| 0.1 | 3.8 | REACTOME PROTEOLYTIC CLEAVAGE OF SNARE COMPLEX PROTEINS | Genes involved in Proteolytic cleavage of SNARE complex proteins |
| 0.1 | 2.4 | REACTOME FORMATION OF TUBULIN FOLDING INTERMEDIATES BY CCT TRIC | Genes involved in Formation of tubulin folding intermediates by CCT/TriC |
| 0.1 | 2.2 | REACTOME REGULATION OF PYRUVATE DEHYDROGENASE PDH COMPLEX | Genes involved in Regulation of pyruvate dehydrogenase (PDH) complex |
| 0.1 | 8.1 | REACTOME GLUCONEOGENESIS | Genes involved in Gluconeogenesis |
| 0.1 | 2.2 | REACTOME ALPHA LINOLENIC ACID ALA METABOLISM | Genes involved in alpha-linolenic acid (ALA) metabolism |
| 0.1 | 2.0 | REACTOME INHIBITION OF INSULIN SECRETION BY ADRENALINE NORADRENALINE | Genes involved in Inhibition of Insulin Secretion by Adrenaline/Noradrenaline |
| 0.1 | 6.4 | REACTOME ACTIVATION OF CHAPERONE GENES BY XBP1S | Genes involved in Activation of Chaperone Genes by XBP1(S) |
| 0.1 | 1.2 | REACTOME G PROTEIN ACTIVATION | Genes involved in G-protein activation |
| 0.1 | 4.9 | REACTOME IL1 SIGNALING | Genes involved in Interleukin-1 signaling |
| 0.1 | 1.5 | REACTOME HIGHLY CALCIUM PERMEABLE POSTSYNAPTIC NICOTINIC ACETYLCHOLINE RECEPTORS | Genes involved in Highly calcium permeable postsynaptic nicotinic acetylcholine receptors |
| 0.1 | 9.0 | REACTOME SIGNALING BY RHO GTPASES | Genes involved in Signaling by Rho GTPases |
| 0.1 | 5.2 | REACTOME MHC CLASS II ANTIGEN PRESENTATION | Genes involved in MHC class II antigen presentation |
| 0.1 | 4.4 | REACTOME AMYLOIDS | Genes involved in Amyloids |
| 0.0 | 1.0 | REACTOME RIP MEDIATED NFKB ACTIVATION VIA DAI | Genes involved in RIP-mediated NFkB activation via DAI |
| 0.0 | 1.4 | REACTOME REGULATION OF IFNA SIGNALING | Genes involved in Regulation of IFNA signaling |
| 0.0 | 1.5 | REACTOME REGULATION OF INSULIN SECRETION BY GLUCAGON LIKE PEPTIDE1 | Genes involved in Regulation of Insulin Secretion by Glucagon-like Peptide-1 |
| 0.0 | 1.0 | REACTOME METABOLISM OF PORPHYRINS | Genes involved in Metabolism of porphyrins |
| 0.0 | 1.2 | REACTOME CYTOSOLIC TRNA AMINOACYLATION | Genes involved in Cytosolic tRNA aminoacylation |
| 0.0 | 4.0 | REACTOME FACTORS INVOLVED IN MEGAKARYOCYTE DEVELOPMENT AND PLATELET PRODUCTION | Genes involved in Factors involved in megakaryocyte development and platelet production |
| 0.0 | 0.7 | REACTOME LYSOSOME VESICLE BIOGENESIS | Genes involved in Lysosome Vesicle Biogenesis |
| 0.0 | 0.8 | REACTOME CIRCADIAN REPRESSION OF EXPRESSION BY REV ERBA | Genes involved in Circadian Repression of Expression by REV-ERBA |
| 0.0 | 0.8 | REACTOME SPHINGOLIPID DE NOVO BIOSYNTHESIS | Genes involved in Sphingolipid de novo biosynthesis |
| 0.0 | 0.5 | REACTOME TRANSPORT OF ORGANIC ANIONS | Genes involved in Transport of organic anions |
| 0.0 | 0.4 | REACTOME OTHER SEMAPHORIN INTERACTIONS | Genes involved in Other semaphorin interactions |
| 0.0 | 0.5 | REACTOME SIGNALING BY NOTCH1 | Genes involved in Signaling by NOTCH1 |
| 0.0 | 1.4 | REACTOME NUCLEAR RECEPTOR TRANSCRIPTION PATHWAY | Genes involved in Nuclear Receptor transcription pathway |
| 0.0 | 0.8 | REACTOME INTERFERON ALPHA BETA SIGNALING | Genes involved in Interferon alpha/beta signaling |
| 0.0 | 0.5 | REACTOME GLUCOSE METABOLISM | Genes involved in Glucose metabolism |
| 0.0 | 0.5 | REACTOME CGMP EFFECTS | Genes involved in cGMP effects |
| 0.0 | 1.4 | REACTOME INTEGRIN CELL SURFACE INTERACTIONS | Genes involved in Integrin cell surface interactions |