Project
GNF SymAtlas + NCI-60 cancer cell lines, comparison of cancers vs non-cancers, human (Su, 2004; Ross, 2000)
Navigation
Downloads
Results for TGIF1
Z-value: 1.03
Motif logo

Transcription factors associated with TGIF1
| Gene Symbol | Gene ID | Gene Info |
|---|---|---|
|
TGIF1
|
ENSG00000177426.16 | TGFB induced factor homeobox 1 |
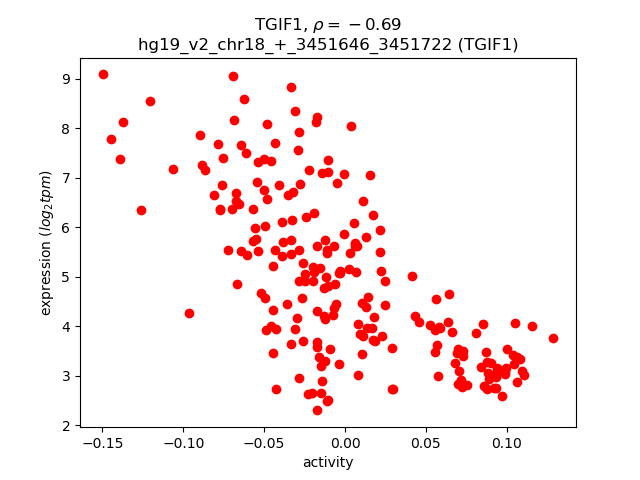
Activity-expression correlation:
| Gene | Promoter | Pearson corr. coef. | P-value | Plot |
|---|---|---|---|---|
| TGIF1 | hg19_v2_chr18_+_3451646_3451722 | -0.69 | 8.8e-32 | Click! |
Activity profile of TGIF1 motif
Sorted Z-values of TGIF1 motif
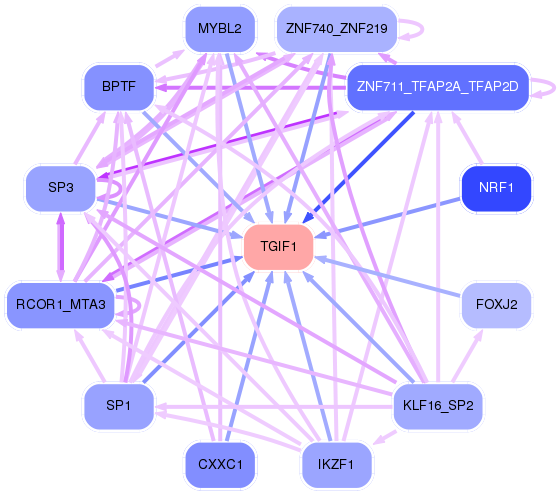
Network of associatons between targets according to the STRING database.

First level regulatory network of TGIF1
Gene Ontology Analysis
Gene overrepresentation in biological_process category:
| Log-likelihood per target | Total log-likelihood | Term | Description |
|---|---|---|---|
| 8.3 | 25.0 | GO:2000854 | positive regulation of corticosterone secretion(GO:2000854) |
| 8.2 | 24.5 | GO:1904395 | retinal rod cell differentiation(GO:0060221) positive regulation of skeletal muscle acetylcholine-gated channel clustering(GO:1904395) negative regulation of neuromuscular junction development(GO:1904397) |
| 7.7 | 15.5 | GO:1901628 | positive regulation of postsynaptic membrane organization(GO:1901628) |
| 6.7 | 120.0 | GO:0007021 | tubulin complex assembly(GO:0007021) |
| 6.2 | 43.2 | GO:2000124 | regulation of endocannabinoid signaling pathway(GO:2000124) |
| 6.1 | 18.3 | GO:1990108 | protein linear deubiquitination(GO:1990108) |
| 5.6 | 16.8 | GO:2000864 | estrogen secretion(GO:0035937) estradiol secretion(GO:0035938) regulation of estrogen secretion(GO:2000861) regulation of estradiol secretion(GO:2000864) |
| 5.0 | 14.9 | GO:1902938 | regulation of intracellular calcium activated chloride channel activity(GO:1902938) |
| 4.7 | 23.6 | GO:0030070 | insulin processing(GO:0030070) |
| 4.2 | 20.8 | GO:0035582 | sequestering of BMP in extracellular matrix(GO:0035582) |
| 4.1 | 12.4 | GO:0045229 | cell envelope organization(GO:0043163) external encapsulating structure organization(GO:0045229) |
| 4.1 | 16.3 | GO:0050758 | thymidylate synthase biosynthetic process(GO:0050757) regulation of thymidylate synthase biosynthetic process(GO:0050758) |
| 3.9 | 61.9 | GO:0090360 | platelet-derived growth factor production(GO:0090360) regulation of platelet-derived growth factor production(GO:0090361) |
| 3.7 | 14.6 | GO:1902261 | positive regulation of delayed rectifier potassium channel activity(GO:1902261) |
| 3.6 | 10.8 | GO:0019417 | sulfur oxidation(GO:0019417) |
| 3.6 | 14.2 | GO:0007525 | somatic muscle development(GO:0007525) |
| 3.5 | 35.1 | GO:0051612 | negative regulation of neurotransmitter uptake(GO:0051581) serotonin uptake(GO:0051610) regulation of serotonin uptake(GO:0051611) negative regulation of serotonin uptake(GO:0051612) |
| 3.4 | 13.6 | GO:0000350 | generation of catalytic spliceosome for second transesterification step(GO:0000350) |
| 3.2 | 35.6 | GO:2000580 | positive regulation of microtubule motor activity(GO:2000576) regulation of ATP-dependent microtubule motor activity, plus-end-directed(GO:2000580) positive regulation of ATP-dependent microtubule motor activity, plus-end-directed(GO:2000582) |
| 3.2 | 9.7 | GO:0072019 | carbon dioxide transmembrane transport(GO:0035378) proximal convoluted tubule development(GO:0072019) metanephric proximal convoluted tubule development(GO:0072229) |
| 3.0 | 15.1 | GO:0050882 | voluntary musculoskeletal movement(GO:0050882) |
| 3.0 | 11.9 | GO:0008627 | intrinsic apoptotic signaling pathway in response to osmotic stress(GO:0008627) |
| 2.5 | 22.7 | GO:0014052 | regulation of gamma-aminobutyric acid secretion(GO:0014052) |
| 2.5 | 22.6 | GO:0016127 | cholesterol catabolic process(GO:0006707) sterol catabolic process(GO:0016127) |
| 2.4 | 7.2 | GO:0045925 | positive regulation of female receptivity(GO:0045925) |
| 2.4 | 7.2 | GO:0071409 | cellular response to cycloheximide(GO:0071409) |
| 2.3 | 70.9 | GO:0048268 | clathrin coat assembly(GO:0048268) |
| 2.2 | 6.5 | GO:0010040 | response to iron(II) ion(GO:0010040) |
| 2.1 | 29.8 | GO:0047484 | regulation of response to osmotic stress(GO:0047484) |
| 2.0 | 10.1 | GO:0006398 | mRNA 3'-end processing by stem-loop binding and cleavage(GO:0006398) |
| 1.8 | 7.2 | GO:0051866 | general adaptation syndrome(GO:0051866) |
| 1.8 | 5.3 | GO:0003241 | growth involved in heart morphogenesis(GO:0003241) |
| 1.7 | 23.7 | GO:0071688 | striated muscle myosin thick filament assembly(GO:0071688) |
| 1.7 | 5.0 | GO:2000705 | histone H3-T6 phosphorylation(GO:0035408) dense core granule biogenesis(GO:0061110) regulation of dense core granule biogenesis(GO:2000705) |
| 1.6 | 8.1 | GO:0003322 | pancreatic A cell development(GO:0003322) |
| 1.6 | 6.2 | GO:0030644 | cellular chloride ion homeostasis(GO:0030644) |
| 1.5 | 10.8 | GO:0010756 | positive regulation of plasminogen activation(GO:0010756) |
| 1.5 | 6.1 | GO:1902748 | positive regulation of lens fiber cell differentiation(GO:1902748) |
| 1.5 | 6.1 | GO:0051835 | positive regulation of synapse structural plasticity(GO:0051835) |
| 1.5 | 14.6 | GO:0006600 | creatine metabolic process(GO:0006600) |
| 1.4 | 56.2 | GO:0048791 | calcium ion-regulated exocytosis of neurotransmitter(GO:0048791) |
| 1.4 | 4.3 | GO:0072092 | ureteric bud invasion(GO:0072092) |
| 1.4 | 12.8 | GO:0006729 | tetrahydrobiopterin biosynthetic process(GO:0006729) tetrahydrobiopterin metabolic process(GO:0046146) |
| 1.4 | 19.3 | GO:0016081 | synaptic vesicle docking(GO:0016081) |
| 1.3 | 8.1 | GO:0090131 | mesenchyme migration(GO:0090131) |
| 1.3 | 5.4 | GO:0090076 | relaxation of skeletal muscle(GO:0090076) |
| 1.3 | 12.9 | GO:1990416 | cellular response to brain-derived neurotrophic factor stimulus(GO:1990416) |
| 1.2 | 3.7 | GO:0021798 | forebrain dorsal/ventral pattern formation(GO:0021798) |
| 1.2 | 7.4 | GO:2001181 | positive regulation of interleukin-10 secretion(GO:2001181) |
| 1.2 | 3.5 | GO:0021571 | rhombomere 5 development(GO:0021571) |
| 1.1 | 5.7 | GO:0000189 | MAPK import into nucleus(GO:0000189) |
| 1.1 | 4.5 | GO:0002503 | peptide antigen assembly with MHC class II protein complex(GO:0002503) |
| 1.1 | 4.5 | GO:0035616 | histone H2B conserved C-terminal lysine deubiquitination(GO:0035616) |
| 1.1 | 10.9 | GO:0042908 | xenobiotic transport(GO:0042908) |
| 1.0 | 3.1 | GO:0030886 | negative regulation of myeloid dendritic cell activation(GO:0030886) |
| 1.0 | 3.0 | GO:0043490 | malate-aspartate shuttle(GO:0043490) |
| 1.0 | 7.0 | GO:0021999 | neural plate anterior/posterior regionalization(GO:0021999) midbrain-hindbrain boundary development(GO:0030917) |
| 1.0 | 3.0 | GO:0050902 | leukocyte adhesive activation(GO:0050902) |
| 1.0 | 15.8 | GO:0018298 | protein-chromophore linkage(GO:0018298) |
| 1.0 | 11.7 | GO:0017121 | phospholipid scrambling(GO:0017121) |
| 1.0 | 1.9 | GO:1903371 | regulation of endoplasmic reticulum tubular network organization(GO:1903371) |
| 0.9 | 7.4 | GO:0043353 | enucleate erythrocyte differentiation(GO:0043353) |
| 0.9 | 5.5 | GO:1903960 | regulation of plasma membrane long-chain fatty acid transport(GO:0010746) negative regulation of plasma membrane long-chain fatty acid transport(GO:0010748) negative regulation of anion transmembrane transport(GO:1903960) |
| 0.9 | 19.1 | GO:0019800 | peptide cross-linking via chondroitin 4-sulfate glycosaminoglycan(GO:0019800) |
| 0.9 | 4.5 | GO:0001550 | ovarian cumulus expansion(GO:0001550) fused antrum stage(GO:0048165) |
| 0.9 | 24.8 | GO:0010719 | negative regulation of epithelial to mesenchymal transition(GO:0010719) |
| 0.9 | 5.3 | GO:0016554 | cytidine to uridine editing(GO:0016554) |
| 0.8 | 15.0 | GO:0010457 | centriole-centriole cohesion(GO:0010457) |
| 0.8 | 20.0 | GO:0045947 | negative regulation of translational initiation(GO:0045947) |
| 0.7 | 3.0 | GO:0070253 | somatostatin secretion(GO:0070253) |
| 0.7 | 2.9 | GO:0005986 | sucrose biosynthetic process(GO:0005986) |
| 0.7 | 8.4 | GO:1901621 | negative regulation of smoothened signaling pathway involved in dorsal/ventral neural tube patterning(GO:1901621) |
| 0.7 | 10.9 | GO:0035970 | peptidyl-threonine dephosphorylation(GO:0035970) |
| 0.7 | 2.0 | GO:0044537 | regulation of circulating fibrinogen levels(GO:0044537) |
| 0.7 | 20.2 | GO:0009083 | branched-chain amino acid metabolic process(GO:0009081) branched-chain amino acid catabolic process(GO:0009083) |
| 0.6 | 5.2 | GO:2000189 | positive regulation of cholesterol homeostasis(GO:2000189) |
| 0.6 | 1.9 | GO:0045212 | negative regulation of synaptic transmission, cholinergic(GO:0032223) neurotransmitter receptor biosynthetic process(GO:0045212) |
| 0.6 | 8.7 | GO:0030208 | dermatan sulfate biosynthetic process(GO:0030208) |
| 0.6 | 4.3 | GO:0023021 | termination of signal transduction(GO:0023021) |
| 0.6 | 4.9 | GO:0051533 | positive regulation of NFAT protein import into nucleus(GO:0051533) |
| 0.6 | 1.8 | GO:0032900 | regulation of nucleoside transport(GO:0032242) negative regulation of neurotrophin production(GO:0032900) |
| 0.6 | 2.4 | GO:0070092 | regulation of glucagon secretion(GO:0070092) |
| 0.6 | 12.4 | GO:0010763 | positive regulation of fibroblast migration(GO:0010763) |
| 0.6 | 2.8 | GO:0014051 | gamma-aminobutyric acid secretion(GO:0014051) |
| 0.6 | 7.9 | GO:1902669 | positive regulation of axon guidance(GO:1902669) |
| 0.5 | 4.9 | GO:0060363 | cranial suture morphogenesis(GO:0060363) |
| 0.5 | 4.6 | GO:0070278 | extracellular matrix constituent secretion(GO:0070278) |
| 0.5 | 12.3 | GO:0035338 | long-chain fatty-acyl-CoA biosynthetic process(GO:0035338) |
| 0.5 | 5.3 | GO:0021869 | forebrain ventricular zone progenitor cell division(GO:0021869) |
| 0.5 | 4.7 | GO:0045329 | carnitine biosynthetic process(GO:0045329) |
| 0.5 | 1.4 | GO:0048213 | Golgi vesicle prefusion complex stabilization(GO:0048213) |
| 0.5 | 0.9 | GO:0045636 | positive regulation of melanocyte differentiation(GO:0045636) |
| 0.5 | 1.4 | GO:2000566 | positive regulation of CD8-positive, alpha-beta T cell proliferation(GO:2000566) |
| 0.4 | 2.1 | GO:0090080 | positive regulation of MAPKKK cascade by fibroblast growth factor receptor signaling pathway(GO:0090080) |
| 0.4 | 13.8 | GO:0000188 | inactivation of MAPK activity(GO:0000188) |
| 0.4 | 1.2 | GO:0036060 | filtration diaphragm assembly(GO:0036058) slit diaphragm assembly(GO:0036060) |
| 0.4 | 6.4 | GO:0042135 | neurotransmitter catabolic process(GO:0042135) |
| 0.4 | 9.0 | GO:0016242 | negative regulation of macroautophagy(GO:0016242) |
| 0.4 | 4.1 | GO:0045794 | negative regulation of cell volume(GO:0045794) |
| 0.4 | 3.0 | GO:0072383 | plus-end-directed vesicle transport along microtubule(GO:0072383) |
| 0.4 | 7.7 | GO:0006895 | Golgi to endosome transport(GO:0006895) |
| 0.4 | 3.3 | GO:0086024 | adrenergic receptor signaling pathway involved in positive regulation of heart rate(GO:0086024) |
| 0.3 | 3.8 | GO:1903800 | positive regulation of production of miRNAs involved in gene silencing by miRNA(GO:1903800) |
| 0.3 | 2.3 | GO:1903690 | negative regulation of wound healing, spreading of epidermal cells(GO:1903690) |
| 0.3 | 1.6 | GO:0010735 | positive regulation of transcription via serum response element binding(GO:0010735) |
| 0.3 | 5.0 | GO:0043374 | CD8-positive, alpha-beta T cell differentiation(GO:0043374) |
| 0.3 | 1.2 | GO:0032747 | positive regulation of interleukin-23 production(GO:0032747) |
| 0.3 | 1.1 | GO:0060748 | tertiary branching involved in mammary gland duct morphogenesis(GO:0060748) |
| 0.3 | 11.5 | GO:0007214 | gamma-aminobutyric acid signaling pathway(GO:0007214) |
| 0.3 | 2.4 | GO:0018344 | protein geranylgeranylation(GO:0018344) |
| 0.3 | 4.9 | GO:0035090 | maintenance of apical/basal cell polarity(GO:0035090) maintenance of epithelial cell apical/basal polarity(GO:0045199) |
| 0.3 | 0.8 | GO:1901350 | cell-cell signaling involved in cell-cell junction organization(GO:1901350) |
| 0.3 | 0.8 | GO:0045659 | regulation of neutrophil differentiation(GO:0045658) negative regulation of neutrophil differentiation(GO:0045659) |
| 0.2 | 2.7 | GO:0033227 | dsRNA transport(GO:0033227) |
| 0.2 | 3.7 | GO:0045475 | locomotor rhythm(GO:0045475) |
| 0.2 | 4.6 | GO:0032486 | Rap protein signal transduction(GO:0032486) |
| 0.2 | 3.6 | GO:0016024 | CDP-diacylglycerol biosynthetic process(GO:0016024) |
| 0.2 | 4.0 | GO:0005513 | detection of calcium ion(GO:0005513) |
| 0.2 | 1.6 | GO:0070544 | histone H3-K36 demethylation(GO:0070544) |
| 0.2 | 1.6 | GO:0061303 | cornea development in camera-type eye(GO:0061303) |
| 0.2 | 1.6 | GO:0048702 | embryonic neurocranium morphogenesis(GO:0048702) |
| 0.2 | 1.4 | GO:0035694 | mitochondrial protein catabolic process(GO:0035694) |
| 0.2 | 1.6 | GO:0070294 | renal sodium ion absorption(GO:0070294) |
| 0.2 | 5.0 | GO:0006646 | phosphatidylethanolamine biosynthetic process(GO:0006646) |
| 0.2 | 7.7 | GO:0097120 | receptor localization to synapse(GO:0097120) |
| 0.2 | 0.9 | GO:0034343 | microglial cell activation involved in immune response(GO:0002282) type III interferon production(GO:0034343) regulation of type III interferon production(GO:0034344) positive regulation of interferon-alpha biosynthetic process(GO:0045356) |
| 0.2 | 2.4 | GO:0030207 | chondroitin sulfate catabolic process(GO:0030207) |
| 0.2 | 2.0 | GO:0035873 | lactate transport(GO:0015727) lactate transmembrane transport(GO:0035873) |
| 0.2 | 8.3 | GO:0030199 | collagen fibril organization(GO:0030199) |
| 0.2 | 3.9 | GO:0003351 | epithelial cilium movement(GO:0003351) |
| 0.2 | 5.8 | GO:0015813 | acidic amino acid transport(GO:0015800) L-glutamate transport(GO:0015813) |
| 0.2 | 2.9 | GO:0002467 | germinal center formation(GO:0002467) |
| 0.2 | 9.6 | GO:0034260 | negative regulation of GTPase activity(GO:0034260) |
| 0.2 | 2.6 | GO:0015671 | oxygen transport(GO:0015671) |
| 0.2 | 5.8 | GO:0000470 | maturation of LSU-rRNA(GO:0000470) |
| 0.2 | 0.8 | GO:0042361 | menaquinone catabolic process(GO:0042361) vitamin K catabolic process(GO:0042377) |
| 0.2 | 56.6 | GO:0002244 | hematopoietic progenitor cell differentiation(GO:0002244) |
| 0.2 | 7.1 | GO:0007271 | synaptic transmission, cholinergic(GO:0007271) |
| 0.2 | 1.2 | GO:0060414 | aorta smooth muscle tissue morphogenesis(GO:0060414) |
| 0.2 | 12.4 | GO:0009060 | aerobic respiration(GO:0009060) |
| 0.2 | 2.8 | GO:0034975 | protein folding in endoplasmic reticulum(GO:0034975) |
| 0.2 | 6.0 | GO:0042462 | eye photoreceptor cell development(GO:0042462) |
| 0.2 | 12.2 | GO:0070126 | mitochondrial translational elongation(GO:0070125) mitochondrial translational termination(GO:0070126) |
| 0.2 | 5.3 | GO:0045022 | early endosome to late endosome transport(GO:0045022) |
| 0.2 | 0.2 | GO:0014724 | regulation of twitch skeletal muscle contraction(GO:0014724) |
| 0.2 | 5.8 | GO:0030261 | chromosome condensation(GO:0030261) |
| 0.2 | 9.5 | GO:0019933 | cAMP-mediated signaling(GO:0019933) |
| 0.2 | 0.3 | GO:0042699 | follicle-stimulating hormone signaling pathway(GO:0042699) |
| 0.2 | 4.2 | GO:0071526 | semaphorin-plexin signaling pathway(GO:0071526) |
| 0.1 | 6.1 | GO:0045668 | negative regulation of osteoblast differentiation(GO:0045668) |
| 0.1 | 1.5 | GO:0071285 | cellular response to lithium ion(GO:0071285) |
| 0.1 | 0.4 | GO:0046541 | saliva secretion(GO:0046541) |
| 0.1 | 5.0 | GO:0070423 | nucleotide-binding oligomerization domain containing signaling pathway(GO:0070423) |
| 0.1 | 11.6 | GO:0005977 | glycogen metabolic process(GO:0005977) |
| 0.1 | 6.6 | GO:0032210 | regulation of telomere maintenance via telomerase(GO:0032210) |
| 0.1 | 4.7 | GO:0006699 | bile acid biosynthetic process(GO:0006699) |
| 0.1 | 0.8 | GO:0090073 | positive regulation of protein homodimerization activity(GO:0090073) |
| 0.1 | 4.4 | GO:0006904 | vesicle docking involved in exocytosis(GO:0006904) |
| 0.1 | 2.0 | GO:0030214 | hyaluronan catabolic process(GO:0030214) |
| 0.1 | 3.3 | GO:0010761 | fibroblast migration(GO:0010761) |
| 0.1 | 10.8 | GO:1902600 | hydrogen ion transmembrane transport(GO:1902600) |
| 0.1 | 2.0 | GO:0070536 | protein K63-linked deubiquitination(GO:0070536) |
| 0.1 | 4.3 | GO:0038128 | ERBB2 signaling pathway(GO:0038128) |
| 0.1 | 14.1 | GO:0007156 | homophilic cell adhesion via plasma membrane adhesion molecules(GO:0007156) |
| 0.1 | 1.1 | GO:0019722 | calcium-mediated signaling(GO:0019722) |
| 0.1 | 6.1 | GO:0032092 | positive regulation of protein binding(GO:0032092) |
| 0.1 | 1.0 | GO:0015074 | DNA integration(GO:0015074) |
| 0.1 | 0.4 | GO:0038170 | somatostatin receptor signaling pathway(GO:0038169) somatostatin signaling pathway(GO:0038170) |
| 0.1 | 3.1 | GO:0018149 | peptide cross-linking(GO:0018149) |
| 0.1 | 2.5 | GO:0032728 | positive regulation of interferon-beta production(GO:0032728) |
| 0.1 | 2.4 | GO:0010738 | regulation of protein kinase A signaling(GO:0010738) |
| 0.1 | 2.3 | GO:0034113 | heterotypic cell-cell adhesion(GO:0034113) |
| 0.1 | 0.6 | GO:0008298 | intracellular mRNA localization(GO:0008298) |
| 0.1 | 0.7 | GO:0015865 | purine nucleotide transport(GO:0015865) purine ribonucleotide transport(GO:0015868) |
| 0.1 | 1.8 | GO:0070884 | regulation of calcineurin-NFAT signaling cascade(GO:0070884) |
| 0.1 | 0.5 | GO:1902412 | regulation of mitotic cytokinesis(GO:1902412) |
| 0.1 | 3.7 | GO:0051965 | positive regulation of synapse assembly(GO:0051965) |
| 0.1 | 0.2 | GO:0070417 | cellular response to cold(GO:0070417) |
| 0.1 | 1.1 | GO:0097186 | amelogenesis(GO:0097186) |
| 0.1 | 1.1 | GO:0034142 | toll-like receptor 4 signaling pathway(GO:0034142) |
| 0.1 | 0.6 | GO:0046185 | aldehyde catabolic process(GO:0046185) |
| 0.1 | 3.8 | GO:0030049 | muscle filament sliding(GO:0030049) actin-myosin filament sliding(GO:0033275) |
| 0.1 | 0.7 | GO:0060732 | positive regulation of inositol phosphate biosynthetic process(GO:0060732) |
| 0.0 | 0.1 | GO:2000393 | negative regulation of lamellipodium morphogenesis(GO:2000393) |
| 0.0 | 1.9 | GO:0030317 | sperm motility(GO:0030317) |
| 0.0 | 1.3 | GO:0007586 | digestion(GO:0007586) |
| 0.0 | 0.8 | GO:0003416 | endochondral bone growth(GO:0003416) |
| 0.0 | 0.3 | GO:0060481 | lobar bronchus epithelium development(GO:0060481) |
| 0.0 | 0.5 | GO:1903817 | diaphragm development(GO:0060539) negative regulation of delayed rectifier potassium channel activity(GO:1902260) negative regulation of voltage-gated potassium channel activity(GO:1903817) |
| 0.0 | 0.4 | GO:0010886 | positive regulation of cholesterol storage(GO:0010886) |
| 0.0 | 1.0 | GO:0010863 | positive regulation of phospholipase C activity(GO:0010863) |
| 0.0 | 1.2 | GO:0090263 | positive regulation of canonical Wnt signaling pathway(GO:0090263) |
| 0.0 | 1.3 | GO:0051865 | protein autoubiquitination(GO:0051865) |
| 0.0 | 0.2 | GO:0033033 | negative regulation of myeloid cell apoptotic process(GO:0033033) |
| 0.0 | 2.0 | GO:0090630 | activation of GTPase activity(GO:0090630) |
| 0.0 | 4.6 | GO:0098656 | anion transmembrane transport(GO:0098656) |
| 0.0 | 4.6 | GO:0007050 | cell cycle arrest(GO:0007050) |
| 0.0 | 1.7 | GO:0030316 | osteoclast differentiation(GO:0030316) |
| 0.0 | 1.6 | GO:0007224 | smoothened signaling pathway(GO:0007224) |
| 0.0 | 2.2 | GO:0000209 | protein polyubiquitination(GO:0000209) |
| 0.0 | 0.8 | GO:0051092 | positive regulation of NF-kappaB transcription factor activity(GO:0051092) |
| 0.0 | 0.2 | GO:0050890 | cognition(GO:0050890) |
| 0.0 | 3.0 | GO:0006364 | rRNA processing(GO:0006364) |
| 0.0 | 1.1 | GO:0071805 | cellular potassium ion transport(GO:0071804) potassium ion transmembrane transport(GO:0071805) |
Gene overrepresentation in cellular_component category:
| Log-likelihood per target | Total log-likelihood | Term | Description |
|---|---|---|---|
| 7.5 | 120.0 | GO:0097512 | cardiac myofibril(GO:0097512) |
| 5.2 | 15.5 | GO:0034365 | discoidal high-density lipoprotein particle(GO:0034365) |
| 4.5 | 13.6 | GO:0071020 | post-spliceosomal complex(GO:0071020) |
| 3.2 | 9.7 | GO:0020005 | symbiont-containing vacuole(GO:0020003) symbiont-containing vacuole membrane(GO:0020005) |
| 2.8 | 8.3 | GO:0005588 | collagen type V trimer(GO:0005588) |
| 2.2 | 10.8 | GO:0001652 | granular component(GO:0001652) |
| 2.0 | 8.1 | GO:0030485 | smooth muscle contractile fiber(GO:0030485) |
| 1.6 | 25.4 | GO:0031362 | anchored component of external side of plasma membrane(GO:0031362) |
| 1.5 | 13.6 | GO:0005955 | calcineurin complex(GO:0005955) |
| 1.4 | 8.3 | GO:1990769 | proximal neuron projection(GO:1990769) |
| 1.3 | 5.3 | GO:0070695 | FHF complex(GO:0070695) |
| 1.3 | 10.1 | GO:0071204 | U7 snRNP(GO:0005683) histone pre-mRNA 3'end processing complex(GO:0071204) |
| 1.2 | 4.9 | GO:0032937 | SREBP-SCAP-Insig complex(GO:0032937) |
| 1.2 | 7.2 | GO:0032280 | symmetric synapse(GO:0032280) |
| 1.2 | 35.6 | GO:0005868 | cytoplasmic dynein complex(GO:0005868) |
| 1.0 | 9.1 | GO:0070652 | HAUS complex(GO:0070652) |
| 1.0 | 4.9 | GO:0005947 | mitochondrial alpha-ketoglutarate dehydrogenase complex(GO:0005947) |
| 1.0 | 5.8 | GO:0070545 | PeBoW complex(GO:0070545) |
| 0.9 | 7.4 | GO:0045179 | apical cortex(GO:0045179) |
| 0.9 | 23.9 | GO:0032982 | myosin filament(GO:0032982) |
| 0.9 | 14.9 | GO:0033270 | paranode region of axon(GO:0033270) |
| 0.9 | 14.8 | GO:0030285 | integral component of synaptic vesicle membrane(GO:0030285) intrinsic component of synaptic vesicle membrane(GO:0098563) |
| 0.8 | 29.2 | GO:0097542 | ciliary tip(GO:0097542) |
| 0.7 | 4.9 | GO:0098554 | cytoplasmic side of endoplasmic reticulum membrane(GO:0098554) |
| 0.6 | 5.8 | GO:1990761 | growth cone lamellipodium(GO:1990761) growth cone filopodium(GO:1990812) |
| 0.6 | 2.4 | GO:0005968 | Rab-protein geranylgeranyltransferase complex(GO:0005968) |
| 0.6 | 38.9 | GO:0030672 | synaptic vesicle membrane(GO:0030672) exocytic vesicle membrane(GO:0099501) |
| 0.5 | 7.5 | GO:0017119 | Golgi transport complex(GO:0017119) |
| 0.5 | 50.0 | GO:0005905 | clathrin-coated pit(GO:0005905) |
| 0.4 | 63.1 | GO:0044853 | plasma membrane raft(GO:0044853) |
| 0.4 | 4.5 | GO:1990712 | HFE-transferrin receptor complex(GO:1990712) |
| 0.4 | 5.4 | GO:0032045 | guanyl-nucleotide exchange factor complex(GO:0032045) |
| 0.4 | 5.8 | GO:0008385 | IkappaB kinase complex(GO:0008385) |
| 0.4 | 9.4 | GO:0043205 | microfibril(GO:0001527) fibril(GO:0043205) |
| 0.4 | 4.9 | GO:0030673 | axolemma(GO:0030673) |
| 0.4 | 14.6 | GO:0042629 | mast cell granule(GO:0042629) |
| 0.4 | 7.1 | GO:0005892 | acetylcholine-gated channel complex(GO:0005892) |
| 0.4 | 30.7 | GO:0008021 | synaptic vesicle(GO:0008021) |
| 0.4 | 67.5 | GO:0030426 | growth cone(GO:0030426) |
| 0.3 | 26.2 | GO:0042734 | presynaptic membrane(GO:0042734) |
| 0.3 | 8.2 | GO:0044224 | juxtaparanode region of axon(GO:0044224) |
| 0.3 | 2.8 | GO:0072546 | ER membrane protein complex(GO:0072546) |
| 0.3 | 12.2 | GO:0005762 | organellar large ribosomal subunit(GO:0000315) mitochondrial large ribosomal subunit(GO:0005762) |
| 0.3 | 8.7 | GO:0030660 | Golgi-associated vesicle membrane(GO:0030660) |
| 0.3 | 15.4 | GO:0031594 | neuromuscular junction(GO:0031594) |
| 0.3 | 2.2 | GO:0043196 | varicosity(GO:0043196) |
| 0.3 | 2.3 | GO:0045180 | basal cortex(GO:0045180) |
| 0.2 | 24.7 | GO:0030658 | transport vesicle membrane(GO:0030658) |
| 0.2 | 9.0 | GO:0043198 | dendritic shaft(GO:0043198) |
| 0.2 | 6.0 | GO:0005921 | gap junction(GO:0005921) |
| 0.2 | 0.9 | GO:0036020 | endolysosome membrane(GO:0036020) |
| 0.2 | 3.8 | GO:0005859 | muscle myosin complex(GO:0005859) |
| 0.2 | 6.0 | GO:0032391 | photoreceptor connecting cilium(GO:0032391) |
| 0.2 | 4.9 | GO:0071565 | nBAF complex(GO:0071565) |
| 0.2 | 2.6 | GO:0005833 | hemoglobin complex(GO:0005833) |
| 0.2 | 3.4 | GO:0042599 | lamellar body(GO:0042599) |
| 0.2 | 5.4 | GO:0014704 | intercalated disc(GO:0014704) |
| 0.2 | 3.7 | GO:0032809 | neuronal cell body membrane(GO:0032809) cell body membrane(GO:0044298) |
| 0.2 | 4.5 | GO:0035371 | microtubule plus-end(GO:0035371) |
| 0.2 | 17.1 | GO:0030018 | Z disc(GO:0030018) |
| 0.2 | 35.9 | GO:0045121 | membrane raft(GO:0045121) |
| 0.1 | 38.4 | GO:0019898 | extrinsic component of membrane(GO:0019898) |
| 0.1 | 12.1 | GO:0032580 | Golgi cisterna membrane(GO:0032580) |
| 0.1 | 5.4 | GO:0008305 | integrin complex(GO:0008305) |
| 0.1 | 10.1 | GO:0043197 | dendritic spine(GO:0043197) |
| 0.1 | 3.6 | GO:0005697 | telomerase holoenzyme complex(GO:0005697) |
| 0.1 | 5.0 | GO:0016235 | aggresome(GO:0016235) |
| 0.1 | 0.2 | GO:0031205 | endoplasmic reticulum Sec complex(GO:0031205) |
| 0.1 | 2.4 | GO:0005913 | cell-cell adherens junction(GO:0005913) |
| 0.1 | 7.3 | GO:0001669 | acrosomal vesicle(GO:0001669) |
| 0.1 | 3.5 | GO:0001533 | cornified envelope(GO:0001533) |
| 0.1 | 4.4 | GO:0008076 | voltage-gated potassium channel complex(GO:0008076) potassium channel complex(GO:0034705) |
| 0.1 | 7.1 | GO:0005814 | centriole(GO:0005814) |
| 0.1 | 16.9 | GO:0030424 | axon(GO:0030424) |
| 0.1 | 3.3 | GO:0005891 | voltage-gated calcium channel complex(GO:0005891) |
| 0.1 | 3.1 | GO:0045171 | intercellular bridge(GO:0045171) |
| 0.1 | 5.7 | GO:0032587 | ruffle membrane(GO:0032587) |
| 0.1 | 6.5 | GO:0034702 | ion channel complex(GO:0034702) |
| 0.1 | 20.1 | GO:0005788 | endoplasmic reticulum lumen(GO:0005788) |
| 0.1 | 2.8 | GO:0005902 | microvillus(GO:0005902) |
| 0.1 | 7.1 | GO:0099572 | postsynaptic density(GO:0014069) postsynaptic specialization(GO:0099572) |
| 0.1 | 7.2 | GO:0000932 | cytoplasmic mRNA processing body(GO:0000932) |
| 0.1 | 2.0 | GO:0033116 | endoplasmic reticulum-Golgi intermediate compartment membrane(GO:0033116) |
| 0.1 | 1.3 | GO:0031985 | Golgi cisterna(GO:0031985) |
| 0.1 | 4.7 | GO:0031901 | early endosome membrane(GO:0031901) |
| 0.1 | 3.7 | GO:0044420 | extracellular matrix component(GO:0044420) |
| 0.0 | 1.2 | GO:0032154 | cleavage furrow(GO:0032154) cell surface furrow(GO:0097610) |
| 0.0 | 0.6 | GO:0035145 | exon-exon junction complex(GO:0035145) |
| 0.0 | 0.4 | GO:0034362 | low-density lipoprotein particle(GO:0034362) |
| 0.0 | 2.9 | GO:0000784 | nuclear chromosome, telomeric region(GO:0000784) |
| 0.0 | 1.1 | GO:0005811 | lipid particle(GO:0005811) |
| 0.0 | 3.0 | GO:0043209 | myelin sheath(GO:0043209) |
| 0.0 | 3.6 | GO:0043235 | receptor complex(GO:0043235) |
| 0.0 | 1.6 | GO:0043202 | lysosomal lumen(GO:0043202) |
| 0.0 | 0.5 | GO:0016592 | mediator complex(GO:0016592) |
| 0.0 | 2.0 | GO:0016324 | apical plasma membrane(GO:0016324) |
| 0.0 | 4.9 | GO:0005743 | mitochondrial inner membrane(GO:0005743) |
| 0.0 | 2.2 | GO:0098852 | lysosomal membrane(GO:0005765) lytic vacuole membrane(GO:0098852) |
| 0.0 | 0.8 | GO:0035579 | specific granule membrane(GO:0035579) |
Gene overrepresentation in molecular_function category:
| Log-likelihood per target | Total log-likelihood | Term | Description |
|---|---|---|---|
| 6.1 | 24.5 | GO:0035373 | chondroitin sulfate proteoglycan binding(GO:0035373) |
| 5.2 | 15.5 | GO:0070326 | very-low-density lipoprotein particle receptor binding(GO:0070326) |
| 4.4 | 22.0 | GO:0070097 | delta-catenin binding(GO:0070097) |
| 4.3 | 12.9 | GO:0004676 | 3-phosphoinositide-dependent protein kinase activity(GO:0004676) |
| 3.9 | 120.0 | GO:0005212 | structural constituent of eye lens(GO:0005212) |
| 3.8 | 15.1 | GO:0005220 | inositol 1,4,5-trisphosphate-sensitive calcium-release channel activity(GO:0005220) |
| 3.4 | 10.1 | GO:0071209 | U7 snRNA binding(GO:0071209) |
| 3.3 | 43.2 | GO:0047372 | acylglycerol lipase activity(GO:0047372) |
| 3.3 | 36.1 | GO:0008430 | selenium binding(GO:0008430) |
| 3.2 | 9.7 | GO:0035379 | carbon dioxide transmembrane transporter activity(GO:0035379) |
| 3.2 | 12.8 | GO:0004505 | phenylalanine 4-monooxygenase activity(GO:0004505) |
| 2.6 | 10.5 | GO:0061714 | folic acid receptor activity(GO:0061714) |
| 2.6 | 20.8 | GO:0030023 | extracellular matrix constituent conferring elasticity(GO:0030023) |
| 2.5 | 14.9 | GO:1903135 | cupric ion binding(GO:1903135) |
| 2.4 | 55.6 | GO:0005545 | 1-phosphatidylinositol binding(GO:0005545) |
| 2.2 | 30.3 | GO:0042043 | neurexin family protein binding(GO:0042043) |
| 2.0 | 20.3 | GO:1990380 | Lys48-specific deubiquitinase activity(GO:1990380) |
| 2.0 | 6.1 | GO:0032427 | GBD domain binding(GO:0032427) |
| 1.9 | 15.3 | GO:0003810 | protein-glutamine gamma-glutamyltransferase activity(GO:0003810) |
| 1.8 | 14.6 | GO:0004111 | creatine kinase activity(GO:0004111) |
| 1.8 | 10.9 | GO:0004741 | [pyruvate dehydrogenase (lipoamide)] phosphatase activity(GO:0004741) |
| 1.8 | 35.6 | GO:0045504 | dynein heavy chain binding(GO:0045504) |
| 1.7 | 15.3 | GO:0032051 | clathrin light chain binding(GO:0032051) |
| 1.7 | 23.7 | GO:0031432 | titin binding(GO:0031432) |
| 1.7 | 5.0 | GO:0035403 | histone kinase activity (H3-T6 specific)(GO:0035403) |
| 1.6 | 4.9 | GO:0003863 | alpha-ketoacid dehydrogenase activity(GO:0003826) 3-methyl-2-oxobutanoate dehydrogenase (2-methylpropanoyl-transferring) activity(GO:0003863) |
| 1.5 | 11.7 | GO:0004865 | protein serine/threonine phosphatase inhibitor activity(GO:0004865) |
| 1.4 | 15.8 | GO:0008020 | G-protein coupled photoreceptor activity(GO:0008020) |
| 1.4 | 10.9 | GO:0008559 | xenobiotic-transporting ATPase activity(GO:0008559) |
| 1.3 | 7.7 | GO:0008597 | calcium-dependent protein serine/threonine phosphatase regulator activity(GO:0008597) |
| 1.2 | 4.9 | GO:0042500 | aspartic endopeptidase activity, intramembrane cleaving(GO:0042500) |
| 1.2 | 4.7 | GO:0008336 | gamma-butyrobetaine dioxygenase activity(GO:0008336) |
| 1.1 | 41.3 | GO:0071855 | neuropeptide receptor binding(GO:0071855) |
| 1.1 | 11.7 | GO:0017128 | phospholipid scramblase activity(GO:0017128) |
| 1.1 | 13.7 | GO:0001087 | transcription factor activity, sequence-specific DNA binding, RNA polymerase recruiting(GO:0001011) transcription factor activity, TFIIB-class binding(GO:0001087) |
| 1.0 | 5.0 | GO:0004306 | ethanolamine-phosphate cytidylyltransferase activity(GO:0004306) |
| 1.0 | 20.0 | GO:0000900 | translation repressor activity, nucleic acid binding(GO:0000900) |
| 0.9 | 6.4 | GO:0001515 | opioid peptide activity(GO:0001515) |
| 0.9 | 7.2 | GO:0051880 | G-quadruplex DNA binding(GO:0051880) |
| 0.9 | 11.5 | GO:0022851 | benzodiazepine receptor activity(GO:0008503) GABA-gated chloride ion channel activity(GO:0022851) |
| 0.8 | 10.0 | GO:0005344 | oxygen transporter activity(GO:0005344) |
| 0.8 | 19.1 | GO:0008191 | metalloendopeptidase inhibitor activity(GO:0008191) |
| 0.8 | 5.3 | GO:0004126 | cytidine deaminase activity(GO:0004126) |
| 0.7 | 2.9 | GO:0042132 | fructose 1,6-bisphosphate 1-phosphatase activity(GO:0042132) |
| 0.7 | 19.3 | GO:0017075 | syntaxin-1 binding(GO:0017075) |
| 0.7 | 12.3 | GO:0102391 | decanoate--CoA ligase activity(GO:0102391) |
| 0.7 | 22.6 | GO:0008395 | steroid hydroxylase activity(GO:0008395) |
| 0.6 | 6.5 | GO:0005225 | volume-sensitive anion channel activity(GO:0005225) |
| 0.6 | 18.1 | GO:0004708 | MAP kinase kinase activity(GO:0004708) |
| 0.6 | 17.7 | GO:0015002 | cytochrome-c oxidase activity(GO:0004129) heme-copper terminal oxidase activity(GO:0015002) oxidoreductase activity, acting on a heme group of donors, oxygen as acceptor(GO:0016676) |
| 0.6 | 3.0 | GO:0015183 | L-aspartate transmembrane transporter activity(GO:0015183) |
| 0.6 | 4.1 | GO:0060072 | large conductance calcium-activated potassium channel activity(GO:0060072) |
| 0.6 | 2.9 | GO:0003956 | NAD(P)+-protein-arginine ADP-ribosyltransferase activity(GO:0003956) |
| 0.5 | 8.4 | GO:0004691 | cAMP-dependent protein kinase activity(GO:0004691) |
| 0.5 | 2.1 | GO:0008422 | beta-glucosidase activity(GO:0008422) |
| 0.5 | 7.2 | GO:0017162 | aryl hydrocarbon receptor binding(GO:0017162) |
| 0.5 | 4.5 | GO:0005025 | transforming growth factor beta receptor activity, type I(GO:0005025) |
| 0.5 | 11.9 | GO:1905030 | voltage-gated sodium channel activity(GO:0005248) voltage-gated ion channel activity involved in regulation of postsynaptic membrane potential(GO:1905030) |
| 0.5 | 1.9 | GO:0003990 | acetylcholinesterase activity(GO:0003990) |
| 0.5 | 3.7 | GO:0005250 | A-type (transient outward) potassium channel activity(GO:0005250) |
| 0.5 | 2.7 | GO:0051033 | nucleic acid transmembrane transporter activity(GO:0051032) RNA transmembrane transporter activity(GO:0051033) |
| 0.4 | 5.8 | GO:0048156 | tau protein binding(GO:0048156) |
| 0.4 | 4.3 | GO:0004767 | sphingomyelin phosphodiesterase activity(GO:0004767) |
| 0.4 | 1.6 | GO:0005477 | pyruvate secondary active transmembrane transporter activity(GO:0005477) |
| 0.4 | 7.4 | GO:0043274 | phospholipase binding(GO:0043274) |
| 0.4 | 10.8 | GO:0071949 | FAD binding(GO:0071949) |
| 0.4 | 3.5 | GO:0004499 | N,N-dimethylaniline monooxygenase activity(GO:0004499) |
| 0.4 | 5.0 | GO:0003995 | acyl-CoA dehydrogenase activity(GO:0003995) |
| 0.4 | 11.3 | GO:0001965 | G-protein alpha-subunit binding(GO:0001965) |
| 0.4 | 10.9 | GO:0070566 | adenylyltransferase activity(GO:0070566) |
| 0.4 | 5.4 | GO:0086008 | voltage-gated potassium channel activity involved in cardiac muscle cell action potential repolarization(GO:0086008) |
| 0.4 | 5.0 | GO:0042975 | peroxisome proliferator activated receptor binding(GO:0042975) |
| 0.4 | 1.8 | GO:0032795 | heterotrimeric G-protein binding(GO:0032795) |
| 0.4 | 4.6 | GO:0017034 | Rap guanyl-nucleotide exchange factor activity(GO:0017034) |
| 0.4 | 2.5 | GO:0001056 | RNA polymerase III activity(GO:0001056) |
| 0.3 | 16.9 | GO:0070412 | R-SMAD binding(GO:0070412) |
| 0.3 | 5.4 | GO:0019992 | diacylglycerol binding(GO:0019992) |
| 0.3 | 4.5 | GO:0032395 | MHC class II receptor activity(GO:0032395) |
| 0.3 | 12.8 | GO:0030552 | cAMP binding(GO:0030552) |
| 0.3 | 7.1 | GO:0042166 | acetylcholine binding(GO:0042166) |
| 0.3 | 7.7 | GO:0016805 | dipeptidase activity(GO:0016805) |
| 0.3 | 8.3 | GO:0043394 | proteoglycan binding(GO:0043394) |
| 0.3 | 1.2 | GO:0050119 | N-acetylglucosamine deacetylase activity(GO:0050119) |
| 0.3 | 5.0 | GO:0031005 | filamin binding(GO:0031005) |
| 0.3 | 1.4 | GO:0050508 | glucuronosyl-N-acetylglucosaminyl-proteoglycan 4-alpha-N-acetylglucosaminyltransferase activity(GO:0050508) |
| 0.3 | 7.9 | GO:0046965 | retinoid X receptor binding(GO:0046965) |
| 0.3 | 1.1 | GO:0051916 | granulocyte colony-stimulating factor binding(GO:0051916) |
| 0.3 | 0.3 | GO:0050436 | microfibril binding(GO:0050436) |
| 0.3 | 18.2 | GO:0050840 | extracellular matrix binding(GO:0050840) |
| 0.3 | 4.2 | GO:0038191 | neuropilin binding(GO:0038191) |
| 0.3 | 0.8 | GO:0016314 | phosphatidylinositol-3,4,5-trisphosphate 3-phosphatase activity(GO:0016314) |
| 0.3 | 10.2 | GO:0050699 | WW domain binding(GO:0050699) |
| 0.2 | 1.2 | GO:0004687 | myosin light chain kinase activity(GO:0004687) |
| 0.2 | 6.5 | GO:0003705 | transcription factor activity, RNA polymerase II distal enhancer sequence-specific binding(GO:0003705) |
| 0.2 | 6.6 | GO:0070182 | DNA polymerase binding(GO:0070182) |
| 0.2 | 7.7 | GO:0004385 | guanylate kinase activity(GO:0004385) |
| 0.2 | 4.4 | GO:0015269 | calcium-activated potassium channel activity(GO:0015269) |
| 0.2 | 18.0 | GO:0008307 | structural constituent of muscle(GO:0008307) |
| 0.2 | 1.6 | GO:0051864 | histone demethylase activity (H3-K36 specific)(GO:0051864) |
| 0.2 | 8.3 | GO:0001786 | phosphatidylserine binding(GO:0001786) |
| 0.2 | 3.0 | GO:0001054 | RNA polymerase I activity(GO:0001054) |
| 0.2 | 6.2 | GO:0005123 | death receptor binding(GO:0005123) |
| 0.2 | 2.3 | GO:0038036 | sphingosine-1-phosphate receptor activity(GO:0038036) |
| 0.2 | 2.9 | GO:0016918 | retinal binding(GO:0016918) |
| 0.2 | 5.3 | GO:0043015 | gamma-tubulin binding(GO:0043015) |
| 0.2 | 2.7 | GO:0005402 | sugar:proton symporter activity(GO:0005351) cation:sugar symporter activity(GO:0005402) |
| 0.2 | 2.4 | GO:0004065 | arylsulfatase activity(GO:0004065) |
| 0.2 | 4.7 | GO:0015248 | sterol transporter activity(GO:0015248) |
| 0.2 | 3.6 | GO:0003841 | 1-acylglycerol-3-phosphate O-acyltransferase activity(GO:0003841) |
| 0.2 | 1.9 | GO:0052658 | inositol-1,4,5-trisphosphate 5-phosphatase activity(GO:0052658) |
| 0.2 | 2.3 | GO:0001948 | glycoprotein binding(GO:0001948) |
| 0.1 | 3.9 | GO:0004016 | adenylate cyclase activity(GO:0004016) |
| 0.1 | 3.7 | GO:0005104 | fibroblast growth factor receptor binding(GO:0005104) |
| 0.1 | 11.2 | GO:0004722 | protein serine/threonine phosphatase activity(GO:0004722) |
| 0.1 | 0.7 | GO:0004991 | parathyroid hormone receptor activity(GO:0004991) |
| 0.1 | 2.4 | GO:0034237 | protein kinase A regulatory subunit binding(GO:0034237) |
| 0.1 | 0.4 | GO:0005017 | platelet-derived growth factor-activated receptor activity(GO:0005017) |
| 0.1 | 6.1 | GO:0017112 | Rab guanyl-nucleotide exchange factor activity(GO:0017112) |
| 0.1 | 7.1 | GO:0004693 | cyclin-dependent protein serine/threonine kinase activity(GO:0004693) |
| 0.1 | 6.3 | GO:0005044 | scavenger receptor activity(GO:0005044) |
| 0.1 | 3.5 | GO:0035257 | nuclear hormone receptor binding(GO:0035257) |
| 0.1 | 4.9 | GO:0030507 | spectrin binding(GO:0030507) |
| 0.1 | 2.4 | GO:0005092 | GDP-dissociation inhibitor activity(GO:0005092) |
| 0.1 | 1.7 | GO:0005068 | transmembrane receptor protein tyrosine kinase adaptor activity(GO:0005068) |
| 0.1 | 1.6 | GO:0043522 | leucine zipper domain binding(GO:0043522) |
| 0.1 | 0.4 | GO:0004994 | somatostatin receptor activity(GO:0004994) |
| 0.1 | 1.2 | GO:0035497 | cAMP response element binding(GO:0035497) |
| 0.1 | 0.4 | GO:0015129 | lactate transmembrane transporter activity(GO:0015129) |
| 0.1 | 2.5 | GO:0035035 | histone acetyltransferase binding(GO:0035035) |
| 0.1 | 6.2 | GO:0003707 | steroid hormone receptor activity(GO:0003707) |
| 0.1 | 0.6 | GO:0004028 | 3-chloroallyl aldehyde dehydrogenase activity(GO:0004028) |
| 0.1 | 3.4 | GO:0005160 | transforming growth factor beta receptor binding(GO:0005160) |
| 0.1 | 3.0 | GO:0008028 | monocarboxylic acid transmembrane transporter activity(GO:0008028) |
| 0.1 | 1.4 | GO:0005521 | lamin binding(GO:0005521) |
| 0.1 | 12.2 | GO:0003735 | structural constituent of ribosome(GO:0003735) |
| 0.1 | 2.8 | GO:0001540 | beta-amyloid binding(GO:0001540) |
| 0.0 | 0.9 | GO:0005184 | neuropeptide hormone activity(GO:0005184) |
| 0.0 | 7.1 | GO:0017137 | Rab GTPase binding(GO:0017137) |
| 0.0 | 5.9 | GO:0008565 | protein transporter activity(GO:0008565) |
| 0.0 | 0.7 | GO:0005243 | gap junction channel activity(GO:0005243) |
| 0.0 | 4.5 | GO:0004197 | cysteine-type endopeptidase activity(GO:0004197) |
| 0.0 | 1.2 | GO:0017147 | Wnt-protein binding(GO:0017147) |
| 0.0 | 1.4 | GO:0042288 | MHC class I protein binding(GO:0042288) |
| 0.0 | 0.5 | GO:0042809 | vitamin D receptor binding(GO:0042809) |
| 0.0 | 1.1 | GO:0005520 | insulin-like growth factor binding(GO:0005520) |
| 0.0 | 3.1 | GO:0001618 | virus receptor activity(GO:0001618) |
| 0.0 | 1.6 | GO:0005246 | calcium channel regulator activity(GO:0005246) |
| 0.0 | 1.0 | GO:0001784 | phosphotyrosine binding(GO:0001784) |
| 0.0 | 4.7 | GO:0008083 | growth factor activity(GO:0008083) |
| 0.0 | 1.1 | GO:0005249 | voltage-gated potassium channel activity(GO:0005249) |
| 0.0 | 0.2 | GO:0051787 | misfolded protein binding(GO:0051787) |
| 0.0 | 5.7 | GO:0030674 | protein binding, bridging(GO:0030674) |
| 0.0 | 16.9 | GO:0005509 | calcium ion binding(GO:0005509) |
| 0.0 | 0.5 | GO:0070402 | NADPH binding(GO:0070402) |
| 0.0 | 4.1 | GO:0005096 | GTPase activator activity(GO:0005096) |
| 0.0 | 0.2 | GO:0030280 | structural constituent of epidermis(GO:0030280) |
| 0.0 | 18.0 | GO:0004872 | receptor activity(GO:0004872) molecular transducer activity(GO:0060089) |
| 0.0 | 3.6 | GO:0061630 | ubiquitin protein ligase activity(GO:0061630) |
Gene overrepresentation in C2:CP category:
| Log-likelihood per target | Total log-likelihood | Term | Description |
|---|---|---|---|
| 0.8 | 38.6 | ST GAQ PATHWAY | G alpha q Pathway |
| 0.7 | 24.5 | PID SYNDECAN 3 PATHWAY | Syndecan-3-mediated signaling events |
| 0.7 | 20.8 | PID INTEGRIN5 PATHWAY | Beta5 beta6 beta7 and beta8 integrin cell surface interactions |
| 0.6 | 20.3 | PID NFKAPPAB CANONICAL PATHWAY | Canonical NF-kappaB pathway |
| 0.6 | 28.6 | PID AVB3 OPN PATHWAY | Osteopontin-mediated events |
| 0.5 | 25.9 | SIG REGULATION OF THE ACTIN CYTOSKELETON BY RHO GTPASES | Genes related to regulation of the actin cytoskeleton |
| 0.4 | 20.3 | PID TCR CALCIUM PATHWAY | Calcium signaling in the CD4+ TCR pathway |
| 0.4 | 55.3 | PID MYC REPRESS PATHWAY | Validated targets of C-MYC transcriptional repression |
| 0.4 | 20.7 | PID ARF6 TRAFFICKING PATHWAY | Arf6 trafficking events |
| 0.3 | 18.3 | NABA PROTEOGLYCANS | Genes encoding proteoglycans |
| 0.3 | 7.2 | PID ERB GENOMIC PATHWAY | Validated nuclear estrogen receptor beta network |
| 0.3 | 13.5 | PID IL2 PI3K PATHWAY | IL2 signaling events mediated by PI3K |
| 0.3 | 5.0 | PID PDGFRA PATHWAY | PDGFR-alpha signaling pathway |
| 0.3 | 4.3 | PID ERBB NETWORK PATHWAY | ErbB receptor signaling network |
| 0.2 | 21.9 | PID AP1 PATHWAY | AP-1 transcription factor network |
| 0.2 | 9.0 | PID GLYPICAN 1PATHWAY | Glypican 1 network |
| 0.2 | 2.3 | PID INTEGRIN CS PATHWAY | Integrin family cell surface interactions |
| 0.2 | 8.3 | NABA COLLAGENS | Genes encoding collagen proteins |
| 0.2 | 13.5 | PID RB 1PATHWAY | Regulation of retinoblastoma protein |
| 0.1 | 4.5 | PID ATF2 PATHWAY | ATF-2 transcription factor network |
| 0.1 | 5.4 | PID RAS PATHWAY | Regulation of Ras family activation |
| 0.1 | 21.6 | NABA ECM AFFILIATED | Genes encoding proteins affiliated structurally or functionally to extracellular matrix proteins |
| 0.1 | 4.5 | PID IL12 STAT4 PATHWAY | IL12 signaling mediated by STAT4 |
| 0.1 | 8.1 | PID CDC42 PATHWAY | CDC42 signaling events |
| 0.1 | 2.5 | PID AMB2 NEUTROPHILS PATHWAY | amb2 Integrin signaling |
| 0.1 | 1.2 | PID KIT PATHWAY | Signaling events mediated by Stem cell factor receptor (c-Kit) |
| 0.1 | 2.3 | PID S1P S1P1 PATHWAY | S1P1 pathway |
| 0.1 | 6.9 | PID ERA GENOMIC PATHWAY | Validated nuclear estrogen receptor alpha network |
| 0.1 | 1.6 | PID FRA PATHWAY | Validated transcriptional targets of AP1 family members Fra1 and Fra2 |
| 0.1 | 6.6 | PID TELOMERASE PATHWAY | Regulation of Telomerase |
| 0.1 | 1.5 | PID EPHRINB REV PATHWAY | Ephrin B reverse signaling |
| 0.1 | 2.0 | PID INTEGRIN2 PATHWAY | Beta2 integrin cell surface interactions |
| 0.1 | 3.0 | PID ARF6 PATHWAY | Arf6 signaling events |
| 0.1 | 2.4 | PID HEDGEHOG GLI PATHWAY | Hedgehog signaling events mediated by Gli proteins |
| 0.1 | 2.1 | PID FGF PATHWAY | FGF signaling pathway |
| 0.1 | 1.6 | PID RHOA PATHWAY | RhoA signaling pathway |
| 0.1 | 0.9 | PID TCR JNK PATHWAY | JNK signaling in the CD4+ TCR pathway |
| 0.0 | 0.7 | SA MMP CYTOKINE CONNECTION | Cytokines can induce activation of matrix metalloproteinases, which degrade extracellular matrix. |
| 0.0 | 0.8 | PID EPO PATHWAY | EPO signaling pathway |
| 0.0 | 3.2 | PID P53 DOWNSTREAM PATHWAY | Direct p53 effectors |
| 0.0 | 0.8 | PID ECADHERIN NASCENT AJ PATHWAY | E-cadherin signaling in the nascent adherens junction |
| 0.0 | 1.6 | PID FOXO PATHWAY | FoxO family signaling |
| 0.0 | 0.9 | NABA BASEMENT MEMBRANES | Genes encoding structural components of basement membranes |
| 0.0 | 0.8 | ST JNK MAPK PATHWAY | JNK MAPK Pathway |
| 0.0 | 4.8 | NABA ECM REGULATORS | Genes encoding enzymes and their regulators involved in the remodeling of the extracellular matrix |
Gene overrepresentation in C2:CP:REACTOME category:
| Log-likelihood per target | Total log-likelihood | Term | Description |
|---|---|---|---|
| 2.3 | 22.6 | REACTOME SYNTHESIS OF BILE ACIDS AND BILE SALTS VIA 24 HYDROXYCHOLESTEROL | Genes involved in Synthesis of bile acids and bile salts via 24-hydroxycholesterol |
| 1.8 | 53.1 | REACTOME HORMONE SENSITIVE LIPASE HSL MEDIATED TRIACYLGLYCEROL HYDROLYSIS | Genes involved in Hormone-sensitive lipase (HSL)-mediated triacylglycerol hydrolysis |
| 1.4 | 15.8 | REACTOME OPSINS | Genes involved in Opsins |
| 0.6 | 20.6 | REACTOME REGULATION OF GENE EXPRESSION IN BETA CELLS | Genes involved in Regulation of gene expression in beta cells |
| 0.6 | 10.9 | REACTOME REGULATION OF PYRUVATE DEHYDROGENASE PDH COMPLEX | Genes involved in Regulation of pyruvate dehydrogenase (PDH) complex |
| 0.6 | 10.1 | REACTOME SLBP DEPENDENT PROCESSING OF REPLICATION DEPENDENT HISTONE PRE MRNAS | Genes involved in SLBP Dependent Processing of Replication-Dependent Histone Pre-mRNAs |
| 0.6 | 15.5 | REACTOME HDL MEDIATED LIPID TRANSPORT | Genes involved in HDL-mediated lipid transport |
| 0.6 | 41.8 | REACTOME STRIATED MUSCLE CONTRACTION | Genes involved in Striated Muscle Contraction |
| 0.6 | 12.3 | REACTOME SYNTHESIS OF VERY LONG CHAIN FATTY ACYL COAS | Genes involved in Synthesis of very long-chain fatty acyl-CoAs |
| 0.6 | 21.8 | REACTOME YAP1 AND WWTR1 TAZ STIMULATED GENE EXPRESSION | Genes involved in YAP1- and WWTR1 (TAZ)-stimulated gene expression |
| 0.5 | 7.4 | REACTOME PASSIVE TRANSPORT BY AQUAPORINS | Genes involved in Passive Transport by Aquaporins |
| 0.5 | 16.8 | REACTOME INTERACTION BETWEEN L1 AND ANKYRINS | Genes involved in Interaction between L1 and Ankyrins |
| 0.5 | 5.9 | REACTOME IKK COMPLEX RECRUITMENT MEDIATED BY RIP1 | Genes involved in IKK complex recruitment mediated by RIP1 |
| 0.5 | 7.2 | REACTOME MRNA DECAY BY 5 TO 3 EXORIBONUCLEASE | Genes involved in mRNA Decay by 5' to 3' Exoribonuclease |
| 0.5 | 5.0 | REACTOME REGULATION OF INSULIN SECRETION BY ACETYLCHOLINE | Genes involved in Regulation of Insulin Secretion by Acetylcholine |
| 0.4 | 7.1 | REACTOME PRESYNAPTIC NICOTINIC ACETYLCHOLINE RECEPTORS | Genes involved in Presynaptic nicotinic acetylcholine receptors |
| 0.4 | 10.3 | REACTOME ARMS MEDIATED ACTIVATION | Genes involved in ARMS-mediated activation |
| 0.4 | 54.3 | REACTOME INTEGRIN CELL SURFACE INTERACTIONS | Genes involved in Integrin cell surface interactions |
| 0.4 | 17.6 | REACTOME MYOGENESIS | Genes involved in Myogenesis |
| 0.4 | 9.8 | REACTOME BRANCHED CHAIN AMINO ACID CATABOLISM | Genes involved in Branched-chain amino acid catabolism |
| 0.4 | 11.5 | REACTOME GABA A RECEPTOR ACTIVATION | Genes involved in GABA A receptor activation |
| 0.4 | 5.1 | REACTOME DOPAMINE NEUROTRANSMITTER RELEASE CYCLE | Genes involved in Dopamine Neurotransmitter Release Cycle |
| 0.3 | 15.3 | REACTOME NOD1 2 SIGNALING PATHWAY | Genes involved in NOD1/2 Signaling Pathway |
| 0.3 | 7.4 | REACTOME TGF BETA RECEPTOR SIGNALING IN EMT EPITHELIAL TO MESENCHYMAL TRANSITION | Genes involved in TGF-beta receptor signaling in EMT (epithelial to mesenchymal transition) |
| 0.3 | 7.6 | REACTOME INSULIN SYNTHESIS AND PROCESSING | Genes involved in Insulin Synthesis and Processing |
| 0.3 | 6.4 | REACTOME ACTIVATION OF RAC | Genes involved in Activation of Rac |
| 0.3 | 9.9 | REACTOME ABC FAMILY PROTEINS MEDIATED TRANSPORT | Genes involved in ABC-family proteins mediated transport |
| 0.3 | 5.0 | REACTOME SYNTHESIS OF PE | Genes involved in Synthesis of PE |
| 0.3 | 14.9 | REACTOME NCAM1 INTERACTIONS | Genes involved in NCAM1 interactions |
| 0.3 | 5.4 | REACTOME INHIBITION OF VOLTAGE GATED CA2 CHANNELS VIA GBETA GAMMA SUBUNITS | Genes involved in Inhibition of voltage gated Ca2+ channels via Gbeta/gamma subunits |
| 0.2 | 6.2 | REACTOME EXTRINSIC PATHWAY FOR APOPTOSIS | Genes involved in Extrinsic Pathway for Apoptosis |
| 0.2 | 5.4 | REACTOME RNA POL III CHAIN ELONGATION | Genes involved in RNA Polymerase III Chain Elongation |
| 0.2 | 1.8 | REACTOME NUCLEOTIDE LIKE PURINERGIC RECEPTORS | Genes involved in Nucleotide-like (purinergic) receptors |
| 0.2 | 2.4 | REACTOME THE ACTIVATION OF ARYLSULFATASES | Genes involved in The activation of arylsulfatases |
| 0.2 | 4.2 | REACTOME OTHER SEMAPHORIN INTERACTIONS | Genes involved in Other semaphorin interactions |
| 0.2 | 5.0 | REACTOME ADHERENS JUNCTIONS INTERACTIONS | Genes involved in Adherens junctions interactions |
| 0.2 | 8.3 | REACTOME REGULATION OF INSULIN SECRETION | Genes involved in Regulation of Insulin Secretion |
| 0.2 | 9.9 | REACTOME G ALPHA Z SIGNALLING EVENTS | Genes involved in G alpha (z) signalling events |
| 0.2 | 2.0 | REACTOME COMMON PATHWAY | Genes involved in Common Pathway |
| 0.1 | 3.6 | REACTOME TRIGLYCERIDE BIOSYNTHESIS | Genes involved in Triglyceride Biosynthesis |
| 0.1 | 8.6 | REACTOME POTASSIUM CHANNELS | Genes involved in Potassium Channels |
| 0.1 | 1.6 | REACTOME KERATAN SULFATE DEGRADATION | Genes involved in Keratan sulfate degradation |
| 0.1 | 4.5 | REACTOME SIGNALING BY BMP | Genes involved in Signaling by BMP |
| 0.1 | 1.7 | REACTOME GLUCAGON TYPE LIGAND RECEPTORS | Genes involved in Glucagon-type ligand receptors |
| 0.1 | 20.0 | REACTOME G ALPHA Q SIGNALLING EVENTS | Genes involved in G alpha (q) signalling events |
| 0.1 | 4.4 | REACTOME COLLAGEN FORMATION | Genes involved in Collagen formation |
| 0.1 | 1.6 | REACTOME BILE SALT AND ORGANIC ANION SLC TRANSPORTERS | Genes involved in Bile salt and organic anion SLC transporters |
| 0.1 | 2.0 | REACTOME HYALURONAN UPTAKE AND DEGRADATION | Genes involved in Hyaluronan uptake and degradation |
| 0.1 | 5.9 | REACTOME GLUCONEOGENESIS | Genes involved in Gluconeogenesis |
| 0.1 | 2.8 | REACTOME INSULIN RECEPTOR RECYCLING | Genes involved in Insulin receptor recycling |
| 0.1 | 5.8 | REACTOME APOPTOTIC CLEAVAGE OF CELLULAR PROTEINS | Genes involved in Apoptotic cleavage of cellular proteins |
| 0.1 | 3.6 | REACTOME SMOOTH MUSCLE CONTRACTION | Genes involved in Smooth Muscle Contraction |
| 0.1 | 2.1 | REACTOME SHC MEDIATED CASCADE | Genes involved in SHC-mediated cascade |
| 0.1 | 1.7 | REACTOME SIGNALING BY FGFR1 MUTANTS | Genes involved in Signaling by FGFR1 mutants |
| 0.1 | 1.8 | REACTOME DARPP 32 EVENTS | Genes involved in DARPP-32 events |
| 0.1 | 0.9 | REACTOME REGULATION OF KIT SIGNALING | Genes involved in Regulation of KIT signaling |
| 0.1 | 5.2 | REACTOME LOSS OF NLP FROM MITOTIC CENTROSOMES | Genes involved in Loss of Nlp from mitotic centrosomes |
| 0.1 | 1.4 | REACTOME GLYCOSPHINGOLIPID METABOLISM | Genes involved in Glycosphingolipid metabolism |
| 0.0 | 5.7 | REACTOME MHC CLASS II ANTIGEN PRESENTATION | Genes involved in MHC class II antigen presentation |
| 0.0 | 1.0 | REACTOME SIGNALING BY ROBO RECEPTOR | Genes involved in Signaling by Robo receptor |
| 0.0 | 3.3 | REACTOME NUCLEAR RECEPTOR TRANSCRIPTION PATHWAY | Genes involved in Nuclear Receptor transcription pathway |
| 0.0 | 0.7 | REACTOME GAP JUNCTION ASSEMBLY | Genes involved in Gap junction assembly |
| 0.0 | 7.2 | REACTOME NONSENSE MEDIATED DECAY ENHANCED BY THE EXON JUNCTION COMPLEX | Genes involved in Nonsense Mediated Decay Enhanced by the Exon Junction Complex |
| 0.0 | 1.2 | REACTOME HS GAG BIOSYNTHESIS | Genes involved in HS-GAG biosynthesis |
| 0.0 | 0.9 | REACTOME GENERATION OF SECOND MESSENGER MOLECULES | Genes involved in Generation of second messenger molecules |
| 0.0 | 2.7 | REACTOME SIGNALING BY RHO GTPASES | Genes involved in Signaling by Rho GTPases |
| 0.0 | 0.3 | REACTOME HORMONE LIGAND BINDING RECEPTORS | Genes involved in Hormone ligand-binding receptors |
| 0.0 | 3.2 | REACTOME G ALPHA I SIGNALLING EVENTS | Genes involved in G alpha (i) signalling events |
| 0.0 | 2.6 | REACTOME FACTORS INVOLVED IN MEGAKARYOCYTE DEVELOPMENT AND PLATELET PRODUCTION | Genes involved in Factors involved in megakaryocyte development and platelet production |
| 0.0 | 0.4 | REACTOME DOWNSTREAM SIGNAL TRANSDUCTION | Genes involved in Downstream signal transduction |
| 0.0 | 0.8 | REACTOME CYTOCHROME P450 ARRANGED BY SUBSTRATE TYPE | Genes involved in Cytochrome P450 - arranged by substrate type |
| 0.0 | 0.6 | REACTOME NRAGE SIGNALS DEATH THROUGH JNK | Genes involved in NRAGE signals death through JNK |
| 0.0 | 0.2 | REACTOME INFLUENZA VIRAL RNA TRANSCRIPTION AND REPLICATION | Genes involved in Influenza Viral RNA Transcription and Replication |