Project
GNF SymAtlas + NCI-60 cancer cell lines, comparison of cancers vs non-cancers, human (Su, 2004; Ross, 2000)
Navigation
Downloads
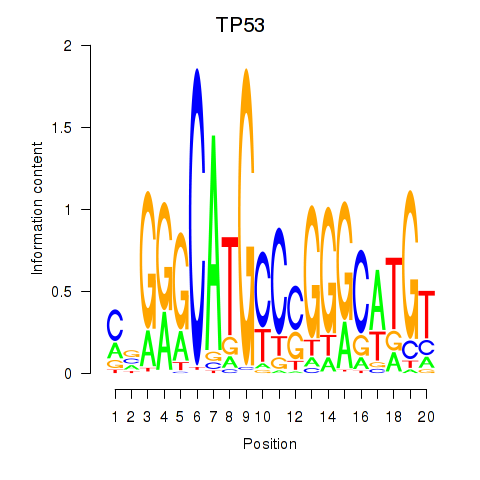
Results for TP53
Z-value: 0.75
Motif logo
Transcription factors associated with TP53
| Gene Symbol | Gene ID | Gene Info |
|---|---|---|
|
TP53
|
ENSG00000141510.11 | tumor protein p53 |
Activity-expression correlation:
| Gene | Promoter | Pearson corr. coef. | P-value | Plot |
|---|---|---|---|---|
| TP53 | hg19_v2_chr17_-_7590745_7590856 | 0.50 | 2.5e-15 | Click! |
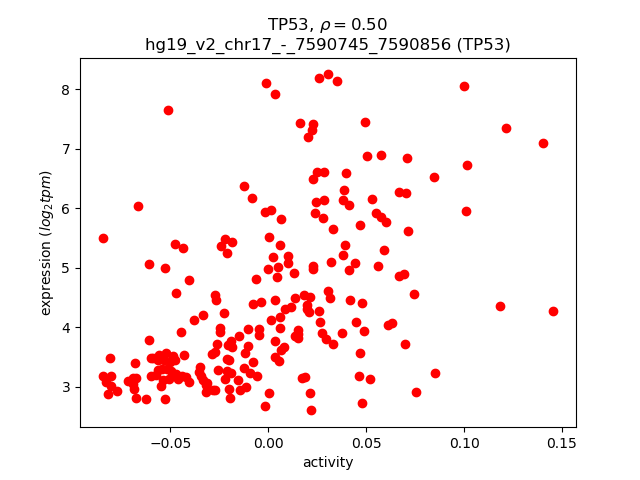
Activity profile of TP53 motif
Sorted Z-values of TP53 motif
| Promoter | Log-likelihood | Transcript | Gene | Gene Info |
|---|---|---|---|---|
| chr6_-_30712313 | 32.55 |
ENST00000376377.2
ENST00000259874.5 |
IER3
|
immediate early response 3 |
| chr7_+_116165754 | 20.19 |
ENST00000405348.1
|
CAV1
|
caveolin 1, caveolae protein, 22kDa |
| chr1_+_156052354 | 19.39 |
ENST00000368301.2
|
LMNA
|
lamin A/C |
| chr15_-_64455404 | 15.82 |
ENST00000300026.3
|
PPIB
|
peptidylprolyl isomerase B (cyclophilin B) |
| chr1_+_203830703 | 15.61 |
ENST00000414487.2
|
SNRPE
|
small nuclear ribonucleoprotein polypeptide E |
| chr6_-_138428613 | 15.13 |
ENST00000421351.3
|
PERP
|
PERP, TP53 apoptosis effector |
| chr4_-_10118348 | 13.66 |
ENST00000502702.1
|
WDR1
|
WD repeat domain 1 |
| chr20_+_33759854 | 13.35 |
ENST00000216968.4
|
PROCR
|
protein C receptor, endothelial |
| chr20_-_5100591 | 13.16 |
ENST00000379143.5
|
PCNA
|
proliferating cell nuclear antigen |
| chr17_+_76210267 | 13.14 |
ENST00000301633.4
ENST00000350051.3 ENST00000374948.2 ENST00000590449.1 |
BIRC5
|
baculoviral IAP repeat containing 5 |
| chr3_+_23851928 | 12.97 |
ENST00000467766.1
ENST00000424381.1 |
UBE2E1
|
ubiquitin-conjugating enzyme E2E 1 |
| chr19_-_2456922 | 12.94 |
ENST00000582871.1
ENST00000325327.3 |
LMNB2
|
lamin B2 |
| chr4_-_10117949 | 12.70 |
ENST00000508079.1
|
WDR1
|
WD repeat domain 1 |
| chr15_-_63448973 | 12.52 |
ENST00000462430.1
|
RPS27L
|
ribosomal protein S27-like |
| chr1_+_43148625 | 11.81 |
ENST00000436427.1
|
YBX1
|
Y box binding protein 1 |
| chr2_-_47168850 | 11.69 |
ENST00000409207.1
|
MCFD2
|
multiple coagulation factor deficiency 2 |
| chr20_+_35234137 | 11.57 |
ENST00000344795.3
ENST00000373852.5 |
C20orf24
|
chromosome 20 open reading frame 24 |
| chr20_-_1373682 | 11.54 |
ENST00000381724.3
|
FKBP1A
|
FK506 binding protein 1A, 12kDa |
| chr1_+_224544552 | 11.42 |
ENST00000465271.1
ENST00000366858.3 |
CNIH4
|
cornichon family AMPA receptor auxiliary protein 4 |
| chr1_-_209825674 | 11.16 |
ENST00000367030.3
ENST00000356082.4 |
LAMB3
|
laminin, beta 3 |
| chr20_+_35234223 | 11.10 |
ENST00000342422.3
|
C20orf24
|
chromosome 20 open reading frame 24 |
| chr7_+_100770328 | 10.87 |
ENST00000223095.4
ENST00000445463.2 |
SERPINE1
|
serpin peptidase inhibitor, clade E (nexin, plasminogen activator inhibitor type 1), member 1 |
| chr4_-_187644930 | 10.85 |
ENST00000441802.2
|
FAT1
|
FAT atypical cadherin 1 |
| chr14_+_97263641 | 10.67 |
ENST00000216639.3
|
VRK1
|
vaccinia related kinase 1 |
| chr20_-_1373726 | 10.59 |
ENST00000400137.4
|
FKBP1A
|
FK506 binding protein 1A, 12kDa |
| chr1_-_113249678 | 10.59 |
ENST00000369633.2
ENST00000425265.2 ENST00000369632.2 ENST00000436685.2 |
RHOC
|
ras homolog family member C |
| chr12_-_122712038 | 10.38 |
ENST00000413918.1
ENST00000443649.3 |
DIABLO
|
diablo, IAP-binding mitochondrial protein |
| chr5_+_162864575 | 10.37 |
ENST00000512163.1
ENST00000393929.1 ENST00000340828.2 ENST00000511683.2 ENST00000510097.1 ENST00000511490.2 ENST00000510664.1 |
CCNG1
|
cyclin G1 |
| chr1_-_113249734 | 9.94 |
ENST00000484054.3
ENST00000369636.2 ENST00000369637.1 ENST00000285735.2 ENST00000369638.2 |
RHOC
|
ras homolog family member C |
| chr18_+_57567180 | 9.82 |
ENST00000316660.6
ENST00000269518.9 |
PMAIP1
|
phorbol-12-myristate-13-acetate-induced protein 1 |
| chr11_-_65626753 | 9.76 |
ENST00000526975.1
ENST00000531413.1 |
CFL1
|
cofilin 1 (non-muscle) |
| chr8_-_22926623 | 9.36 |
ENST00000276431.4
|
TNFRSF10B
|
tumor necrosis factor receptor superfamily, member 10b |
| chr16_-_31105870 | 9.12 |
ENST00000394971.3
|
VKORC1
|
vitamin K epoxide reductase complex, subunit 1 |
| chr6_-_101329191 | 8.95 |
ENST00000324723.6
ENST00000369162.2 ENST00000522650.1 |
ASCC3
|
activating signal cointegrator 1 complex subunit 3 |
| chr9_+_80912059 | 8.93 |
ENST00000347159.2
ENST00000376588.3 |
PSAT1
|
phosphoserine aminotransferase 1 |
| chr12_+_12966250 | 8.74 |
ENST00000352940.4
ENST00000358007.3 ENST00000544400.1 |
DDX47
|
DEAD (Asp-Glu-Ala-Asp) box polypeptide 47 |
| chrX_-_153285251 | 8.61 |
ENST00000444230.1
ENST00000393682.1 ENST00000393687.2 ENST00000429936.2 ENST00000369974.2 |
IRAK1
|
interleukin-1 receptor-associated kinase 1 |
| chr16_-_15149828 | 8.42 |
ENST00000566419.1
ENST00000568320.1 |
NTAN1
|
N-terminal asparagine amidase |
| chr22_-_18257178 | 8.38 |
ENST00000342111.5
|
BID
|
BH3 interacting domain death agonist |
| chr4_-_10118573 | 8.31 |
ENST00000382452.2
ENST00000382451.2 |
WDR1
|
WD repeat domain 1 |
| chr15_+_79165372 | 8.30 |
ENST00000558502.1
|
MORF4L1
|
mortality factor 4 like 1 |
| chr11_-_64084959 | 8.23 |
ENST00000535750.1
ENST00000535126.1 ENST00000539854.1 ENST00000308774.2 |
TRMT112
|
tRNA methyltransferase 11-2 homolog (S. cerevisiae) |
| chr2_-_47168906 | 8.15 |
ENST00000444761.2
ENST00000409147.1 |
MCFD2
|
multiple coagulation factor deficiency 2 |
| chr5_+_72794233 | 7.96 |
ENST00000335895.8
ENST00000380591.3 ENST00000507081.2 |
BTF3
|
basic transcription factor 3 |
| chr3_-_113465065 | 7.90 |
ENST00000497255.1
ENST00000478020.1 ENST00000240922.3 ENST00000493900.1 |
NAA50
|
N(alpha)-acetyltransferase 50, NatE catalytic subunit |
| chr20_-_47804894 | 7.77 |
ENST00000371828.3
ENST00000371856.2 ENST00000360426.4 ENST00000347458.5 ENST00000340954.7 ENST00000371802.1 ENST00000371792.1 ENST00000437404.2 |
STAU1
|
staufen double-stranded RNA binding protein 1 |
| chr3_+_127771212 | 7.69 |
ENST00000243253.3
ENST00000481210.1 |
SEC61A1
|
Sec61 alpha 1 subunit (S. cerevisiae) |
| chrX_-_153285395 | 7.51 |
ENST00000369980.3
|
IRAK1
|
interleukin-1 receptor-associated kinase 1 |
| chr22_-_36924944 | 7.49 |
ENST00000405442.1
ENST00000402116.1 |
EIF3D
|
eukaryotic translation initiation factor 3, subunit D |
| chr1_+_54411995 | 7.46 |
ENST00000319223.4
ENST00000444987.1 |
LRRC42
|
leucine rich repeat containing 42 |
| chr3_+_184079492 | 7.42 |
ENST00000456318.1
ENST00000412877.1 ENST00000438240.1 |
POLR2H
|
polymerase (RNA) II (DNA directed) polypeptide H |
| chr12_-_6451186 | 7.32 |
ENST00000540022.1
ENST00000536194.1 |
TNFRSF1A
|
tumor necrosis factor receptor superfamily, member 1A |
| chr13_-_50367057 | 7.26 |
ENST00000261667.3
|
KPNA3
|
karyopherin alpha 3 (importin alpha 4) |
| chr15_+_79165296 | 7.21 |
ENST00000558746.1
ENST00000558830.1 ENST00000559345.1 |
MORF4L1
|
mortality factor 4 like 1 |
| chr1_-_244615425 | 7.18 |
ENST00000366535.3
|
ADSS
|
adenylosuccinate synthase |
| chr3_+_122785895 | 7.17 |
ENST00000316218.7
|
PDIA5
|
protein disulfide isomerase family A, member 5 |
| chr12_+_53645870 | 7.14 |
ENST00000329548.4
|
MFSD5
|
major facilitator superfamily domain containing 5 |
| chrX_-_154688276 | 7.07 |
ENST00000369445.2
|
F8A3
|
coagulation factor VIII-associated 3 |
| chr1_-_153588334 | 7.03 |
ENST00000476873.1
|
S100A14
|
S100 calcium binding protein A14 |
| chr22_-_36925186 | 6.96 |
ENST00000541106.1
ENST00000455547.1 ENST00000432675.1 |
EIF3D
|
eukaryotic translation initiation factor 3, subunit D |
| chr9_+_116037922 | 6.93 |
ENST00000374198.4
|
PRPF4
|
pre-mRNA processing factor 4 |
| chr3_+_183894566 | 6.89 |
ENST00000439647.1
|
AP2M1
|
adaptor-related protein complex 2, mu 1 subunit |
| chr10_+_92631709 | 6.88 |
ENST00000413330.1
ENST00000277882.3 |
RPP30
|
ribonuclease P/MRP 30kDa subunit |
| chr1_+_54411715 | 6.84 |
ENST00000371370.3
ENST00000371368.1 |
LRRC42
|
leucine rich repeat containing 42 |
| chrX_+_154114635 | 6.75 |
ENST00000369446.2
|
F8A1
|
coagulation factor VIII-associated 1 |
| chr4_-_10118469 | 6.71 |
ENST00000499869.2
|
WDR1
|
WD repeat domain 1 |
| chr17_+_76210367 | 6.65 |
ENST00000592734.1
ENST00000587746.1 |
BIRC5
|
baculoviral IAP repeat containing 5 |
| chr15_-_34635314 | 6.59 |
ENST00000557912.1
ENST00000328848.4 |
NOP10
|
NOP10 ribonucleoprotein |
| chr10_-_126847276 | 6.52 |
ENST00000531469.1
|
CTBP2
|
C-terminal binding protein 2 |
| chr19_+_38865398 | 6.48 |
ENST00000585598.1
ENST00000602911.1 ENST00000592561.1 |
PSMD8
|
proteasome (prosome, macropain) 26S subunit, non-ATPase, 8 |
| chr9_-_95527079 | 6.13 |
ENST00000356884.6
ENST00000375512.3 |
BICD2
|
bicaudal D homolog 2 (Drosophila) |
| chr3_+_14166440 | 6.00 |
ENST00000306077.4
|
TMEM43
|
transmembrane protein 43 |
| chr1_-_156710859 | 5.89 |
ENST00000361531.2
ENST00000412846.1 |
MRPL24
|
mitochondrial ribosomal protein L24 |
| chr22_-_18257249 | 5.87 |
ENST00000399765.1
ENST00000399767.1 ENST00000399774.3 |
BID
|
BH3 interacting domain death agonist |
| chr19_+_42364460 | 5.85 |
ENST00000593863.1
|
RPS19
|
ribosomal protein S19 |
| chr10_+_48255253 | 5.81 |
ENST00000357718.4
ENST00000344416.5 ENST00000456111.2 ENST00000374258.3 |
ANXA8
AL591684.1
|
annexin A8 Protein LOC100996760 |
| chr3_+_196466710 | 5.67 |
ENST00000327134.3
|
PAK2
|
p21 protein (Cdc42/Rac)-activated kinase 2 |
| chr2_+_198365095 | 5.67 |
ENST00000409468.1
|
HSPE1
|
heat shock 10kDa protein 1 |
| chr16_-_31106048 | 5.53 |
ENST00000300851.6
|
VKORC1
|
vitamin K epoxide reductase complex, subunit 1 |
| chr12_-_6451235 | 5.47 |
ENST00000440083.2
ENST00000162749.2 |
TNFRSF1A
|
tumor necrosis factor receptor superfamily, member 1A |
| chr1_-_155990580 | 5.45 |
ENST00000531917.1
ENST00000480567.1 ENST00000526212.1 ENST00000529008.1 ENST00000496742.1 ENST00000295702.4 |
SSR2
|
signal sequence receptor, beta (translocon-associated protein beta) |
| chr1_-_156710916 | 5.43 |
ENST00000368211.4
|
MRPL24
|
mitochondrial ribosomal protein L24 |
| chr7_-_56101826 | 5.41 |
ENST00000421626.1
|
PSPH
|
phosphoserine phosphatase |
| chr10_-_71993176 | 5.32 |
ENST00000373232.3
|
PPA1
|
pyrophosphatase (inorganic) 1 |
| chr16_-_31106211 | 5.22 |
ENST00000532364.1
ENST00000529564.1 ENST00000319788.7 ENST00000354895.4 ENST00000394975.2 |
RP11-196G11.1
VKORC1
|
Uncharacterized protein vitamin K epoxide reductase complex, subunit 1 |
| chr10_-_47173994 | 5.17 |
ENST00000414655.2
ENST00000545298.1 ENST00000359178.4 ENST00000358140.4 ENST00000503031.1 |
ANXA8L1
LINC00842
|
annexin A8-like 1 long intergenic non-protein coding RNA 842 |
| chr1_-_54411240 | 5.10 |
ENST00000371378.2
|
HSPB11
|
heat shock protein family B (small), member 11 |
| chr6_-_114292284 | 5.05 |
ENST00000520895.1
ENST00000521163.1 ENST00000524334.1 ENST00000368632.2 ENST00000398283.2 |
HDAC2
|
histone deacetylase 2 |
| chr4_+_41937131 | 5.03 |
ENST00000504986.1
ENST00000508448.1 ENST00000513702.1 ENST00000325094.5 |
TMEM33
|
transmembrane protein 33 |
| chr15_+_79165222 | 5.02 |
ENST00000559930.1
|
MORF4L1
|
mortality factor 4 like 1 |
| chr1_-_6453426 | 4.96 |
ENST00000545482.1
|
ACOT7
|
acyl-CoA thioesterase 7 |
| chr6_-_114292449 | 4.93 |
ENST00000519065.1
|
HDAC2
|
histone deacetylase 2 |
| chr7_+_23145884 | 4.91 |
ENST00000409689.1
ENST00000410047.1 |
KLHL7
|
kelch-like family member 7 |
| chr8_+_95732095 | 4.90 |
ENST00000414645.2
|
DPY19L4
|
dpy-19-like 4 (C. elegans) |
| chr16_-_58231782 | 4.86 |
ENST00000565188.1
ENST00000262506.3 |
CSNK2A2
|
casein kinase 2, alpha prime polypeptide |
| chr11_-_82997013 | 4.86 |
ENST00000529073.1
ENST00000529611.1 |
CCDC90B
|
coiled-coil domain containing 90B |
| chr10_+_47746929 | 4.72 |
ENST00000340243.6
ENST00000374277.5 ENST00000449464.2 ENST00000538825.1 ENST00000335083.5 |
ANXA8L2
AL603965.1
|
annexin A8-like 2 Protein LOC100996760 |
| chr19_+_57874835 | 4.71 |
ENST00000543226.1
ENST00000596755.1 ENST00000282282.3 ENST00000597658.1 |
TRAPPC2P1
ZNF547
AC003002.4
|
trafficking protein particle complex 2 pseudogene 1 zinc finger protein 547 Uncharacterized protein |
| chr7_+_23145347 | 4.67 |
ENST00000322231.7
|
KLHL7
|
kelch-like family member 7 |
| chr11_+_64002292 | 4.64 |
ENST00000426086.2
|
VEGFB
|
vascular endothelial growth factor B |
| chr6_+_24403144 | 4.56 |
ENST00000274747.7
ENST00000543597.1 ENST00000535061.1 ENST00000378353.1 ENST00000378386.3 ENST00000443868.2 |
MRS2
|
MRS2 magnesium transporter |
| chr18_+_9913977 | 4.56 |
ENST00000400000.2
ENST00000340541.4 |
VAPA
|
VAMP (vesicle-associated membrane protein)-associated protein A, 33kDa |
| chr1_-_54411255 | 4.48 |
ENST00000371377.3
|
HSPB11
|
heat shock protein family B (small), member 11 |
| chr10_+_88854926 | 4.35 |
ENST00000298784.1
ENST00000298786.4 |
FAM35A
|
family with sequence similarity 35, member A |
| chr12_+_56546363 | 4.30 |
ENST00000551834.1
ENST00000552568.1 |
MYL6B
|
myosin, light chain 6B, alkali, smooth muscle and non-muscle |
| chrX_+_40440146 | 4.30 |
ENST00000535539.1
ENST00000378438.4 ENST00000436783.1 ENST00000544975.1 ENST00000535777.1 ENST00000447485.1 ENST00000423649.1 |
ATP6AP2
|
ATPase, H+ transporting, lysosomal accessory protein 2 |
| chr2_+_169312725 | 4.26 |
ENST00000392687.4
|
CERS6
|
ceramide synthase 6 |
| chr20_-_33543546 | 4.24 |
ENST00000216951.2
|
GSS
|
glutathione synthetase |
| chr19_+_42364313 | 4.11 |
ENST00000601492.1
ENST00000600467.1 ENST00000221975.2 |
RPS19
|
ribosomal protein S19 |
| chr20_-_43589109 | 4.06 |
ENST00000372813.3
|
TOMM34
|
translocase of outer mitochondrial membrane 34 |
| chr11_-_108464465 | 4.03 |
ENST00000525344.1
|
EXPH5
|
exophilin 5 |
| chr11_-_3078838 | 3.99 |
ENST00000397111.5
|
CARS
|
cysteinyl-tRNA synthetase |
| chr19_-_39926268 | 3.91 |
ENST00000599705.1
|
RPS16
|
ribosomal protein S16 |
| chr12_+_53895364 | 3.90 |
ENST00000552817.1
ENST00000394357.2 |
TARBP2
|
TAR (HIV-1) RNA binding protein 2 |
| chr12_+_53894672 | 3.89 |
ENST00000266987.2
ENST00000456234.2 |
TARBP2
|
TAR (HIV-1) RNA binding protein 2 |
| chrX_+_152086373 | 3.87 |
ENST00000318529.8
|
ZNF185
|
zinc finger protein 185 (LIM domain) |
| chr18_-_34408693 | 3.83 |
ENST00000587382.1
ENST00000589049.1 ENST00000587129.1 |
TPGS2
|
tubulin polyglutamylase complex subunit 2 |
| chr16_-_15149917 | 3.82 |
ENST00000287706.3
|
NTAN1
|
N-terminal asparagine amidase |
| chr20_-_1373606 | 3.82 |
ENST00000381715.1
ENST00000439640.2 ENST00000381719.3 |
FKBP1A
|
FK506 binding protein 1A, 12kDa |
| chr10_+_70661014 | 3.77 |
ENST00000373585.3
|
DDX50
|
DEAD (Asp-Glu-Ala-Asp) box polypeptide 50 |
| chr11_-_3078616 | 3.75 |
ENST00000401769.3
ENST00000278224.9 ENST00000397114.3 ENST00000380525.4 |
CARS
|
cysteinyl-tRNA synthetase |
| chr22_-_37415475 | 3.73 |
ENST00000403892.3
ENST00000249042.3 ENST00000438203.1 |
TST
|
thiosulfate sulfurtransferase (rhodanese) |
| chr6_+_116692102 | 3.69 |
ENST00000359564.2
|
DSE
|
dermatan sulfate epimerase |
| chr6_-_30709980 | 3.63 |
ENST00000416018.1
ENST00000445853.1 ENST00000413165.1 ENST00000418160.1 |
FLOT1
|
flotillin 1 |
| chr5_+_141348640 | 3.61 |
ENST00000540015.1
ENST00000506938.1 ENST00000394514.2 ENST00000512565.1 ENST00000394515.3 |
RNF14
|
ring finger protein 14 |
| chr17_+_74372662 | 3.59 |
ENST00000591651.1
ENST00000545180.1 |
SPHK1
|
sphingosine kinase 1 |
| chr1_+_32645269 | 3.57 |
ENST00000373610.3
|
TXLNA
|
taxilin alpha |
| chr4_-_129209944 | 3.44 |
ENST00000520121.1
|
PGRMC2
|
progesterone receptor membrane component 2 |
| chr4_+_103422471 | 3.40 |
ENST00000226574.4
ENST00000394820.4 |
NFKB1
|
nuclear factor of kappa light polypeptide gene enhancer in B-cells 1 |
| chr19_+_926000 | 3.33 |
ENST00000263620.3
|
ARID3A
|
AT rich interactive domain 3A (BRIGHT-like) |
| chr7_+_23145366 | 3.24 |
ENST00000339077.5
ENST00000322275.5 ENST00000539124.1 ENST00000542558.1 |
KLHL7
|
kelch-like family member 7 |
| chr1_-_202936394 | 3.15 |
ENST00000367249.4
|
CYB5R1
|
cytochrome b5 reductase 1 |
| chr1_-_10532531 | 3.12 |
ENST00000377036.2
ENST00000377038.3 |
DFFA
|
DNA fragmentation factor, 45kDa, alpha polypeptide |
| chr14_+_24702127 | 3.11 |
ENST00000557854.1
ENST00000348719.7 ENST00000559104.1 ENST00000456667.3 |
GMPR2
|
guanosine monophosphate reductase 2 |
| chr11_+_36397528 | 3.01 |
ENST00000311599.5
ENST00000378867.3 |
PRR5L
|
proline rich 5 like |
| chr13_+_76334567 | 2.87 |
ENST00000321797.8
|
LMO7
|
LIM domain 7 |
| chr13_+_48877895 | 2.86 |
ENST00000267163.4
|
RB1
|
retinoblastoma 1 |
| chr18_-_34409116 | 2.81 |
ENST00000334295.4
|
TPGS2
|
tubulin polyglutamylase complex subunit 2 |
| chr15_+_79165151 | 2.79 |
ENST00000331268.5
|
MORF4L1
|
mortality factor 4 like 1 |
| chr4_-_159644507 | 2.75 |
ENST00000307720.3
|
PPID
|
peptidylprolyl isomerase D |
| chr9_+_119449576 | 2.74 |
ENST00000450136.1
ENST00000373983.2 ENST00000411410.1 |
TRIM32
|
tripartite motif containing 32 |
| chr2_+_169312350 | 2.62 |
ENST00000305747.6
|
CERS6
|
ceramide synthase 6 |
| chr1_-_205744205 | 2.55 |
ENST00000446390.2
|
RAB7L1
|
RAB7, member RAS oncogene family-like 1 |
| chr19_-_6591113 | 2.49 |
ENST00000423145.3
ENST00000245903.3 |
CD70
|
CD70 molecule |
| chr9_-_138853156 | 2.48 |
ENST00000371756.3
|
UBAC1
|
UBA domain containing 1 |
| chr11_-_108464321 | 2.46 |
ENST00000265843.4
|
EXPH5
|
exophilin 5 |
| chr12_+_53895052 | 2.41 |
ENST00000552857.1
|
TARBP2
|
TAR (HIV-1) RNA binding protein 2 |
| chr15_+_79165112 | 2.41 |
ENST00000426013.2
|
MORF4L1
|
mortality factor 4 like 1 |
| chr8_+_22429205 | 2.41 |
ENST00000520207.1
|
SORBS3
|
sorbin and SH3 domain containing 3 |
| chr14_-_50999307 | 2.36 |
ENST00000013125.4
|
MAP4K5
|
mitogen-activated protein kinase kinase kinase kinase 5 |
| chr22_-_22901636 | 2.35 |
ENST00000406503.1
ENST00000439106.1 ENST00000402697.1 ENST00000543184.1 ENST00000398743.2 |
PRAME
|
preferentially expressed antigen in melanoma |
| chr19_-_51504411 | 2.33 |
ENST00000593490.1
|
KLK8
|
kallikrein-related peptidase 8 |
| chr1_-_6453399 | 2.31 |
ENST00000608083.1
|
ACOT7
|
acyl-CoA thioesterase 7 |
| chr16_-_29874462 | 2.30 |
ENST00000566113.1
ENST00000569956.1 ENST00000570016.1 |
CDIPT
|
CDP-diacylglycerol--inositol 3-phosphatidyltransferase |
| chr16_+_2079637 | 2.29 |
ENST00000561844.1
|
SLC9A3R2
|
solute carrier family 9, subfamily A (NHE3, cation proton antiporter 3), member 3 regulator 2 |
| chr1_-_205744574 | 2.27 |
ENST00000367139.3
ENST00000235932.4 ENST00000437324.2 ENST00000414729.1 |
RAB7L1
|
RAB7, member RAS oncogene family-like 1 |
| chr6_+_52285131 | 2.27 |
ENST00000433625.2
|
EFHC1
|
EF-hand domain (C-terminal) containing 1 |
| chr6_+_4776580 | 2.26 |
ENST00000397588.3
|
CDYL
|
chromodomain protein, Y-like |
| chr11_+_64073699 | 2.25 |
ENST00000405666.1
ENST00000468670.1 |
ESRRA
|
estrogen-related receptor alpha |
| chr6_+_52285046 | 2.23 |
ENST00000371068.5
|
EFHC1
|
EF-hand domain (C-terminal) containing 1 |
| chr7_+_140396946 | 2.21 |
ENST00000476470.1
ENST00000471136.1 |
NDUFB2
|
NADH dehydrogenase (ubiquinone) 1 beta subcomplex, 2, 8kDa |
| chr3_-_52804872 | 2.19 |
ENST00000535191.1
ENST00000461689.1 ENST00000383721.4 ENST00000233027.5 |
NEK4
|
NIMA-related kinase 4 |
| chr22_-_39715600 | 2.18 |
ENST00000427905.1
ENST00000402527.1 ENST00000216146.4 |
RPL3
|
ribosomal protein L3 |
| chr7_-_100239132 | 2.13 |
ENST00000223051.3
ENST00000431692.1 |
TFR2
|
transferrin receptor 2 |
| chr6_+_36098262 | 2.06 |
ENST00000373761.6
ENST00000373766.5 |
MAPK13
|
mitogen-activated protein kinase 13 |
| chr6_+_76458990 | 2.05 |
ENST00000369977.3
|
MYO6
|
myosin VI |
| chr22_+_21133469 | 2.05 |
ENST00000406799.1
|
SERPIND1
|
serpin peptidase inhibitor, clade D (heparin cofactor), member 1 |
| chr14_+_64970662 | 2.04 |
ENST00000556965.1
ENST00000554015.1 |
ZBTB1
|
zinc finger and BTB domain containing 1 |
| chr14_+_102228123 | 2.01 |
ENST00000422945.2
ENST00000554442.1 ENST00000556260.2 ENST00000328724.5 ENST00000557268.1 |
PPP2R5C
|
protein phosphatase 2, regulatory subunit B', gamma |
| chr7_+_140396756 | 1.99 |
ENST00000460088.1
ENST00000472695.1 |
NDUFB2
|
NADH dehydrogenase (ubiquinone) 1 beta subcomplex, 2, 8kDa |
| chr7_-_150924121 | 1.96 |
ENST00000441774.1
ENST00000222388.2 ENST00000287844.2 |
ABCF2
|
ATP-binding cassette, sub-family F (GCN20), member 2 |
| chrX_-_48827976 | 1.94 |
ENST00000218176.3
|
KCND1
|
potassium voltage-gated channel, Shal-related subfamily, member 1 |
| chr7_+_140396465 | 1.94 |
ENST00000476279.1
ENST00000247866.4 ENST00000461457.1 ENST00000465506.1 ENST00000204307.5 ENST00000464566.1 |
NDUFB2
|
NADH dehydrogenase (ubiquinone) 1 beta subcomplex, 2, 8kDa |
| chr1_+_27153173 | 1.93 |
ENST00000374142.4
|
ZDHHC18
|
zinc finger, DHHC-type containing 18 |
| chr2_-_242556900 | 1.91 |
ENST00000402545.1
ENST00000402136.1 |
THAP4
|
THAP domain containing 4 |
| chr19_+_2785458 | 1.90 |
ENST00000307741.6
ENST00000585338.1 |
THOP1
|
thimet oligopeptidase 1 |
| chr15_-_89456630 | 1.87 |
ENST00000268150.8
|
MFGE8
|
milk fat globule-EGF factor 8 protein |
| chr5_+_141348721 | 1.87 |
ENST00000507163.1
ENST00000394519.1 |
RNF14
|
ring finger protein 14 |
| chr18_-_34408902 | 1.75 |
ENST00000593035.1
ENST00000383056.3 ENST00000588909.1 ENST00000590337.1 |
TPGS2
|
tubulin polyglutamylase complex subunit 2 |
| chr13_+_38923959 | 1.71 |
ENST00000379649.1
ENST00000239878.4 ENST00000437952.1 ENST00000379641.1 |
UFM1
|
ubiquitin-fold modifier 1 |
| chr2_-_18741882 | 1.71 |
ENST00000381249.3
|
RDH14
|
retinol dehydrogenase 14 (all-trans/9-cis/11-cis) |
| chr16_+_2079501 | 1.66 |
ENST00000563587.1
|
SLC9A3R2
|
solute carrier family 9, subfamily A (NHE3, cation proton antiporter 3), member 3 regulator 2 |
| chr16_-_68000717 | 1.62 |
ENST00000541864.2
|
SLC12A4
|
solute carrier family 12 (potassium/chloride transporter), member 4 |
| chr17_+_73089382 | 1.58 |
ENST00000538213.2
ENST00000584118.1 |
SLC16A5
|
solute carrier family 16 (monocarboxylate transporter), member 5 |
| chr12_+_56546223 | 1.58 |
ENST00000550443.1
ENST00000207437.5 |
MYL6B
|
myosin, light chain 6B, alkali, smooth muscle and non-muscle |
| chr1_-_201438282 | 1.52 |
ENST00000367311.3
ENST00000367309.1 |
PHLDA3
|
pleckstrin homology-like domain, family A, member 3 |
| chr16_-_29874211 | 1.45 |
ENST00000563415.1
|
CDIPT
|
CDP-diacylglycerol--inositol 3-phosphatidyltransferase |
| chr2_+_11295624 | 1.39 |
ENST00000402361.1
ENST00000428481.1 |
PQLC3
|
PQ loop repeat containing 3 |
| chr4_+_671711 | 1.38 |
ENST00000400159.2
|
MYL5
|
myosin, light chain 5, regulatory |
| chrX_+_99899180 | 1.34 |
ENST00000373004.3
|
SRPX2
|
sushi-repeat containing protein, X-linked 2 |
| chrX_-_70474499 | 1.32 |
ENST00000353904.2
|
ZMYM3
|
zinc finger, MYM-type 3 |
| chr3_-_46037299 | 1.28 |
ENST00000296137.2
|
FYCO1
|
FYVE and coiled-coil domain containing 1 |
| chr6_-_111804905 | 1.26 |
ENST00000358835.3
ENST00000435970.1 |
REV3L
|
REV3-like, polymerase (DNA directed), zeta, catalytic subunit |
| chr19_+_49458107 | 1.23 |
ENST00000539787.1
ENST00000345358.7 ENST00000391871.3 ENST00000415969.2 ENST00000354470.3 ENST00000506183.1 ENST00000293288.8 |
BAX
|
BCL2-associated X protein |
| chr10_+_90750493 | 1.18 |
ENST00000357339.2
ENST00000355279.2 |
FAS
|
Fas cell surface death receptor |
| chr14_-_75079026 | 1.18 |
ENST00000261978.4
|
LTBP2
|
latent transforming growth factor beta binding protein 2 |
| chr5_+_141348598 | 1.16 |
ENST00000394520.2
ENST00000347642.3 |
RNF14
|
ring finger protein 14 |
| chr15_-_89456593 | 1.16 |
ENST00000558029.1
ENST00000539437.1 ENST00000542878.1 ENST00000268151.7 ENST00000566497.1 |
MFGE8
|
milk fat globule-EGF factor 8 protein |
| chr2_-_89417335 | 1.15 |
ENST00000490686.1
|
IGKV1-17
|
immunoglobulin kappa variable 1-17 |
| chr8_-_22926526 | 1.08 |
ENST00000347739.3
ENST00000542226.1 |
TNFRSF10B
|
tumor necrosis factor receptor superfamily, member 10b |
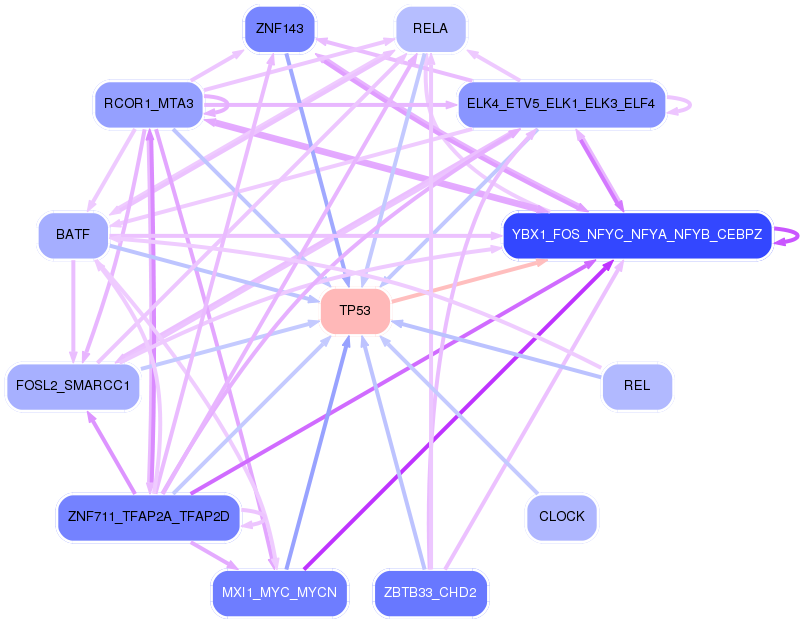
Network of associatons between targets according to the STRING database.

First level regulatory network of TP53
Gene Ontology Analysis
Gene overrepresentation in biological_process category:
| Log-likelihood per target | Total log-likelihood | Term | Description |
|---|---|---|---|
| 10.3 | 41.4 | GO:0016334 | morphogenesis of follicular epithelium(GO:0016333) establishment or maintenance of polarity of follicular epithelium(GO:0016334) establishment of planar polarity of follicular epithelium(GO:0042247) |
| 6.7 | 20.2 | GO:1903609 | negative regulation of peptidyl-tyrosine autophosphorylation(GO:1900085) negative regulation of inward rectifier potassium channel activity(GO:1903609) |
| 5.3 | 15.8 | GO:1901873 | regulation of post-translational protein modification(GO:1901873) |
| 4.8 | 14.4 | GO:0001732 | formation of cytoplasmic translation initiation complex(GO:0001732) |
| 3.9 | 19.4 | GO:0035105 | sterol regulatory element binding protein import into nucleus(GO:0035105) |
| 3.6 | 10.9 | GO:2000097 | chronological cell aging(GO:0001300) regulation of smooth muscle cell-matrix adhesion(GO:2000097) |
| 3.4 | 20.5 | GO:1902766 | skeletal muscle satellite cell migration(GO:1902766) |
| 3.3 | 13.2 | GO:0006272 | leading strand elongation(GO:0006272) |
| 2.6 | 7.8 | GO:0046726 | positive regulation by virus of viral protein levels in host cell(GO:0046726) |
| 2.6 | 7.7 | GO:0006423 | cysteinyl-tRNA aminoacylation(GO:0006423) |
| 2.5 | 10.0 | GO:0060265 | positive regulation of respiratory burst involved in inflammatory response(GO:0060265) |
| 2.4 | 7.2 | GO:0044208 | 'de novo' AMP biosynthetic process(GO:0044208) |
| 2.2 | 25.9 | GO:0022417 | protein maturation by protein folding(GO:0022417) |
| 2.1 | 8.2 | GO:0018364 | peptidyl-glutamine methylation(GO:0018364) |
| 2.0 | 10.0 | GO:0061198 | fungiform papilla formation(GO:0061198) |
| 2.0 | 19.9 | GO:0042373 | vitamin K metabolic process(GO:0042373) |
| 1.9 | 5.8 | GO:1900138 | negative regulation of phospholipase A2 activity(GO:1900138) |
| 1.8 | 7.3 | GO:1900533 | medium-chain fatty-acyl-CoA catabolic process(GO:0036114) long-chain fatty-acyl-CoA catabolic process(GO:0036116) palmitic acid metabolic process(GO:1900533) palmitic acid biosynthetic process(GO:1900535) |
| 1.8 | 8.9 | GO:0042816 | vitamin B6 metabolic process(GO:0042816) |
| 1.8 | 5.3 | GO:0071344 | diphosphate metabolic process(GO:0071344) |
| 1.7 | 10.2 | GO:0035087 | targeting of mRNA for destruction involved in RNA interference(GO:0030423) siRNA loading onto RISC involved in RNA interference(GO:0035087) |
| 1.7 | 11.8 | GO:0070934 | CRD-mediated mRNA stabilization(GO:0070934) |
| 1.7 | 8.4 | GO:0051510 | regulation of unidimensional cell growth(GO:0051510) negative regulation of unidimensional cell growth(GO:0051511) establishment of cell polarity regulating cell shape(GO:0071964) regulation of establishment or maintenance of cell polarity regulating cell shape(GO:2000769) positive regulation of establishment or maintenance of cell polarity regulating cell shape(GO:2000771) regulation of establishment of cell polarity regulating cell shape(GO:2000782) positive regulation of establishment of cell polarity regulating cell shape(GO:2000784) regulation of barbed-end actin filament capping(GO:2000812) positive regulation of barbed-end actin filament capping(GO:2000814) |
| 1.7 | 5.0 | GO:1903371 | regulation of endoplasmic reticulum tubular network organization(GO:1903371) |
| 1.6 | 4.9 | GO:0018406 | protein C-linked glycosylation(GO:0018103) peptidyl-tryptophan modification(GO:0018211) protein C-linked glycosylation via tryptophan(GO:0018317) protein C-linked glycosylation via 2'-alpha-mannosyl-L-tryptophan(GO:0018406) |
| 1.6 | 13.0 | GO:0032020 | ISG15-protein conjugation(GO:0032020) |
| 1.5 | 7.7 | GO:0006620 | posttranslational protein targeting to membrane(GO:0006620) |
| 1.5 | 4.6 | GO:0044828 | negative regulation by host of viral genome replication(GO:0044828) |
| 1.4 | 14.3 | GO:0010918 | positive regulation of mitochondrial membrane potential(GO:0010918) |
| 1.4 | 9.9 | GO:0043987 | histone H3-S10 phosphorylation(GO:0043987) |
| 1.4 | 5.7 | GO:2001271 | negative regulation of cysteine-type endopeptidase activity involved in execution phase of apoptosis(GO:2001271) |
| 1.4 | 15.1 | GO:0002934 | desmosome organization(GO:0002934) |
| 1.3 | 6.6 | GO:0031120 | snRNA pseudouridine synthesis(GO:0031120) |
| 1.3 | 7.9 | GO:0070601 | centromeric sister chromatid cohesion(GO:0070601) |
| 1.3 | 8.9 | GO:0006307 | DNA dealkylation involved in DNA repair(GO:0006307) |
| 1.2 | 3.7 | GO:0035928 | rRNA import into mitochondrion(GO:0035928) |
| 1.2 | 6.1 | GO:0072385 | minus-end-directed organelle transport along microtubule(GO:0072385) |
| 1.2 | 3.6 | GO:0046521 | sphingoid catabolic process(GO:0046521) |
| 1.2 | 12.8 | GO:0090154 | positive regulation of sphingolipid biosynthetic process(GO:0090154) positive regulation of ceramide biosynthetic process(GO:2000304) |
| 1.1 | 19.8 | GO:1990001 | inhibition of cysteine-type endopeptidase activity involved in apoptotic process(GO:1990001) |
| 1.0 | 3.1 | GO:1903625 | negative regulation of DNA catabolic process(GO:1903625) |
| 1.0 | 9.8 | GO:0010917 | negative regulation of mitochondrial membrane potential(GO:0010917) |
| 0.9 | 25.7 | GO:0043968 | histone H2A acetylation(GO:0043968) |
| 0.8 | 16.1 | GO:0034134 | toll-like receptor 2 signaling pathway(GO:0034134) |
| 0.8 | 2.4 | GO:0048385 | retinoic acid receptor signaling pathway(GO:0048384) regulation of retinoic acid receptor signaling pathway(GO:0048385) negative regulation of retinoic acid receptor signaling pathway(GO:0048387) |
| 0.7 | 9.6 | GO:0070986 | left/right axis specification(GO:0070986) |
| 0.7 | 2.8 | GO:0071492 | cellular response to UV-A(GO:0071492) |
| 0.7 | 3.4 | GO:2000630 | negative regulation of calcidiol 1-monooxygenase activity(GO:0010956) positive regulation of miRNA metabolic process(GO:2000630) |
| 0.6 | 10.0 | GO:0008635 | activation of cysteine-type endopeptidase activity involved in apoptotic process by cytochrome c(GO:0008635) |
| 0.6 | 3.6 | GO:0034141 | positive regulation of toll-like receptor 3 signaling pathway(GO:0034141) positive regulation of cell adhesion molecule production(GO:0060355) |
| 0.6 | 6.0 | GO:0071763 | nuclear membrane organization(GO:0071763) |
| 0.6 | 2.9 | GO:0007070 | negative regulation of transcription during mitosis(GO:0007068) negative regulation of transcription from RNA polymerase II promoter during mitosis(GO:0007070) |
| 0.6 | 12.5 | GO:0000028 | ribosomal small subunit assembly(GO:0000028) |
| 0.5 | 2.7 | GO:0030047 | actin modification(GO:0030047) |
| 0.5 | 4.6 | GO:0060754 | positive regulation of mast cell chemotaxis(GO:0060754) |
| 0.5 | 1.5 | GO:0051898 | negative regulation of protein kinase B signaling(GO:0051898) |
| 0.5 | 15.6 | GO:0008334 | histone mRNA metabolic process(GO:0008334) |
| 0.5 | 5.4 | GO:0006564 | L-serine biosynthetic process(GO:0006564) |
| 0.4 | 1.8 | GO:0002572 | pro-T cell differentiation(GO:0002572) |
| 0.4 | 6.9 | GO:0001682 | tRNA 5'-leader removal(GO:0001682) |
| 0.4 | 4.3 | GO:0021903 | rostrocaudal neural tube patterning(GO:0021903) |
| 0.4 | 6.5 | GO:0043248 | proteasome assembly(GO:0043248) |
| 0.4 | 7.0 | GO:0090026 | positive regulation of monocyte chemotaxis(GO:0090026) |
| 0.4 | 11.2 | GO:0031581 | hemidesmosome assembly(GO:0031581) |
| 0.4 | 4.6 | GO:1903830 | magnesium ion transmembrane transport(GO:1903830) |
| 0.4 | 6.9 | GO:0032802 | low-density lipoprotein particle receptor catabolic process(GO:0032802) |
| 0.4 | 6.5 | GO:0071985 | multivesicular body sorting pathway(GO:0071985) |
| 0.4 | 2.1 | GO:0098707 | ferrous iron import into cell(GO:0097460) ferrous iron import across plasma membrane(GO:0098707) |
| 0.3 | 19.8 | GO:0018279 | protein N-linked glycosylation via asparagine(GO:0018279) |
| 0.3 | 5.7 | GO:0051085 | chaperone mediated protein folding requiring cofactor(GO:0051085) |
| 0.3 | 6.5 | GO:0050872 | white fat cell differentiation(GO:0050872) |
| 0.3 | 2.0 | GO:0008218 | bioluminescence(GO:0008218) |
| 0.3 | 2.3 | GO:0031642 | negative regulation of myelination(GO:0031642) |
| 0.3 | 0.9 | GO:1990523 | endothelial cell-cell adhesion(GO:0071603) bone regeneration(GO:1990523) |
| 0.3 | 3.0 | GO:0038203 | TORC2 signaling(GO:0038203) |
| 0.3 | 7.3 | GO:0019054 | modulation by virus of host process(GO:0019054) |
| 0.3 | 1.3 | GO:1901096 | regulation of autophagosome maturation(GO:1901096) positive regulation of autophagosome maturation(GO:1901098) |
| 0.3 | 3.0 | GO:2000427 | positive regulation of apoptotic cell clearance(GO:2000427) |
| 0.2 | 3.7 | GO:0030208 | dermatan sulfate biosynthetic process(GO:0030208) |
| 0.2 | 1.7 | GO:1990564 | protein polyufmylation(GO:1990564) protein K69-linked ufmylation(GO:1990592) |
| 0.2 | 1.0 | GO:0043335 | protein unfolding(GO:0043335) |
| 0.2 | 12.5 | GO:0010501 | RNA secondary structure unwinding(GO:0010501) |
| 0.2 | 0.9 | GO:0086097 | phospholipase C-activating angiotensin-activated signaling pathway(GO:0086097) |
| 0.2 | 3.8 | GO:0046341 | CDP-diacylglycerol metabolic process(GO:0046341) |
| 0.2 | 1.2 | GO:0071455 | cellular response to hyperoxia(GO:0071455) |
| 0.2 | 4.2 | GO:0006750 | glutathione biosynthetic process(GO:0006750) |
| 0.2 | 1.3 | GO:0090050 | positive regulation of cell migration involved in sprouting angiogenesis(GO:0090050) |
| 0.2 | 6.6 | GO:0060765 | regulation of androgen receptor signaling pathway(GO:0060765) |
| 0.2 | 13.4 | GO:0050819 | negative regulation of coagulation(GO:0050819) |
| 0.2 | 0.6 | GO:0090283 | regulation of protein glycosylation in Golgi(GO:0090283) |
| 0.2 | 7.4 | GO:0006370 | 7-methylguanosine mRNA capping(GO:0006370) |
| 0.2 | 5.8 | GO:0097421 | liver regeneration(GO:0097421) |
| 0.2 | 11.3 | GO:0070125 | mitochondrial translational elongation(GO:0070125) mitochondrial translational termination(GO:0070126) |
| 0.2 | 34.2 | GO:0014066 | regulation of phosphatidylinositol 3-kinase signaling(GO:0014066) |
| 0.2 | 2.2 | GO:0001302 | replicative cell aging(GO:0001302) |
| 0.2 | 10.4 | GO:0070059 | intrinsic apoptotic signaling pathway in response to endoplasmic reticulum stress(GO:0070059) |
| 0.1 | 0.8 | GO:0060244 | negative regulation of cell proliferation involved in contact inhibition(GO:0060244) |
| 0.1 | 3.9 | GO:0000462 | maturation of SSU-rRNA from tricistronic rRNA transcript (SSU-rRNA, 5.8S rRNA, LSU-rRNA)(GO:0000462) |
| 0.1 | 0.6 | GO:0045347 | negative regulation of MHC class II biosynthetic process(GO:0045347) |
| 0.1 | 10.4 | GO:0000079 | regulation of cyclin-dependent protein serine/threonine kinase activity(GO:0000079) |
| 0.1 | 3.1 | GO:0043101 | purine-containing compound salvage(GO:0043101) |
| 0.1 | 4.9 | GO:0046513 | ceramide biosynthetic process(GO:0046513) |
| 0.1 | 0.5 | GO:0021759 | globus pallidus development(GO:0021759) |
| 0.1 | 0.3 | GO:1903347 | negative regulation of bicellular tight junction assembly(GO:1903347) |
| 0.1 | 12.2 | GO:0007613 | memory(GO:0007613) |
| 0.1 | 0.6 | GO:0006537 | glutamate biosynthetic process(GO:0006537) |
| 0.1 | 4.5 | GO:0021795 | cerebral cortex cell migration(GO:0021795) |
| 0.1 | 6.5 | GO:0045454 | cell redox homeostasis(GO:0045454) |
| 0.1 | 1.4 | GO:0006488 | dolichol-linked oligosaccharide biosynthetic process(GO:0006488) |
| 0.1 | 12.5 | GO:0007156 | homophilic cell adhesion via plasma membrane adhesion molecules(GO:0007156) |
| 0.1 | 5.9 | GO:0030049 | muscle filament sliding(GO:0030049) actin-myosin filament sliding(GO:0033275) |
| 0.1 | 2.2 | GO:0000027 | ribosomal large subunit assembly(GO:0000027) |
| 0.1 | 0.7 | GO:0015937 | coenzyme A biosynthetic process(GO:0015937) |
| 0.1 | 1.3 | GO:0042276 | error-prone translesion synthesis(GO:0042276) |
| 0.1 | 1.0 | GO:0036010 | protein localization to endosome(GO:0036010) |
| 0.1 | 1.7 | GO:0042572 | retinol metabolic process(GO:0042572) |
| 0.0 | 11.3 | GO:0006888 | ER to Golgi vesicle-mediated transport(GO:0006888) |
| 0.0 | 5.5 | GO:0006613 | cotranslational protein targeting to membrane(GO:0006613) |
| 0.0 | 2.9 | GO:0032755 | positive regulation of interleukin-6 production(GO:0032755) |
| 0.0 | 2.4 | GO:0051496 | positive regulation of stress fiber assembly(GO:0051496) |
| 0.0 | 1.4 | GO:0006937 | regulation of muscle contraction(GO:0006937) |
| 0.0 | 0.3 | GO:0045116 | protein neddylation(GO:0045116) |
| 0.0 | 1.6 | GO:0016126 | sterol biosynthetic process(GO:0016126) |
| 0.0 | 2.0 | GO:0007605 | sensory perception of sound(GO:0007605) |
Gene overrepresentation in cellular_component category:
| Log-likelihood per target | Total log-likelihood | Term | Description |
|---|---|---|---|
| 8.3 | 41.4 | GO:0042643 | actomyosin, actin portion(GO:0042643) |
| 5.2 | 25.9 | GO:1990425 | ryanodine receptor complex(GO:1990425) |
| 4.4 | 13.2 | GO:0070557 | PCNA-p21 complex(GO:0070557) |
| 3.6 | 32.3 | GO:0005638 | lamin filament(GO:0005638) |
| 3.2 | 16.1 | GO:0045323 | interleukin-1 receptor complex(GO:0045323) |
| 2.5 | 19.8 | GO:0032133 | chromosome passenger complex(GO:0032133) |
| 2.0 | 11.8 | GO:0071204 | histone pre-mRNA 3'end processing complex(GO:0071204) |
| 2.0 | 15.6 | GO:0034715 | U7 snRNP(GO:0005683) pICln-Sm protein complex(GO:0034715) |
| 1.7 | 6.9 | GO:0071001 | U4/U6 snRNP(GO:0071001) |
| 1.6 | 14.4 | GO:0071541 | eukaryotic translation initiation factor 3 complex, eIF3m(GO:0071541) |
| 1.5 | 35.7 | GO:0016580 | Sin3 complex(GO:0016580) |
| 1.4 | 20.2 | GO:0034098 | VCP-NPL4-UFD1 AAA ATPase complex(GO:0034098) |
| 1.4 | 11.2 | GO:0005610 | laminin-5 complex(GO:0005610) |
| 1.1 | 10.2 | GO:0035068 | micro-ribonucleoprotein complex(GO:0035068) |
| 1.1 | 7.9 | GO:0031415 | NatA complex(GO:0031415) |
| 1.1 | 6.6 | GO:0090661 | box H/ACA snoRNP complex(GO:0031429) box H/ACA RNP complex(GO:0072588) box H/ACA scaRNP complex(GO:0072589) box H/ACA telomerase RNP complex(GO:0090661) |
| 1.0 | 6.9 | GO:0000172 | ribonuclease MRP complex(GO:0000172) |
| 1.0 | 2.9 | GO:0035189 | Rb-E2F complex(GO:0035189) |
| 0.8 | 15.8 | GO:0034663 | endoplasmic reticulum chaperone complex(GO:0034663) |
| 0.7 | 10.4 | GO:0035631 | CD40 receptor complex(GO:0035631) |
| 0.7 | 7.9 | GO:0016461 | unconventional myosin complex(GO:0016461) |
| 0.7 | 2.7 | GO:0005863 | striated muscle myosin thick filament(GO:0005863) |
| 0.6 | 6.5 | GO:0008541 | proteasome regulatory particle, lid subcomplex(GO:0008541) |
| 0.6 | 20.5 | GO:0032420 | stereocilium(GO:0032420) |
| 0.5 | 3.1 | GO:1902560 | GMP reductase complex(GO:1902560) |
| 0.5 | 6.1 | GO:0005642 | annulate lamellae(GO:0005642) |
| 0.5 | 16.8 | GO:0030057 | desmosome(GO:0030057) |
| 0.5 | 6.5 | GO:0097470 | ribbon synapse(GO:0097470) |
| 0.5 | 9.6 | GO:0030992 | intraciliary transport particle B(GO:0030992) |
| 0.4 | 7.4 | GO:0005736 | DNA-directed RNA polymerase I complex(GO:0005736) |
| 0.4 | 6.9 | GO:0036020 | endolysosome membrane(GO:0036020) |
| 0.4 | 26.4 | GO:0022627 | cytosolic small ribosomal subunit(GO:0022627) |
| 0.3 | 3.4 | GO:0033256 | I-kappaB/NF-kappaB complex(GO:0033256) |
| 0.3 | 11.3 | GO:0000315 | organellar large ribosomal subunit(GO:0000315) mitochondrial large ribosomal subunit(GO:0005762) |
| 0.3 | 3.6 | GO:0016600 | flotillin complex(GO:0016600) |
| 0.2 | 19.8 | GO:0033116 | endoplasmic reticulum-Golgi intermediate compartment membrane(GO:0033116) |
| 0.2 | 4.0 | GO:0044453 | integral component of nuclear inner membrane(GO:0005639) intrinsic component of nuclear inner membrane(GO:0031229) nuclear membrane part(GO:0044453) |
| 0.2 | 4.6 | GO:0070971 | endoplasmic reticulum exit site(GO:0070971) |
| 0.2 | 12.5 | GO:0031463 | Cul3-RING ubiquitin ligase complex(GO:0031463) |
| 0.2 | 6.8 | GO:0031258 | lamellipodium membrane(GO:0031258) |
| 0.2 | 3.0 | GO:0031932 | TORC2 complex(GO:0031932) |
| 0.2 | 15.5 | GO:0005791 | rough endoplasmic reticulum(GO:0005791) |
| 0.2 | 2.1 | GO:1990712 | HFE-transferrin receptor complex(GO:1990712) |
| 0.2 | 2.0 | GO:0043190 | ATP-binding cassette (ABC) transporter complex(GO:0043190) |
| 0.2 | 8.8 | GO:0005793 | endoplasmic reticulum-Golgi intermediate compartment(GO:0005793) |
| 0.1 | 0.6 | GO:0005797 | Golgi medial cisterna(GO:0005797) |
| 0.1 | 8.3 | GO:0032592 | integral component of mitochondrial membrane(GO:0032592) |
| 0.1 | 3.1 | GO:0031092 | platelet alpha granule membrane(GO:0031092) |
| 0.1 | 12.3 | GO:0005643 | nuclear pore(GO:0005643) |
| 0.1 | 1.2 | GO:0097136 | Bcl-2 family protein complex(GO:0097136) |
| 0.1 | 11.9 | GO:0031093 | platelet alpha granule lumen(GO:0031093) |
| 0.1 | 1.3 | GO:0042575 | DNA polymerase complex(GO:0042575) |
| 0.1 | 4.1 | GO:0005637 | nuclear inner membrane(GO:0005637) |
| 0.1 | 1.3 | GO:0005832 | chaperonin-containing T-complex(GO:0005832) |
| 0.1 | 40.3 | GO:0005925 | focal adhesion(GO:0005925) |
| 0.1 | 1.2 | GO:0031265 | CD95 death-inducing signaling complex(GO:0031265) |
| 0.1 | 4.5 | GO:0072686 | mitotic spindle(GO:0072686) |
| 0.1 | 3.8 | GO:0101003 | ficolin-1-rich granule membrane(GO:0101003) |
| 0.1 | 6.8 | GO:0031902 | late endosome membrane(GO:0031902) |
| 0.0 | 2.3 | GO:0045171 | intercellular bridge(GO:0045171) |
| 0.0 | 1.0 | GO:0071682 | endocytic vesicle lumen(GO:0071682) |
| 0.0 | 6.9 | GO:0005741 | mitochondrial outer membrane(GO:0005741) |
| 0.0 | 3.1 | GO:0005811 | lipid particle(GO:0005811) |
| 0.0 | 1.4 | GO:0005859 | muscle myosin complex(GO:0005859) |
| 0.0 | 8.0 | GO:0000151 | ubiquitin ligase complex(GO:0000151) |
| 0.0 | 9.0 | GO:0005819 | spindle(GO:0005819) |
| 0.0 | 26.1 | GO:0005789 | endoplasmic reticulum membrane(GO:0005789) |
| 0.0 | 0.5 | GO:0043194 | axon initial segment(GO:0043194) |
| 0.0 | 1.9 | GO:0001669 | acrosomal vesicle(GO:0001669) |
| 0.0 | 1.9 | GO:0005758 | mitochondrial intermembrane space(GO:0005758) |
| 0.0 | 1.9 | GO:0034705 | voltage-gated potassium channel complex(GO:0008076) potassium channel complex(GO:0034705) |
| 0.0 | 10.9 | GO:0009986 | cell surface(GO:0009986) |
| 0.0 | 1.2 | GO:0000775 | chromosome, centromeric region(GO:0000775) |
| 0.0 | 1.1 | GO:0072562 | blood microparticle(GO:0072562) |
Gene overrepresentation in molecular_function category:
| Log-likelihood per target | Total log-likelihood | Term | Description |
|---|---|---|---|
| 6.7 | 20.2 | GO:0070320 | inward rectifier potassium channel inhibitor activity(GO:0070320) |
| 5.0 | 19.9 | GO:0016900 | oxidoreductase activity, acting on the CH-OH group of donors, disulfide as acceptor(GO:0016900) vitamin-K-epoxide reductase (warfarin-sensitive) activity(GO:0047057) |
| 3.3 | 13.2 | GO:0030337 | DNA polymerase processivity factor activity(GO:0030337) |
| 2.8 | 14.0 | GO:0043120 | tumor necrosis factor binding(GO:0043120) |
| 2.7 | 10.7 | GO:0031493 | nucleosomal histone binding(GO:0031493) |
| 2.6 | 7.7 | GO:0004817 | cysteine-tRNA ligase activity(GO:0004817) |
| 2.3 | 16.1 | GO:0004704 | NF-kappaB-inducing kinase activity(GO:0004704) |
| 2.2 | 13.0 | GO:0042296 | ISG15 transferase activity(GO:0042296) |
| 1.9 | 25.9 | GO:0034713 | type I transforming growth factor beta receptor binding(GO:0034713) |
| 1.6 | 15.6 | GO:1990446 | U1 snRNP binding(GO:1990446) |
| 1.5 | 4.6 | GO:0033149 | FFAT motif binding(GO:0033149) |
| 1.3 | 5.3 | GO:0004427 | inorganic diphosphatase activity(GO:0004427) |
| 1.3 | 3.8 | GO:0003881 | CDP-diacylglycerol-inositol 3-phosphatidyltransferase activity(GO:0003881) |
| 1.2 | 3.7 | GO:0047757 | chondroitin-glucuronate 5-epimerase activity(GO:0047757) |
| 1.1 | 6.9 | GO:0050291 | sphingosine N-acyltransferase activity(GO:0050291) |
| 1.1 | 11.4 | GO:0031730 | CCR5 chemokine receptor binding(GO:0031730) |
| 1.1 | 10.2 | GO:0070883 | pre-miRNA binding(GO:0070883) |
| 1.1 | 8.9 | GO:0043140 | ATP-dependent 3'-5' DNA helicase activity(GO:0043140) |
| 1.1 | 6.6 | GO:0034513 | box H/ACA snoRNA binding(GO:0034513) |
| 1.1 | 5.4 | GO:0004647 | phosphoserine phosphatase activity(GO:0004647) |
| 1.0 | 6.9 | GO:0030621 | U4 snRNA binding(GO:0030621) |
| 0.9 | 6.5 | GO:0030267 | hydroxypyruvate reductase activity(GO:0016618) glyoxylate reductase (NADP) activity(GO:0030267) |
| 0.8 | 4.6 | GO:0043183 | vascular endothelial growth factor receptor 1 binding(GO:0043183) |
| 0.7 | 12.5 | GO:0008494 | translation activator activity(GO:0008494) |
| 0.7 | 7.3 | GO:0036042 | long-chain fatty acyl-CoA binding(GO:0036042) |
| 0.7 | 2.9 | GO:0061676 | importin-alpha family protein binding(GO:0061676) |
| 0.7 | 10.0 | GO:0031078 | histone deacetylase activity (H3-K14 specific)(GO:0031078) NAD-dependent histone deacetylase activity (H3-K14 specific)(GO:0032041) |
| 0.7 | 14.4 | GO:0000339 | RNA cap binding(GO:0000339) |
| 0.6 | 3.7 | GO:0004792 | thiosulfate sulfurtransferase activity(GO:0004792) |
| 0.6 | 7.9 | GO:0004596 | peptide alpha-N-acetyltransferase activity(GO:0004596) |
| 0.6 | 3.6 | GO:0008481 | sphinganine kinase activity(GO:0008481) D-erythro-sphingosine kinase activity(GO:0017050) |
| 0.6 | 7.2 | GO:0042301 | phosphate ion binding(GO:0042301) |
| 0.5 | 2.1 | GO:0004998 | transferrin receptor activity(GO:0004998) |
| 0.5 | 3.1 | GO:0016657 | GMP reductase activity(GO:0003920) oxidoreductase activity, acting on NAD(P)H, nitrogenous group as acceptor(GO:0016657) |
| 0.5 | 6.1 | GO:0034452 | dynactin binding(GO:0034452) |
| 0.4 | 14.3 | GO:0005123 | death receptor binding(GO:0005123) |
| 0.4 | 6.9 | GO:0004526 | ribonuclease P activity(GO:0004526) |
| 0.4 | 19.8 | GO:0008536 | Ran GTPase binding(GO:0008536) |
| 0.4 | 7.4 | GO:0001054 | RNA polymerase I activity(GO:0001054) |
| 0.4 | 2.4 | GO:0042974 | retinoic acid receptor binding(GO:0042974) |
| 0.3 | 7.2 | GO:0003756 | protein disulfide isomerase activity(GO:0003756) intramolecular oxidoreductase activity, transposing S-S bonds(GO:0016864) |
| 0.3 | 4.6 | GO:0015095 | magnesium ion transmembrane transporter activity(GO:0015095) |
| 0.3 | 6.9 | GO:0098748 | clathrin adaptor activity(GO:0035615) endocytic adaptor activity(GO:0098748) |
| 0.3 | 4.2 | GO:0016594 | glycine binding(GO:0016594) |
| 0.3 | 7.3 | GO:0008139 | nuclear localization sequence binding(GO:0008139) |
| 0.3 | 10.0 | GO:0017134 | fibroblast growth factor binding(GO:0017134) |
| 0.3 | 0.9 | GO:0001596 | angiotensin type I receptor activity(GO:0001596) |
| 0.3 | 7.8 | GO:0008157 | protein phosphatase 1 binding(GO:0008157) |
| 0.3 | 2.2 | GO:0008097 | 5S rRNA binding(GO:0008097) |
| 0.3 | 5.0 | GO:0017056 | structural constituent of nuclear pore(GO:0017056) |
| 0.3 | 3.1 | GO:0004128 | cytochrome-b5 reductase activity, acting on NAD(P)H(GO:0004128) |
| 0.3 | 4.9 | GO:0000030 | mannosyltransferase activity(GO:0000030) |
| 0.3 | 15.8 | GO:0070063 | RNA polymerase binding(GO:0070063) |
| 0.3 | 61.5 | GO:0051015 | actin filament binding(GO:0051015) |
| 0.2 | 1.7 | GO:0052650 | NADP-retinol dehydrogenase activity(GO:0052650) |
| 0.2 | 1.9 | GO:0005250 | A-type (transient outward) potassium channel activity(GO:0005250) |
| 0.2 | 3.0 | GO:0008429 | phosphatidylethanolamine binding(GO:0008429) |
| 0.2 | 5.7 | GO:0030296 | protein tyrosine kinase activator activity(GO:0030296) |
| 0.2 | 6.9 | GO:0031624 | ubiquitin conjugating enzyme binding(GO:0031624) |
| 0.2 | 2.8 | GO:0016018 | cyclosporin A binding(GO:0016018) |
| 0.2 | 2.7 | GO:0030957 | Tat protein binding(GO:0030957) |
| 0.2 | 12.5 | GO:0004004 | ATP-dependent RNA helicase activity(GO:0004004) |
| 0.2 | 7.7 | GO:0043022 | ribosome binding(GO:0043022) |
| 0.2 | 0.7 | GO:0004594 | pantothenate kinase activity(GO:0004594) |
| 0.2 | 26.5 | GO:0047485 | protein N-terminus binding(GO:0047485) |
| 0.2 | 0.6 | GO:0016639 | oxidoreductase activity, acting on the CH-NH2 group of donors, NAD or NADP as acceptor(GO:0016639) |
| 0.2 | 1.5 | GO:0010314 | phosphatidylinositol-5-phosphate binding(GO:0010314) |
| 0.1 | 7.3 | GO:0008307 | structural constituent of muscle(GO:0008307) |
| 0.1 | 0.9 | GO:0017077 | oxidative phosphorylation uncoupler activity(GO:0017077) |
| 0.1 | 2.4 | GO:0017166 | vinculin binding(GO:0017166) |
| 0.1 | 4.4 | GO:0044183 | protein binding involved in protein folding(GO:0044183) |
| 0.1 | 12.9 | GO:0004867 | serine-type endopeptidase inhibitor activity(GO:0004867) |
| 0.1 | 3.6 | GO:0035255 | ionotropic glutamate receptor binding(GO:0035255) |
| 0.1 | 1.2 | GO:0051434 | BH3 domain binding(GO:0051434) |
| 0.1 | 10.5 | GO:0016811 | hydrolase activity, acting on carbon-nitrogen (but not peptide) bonds, in linear amides(GO:0016811) |
| 0.1 | 1.0 | GO:0030911 | TPR domain binding(GO:0030911) |
| 0.1 | 2.2 | GO:0008483 | transaminase activity(GO:0008483) |
| 0.1 | 1.8 | GO:0070530 | K63-linked polyubiquitin binding(GO:0070530) |
| 0.1 | 11.8 | GO:0003697 | single-stranded DNA binding(GO:0003697) |
| 0.1 | 3.4 | GO:0042805 | actinin binding(GO:0042805) |
| 0.1 | 4.6 | GO:0043621 | protein self-association(GO:0043621) |
| 0.1 | 15.2 | GO:0003735 | structural constituent of ribosome(GO:0003735) |
| 0.1 | 3.8 | GO:0042379 | chemokine receptor binding(GO:0042379) |
| 0.1 | 0.6 | GO:0051525 | NFAT protein binding(GO:0051525) |
| 0.1 | 2.5 | GO:0005164 | tumor necrosis factor receptor binding(GO:0005164) |
| 0.1 | 5.7 | GO:0051082 | unfolded protein binding(GO:0051082) |
| 0.1 | 3.6 | GO:0019905 | syntaxin binding(GO:0019905) |
| 0.0 | 0.5 | GO:0001161 | intronic transcription regulatory region sequence-specific DNA binding(GO:0001161) intronic transcription regulatory region DNA binding(GO:0044213) |
| 0.0 | 1.0 | GO:0070300 | phosphatidic acid binding(GO:0070300) |
| 0.0 | 1.3 | GO:0003887 | DNA-directed DNA polymerase activity(GO:0003887) |
| 0.0 | 0.9 | GO:0005112 | Notch binding(GO:0005112) |
| 0.0 | 3.9 | GO:0032947 | protein complex scaffold(GO:0032947) |
| 0.0 | 3.4 | GO:0008276 | protein methyltransferase activity(GO:0008276) |
| 0.0 | 24.4 | GO:0005509 | calcium ion binding(GO:0005509) |
| 0.0 | 12.9 | GO:0005198 | structural molecule activity(GO:0005198) |
| 0.0 | 9.2 | GO:0003924 | GTPase activity(GO:0003924) |
| 0.0 | 1.6 | GO:0008028 | monocarboxylic acid transmembrane transporter activity(GO:0008028) |
| 0.0 | 3.4 | GO:0020037 | heme binding(GO:0020037) |
| 0.0 | 2.0 | GO:0019888 | protein phosphatase regulator activity(GO:0019888) |
| 0.0 | 1.9 | GO:0004222 | metalloendopeptidase activity(GO:0004222) |
| 0.0 | 2.2 | GO:0001078 | transcriptional repressor activity, RNA polymerase II core promoter proximal region sequence-specific binding(GO:0001078) |
Gene overrepresentation in C2:CP category:
| Log-likelihood per target | Total log-likelihood | Term | Description |
|---|---|---|---|
| 1.4 | 25.9 | PID ALK2 PATHWAY | ALK2 signaling events |
| 0.7 | 72.5 | PID CASPASE PATHWAY | Caspase cascade in apoptosis |
| 0.7 | 20.2 | PID ALK1 PATHWAY | ALK1 signaling events |
| 0.6 | 20.5 | PID PRL SIGNALING EVENTS PATHWAY | Signaling events mediated by PRL |
| 0.5 | 16.1 | PID TOLL ENDOGENOUS PATHWAY | Endogenous TLR signaling |
| 0.5 | 11.2 | PID INTEGRIN4 PATHWAY | Alpha6 beta4 integrin-ligand interactions |
| 0.4 | 9.6 | SA FAS SIGNALING | The TNF-type receptor Fas induces apoptosis on ligand binding. |
| 0.3 | 19.8 | PID AURORA B PATHWAY | Aurora B signaling |
| 0.3 | 65.0 | PID P53 DOWNSTREAM PATHWAY | Direct p53 effectors |
| 0.3 | 8.3 | PID NFKAPPAB ATYPICAL PATHWAY | Atypical NF-kappaB pathway |
| 0.3 | 6.9 | PID ARF 3PATHWAY | Arf1 pathway |
| 0.2 | 4.3 | PID VEGF VEGFR PATHWAY | VEGF and VEGFR signaling network |
| 0.2 | 12.8 | PID SYNDECAN 1 PATHWAY | Syndecan-1-mediated signaling events |
| 0.2 | 2.9 | PID P38 GAMMA DELTA PATHWAY | Signaling mediated by p38-gamma and p38-delta |
| 0.1 | 3.6 | PID S1P S1P1 PATHWAY | S1P1 pathway |
| 0.1 | 4.3 | PID WNT SIGNALING PATHWAY | Wnt signaling network |
| 0.1 | 11.8 | PID PTP1B PATHWAY | Signaling events mediated by PTP1B |
| 0.1 | 5.8 | SIG REGULATION OF THE ACTIN CYTOSKELETON BY RHO GTPASES | Genes related to regulation of the actin cytoskeleton |
| 0.1 | 4.0 | PID AVB3 INTEGRIN PATHWAY | Integrins in angiogenesis |
| 0.1 | 3.6 | SIG PIP3 SIGNALING IN B LYMPHOCYTES | Genes related to PIP3 signaling in B lymphocytes |
| 0.1 | 2.7 | PID LYSOPHOSPHOLIPID PATHWAY | LPA receptor mediated events |
| 0.0 | 2.0 | PID ECADHERIN STABILIZATION PATHWAY | Stabilization and expansion of the E-cadherin adherens junction |
| 0.0 | 0.9 | PID ARF6 PATHWAY | Arf6 signaling events |
| 0.0 | 3.4 | NABA ECM GLYCOPROTEINS | Genes encoding structural ECM glycoproteins |
| 0.0 | 0.8 | PID HNF3B PATHWAY | FOXA2 and FOXA3 transcription factor networks |
Gene overrepresentation in C2:CP:REACTOME category:
| Log-likelihood per target | Total log-likelihood | Term | Description |
|---|---|---|---|
| 1.3 | 16.1 | REACTOME IRAK1 RECRUITS IKK COMPLEX | Genes involved in IRAK1 recruits IKK complex |
| 1.3 | 19.9 | REACTOME GAMMA CARBOXYLATION TRANSPORT AND AMINO TERMINAL CLEAVAGE OF PROTEINS | Genes involved in Gamma-carboxylation, transport, and amino-terminal cleavage of proteins |
| 1.1 | 13.2 | REACTOME REMOVAL OF THE FLAP INTERMEDIATE FROM THE C STRAND | Genes involved in Removal of the Flap Intermediate from the C-strand |
| 1.1 | 25.9 | REACTOME TGF BETA RECEPTOR SIGNALING IN EMT EPITHELIAL TO MESENCHYMAL TRANSITION | Genes involved in TGF-beta receptor signaling in EMT (epithelial to mesenchymal transition) |
| 1.0 | 15.6 | REACTOME SLBP DEPENDENT PROCESSING OF REPLICATION DEPENDENT HISTONE PRE MRNAS | Genes involved in SLBP Dependent Processing of Replication-Dependent Histone Pre-mRNAs |
| 0.9 | 23.3 | REACTOME ACTIVATION OF BH3 ONLY PROTEINS | Genes involved in Activation of BH3-only proteins |
| 0.8 | 24.4 | REACTOME EXTRINSIC PATHWAY FOR APOPTOSIS | Genes involved in Extrinsic Pathway for Apoptosis |
| 0.7 | 21.2 | REACTOME ENOS ACTIVATION AND REGULATION | Genes involved in eNOS activation and regulation |
| 0.6 | 17.6 | REACTOME MICRORNA MIRNA BIOGENESIS | Genes involved in MicroRNA (miRNA) Biogenesis |
| 0.6 | 8.9 | REACTOME GAP JUNCTION DEGRADATION | Genes involved in Gap junction degradation |
| 0.5 | 15.0 | REACTOME AMINO ACID SYNTHESIS AND INTERCONVERSION TRANSAMINATION | Genes involved in Amino acid synthesis and interconversion (transamination) |
| 0.5 | 14.9 | REACTOME SEMA3A PAK DEPENDENT AXON REPULSION | Genes involved in Sema3A PAK dependent Axon repulsion |
| 0.5 | 20.8 | REACTOME SEMA4D INDUCED CELL MIGRATION AND GROWTH CONE COLLAPSE | Genes involved in Sema4D induced cell migration and growth-cone collapse |
| 0.5 | 13.0 | REACTOME CONVERSION FROM APC C CDC20 TO APC C CDH1 IN LATE ANAPHASE | Genes involved in Conversion from APC/C:Cdc20 to APC/C:Cdh1 in late anaphase |
| 0.4 | 7.2 | REACTOME PURINE RIBONUCLEOSIDE MONOPHOSPHATE BIOSYNTHESIS | Genes involved in Purine ribonucleoside monophosphate biosynthesis |
| 0.4 | 28.3 | REACTOME FORMATION OF THE TERNARY COMPLEX AND SUBSEQUENTLY THE 43S COMPLEX | Genes involved in Formation of the ternary complex, and subsequently, the 43S complex |
| 0.4 | 10.0 | REACTOME INTRINSIC PATHWAY FOR APOPTOSIS | Genes involved in Intrinsic Pathway for Apoptosis |
| 0.4 | 13.1 | REACTOME CYTOSOLIC TRNA AMINOACYLATION | Genes involved in Cytosolic tRNA aminoacylation |
| 0.4 | 2.9 | REACTOME INHIBITION OF REPLICATION INITIATION OF DAMAGED DNA BY RB1 E2F1 | Genes involved in Inhibition of replication initiation of damaged DNA by RB1/E2F1 |
| 0.3 | 48.9 | REACTOME RESPONSE TO ELEVATED PLATELET CYTOSOLIC CA2 | Genes involved in Response to elevated platelet cytosolic Ca2+ |
| 0.3 | 18.2 | REACTOME TRANSPORT TO THE GOLGI AND SUBSEQUENT MODIFICATION | Genes involved in Transport to the Golgi and subsequent modification |
| 0.2 | 19.4 | REACTOME APOPTOTIC CLEAVAGE OF CELLULAR PROTEINS | Genes involved in Apoptotic cleavage of cellular proteins |
| 0.2 | 15.8 | REACTOME COLLAGEN FORMATION | Genes involved in Collagen formation |
| 0.2 | 21.8 | REACTOME MITOTIC PROMETAPHASE | Genes involved in Mitotic Prometaphase |
| 0.2 | 3.1 | REACTOME APOPTOSIS INDUCED DNA FRAGMENTATION | Genes involved in Apoptosis induced DNA fragmentation |
| 0.2 | 14.2 | REACTOME ER PHAGOSOME PATHWAY | Genes involved in ER-Phagosome pathway |
| 0.1 | 4.9 | REACTOME SPHINGOLIPID DE NOVO BIOSYNTHESIS | Genes involved in Sphingolipid de novo biosynthesis |
| 0.1 | 3.1 | REACTOME PURINE SALVAGE | Genes involved in Purine salvage |
| 0.1 | 4.2 | REACTOME GLUTATHIONE CONJUGATION | Genes involved in Glutathione conjugation |
| 0.1 | 3.7 | REACTOME SULFUR AMINO ACID METABOLISM | Genes involved in Sulfur amino acid metabolism |
| 0.1 | 10.0 | REACTOME P75 NTR RECEPTOR MEDIATED SIGNALLING | Genes involved in p75 NTR receptor-mediated signalling |
| 0.1 | 4.6 | REACTOME SMOOTH MUSCLE CONTRACTION | Genes involved in Smooth Muscle Contraction |
| 0.1 | 11.2 | REACTOME MRNA SPLICING | Genes involved in mRNA Splicing |
| 0.1 | 7.3 | REACTOME ANTIVIRAL MECHANISM BY IFN STIMULATED GENES | Genes involved in Antiviral mechanism by IFN-stimulated genes |
| 0.1 | 4.1 | REACTOME SIGNAL TRANSDUCTION BY L1 | Genes involved in Signal transduction by L1 |
| 0.1 | 8.4 | REACTOME CELL JUNCTION ORGANIZATION | Genes involved in Cell junction organization |
| 0.1 | 7.6 | REACTOME SRP DEPENDENT COTRANSLATIONAL PROTEIN TARGETING TO MEMBRANE | Genes involved in SRP-dependent cotranslational protein targeting to membrane |
| 0.1 | 3.7 | REACTOME CHONDROITIN SULFATE DERMATAN SULFATE METABOLISM | Genes involved in Chondroitin sulfate/dermatan sulfate metabolism |
| 0.1 | 0.7 | REACTOME VITAMIN B5 PANTOTHENATE METABOLISM | Genes involved in Vitamin B5 (pantothenate) metabolism |
| 0.0 | 1.9 | REACTOME VOLTAGE GATED POTASSIUM CHANNELS | Genes involved in Voltage gated Potassium channels |
| 0.0 | 2.2 | REACTOME PPARA ACTIVATES GENE EXPRESSION | Genes involved in PPARA Activates Gene Expression |
| 0.0 | 0.5 | REACTOME INTERACTION BETWEEN L1 AND ANKYRINS | Genes involved in Interaction between L1 and Ankyrins |
| 0.0 | 0.8 | REACTOME MITOCHONDRIAL PROTEIN IMPORT | Genes involved in Mitochondrial Protein Import |