Project
GNF SymAtlas + NCI-60 cancer cell lines, comparison of cancers vs non-cancers, human (Su, 2004; Ross, 2000)
Navigation
Downloads
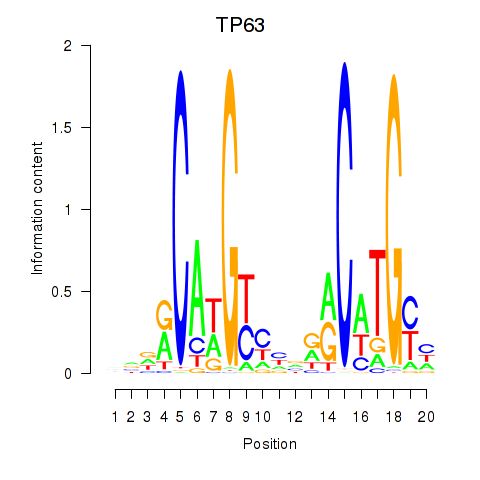
Results for TP63
Z-value: 0.63
Motif logo
Transcription factors associated with TP63
| Gene Symbol | Gene ID | Gene Info |
|---|---|---|
|
TP63
|
ENSG00000073282.8 | tumor protein p63 |
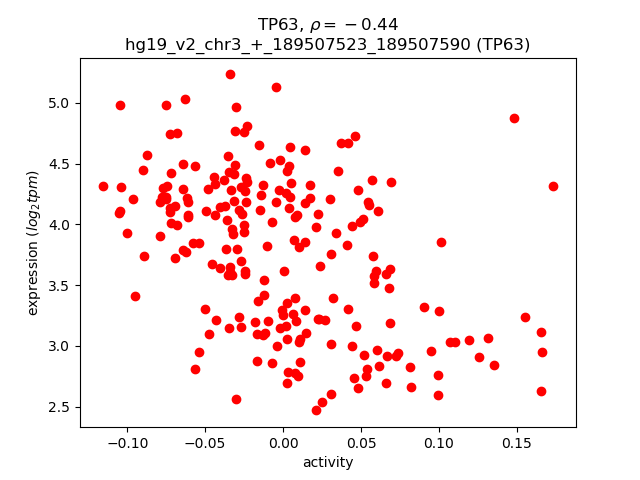
Activity-expression correlation:
| Gene | Promoter | Pearson corr. coef. | P-value | Plot |
|---|---|---|---|---|
| TP63 | hg19_v2_chr3_+_189507523_189507590 | -0.44 | 1.5e-11 | Click! |
Activity profile of TP63 motif
Sorted Z-values of TP63 motif
| Promoter | Log-likelihood | Transcript | Gene | Gene Info |
|---|---|---|---|---|
| chr15_-_63448973 | 30.03 |
ENST00000462430.1
|
RPS27L
|
ribosomal protein S27-like |
| chr12_-_122712038 | 30.02 |
ENST00000413918.1
ENST00000443649.3 |
DIABLO
|
diablo, IAP-binding mitochondrial protein |
| chr6_-_30712313 | 28.21 |
ENST00000376377.2
ENST00000259874.5 |
IER3
|
immediate early response 3 |
| chrX_-_153602991 | 23.39 |
ENST00000369850.3
ENST00000422373.1 |
FLNA
|
filamin A, alpha |
| chr2_-_151344172 | 22.35 |
ENST00000375734.2
ENST00000263895.4 ENST00000454202.1 |
RND3
|
Rho family GTPase 3 |
| chr1_+_236558694 | 22.34 |
ENST00000359362.5
|
EDARADD
|
EDAR-associated death domain |
| chr12_-_15942503 | 21.71 |
ENST00000281172.5
|
EPS8
|
epidermal growth factor receptor pathway substrate 8 |
| chr5_+_162864575 | 21.47 |
ENST00000512163.1
ENST00000393929.1 ENST00000340828.2 ENST00000511683.2 ENST00000510097.1 ENST00000511490.2 ENST00000510664.1 |
CCNG1
|
cyclin G1 |
| chr17_+_49230897 | 18.86 |
ENST00000393196.3
ENST00000336097.3 ENST00000480143.1 ENST00000511355.1 ENST00000013034.3 ENST00000393198.3 ENST00000608447.1 ENST00000393193.2 ENST00000376392.6 ENST00000555572.1 |
NME1
NME1-NME2
NME2
|
NME/NM23 nucleoside diphosphate kinase 1 NME1-NME2 readthrough NME/NM23 nucleoside diphosphate kinase 2 |
| chr19_+_49497121 | 18.13 |
ENST00000413176.2
|
RUVBL2
|
RuvB-like AAA ATPase 2 |
| chr20_+_35234137 | 18.00 |
ENST00000344795.3
ENST00000373852.5 |
C20orf24
|
chromosome 20 open reading frame 24 |
| chr5_+_115420688 | 17.86 |
ENST00000274458.4
|
COMMD10
|
COMM domain containing 10 |
| chr20_+_48807351 | 17.63 |
ENST00000303004.3
|
CEBPB
|
CCAAT/enhancer binding protein (C/EBP), beta |
| chr11_+_832804 | 17.40 |
ENST00000397420.3
ENST00000525718.1 |
CD151
|
CD151 molecule (Raph blood group) |
| chr20_+_35234223 | 17.40 |
ENST00000342422.3
|
C20orf24
|
chromosome 20 open reading frame 24 |
| chr2_+_198365122 | 16.52 |
ENST00000604458.1
|
HSPE1-MOB4
|
HSPE1-MOB4 readthrough |
| chr19_+_48824711 | 16.12 |
ENST00000599704.1
|
EMP3
|
epithelial membrane protein 3 |
| chr19_+_18496957 | 15.45 |
ENST00000252809.3
|
GDF15
|
growth differentiation factor 15 |
| chr16_+_57653989 | 15.34 |
ENST00000567835.1
ENST00000569372.1 ENST00000563548.1 ENST00000562003.1 |
GPR56
|
G protein-coupled receptor 56 |
| chr2_-_47168850 | 14.86 |
ENST00000409207.1
|
MCFD2
|
multiple coagulation factor deficiency 2 |
| chr6_+_10748019 | 14.64 |
ENST00000543878.1
ENST00000461342.1 ENST00000475942.1 ENST00000379530.3 ENST00000473276.1 ENST00000481240.1 ENST00000467317.1 |
SYCP2L
TMEM14B
|
synaptonemal complex protein 2-like transmembrane protein 14B |
| chr15_-_63449663 | 14.62 |
ENST00000439025.1
|
RPS27L
|
ribosomal protein S27-like |
| chr3_+_184080387 | 14.39 |
ENST00000455712.1
|
POLR2H
|
polymerase (RNA) II (DNA directed) polypeptide H |
| chr2_+_217524323 | 14.21 |
ENST00000456764.1
|
IGFBP2
|
insulin-like growth factor binding protein 2, 36kDa |
| chr16_+_57653854 | 13.91 |
ENST00000568908.1
ENST00000568909.1 ENST00000566778.1 ENST00000561988.1 |
GPR56
|
G protein-coupled receptor 56 |
| chr6_+_10747986 | 13.79 |
ENST00000379542.5
|
TMEM14B
|
transmembrane protein 14B |
| chr8_+_22437965 | 13.55 |
ENST00000409141.1
ENST00000265810.4 |
PDLIM2
|
PDZ and LIM domain 2 (mystique) |
| chr7_+_100466433 | 13.18 |
ENST00000429658.1
|
TRIP6
|
thyroid hormone receptor interactor 6 |
| chr8_-_49833978 | 12.72 |
ENST00000020945.1
|
SNAI2
|
snail family zinc finger 2 |
| chr17_-_79818354 | 12.60 |
ENST00000576541.1
ENST00000576380.1 ENST00000571617.1 ENST00000576052.1 ENST00000576390.1 ENST00000573778.2 ENST00000439918.2 ENST00000574914.1 ENST00000331483.4 |
P4HB
|
prolyl 4-hydroxylase, beta polypeptide |
| chr2_-_47168906 | 12.58 |
ENST00000444761.2
ENST00000409147.1 |
MCFD2
|
multiple coagulation factor deficiency 2 |
| chr22_-_36924944 | 12.25 |
ENST00000405442.1
ENST00000402116.1 |
EIF3D
|
eukaryotic translation initiation factor 3, subunit D |
| chr1_-_209824643 | 12.15 |
ENST00000391911.1
ENST00000415782.1 |
LAMB3
|
laminin, beta 3 |
| chr15_-_72523924 | 11.83 |
ENST00000566809.1
ENST00000567087.1 ENST00000569050.1 ENST00000568883.1 |
PKM
|
pyruvate kinase, muscle |
| chr2_+_198365095 | 11.79 |
ENST00000409468.1
|
HSPE1
|
heat shock 10kDa protein 1 |
| chr17_-_26662440 | 11.71 |
ENST00000578122.1
|
IFT20
|
intraflagellar transport 20 homolog (Chlamydomonas) |
| chr1_+_158979686 | 11.71 |
ENST00000368132.3
ENST00000295809.7 |
IFI16
|
interferon, gamma-inducible protein 16 |
| chr5_+_170814803 | 11.66 |
ENST00000521672.1
ENST00000351986.6 ENST00000393820.2 ENST00000523622.1 |
NPM1
|
nucleophosmin (nucleolar phosphoprotein B23, numatrin) |
| chr22_-_36925186 | 11.54 |
ENST00000541106.1
ENST00000455547.1 ENST00000432675.1 |
EIF3D
|
eukaryotic translation initiation factor 3, subunit D |
| chr1_+_158979680 | 11.50 |
ENST00000368131.4
ENST00000340979.6 |
IFI16
|
interferon, gamma-inducible protein 16 |
| chr11_-_14541872 | 11.46 |
ENST00000419365.2
ENST00000530457.1 ENST00000532256.1 ENST00000533068.1 |
PSMA1
|
proteasome (prosome, macropain) subunit, alpha type, 1 |
| chr1_+_38158090 | 11.45 |
ENST00000373055.1
ENST00000327331.2 |
CDCA8
|
cell division cycle associated 8 |
| chr22_+_39378346 | 11.34 |
ENST00000407298.3
|
APOBEC3B
|
apolipoprotein B mRNA editing enzyme, catalytic polypeptide-like 3B |
| chr1_+_158979792 | 11.29 |
ENST00000359709.3
ENST00000430894.2 |
IFI16
|
interferon, gamma-inducible protein 16 |
| chr19_+_42364460 | 11.14 |
ENST00000593863.1
|
RPS19
|
ribosomal protein S19 |
| chr5_-_179051579 | 10.94 |
ENST00000505811.1
ENST00000515714.1 ENST00000513225.1 ENST00000503664.1 ENST00000356731.5 ENST00000523137.1 |
HNRNPH1
|
heterogeneous nuclear ribonucleoprotein H1 (H) |
| chrX_+_150148976 | 10.89 |
ENST00000419110.1
|
HMGB3
|
high mobility group box 3 |
| chr3_+_184081213 | 10.69 |
ENST00000429568.1
|
POLR2H
|
polymerase (RNA) II (DNA directed) polypeptide H |
| chr3_-_149375783 | 10.52 |
ENST00000467467.1
ENST00000460517.1 ENST00000360632.3 |
WWTR1
|
WW domain containing transcription regulator 1 |
| chr8_-_117778494 | 10.45 |
ENST00000276682.4
|
EIF3H
|
eukaryotic translation initiation factor 3, subunit H |
| chr2_-_178257401 | 10.44 |
ENST00000464747.1
|
NFE2L2
|
nuclear factor, erythroid 2-like 2 |
| chr14_+_52456193 | 10.39 |
ENST00000261700.3
|
C14orf166
|
chromosome 14 open reading frame 166 |
| chr14_+_52456327 | 10.34 |
ENST00000556760.1
|
C14orf166
|
chromosome 14 open reading frame 166 |
| chr15_-_66816853 | 10.26 |
ENST00000568588.1
|
RPL4
|
ribosomal protein L4 |
| chr2_+_178257372 | 10.01 |
ENST00000264167.4
ENST00000409888.1 |
AGPS
|
alkylglycerone phosphate synthase |
| chr3_+_184081175 | 9.91 |
ENST00000452961.1
ENST00000296223.3 |
POLR2H
|
polymerase (RNA) II (DNA directed) polypeptide H |
| chr11_-_77850629 | 9.64 |
ENST00000376156.3
ENST00000525870.1 ENST00000530454.1 ENST00000525755.1 ENST00000527099.1 ENST00000525761.1 ENST00000299626.5 |
ALG8
|
ALG8, alpha-1,3-glucosyltransferase |
| chr19_+_8509842 | 9.56 |
ENST00000325495.4
ENST00000600092.1 ENST00000594907.1 ENST00000596984.1 ENST00000601645.1 |
HNRNPM
|
heterogeneous nuclear ribonucleoprotein M |
| chr18_+_57567180 | 9.30 |
ENST00000316660.6
ENST00000269518.9 |
PMAIP1
|
phorbol-12-myristate-13-acetate-induced protein 1 |
| chr3_+_45017722 | 9.18 |
ENST00000265564.7
|
EXOSC7
|
exosome component 7 |
| chr2_-_179315786 | 8.92 |
ENST00000457633.1
ENST00000438687.3 ENST00000325748.4 |
PRKRA
|
protein kinase, interferon-inducible double stranded RNA dependent activator |
| chr13_-_78492927 | 8.74 |
ENST00000334286.5
|
EDNRB
|
endothelin receptor type B |
| chr19_+_42364313 | 8.52 |
ENST00000601492.1
ENST00000600467.1 ENST00000221975.2 |
RPS19
|
ribosomal protein S19 |
| chr12_-_15114603 | 8.47 |
ENST00000228945.4
|
ARHGDIB
|
Rho GDP dissociation inhibitor (GDI) beta |
| chr7_+_23145884 | 8.47 |
ENST00000409689.1
ENST00000410047.1 |
KLHL7
|
kelch-like family member 7 |
| chr19_-_19051103 | 8.47 |
ENST00000542541.2
ENST00000433218.2 |
HOMER3
|
homer homolog 3 (Drosophila) |
| chr4_+_39699664 | 8.46 |
ENST00000261427.5
ENST00000510934.1 ENST00000295963.6 |
UBE2K
|
ubiquitin-conjugating enzyme E2K |
| chr6_-_101329191 | 8.29 |
ENST00000324723.6
ENST00000369162.2 ENST00000522650.1 |
ASCC3
|
activating signal cointegrator 1 complex subunit 3 |
| chr3_+_184081137 | 8.24 |
ENST00000443489.1
|
POLR2H
|
polymerase (RNA) II (DNA directed) polypeptide H |
| chr3_+_69915385 | 8.05 |
ENST00000314589.5
|
MITF
|
microphthalmia-associated transcription factor |
| chr8_-_74206133 | 8.00 |
ENST00000352983.2
|
RPL7
|
ribosomal protein L7 |
| chr8_-_74206673 | 7.96 |
ENST00000396465.1
|
RPL7
|
ribosomal protein L7 |
| chr10_+_124913930 | 7.84 |
ENST00000368858.5
|
BUB3
|
BUB3 mitotic checkpoint protein |
| chr22_+_31489344 | 7.68 |
ENST00000404574.1
|
SMTN
|
smoothelin |
| chr7_+_140396946 | 7.67 |
ENST00000476470.1
ENST00000471136.1 |
NDUFB2
|
NADH dehydrogenase (ubiquinone) 1 beta subcomplex, 2, 8kDa |
| chr1_+_155658849 | 7.47 |
ENST00000368336.5
ENST00000343043.3 ENST00000421487.2 ENST00000535183.1 ENST00000465375.1 ENST00000470830.1 |
DAP3
|
death associated protein 3 |
| chr2_-_130878140 | 7.24 |
ENST00000360967.5
ENST00000361163.4 ENST00000357462.5 |
POTEF
|
POTE ankyrin domain family, member F |
| chr9_-_70488865 | 7.20 |
ENST00000377392.5
|
CBWD5
|
COBW domain containing 5 |
| chr13_+_48611665 | 7.19 |
ENST00000258662.2
|
NUDT15
|
nudix (nucleoside diphosphate linked moiety X)-type motif 15 |
| chr2_+_11752379 | 7.14 |
ENST00000396123.1
|
GREB1
|
growth regulation by estrogen in breast cancer 1 |
| chr2_-_69664549 | 7.09 |
ENST00000450796.2
ENST00000484177.1 |
NFU1
|
NFU1 iron-sulfur cluster scaffold homolog (S. cerevisiae) |
| chr11_+_65686728 | 7.07 |
ENST00000312515.2
ENST00000525501.1 |
DRAP1
|
DR1-associated protein 1 (negative cofactor 2 alpha) |
| chr3_-_49395892 | 7.00 |
ENST00000419783.1
|
GPX1
|
glutathione peroxidase 1 |
| chr15_-_89456630 | 7.00 |
ENST00000268150.8
|
MFGE8
|
milk fat globule-EGF factor 8 protein |
| chr8_+_126442563 | 6.97 |
ENST00000311922.3
|
TRIB1
|
tribbles pseudokinase 1 |
| chr3_-_49395705 | 6.97 |
ENST00000419349.1
|
GPX1
|
glutathione peroxidase 1 |
| chr6_-_111804905 | 6.90 |
ENST00000358835.3
ENST00000435970.1 |
REV3L
|
REV3-like, polymerase (DNA directed), zeta, catalytic subunit |
| chr12_+_119616447 | 6.82 |
ENST00000281938.2
|
HSPB8
|
heat shock 22kDa protein 8 |
| chr14_+_19553365 | 6.79 |
ENST00000409832.3
|
POTEG
|
POTE ankyrin domain family, member G |
| chr8_-_22926623 | 6.78 |
ENST00000276431.4
|
TNFRSF10B
|
tumor necrosis factor receptor superfamily, member 10b |
| chr7_+_140396756 | 6.73 |
ENST00000460088.1
ENST00000472695.1 |
NDUFB2
|
NADH dehydrogenase (ubiquinone) 1 beta subcomplex, 2, 8kDa |
| chr13_+_76334567 | 6.54 |
ENST00000321797.8
|
LMO7
|
LIM domain 7 |
| chr7_+_140396465 | 6.48 |
ENST00000476279.1
ENST00000247866.4 ENST00000461457.1 ENST00000465506.1 ENST00000204307.5 ENST00000464566.1 |
NDUFB2
|
NADH dehydrogenase (ubiquinone) 1 beta subcomplex, 2, 8kDa |
| chr15_-_89456593 | 6.35 |
ENST00000558029.1
ENST00000539437.1 ENST00000542878.1 ENST00000268151.7 ENST00000566497.1 |
MFGE8
|
milk fat globule-EGF factor 8 protein |
| chr17_+_8191815 | 6.27 |
ENST00000226105.6
ENST00000407006.4 ENST00000580434.1 ENST00000439238.3 |
RANGRF
|
RAN guanine nucleotide release factor |
| chr19_+_535835 | 6.22 |
ENST00000607527.1
ENST00000606065.1 |
CDC34
|
cell division cycle 34 |
| chr2_+_131369054 | 6.15 |
ENST00000409602.1
|
POTEJ
|
POTE ankyrin domain family, member J |
| chr1_-_153588334 | 6.07 |
ENST00000476873.1
|
S100A14
|
S100 calcium binding protein A14 |
| chr7_+_23145347 | 5.97 |
ENST00000322231.7
|
KLHL7
|
kelch-like family member 7 |
| chrX_+_48334549 | 5.77 |
ENST00000019019.2
ENST00000348411.2 ENST00000396894.4 |
FTSJ1
|
FtsJ RNA methyltransferase homolog 1 (E. coli) |
| chr9_+_134065506 | 5.70 |
ENST00000483497.2
|
NUP214
|
nucleoporin 214kDa |
| chr6_+_31633833 | 5.64 |
ENST00000375882.2
ENST00000375880.2 |
CSNK2B
CSNK2B-LY6G5B-1181
|
casein kinase 2, beta polypeptide Uncharacterized protein |
| chr4_-_24586140 | 5.61 |
ENST00000336812.4
|
DHX15
|
DEAH (Asp-Glu-Ala-His) box helicase 15 |
| chr21_-_35288284 | 5.48 |
ENST00000290299.2
|
ATP5O
|
ATP synthase, H+ transporting, mitochondrial F1 complex, O subunit |
| chrX_-_129244655 | 5.33 |
ENST00000335997.7
|
ELF4
|
E74-like factor 4 (ets domain transcription factor) |
| chr2_-_69664586 | 5.32 |
ENST00000303698.3
ENST00000394305.1 ENST00000410022.2 |
NFU1
|
NFU1 iron-sulfur cluster scaffold homolog (S. cerevisiae) |
| chr9_+_119449576 | 5.13 |
ENST00000450136.1
ENST00000373983.2 ENST00000411410.1 |
TRIM32
|
tripartite motif containing 32 |
| chrX_-_129244454 | 5.11 |
ENST00000308167.5
|
ELF4
|
E74-like factor 4 (ets domain transcription factor) |
| chr8_+_29953163 | 5.09 |
ENST00000518192.1
|
LEPROTL1
|
leptin receptor overlapping transcript-like 1 |
| chr11_-_71823266 | 5.08 |
ENST00000538919.1
ENST00000539395.1 ENST00000542531.1 |
ANAPC15
|
anaphase promoting complex subunit 15 |
| chr13_-_78492955 | 5.05 |
ENST00000446573.1
|
EDNRB
|
endothelin receptor type B |
| chr19_-_17375541 | 4.98 |
ENST00000252597.3
|
USHBP1
|
Usher syndrome 1C binding protein 1 |
| chr4_+_71554196 | 4.93 |
ENST00000254803.2
|
UTP3
|
UTP3, small subunit (SSU) processome component, homolog (S. cerevisiae) |
| chr12_-_15114492 | 4.92 |
ENST00000541546.1
|
ARHGDIB
|
Rho GDP dissociation inhibitor (GDI) beta |
| chr10_+_124913793 | 4.89 |
ENST00000368865.4
ENST00000538238.1 ENST00000368859.2 |
BUB3
|
BUB3 mitotic checkpoint protein |
| chr15_+_42697065 | 4.80 |
ENST00000565559.1
|
CAPN3
|
calpain 3, (p94) |
| chr11_+_64073699 | 4.70 |
ENST00000405666.1
ENST00000468670.1 |
ESRRA
|
estrogen-related receptor alpha |
| chr2_+_101179152 | 4.67 |
ENST00000264254.6
|
PDCL3
|
phosducin-like 3 |
| chr12_+_56367697 | 4.66 |
ENST00000553116.1
ENST00000360299.5 ENST00000548068.1 ENST00000549915.1 ENST00000551459.1 ENST00000448789.2 |
RAB5B
|
RAB5B, member RAS oncogene family |
| chr14_-_23904861 | 4.66 |
ENST00000355349.3
|
MYH7
|
myosin, heavy chain 7, cardiac muscle, beta |
| chr12_-_125348329 | 4.59 |
ENST00000546215.1
ENST00000415380.2 ENST00000261693.6 ENST00000376788.1 ENST00000545493.1 |
SCARB1
|
scavenger receptor class B, member 1 |
| chr13_-_50367057 | 4.56 |
ENST00000261667.3
|
KPNA3
|
karyopherin alpha 3 (importin alpha 4) |
| chr7_-_142232071 | 4.51 |
ENST00000390364.3
|
TRBV10-1
|
T cell receptor beta variable 10-1(gene/pseudogene) |
| chr1_-_20987982 | 4.50 |
ENST00000375048.3
|
DDOST
|
dolichyl-diphosphooligosaccharide--protein glycosyltransferase subunit (non-catalytic) |
| chr1_+_153747746 | 4.49 |
ENST00000368661.3
|
SLC27A3
|
solute carrier family 27 (fatty acid transporter), member 3 |
| chr12_-_125348448 | 4.42 |
ENST00000339570.5
|
SCARB1
|
scavenger receptor class B, member 1 |
| chr19_-_11688447 | 4.38 |
ENST00000590420.1
|
ACP5
|
acid phosphatase 5, tartrate resistant |
| chr17_-_26662464 | 4.36 |
ENST00000579419.1
ENST00000585313.1 ENST00000395418.3 ENST00000578985.1 ENST00000577498.1 ENST00000585089.1 ENST00000357896.3 |
IFT20
|
intraflagellar transport 20 homolog (Chlamydomonas) |
| chr1_-_94312706 | 4.28 |
ENST00000370244.1
|
BCAR3
|
breast cancer anti-estrogen resistance 3 |
| chr7_+_23145366 | 4.16 |
ENST00000339077.5
ENST00000322275.5 ENST00000539124.1 ENST00000542558.1 |
KLHL7
|
kelch-like family member 7 |
| chr20_+_34894247 | 4.14 |
ENST00000373913.3
|
DLGAP4
|
discs, large (Drosophila) homolog-associated protein 4 |
| chr4_-_106629796 | 4.05 |
ENST00000416543.1
ENST00000515819.1 ENST00000420368.2 ENST00000503746.1 ENST00000340139.5 ENST00000433009.1 |
INTS12
|
integrator complex subunit 12 |
| chr17_-_74707037 | 4.00 |
ENST00000355797.3
ENST00000375036.2 ENST00000449428.2 |
MXRA7
|
matrix-remodelling associated 7 |
| chr19_-_47288162 | 3.96 |
ENST00000594991.1
|
SLC1A5
|
solute carrier family 1 (neutral amino acid transporter), member 5 |
| chr12_-_52887034 | 3.92 |
ENST00000330722.6
|
KRT6A
|
keratin 6A |
| chr12_-_52845910 | 3.87 |
ENST00000252252.3
|
KRT6B
|
keratin 6B |
| chr9_+_124088860 | 3.76 |
ENST00000373806.1
|
GSN
|
gelsolin |
| chr5_-_179499108 | 3.48 |
ENST00000521389.1
|
RNF130
|
ring finger protein 130 |
| chr20_+_61867235 | 3.35 |
ENST00000342412.6
ENST00000217169.3 |
BIRC7
|
baculoviral IAP repeat containing 7 |
| chr10_+_23384435 | 3.19 |
ENST00000376510.3
|
MSRB2
|
methionine sulfoxide reductase B2 |
| chr3_+_44840679 | 3.10 |
ENST00000425755.1
|
KIF15
|
kinesin family member 15 |
| chr10_+_102106829 | 3.10 |
ENST00000370355.2
|
SCD
|
stearoyl-CoA desaturase (delta-9-desaturase) |
| chr3_+_14219858 | 3.09 |
ENST00000306024.3
|
LSM3
|
LSM3 homolog, U6 small nuclear RNA associated (S. cerevisiae) |
| chr10_+_93558069 | 3.08 |
ENST00000371627.4
|
TNKS2
|
tankyrase, TRF1-interacting ankyrin-related ADP-ribose polymerase 2 |
| chr5_+_179247759 | 3.07 |
ENST00000389805.4
ENST00000504627.1 ENST00000402874.3 ENST00000510187.1 |
SQSTM1
|
sequestosome 1 |
| chr17_-_12921270 | 3.06 |
ENST00000578071.1
ENST00000426905.3 ENST00000395962.2 ENST00000583371.1 ENST00000338034.4 |
ELAC2
|
elaC ribonuclease Z 2 |
| chr1_+_86889769 | 2.89 |
ENST00000370565.4
|
CLCA2
|
chloride channel accessory 2 |
| chr17_-_40729681 | 2.87 |
ENST00000590760.1
ENST00000587209.1 ENST00000393795.3 ENST00000253789.5 |
PSMC3IP
|
PSMC3 interacting protein |
| chr6_+_148663729 | 2.77 |
ENST00000367467.3
|
SASH1
|
SAM and SH3 domain containing 1 |
| chr6_-_33385902 | 2.77 |
ENST00000374500.5
|
CUTA
|
cutA divalent cation tolerance homolog (E. coli) |
| chr2_+_169312725 | 2.70 |
ENST00000392687.4
|
CERS6
|
ceramide synthase 6 |
| chr8_+_29952914 | 2.62 |
ENST00000321250.8
ENST00000518001.1 ENST00000520682.1 ENST00000442880.2 ENST00000523116.1 |
LEPROTL1
|
leptin receptor overlapping transcript-like 1 |
| chr5_+_153570285 | 2.61 |
ENST00000425427.2
ENST00000297107.6 |
GALNT10
|
UDP-N-acetyl-alpha-D-galactosamine:polypeptide N-acetylgalactosaminyltransferase 10 (GalNAc-T10) |
| chr1_-_93426998 | 2.61 |
ENST00000370310.4
|
FAM69A
|
family with sequence similarity 69, member A |
| chr1_-_32801825 | 2.60 |
ENST00000329421.7
|
MARCKSL1
|
MARCKS-like 1 |
| chr3_-_45017609 | 2.57 |
ENST00000342790.4
ENST00000424952.2 ENST00000296127.3 ENST00000455235.1 |
ZDHHC3
|
zinc finger, DHHC-type containing 3 |
| chr1_-_47655686 | 2.57 |
ENST00000294338.2
|
PDZK1IP1
|
PDZK1 interacting protein 1 |
| chr16_-_70729496 | 2.57 |
ENST00000567648.1
|
VAC14
|
Vac14 homolog (S. cerevisiae) |
| chr11_-_64889529 | 2.38 |
ENST00000531743.1
ENST00000527548.1 ENST00000526555.1 ENST00000279259.3 |
FAU
|
Finkel-Biskis-Reilly murine sarcoma virus (FBR-MuSV) ubiquitously expressed |
| chr9_+_96338647 | 2.36 |
ENST00000359246.4
|
PHF2
|
PHD finger protein 2 |
| chr22_+_50628999 | 2.30 |
ENST00000395827.1
|
TRABD
|
TraB domain containing |
| chr22_+_38302285 | 2.27 |
ENST00000215957.6
|
MICALL1
|
MICAL-like 1 |
| chr17_-_41277467 | 2.22 |
ENST00000494123.1
ENST00000346315.3 ENST00000309486.4 ENST00000468300.1 ENST00000354071.3 ENST00000352993.3 ENST00000471181.2 |
BRCA1
|
breast cancer 1, early onset |
| chr3_+_122044084 | 2.21 |
ENST00000264474.3
ENST00000479204.1 |
CSTA
|
cystatin A (stefin A) |
| chr5_-_179499086 | 2.19 |
ENST00000261947.4
|
RNF130
|
ring finger protein 130 |
| chr11_+_18287721 | 2.16 |
ENST00000356524.4
|
SAA1
|
serum amyloid A1 |
| chr10_+_5726764 | 2.12 |
ENST00000328090.5
ENST00000496681.1 |
FAM208B
|
family with sequence similarity 208, member B |
| chr19_-_10613421 | 2.09 |
ENST00000393623.2
|
KEAP1
|
kelch-like ECH-associated protein 1 |
| chr1_+_110198689 | 2.02 |
ENST00000369836.4
|
GSTM4
|
glutathione S-transferase mu 4 |
| chr11_-_104972158 | 1.96 |
ENST00000598974.1
ENST00000593315.1 ENST00000594519.1 ENST00000415981.2 ENST00000525374.1 ENST00000375707.1 |
CASP1
CARD16
CARD17
|
caspase 1, apoptosis-related cysteine peptidase caspase recruitment domain family, member 16 caspase recruitment domain family, member 17 |
| chr15_-_31393910 | 1.96 |
ENST00000397795.2
ENST00000256552.6 ENST00000559179.1 |
TRPM1
|
transient receptor potential cation channel, subfamily M, member 1 |
| chr18_+_61143994 | 1.95 |
ENST00000382771.4
|
SERPINB5
|
serpin peptidase inhibitor, clade B (ovalbumin), member 5 |
| chr22_+_38201114 | 1.94 |
ENST00000340857.2
|
H1F0
|
H1 histone family, member 0 |
| chr9_+_116298778 | 1.93 |
ENST00000462143.1
|
RGS3
|
regulator of G-protein signaling 3 |
| chr11_-_64889649 | 1.92 |
ENST00000434372.2
|
FAU
|
Finkel-Biskis-Reilly murine sarcoma virus (FBR-MuSV) ubiquitously expressed |
| chr11_-_104905840 | 1.88 |
ENST00000526568.1
ENST00000393136.4 ENST00000531166.1 ENST00000534497.1 ENST00000527979.1 ENST00000446369.1 ENST00000353247.5 ENST00000528974.1 ENST00000533400.1 ENST00000525825.1 ENST00000436863.3 |
CASP1
|
caspase 1, apoptosis-related cysteine peptidase |
| chr2_+_68384976 | 1.87 |
ENST00000263657.2
|
PNO1
|
partner of NOB1 homolog (S. cerevisiae) |
| chr8_+_67341239 | 1.85 |
ENST00000320270.2
|
RRS1
|
RRS1 ribosome biogenesis regulator homolog (S. cerevisiae) |
| chr11_-_414948 | 1.81 |
ENST00000530494.1
ENST00000528209.1 ENST00000431843.2 ENST00000528058.1 |
SIGIRR
|
single immunoglobulin and toll-interleukin 1 receptor (TIR) domain |
| chr19_-_51471381 | 1.75 |
ENST00000594641.1
|
KLK6
|
kallikrein-related peptidase 6 |
| chr11_+_18287801 | 1.73 |
ENST00000532858.1
ENST00000405158.2 |
SAA1
|
serum amyloid A1 |
| chr19_-_11688500 | 1.73 |
ENST00000433365.2
|
ACP5
|
acid phosphatase 5, tartrate resistant |
| chr3_+_133118839 | 1.72 |
ENST00000302334.2
|
BFSP2
|
beaded filament structural protein 2, phakinin |
| chr5_-_156486120 | 1.72 |
ENST00000522693.1
|
HAVCR1
|
hepatitis A virus cellular receptor 1 |
| chr6_+_121756809 | 1.65 |
ENST00000282561.3
|
GJA1
|
gap junction protein, alpha 1, 43kDa |
| chr4_+_671711 | 1.65 |
ENST00000400159.2
|
MYL5
|
myosin, light chain 5, regulatory |
| chr20_-_43280361 | 1.61 |
ENST00000372874.4
|
ADA
|
adenosine deaminase |
| chr1_-_3447967 | 1.46 |
ENST00000294599.4
|
MEGF6
|
multiple EGF-like-domains 6 |
| chr15_+_42696992 | 1.46 |
ENST00000561817.1
|
CAPN3
|
calpain 3, (p94) |
| chr1_-_109506036 | 1.41 |
ENST00000369976.1
ENST00000356970.2 ENST00000369971.2 ENST00000415331.1 ENST00000357393.4 |
CLCC1
AKNAD1
|
chloride channel CLIC-like 1 AKNA domain containing 1 |
| chr1_-_185286461 | 1.37 |
ENST00000367498.3
|
IVNS1ABP
|
influenza virus NS1A binding protein |
| chr16_-_68000717 | 1.35 |
ENST00000541864.2
|
SLC12A4
|
solute carrier family 12 (potassium/chloride transporter), member 4 |
| chr11_+_19138670 | 1.32 |
ENST00000446113.2
ENST00000399351.3 |
ZDHHC13
|
zinc finger, DHHC-type containing 13 |
| chr14_-_73925225 | 1.29 |
ENST00000356296.4
ENST00000355058.3 ENST00000359560.3 ENST00000557597.1 ENST00000554394.1 ENST00000555238.1 ENST00000535282.1 ENST00000555987.1 ENST00000555394.1 ENST00000554546.1 |
NUMB
|
numb homolog (Drosophila) |
| chr17_+_48556158 | 1.28 |
ENST00000258955.2
|
RSAD1
|
radical S-adenosyl methionine domain containing 1 |
| chr2_-_165698521 | 1.28 |
ENST00000409184.3
ENST00000392717.2 ENST00000456693.1 |
COBLL1
|
cordon-bleu WH2 repeat protein-like 1 |
| chr15_+_42697018 | 1.27 |
ENST00000397204.4
|
CAPN3
|
calpain 3, (p94) |
| chr11_-_75017734 | 1.27 |
ENST00000532525.1
|
ARRB1
|
arrestin, beta 1 |
| chr11_-_64889252 | 1.23 |
ENST00000525297.1
ENST00000529259.1 |
FAU
|
Finkel-Biskis-Reilly murine sarcoma virus (FBR-MuSV) ubiquitously expressed |
| chr11_-_36310958 | 1.16 |
ENST00000532705.1
ENST00000263401.5 ENST00000452374.2 |
COMMD9
|
COMM domain containing 9 |
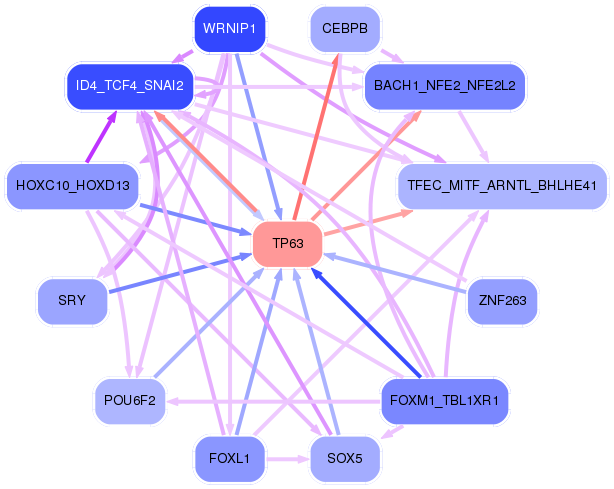
Network of associatons between targets according to the STRING database.

First level regulatory network of TP63
Gene Ontology Analysis
Gene overrepresentation in biological_process category:
| Log-likelihood per target | Total log-likelihood | Term | Description |
|---|---|---|---|
| 7.9 | 23.8 | GO:0001732 | formation of cytoplasmic translation initiation complex(GO:0001732) |
| 5.4 | 21.7 | GO:0070358 | actin polymerization-dependent cell motility(GO:0070358) |
| 4.9 | 19.7 | GO:0060265 | positive regulation of respiratory burst involved in inflammatory response(GO:0060265) |
| 4.6 | 13.8 | GO:0007497 | posterior midgut development(GO:0007497) endothelin receptor signaling pathway(GO:0086100) |
| 4.5 | 18.1 | GO:0071733 | transcriptional activation by promoter-enhancer looping(GO:0071733) gene looping(GO:0090202) dsDNA loop formation(GO:0090579) |
| 4.5 | 9.0 | GO:0015920 | lipopolysaccharide transport(GO:0015920) |
| 4.2 | 12.7 | GO:0070563 | negative regulation of vitamin D receptor signaling pathway(GO:0070563) |
| 3.9 | 23.4 | GO:0016479 | negative regulation of transcription from RNA polymerase I promoter(GO:0016479) |
| 3.3 | 13.4 | GO:0071461 | cellular response to redox state(GO:0071461) |
| 3.3 | 10.0 | GO:0046504 | ether lipid biosynthetic process(GO:0008611) glycerol ether biosynthetic process(GO:0046504) ether biosynthetic process(GO:1901503) |
| 2.8 | 14.0 | GO:0009609 | response to symbiont(GO:0009608) response to symbiotic bacterium(GO:0009609) |
| 2.6 | 13.2 | GO:0008588 | release of cytoplasmic sequestered NF-kappaB(GO:0008588) |
| 2.6 | 10.4 | GO:1903786 | mycotoxin catabolic process(GO:0043387) aflatoxin catabolic process(GO:0046223) organic heteropentacyclic compound catabolic process(GO:1901377) regulation of glutathione biosynthetic process(GO:1903786) positive regulation of glutathione biosynthetic process(GO:1903788) |
| 2.3 | 7.0 | GO:0045658 | regulation of eosinophil differentiation(GO:0045643) positive regulation of eosinophil differentiation(GO:0045645) regulation of neutrophil differentiation(GO:0045658) negative regulation of neutrophil differentiation(GO:0045659) |
| 2.3 | 9.2 | GO:0034476 | U1 snRNA 3'-end processing(GO:0034473) U5 snRNA 3'-end processing(GO:0034476) |
| 2.0 | 44.7 | GO:0000028 | ribosomal small subunit assembly(GO:0000028) |
| 2.0 | 11.8 | GO:0042866 | pyruvate biosynthetic process(GO:0042866) |
| 1.9 | 30.3 | GO:0008635 | activation of cysteine-type endopeptidase activity involved in apoptotic process by cytochrome c(GO:0008635) |
| 1.9 | 18.9 | GO:0018202 | peptidyl-histidine modification(GO:0018202) |
| 1.8 | 7.2 | GO:0006203 | dGTP catabolic process(GO:0006203) |
| 1.7 | 20.7 | GO:0006388 | tRNA splicing, via endonucleolytic cleavage and ligation(GO:0006388) |
| 1.7 | 1.7 | GO:0010645 | regulation of cell communication by chemical coupling(GO:0010645) positive regulation of cell communication by chemical coupling(GO:0010652) |
| 1.6 | 16.1 | GO:0035845 | photoreceptor cell outer segment organization(GO:0035845) |
| 1.6 | 17.6 | GO:0045408 | regulation of interleukin-6 biosynthetic process(GO:0045408) |
| 1.6 | 12.6 | GO:0018401 | peptidyl-proline hydroxylation to 4-hydroxy-L-proline(GO:0018401) |
| 1.6 | 6.3 | GO:0098905 | regulation of bundle of His cell action potential(GO:0098905) |
| 1.5 | 11.7 | GO:0060699 | regulation of endoribonuclease activity(GO:0060699) |
| 1.3 | 16.0 | GO:0000463 | maturation of LSU-rRNA from tricistronic rRNA transcript (SSU-rRNA, 5.8S rRNA, LSU-rRNA)(GO:0000463) |
| 1.3 | 3.9 | GO:0051710 | regulation of cytolysis in other organism(GO:0051710) |
| 1.3 | 3.9 | GO:0050716 | positive regulation of interleukin-1 secretion(GO:0050716) |
| 1.3 | 7.7 | GO:0032511 | late endosome to vacuole transport via multivesicular body sorting pathway(GO:0032511) |
| 1.3 | 7.5 | GO:0070315 | G1 to G0 transition involved in cell differentiation(GO:0070315) |
| 1.2 | 2.5 | GO:0009217 | purine deoxyribonucleoside triphosphate catabolic process(GO:0009217) dATP catabolic process(GO:0046061) |
| 1.2 | 6.1 | GO:0032929 | negative regulation of superoxide anion generation(GO:0032929) |
| 1.2 | 8.3 | GO:0006307 | DNA dealkylation involved in DNA repair(GO:0006307) |
| 1.2 | 10.5 | GO:0035414 | negative regulation of catenin import into nucleus(GO:0035414) |
| 1.2 | 4.7 | GO:0008616 | queuosine biosynthetic process(GO:0008616) queuosine metabolic process(GO:0046116) |
| 1.2 | 4.7 | GO:0014724 | regulation of twitch skeletal muscle contraction(GO:0014724) |
| 1.0 | 10.4 | GO:0001866 | NK T cell proliferation(GO:0001866) |
| 1.0 | 13.3 | GO:2000427 | positive regulation of apoptotic cell clearance(GO:2000427) |
| 1.0 | 3.1 | GO:0070213 | protein auto-ADP-ribosylation(GO:0070213) |
| 1.0 | 5.1 | GO:0030047 | actin modification(GO:0030047) |
| 1.0 | 3.1 | GO:0000965 | mitochondrial RNA 3'-end processing(GO:0000965) |
| 1.0 | 29.5 | GO:0031581 | hemidesmosome assembly(GO:0031581) |
| 1.0 | 4.0 | GO:0010585 | glutamine secretion(GO:0010585) L-glutamine import(GO:0036229) L-glutamine import into cell(GO:1903803) |
| 1.0 | 3.8 | GO:0050717 | positive regulation of interleukin-1 alpha secretion(GO:0050717) |
| 0.9 | 43.2 | GO:0006363 | transcription elongation from RNA polymerase I promoter(GO:0006362) termination of RNA polymerase I transcription(GO:0006363) |
| 0.9 | 9.3 | GO:0010917 | negative regulation of mitochondrial membrane potential(GO:0010917) |
| 0.8 | 16.1 | GO:0032060 | bleb assembly(GO:0032060) |
| 0.8 | 14.7 | GO:0035458 | cellular response to interferon-beta(GO:0035458) |
| 0.8 | 11.3 | GO:0010529 | regulation of transposition(GO:0010528) negative regulation of transposition(GO:0010529) |
| 0.8 | 2.4 | GO:0061187 | regulation of chromatin silencing at rDNA(GO:0061187) negative regulation of chromatin silencing at rDNA(GO:0061188) |
| 0.8 | 3.8 | GO:0044856 | plasma membrane raft distribution(GO:0044855) plasma membrane raft localization(GO:0044856) plasma membrane raft polarization(GO:0044858) regulation of plasma membrane raft polarization(GO:1903906) |
| 0.7 | 2.2 | GO:0070510 | regulation of histone H4-K20 methylation(GO:0070510) positive regulation of histone H4-K20 methylation(GO:0070512) |
| 0.7 | 5.6 | GO:0033211 | adiponectin-activated signaling pathway(GO:0033211) |
| 0.7 | 2.8 | GO:1902498 | regulation of protein autoubiquitination(GO:1902498) |
| 0.7 | 8.9 | GO:0030422 | production of siRNA involved in RNA interference(GO:0030422) |
| 0.7 | 34.5 | GO:0032731 | positive regulation of interleukin-1 beta production(GO:0032731) |
| 0.6 | 1.3 | GO:0030860 | regulation of polarized epithelial cell differentiation(GO:0030860) |
| 0.6 | 14.0 | GO:1901741 | positive regulation of myoblast fusion(GO:1901741) |
| 0.6 | 11.8 | GO:0051085 | chaperone mediated protein folding requiring cofactor(GO:0051085) |
| 0.6 | 9.6 | GO:0006488 | dolichol-linked oligosaccharide biosynthetic process(GO:0006488) |
| 0.6 | 7.3 | GO:0097296 | activation of cysteine-type endopeptidase activity involved in apoptotic signaling pathway(GO:0097296) |
| 0.6 | 31.9 | GO:0018279 | peptidyl-asparagine modification(GO:0018196) protein N-linked glycosylation via asparagine(GO:0018279) |
| 0.5 | 3.1 | GO:0061635 | regulation of protein complex stability(GO:0061635) |
| 0.5 | 13.8 | GO:0010226 | response to lithium ion(GO:0010226) |
| 0.5 | 10.7 | GO:0031163 | iron-sulfur cluster assembly(GO:0016226) metallo-sulfur cluster assembly(GO:0031163) |
| 0.4 | 17.8 | GO:0007094 | mitotic spindle assembly checkpoint(GO:0007094) spindle assembly checkpoint(GO:0071173) |
| 0.4 | 2.1 | GO:0010499 | proteasomal ubiquitin-independent protein catabolic process(GO:0010499) |
| 0.4 | 10.4 | GO:0007216 | G-protein coupled glutamate receptor signaling pathway(GO:0007216) |
| 0.4 | 4.7 | GO:0048227 | plasma membrane to endosome transport(GO:0048227) |
| 0.4 | 3.2 | GO:0030091 | protein repair(GO:0030091) |
| 0.3 | 6.1 | GO:0090026 | positive regulation of monocyte chemotaxis(GO:0090026) |
| 0.3 | 1.9 | GO:1902570 | protein localization to nucleolus(GO:1902570) |
| 0.3 | 1.8 | GO:0045079 | negative regulation of chemokine biosynthetic process(GO:0045079) |
| 0.3 | 11.4 | GO:0007080 | mitotic metaphase plate congression(GO:0007080) |
| 0.3 | 4.1 | GO:0016180 | snRNA processing(GO:0016180) |
| 0.2 | 6.9 | GO:0042276 | error-prone translesion synthesis(GO:0042276) |
| 0.2 | 0.7 | GO:0042369 | vitamin D catabolic process(GO:0042369) |
| 0.2 | 2.0 | GO:0018916 | nitrobenzene metabolic process(GO:0018916) |
| 0.2 | 21.5 | GO:0000079 | regulation of cyclin-dependent protein serine/threonine kinase activity(GO:0000079) |
| 0.2 | 5.8 | GO:0030488 | tRNA methylation(GO:0030488) |
| 0.2 | 13.8 | GO:0001895 | retina homeostasis(GO:0001895) |
| 0.2 | 0.4 | GO:0072162 | metanephric mesenchymal cell differentiation(GO:0072162) |
| 0.2 | 4.6 | GO:0019054 | modulation by virus of host process(GO:0019054) |
| 0.2 | 3.4 | GO:1990001 | inhibition of cysteine-type endopeptidase activity involved in apoptotic process(GO:1990001) |
| 0.2 | 1.3 | GO:0034393 | positive regulation of smooth muscle cell apoptotic process(GO:0034393) |
| 0.2 | 1.7 | GO:0070307 | lens fiber cell development(GO:0070307) |
| 0.2 | 5.5 | GO:0042776 | mitochondrial ATP synthesis coupled proton transport(GO:0042776) |
| 0.2 | 4.3 | GO:0002089 | lens morphogenesis in camera-type eye(GO:0002089) |
| 0.2 | 2.6 | GO:0018345 | protein palmitoylation(GO:0018345) |
| 0.2 | 1.0 | GO:2000270 | negative regulation of fibroblast apoptotic process(GO:2000270) |
| 0.2 | 8.1 | GO:2000144 | positive regulation of DNA-templated transcription, initiation(GO:2000144) |
| 0.2 | 20.5 | GO:0008543 | fibroblast growth factor receptor signaling pathway(GO:0008543) |
| 0.2 | 27.2 | GO:0014066 | regulation of phosphatidylinositol 3-kinase signaling(GO:0014066) |
| 0.1 | 10.9 | GO:0032392 | DNA geometric change(GO:0032392) |
| 0.1 | 10.3 | GO:0002181 | cytoplasmic translation(GO:0002181) |
| 0.1 | 11.5 | GO:0006521 | regulation of cellular amino acid metabolic process(GO:0006521) |
| 0.1 | 1.9 | GO:0006309 | apoptotic DNA fragmentation(GO:0006309) |
| 0.1 | 8.5 | GO:0070125 | mitochondrial translational elongation(GO:0070125) mitochondrial translational termination(GO:0070126) |
| 0.1 | 1.3 | GO:1903830 | magnesium ion transmembrane transport(GO:1903830) |
| 0.1 | 2.3 | GO:0097320 | membrane tubulation(GO:0097320) |
| 0.1 | 1.8 | GO:0016540 | protein autoprocessing(GO:0016540) |
| 0.1 | 10.5 | GO:0006446 | regulation of translational initiation(GO:0006446) |
| 0.1 | 3.1 | GO:0000291 | nuclear-transcribed mRNA catabolic process, exonucleolytic(GO:0000291) exonucleolytic nuclear-transcribed mRNA catabolic process involved in deadenylation-dependent decay(GO:0043928) |
| 0.1 | 7.6 | GO:0097031 | NADH dehydrogenase complex assembly(GO:0010257) mitochondrial respiratory chain complex I assembly(GO:0032981) mitochondrial respiratory chain complex I biogenesis(GO:0097031) |
| 0.1 | 3.1 | GO:0006890 | retrograde vesicle-mediated transport, Golgi to ER(GO:0006890) |
| 0.1 | 0.5 | GO:0006333 | chromatin assembly or disassembly(GO:0006333) |
| 0.1 | 0.4 | GO:1902775 | mitochondrial ribosome assembly(GO:0061668) mitochondrial large ribosomal subunit assembly(GO:1902775) |
| 0.1 | 2.9 | GO:0007131 | reciprocal meiotic recombination(GO:0007131) reciprocal DNA recombination(GO:0035825) |
| 0.1 | 2.6 | GO:0043550 | regulation of lipid kinase activity(GO:0043550) |
| 0.1 | 3.1 | GO:0046949 | fatty-acyl-CoA biosynthetic process(GO:0046949) |
| 0.1 | 4.9 | GO:0045670 | regulation of osteoclast differentiation(GO:0045670) |
| 0.1 | 2.9 | GO:0071431 | tRNA export from nucleus(GO:0006409) tRNA-containing ribonucleoprotein complex export from nucleus(GO:0071431) |
| 0.1 | 1.0 | GO:0006308 | DNA catabolic process(GO:0006308) |
| 0.1 | 0.6 | GO:0055091 | phospholipid homeostasis(GO:0055091) |
| 0.0 | 1.9 | GO:0000188 | inactivation of MAPK activity(GO:0000188) |
| 0.0 | 1.4 | GO:0006884 | cell volume homeostasis(GO:0006884) |
| 0.0 | 2.2 | GO:0018149 | peptide cross-linking(GO:0018149) |
| 0.0 | 2.8 | GO:0010038 | response to metal ion(GO:0010038) |
| 0.0 | 0.3 | GO:0010593 | negative regulation of lamellipodium assembly(GO:0010593) |
| 0.0 | 1.7 | GO:0016266 | O-glycan processing(GO:0016266) |
| 0.0 | 4.5 | GO:0001676 | long-chain fatty acid metabolic process(GO:0001676) |
| 0.0 | 0.9 | GO:0043101 | purine-containing compound salvage(GO:0043101) |
| 0.0 | 4.3 | GO:1902476 | chloride transmembrane transport(GO:1902476) |
| 0.0 | 1.0 | GO:0007398 | ectoderm development(GO:0007398) |
| 0.0 | 1.3 | GO:0006779 | porphyrin-containing compound biosynthetic process(GO:0006779) |
| 0.0 | 0.7 | GO:0036499 | PERK-mediated unfolded protein response(GO:0036499) |
| 0.0 | 1.4 | GO:0006383 | transcription from RNA polymerase III promoter(GO:0006383) |
| 0.0 | 1.0 | GO:0050427 | purine ribonucleoside bisphosphate metabolic process(GO:0034035) 3'-phosphoadenosine 5'-phosphosulfate metabolic process(GO:0050427) |
| 0.0 | 0.1 | GO:0060743 | epithelial cell maturation involved in prostate gland development(GO:0060743) |
| 0.0 | 2.2 | GO:0033209 | tumor necrosis factor-mediated signaling pathway(GO:0033209) |
| 0.0 | 1.2 | GO:0055092 | cholesterol homeostasis(GO:0042632) sterol homeostasis(GO:0055092) |
| 0.0 | 0.4 | GO:1902857 | positive regulation of nonmotile primary cilium assembly(GO:1902857) |
| 0.0 | 0.3 | GO:0034497 | protein localization to pre-autophagosomal structure(GO:0034497) |
Gene overrepresentation in cellular_component category:
| Log-likelihood per target | Total log-likelihood | Term | Description |
|---|---|---|---|
| 7.8 | 23.4 | GO:0031523 | Myb complex(GO:0031523) |
| 5.4 | 16.1 | GO:1902636 | kinociliary basal body(GO:1902636) |
| 4.2 | 12.7 | GO:1990298 | mitotic checkpoint complex(GO:0033597) bub1-bub3 complex(GO:1990298) |
| 4.2 | 12.6 | GO:0016222 | procollagen-proline 4-dioxygenase complex(GO:0016222) |
| 3.8 | 34.2 | GO:0071541 | eukaryotic translation initiation factor 3 complex, eIF3m(GO:0071541) |
| 3.0 | 20.7 | GO:0072669 | tRNA-splicing ligase complex(GO:0072669) |
| 2.4 | 43.2 | GO:0005736 | DNA-directed RNA polymerase I complex(GO:0005736) |
| 2.1 | 30.0 | GO:0035631 | CD40 receptor complex(GO:0035631) |
| 1.9 | 5.7 | GO:1990876 | cytoplasmic side of nuclear pore(GO:1990876) |
| 1.8 | 18.1 | GO:0097255 | R2TP complex(GO:0097255) |
| 1.5 | 12.1 | GO:0005610 | laminin-5 complex(GO:0005610) |
| 1.4 | 11.4 | GO:0032133 | chromosome passenger complex(GO:0032133) |
| 1.4 | 20.8 | GO:0017146 | NMDA selective glutamate receptor complex(GO:0017146) |
| 1.3 | 6.5 | GO:0045323 | interleukin-1 receptor complex(GO:0045323) |
| 1.3 | 5.1 | GO:0005863 | striated muscle myosin thick filament(GO:0005863) |
| 1.2 | 9.6 | GO:0042382 | paraspeckles(GO:0042382) |
| 1.1 | 5.6 | GO:0071008 | U2-type post-mRNA release spliceosomal complex(GO:0071008) |
| 1.0 | 3.1 | GO:0005873 | plus-end kinesin complex(GO:0005873) |
| 1.0 | 2.0 | GO:0051286 | growing cell tip(GO:0035838) cell tip(GO:0051286) |
| 1.0 | 11.5 | GO:0019773 | proteasome core complex, alpha-subunit complex(GO:0019773) |
| 0.9 | 64.3 | GO:0022627 | cytosolic small ribosomal subunit(GO:0022627) |
| 0.8 | 9.2 | GO:0000176 | nuclear exosome (RNase complex)(GO:0000176) |
| 0.8 | 9.8 | GO:0031616 | spindle pole centrosome(GO:0031616) |
| 0.8 | 5.6 | GO:0005956 | protein kinase CK2 complex(GO:0005956) |
| 0.8 | 3.8 | GO:0097179 | protease inhibitor complex(GO:0097179) |
| 0.6 | 8.9 | GO:0070578 | RISC-loading complex(GO:0070578) |
| 0.6 | 6.1 | GO:0097413 | Lewy body(GO:0097413) |
| 0.6 | 2.2 | GO:0031436 | BRCA1-BARD1 complex(GO:0031436) |
| 0.5 | 6.9 | GO:0042575 | DNA polymerase complex(GO:0042575) |
| 0.5 | 8.5 | GO:0032433 | filopodium tip(GO:0032433) |
| 0.5 | 4.1 | GO:0032039 | integrator complex(GO:0032039) |
| 0.4 | 3.1 | GO:1990726 | Lsm1-7-Pat1 complex(GO:1990726) |
| 0.4 | 4.5 | GO:0008250 | oligosaccharyltransferase complex(GO:0008250) |
| 0.4 | 2.6 | GO:0035032 | phosphatidylinositol 3-kinase complex, class III(GO:0035032) |
| 0.3 | 27.4 | GO:0012507 | ER to Golgi transport vesicle membrane(GO:0012507) |
| 0.3 | 9.0 | GO:0031528 | microvillus membrane(GO:0031528) |
| 0.3 | 7.5 | GO:0000314 | organellar small ribosomal subunit(GO:0000314) mitochondrial small ribosomal subunit(GO:0005763) |
| 0.3 | 16.4 | GO:0031463 | Cul3-RING ubiquitin ligase complex(GO:0031463) |
| 0.3 | 3.8 | GO:0030478 | actin cap(GO:0030478) |
| 0.2 | 3.1 | GO:0044754 | autolysosome(GO:0044754) |
| 0.2 | 23.3 | GO:0022625 | cytosolic large ribosomal subunit(GO:0022625) |
| 0.2 | 1.7 | GO:0005916 | fascia adherens(GO:0005916) |
| 0.2 | 4.7 | GO:0032982 | myosin filament(GO:0032982) |
| 0.2 | 22.6 | GO:0005882 | intermediate filament(GO:0005882) |
| 0.2 | 10.0 | GO:0031907 | peroxisomal matrix(GO:0005782) microbody lumen(GO:0031907) |
| 0.2 | 5.5 | GO:0005753 | mitochondrial proton-transporting ATP synthase complex(GO:0005753) |
| 0.2 | 10.9 | GO:0045178 | basal part of cell(GO:0045178) |
| 0.2 | 0.9 | GO:1902560 | GMP reductase complex(GO:1902560) |
| 0.1 | 3.9 | GO:0071682 | endocytic vesicle lumen(GO:0071682) |
| 0.1 | 3.1 | GO:0000242 | pericentriolar material(GO:0000242) |
| 0.1 | 8.3 | GO:0045271 | mitochondrial respiratory chain complex I(GO:0005747) NADH dehydrogenase complex(GO:0030964) respiratory chain complex I(GO:0045271) |
| 0.1 | 1.7 | GO:0005859 | muscle myosin complex(GO:0005859) |
| 0.1 | 10.9 | GO:0071013 | catalytic step 2 spliceosome(GO:0071013) |
| 0.1 | 17.5 | GO:0090575 | RNA polymerase II transcription factor complex(GO:0090575) |
| 0.1 | 9.4 | GO:0005604 | basement membrane(GO:0005604) |
| 0.1 | 4.7 | GO:0045171 | intercellular bridge(GO:0045171) |
| 0.1 | 2.5 | GO:0032839 | dendrite cytoplasm(GO:0032839) |
| 0.1 | 12.4 | GO:0032993 | protein-DNA complex(GO:0032993) |
| 0.1 | 3.5 | GO:0009295 | nucleoid(GO:0009295) mitochondrial nucleoid(GO:0042645) |
| 0.1 | 6.1 | GO:0005791 | rough endoplasmic reticulum(GO:0005791) |
| 0.1 | 1.9 | GO:0030687 | preribosome, large subunit precursor(GO:0030687) |
| 0.1 | 1.3 | GO:0031143 | pseudopodium(GO:0031143) |
| 0.1 | 27.5 | GO:0005925 | focal adhesion(GO:0005925) |
| 0.1 | 9.7 | GO:1904813 | ficolin-1-rich granule(GO:0101002) ficolin-1-rich granule lumen(GO:1904813) |
| 0.1 | 8.6 | GO:0048770 | melanosome(GO:0042470) pigment granule(GO:0048770) |
| 0.1 | 9.7 | GO:0019897 | extrinsic component of plasma membrane(GO:0019897) |
| 0.1 | 22.7 | GO:0016607 | nuclear speck(GO:0016607) |
| 0.0 | 2.3 | GO:0055038 | recycling endosome membrane(GO:0055038) |
| 0.0 | 7.5 | GO:0005741 | mitochondrial outer membrane(GO:0005741) |
| 0.0 | 3.8 | GO:0016605 | PML body(GO:0016605) |
| 0.0 | 1.3 | GO:0030660 | Golgi-associated vesicle membrane(GO:0030660) |
| 0.0 | 3.1 | GO:0031410 | cytoplasmic vesicle(GO:0031410) |
| 0.0 | 5.1 | GO:0072562 | blood microparticle(GO:0072562) |
| 0.0 | 1.0 | GO:0005762 | organellar large ribosomal subunit(GO:0000315) mitochondrial large ribosomal subunit(GO:0005762) |
| 0.0 | 6.5 | GO:0000790 | nuclear chromatin(GO:0000790) |
| 0.0 | 1.7 | GO:0030315 | T-tubule(GO:0030315) |
| 0.0 | 0.8 | GO:0001533 | cornified envelope(GO:0001533) |
| 0.0 | 0.6 | GO:0034364 | high-density lipoprotein particle(GO:0034364) |
| 0.0 | 0.4 | GO:0031105 | septin complex(GO:0031105) |
| 0.0 | 1.4 | GO:0034707 | chloride channel complex(GO:0034707) |
| 0.0 | 5.6 | GO:0016324 | apical plasma membrane(GO:0016324) |
| 0.0 | 1.0 | GO:0035580 | specific granule lumen(GO:0035580) |
| 0.0 | 1.7 | GO:0005643 | nuclear pore(GO:0005643) |
Gene overrepresentation in molecular_function category:
| Log-likelihood per target | Total log-likelihood | Term | Description |
|---|---|---|---|
| 5.8 | 23.4 | GO:0034988 | Fc-gamma receptor I complex binding(GO:0034988) |
| 4.6 | 13.8 | GO:0004962 | endothelin receptor activity(GO:0004962) |
| 3.2 | 16.1 | GO:0002046 | opsin binding(GO:0002046) |
| 3.2 | 9.6 | GO:0000033 | alpha-1,3-mannosyltransferase activity(GO:0000033) |
| 3.0 | 18.1 | GO:0043141 | ATP-dependent 5'-3' DNA helicase activity(GO:0043141) |
| 3.0 | 11.8 | GO:0004743 | pyruvate kinase activity(GO:0004743) |
| 2.7 | 18.9 | GO:0004673 | protein histidine kinase activity(GO:0004673) |
| 2.6 | 44.7 | GO:0008494 | translation activator activity(GO:0008494) |
| 2.5 | 12.6 | GO:0004656 | procollagen-proline 4-dioxygenase activity(GO:0004656) procollagen-proline dioxygenase activity(GO:0019798) |
| 2.4 | 43.2 | GO:0001054 | RNA polymerase I activity(GO:0001054) |
| 2.4 | 7.2 | GO:0035529 | 8-oxo-7,8-dihydroguanosine triphosphate pyrophosphatase activity(GO:0008413) NADH pyrophosphatase activity(GO:0035529) 8-oxo-7,8-dihydrodeoxyguanosine triphosphate pyrophosphatase activity(GO:0035539) |
| 2.3 | 11.7 | GO:0043023 | ribosomal large subunit binding(GO:0043023) |
| 2.3 | 11.3 | GO:0047844 | deoxycytidine deaminase activity(GO:0047844) |
| 2.3 | 9.0 | GO:0034186 | apolipoprotein A-I binding(GO:0034186) |
| 1.4 | 14.9 | GO:0031995 | insulin-like growth factor II binding(GO:0031995) |
| 1.3 | 13.4 | GO:0005094 | Rho GDP-dissociation inhibitor activity(GO:0005094) |
| 1.2 | 5.8 | GO:0016427 | tRNA (cytosine) methyltransferase activity(GO:0016427) |
| 1.1 | 23.8 | GO:0000339 | RNA cap binding(GO:0000339) |
| 1.0 | 8.3 | GO:0043140 | ATP-dependent 3'-5' DNA helicase activity(GO:0043140) |
| 1.0 | 3.1 | GO:0016215 | stearoyl-CoA 9-desaturase activity(GO:0004768) acyl-CoA desaturase activity(GO:0016215) |
| 1.0 | 13.3 | GO:0008429 | phosphatidylethanolamine binding(GO:0008429) |
| 1.0 | 8.9 | GO:0070883 | pre-miRNA binding(GO:0070883) |
| 0.9 | 4.7 | GO:0008479 | queuine tRNA-ribosyltransferase activity(GO:0008479) |
| 0.8 | 3.2 | GO:0033743 | peptide-methionine (R)-S-oxide reductase activity(GO:0033743) |
| 0.7 | 20.7 | GO:0000993 | RNA polymerase II core binding(GO:0000993) |
| 0.7 | 17.6 | GO:0035259 | glucocorticoid receptor binding(GO:0035259) |
| 0.6 | 14.5 | GO:0055103 | ligase regulator activity(GO:0055103) |
| 0.6 | 1.9 | GO:0008097 | 5S rRNA binding(GO:0008097) |
| 0.6 | 3.6 | GO:0050291 | sphingosine N-acyltransferase activity(GO:0050291) |
| 0.6 | 4.0 | GO:0015186 | L-glutamine transmembrane transporter activity(GO:0015186) |
| 0.6 | 8.5 | GO:0035256 | G-protein coupled glutamate receptor binding(GO:0035256) |
| 0.6 | 8.5 | GO:0034450 | ubiquitin-ubiquitin ligase activity(GO:0034450) |
| 0.6 | 19.7 | GO:0017134 | fibroblast growth factor binding(GO:0017134) |
| 0.5 | 10.9 | GO:0008266 | poly(U) RNA binding(GO:0008266) |
| 0.5 | 5.7 | GO:0005049 | nuclear export signal receptor activity(GO:0005049) |
| 0.5 | 6.1 | GO:0008199 | ferric iron binding(GO:0008199) |
| 0.5 | 14.0 | GO:0004602 | glutathione peroxidase activity(GO:0004602) |
| 0.4 | 4.5 | GO:0004579 | dolichyl-diphosphooligosaccharide-protein glycotransferase activity(GO:0004579) |
| 0.4 | 10.9 | GO:0000400 | four-way junction DNA binding(GO:0000400) |
| 0.4 | 1.3 | GO:0031896 | V2 vasopressin receptor binding(GO:0031896) |
| 0.4 | 5.1 | GO:0030957 | Tat protein binding(GO:0030957) |
| 0.4 | 11.5 | GO:0070003 | threonine-type endopeptidase activity(GO:0004298) threonine-type peptidase activity(GO:0070003) |
| 0.4 | 10.0 | GO:0071949 | FAD binding(GO:0071949) |
| 0.4 | 18.9 | GO:0051539 | 4 iron, 4 sulfur cluster binding(GO:0051539) |
| 0.3 | 6.5 | GO:0005149 | interleukin-1 receptor binding(GO:0005149) |
| 0.3 | 4.5 | GO:0031957 | very long-chain fatty acid-CoA ligase activity(GO:0031957) |
| 0.3 | 3.8 | GO:0045159 | myosin II binding(GO:0045159) |
| 0.3 | 2.5 | GO:0004000 | adenosine deaminase activity(GO:0004000) |
| 0.3 | 21.3 | GO:0048365 | Rac GTPase binding(GO:0048365) |
| 0.3 | 1.9 | GO:0003680 | AT DNA binding(GO:0003680) |
| 0.3 | 1.7 | GO:0086075 | gap junction channel activity involved in cardiac conduction electrical coupling(GO:0086075) |
| 0.3 | 3.8 | GO:0050700 | CARD domain binding(GO:0050700) |
| 0.3 | 3.9 | GO:0019707 | protein-cysteine S-palmitoyltransferase activity(GO:0019706) protein-cysteine S-acyltransferase activity(GO:0019707) |
| 0.3 | 15.4 | GO:0005160 | transforming growth factor beta receptor binding(GO:0005160) |
| 0.3 | 9.2 | GO:0017091 | 3'-5'-exoribonuclease activity(GO:0000175) AU-rich element binding(GO:0017091) |
| 0.3 | 43.4 | GO:0001078 | transcriptional repressor activity, RNA polymerase II core promoter proximal region sequence-specific binding(GO:0001078) |
| 0.2 | 10.4 | GO:0001205 | transcriptional activator activity, RNA polymerase II distal enhancer sequence-specific binding(GO:0001205) |
| 0.2 | 5.5 | GO:0046933 | proton-transporting ATP synthase activity, rotational mechanism(GO:0046933) |
| 0.2 | 4.7 | GO:0030898 | actin-dependent ATPase activity(GO:0030898) |
| 0.2 | 0.6 | GO:0017129 | triglyceride binding(GO:0017129) |
| 0.2 | 2.9 | GO:0005229 | intracellular calcium activated chloride channel activity(GO:0005229) |
| 0.2 | 2.8 | GO:0031435 | mitogen-activated protein kinase kinase kinase binding(GO:0031435) |
| 0.2 | 8.3 | GO:0050136 | NADH dehydrogenase (ubiquinone) activity(GO:0008137) NADH dehydrogenase (quinone) activity(GO:0050136) |
| 0.2 | 10.5 | GO:0003743 | translation initiation factor activity(GO:0003743) |
| 0.2 | 2.0 | GO:0043295 | glutathione binding(GO:0043295) |
| 0.2 | 0.9 | GO:0003920 | GMP reductase activity(GO:0003920) oxidoreductase activity, acting on NAD(P)H, nitrogenous group as acceptor(GO:0016657) |
| 0.2 | 3.1 | GO:0070530 | K63-linked polyubiquitin binding(GO:0070530) |
| 0.2 | 3.1 | GO:0004549 | tRNA-specific ribonuclease activity(GO:0004549) |
| 0.1 | 6.3 | GO:0008536 | Ran GTPase binding(GO:0008536) |
| 0.1 | 31.8 | GO:0003735 | structural constituent of ribosome(GO:0003735) |
| 0.1 | 6.2 | GO:0061631 | ubiquitin conjugating enzyme activity(GO:0061631) |
| 0.1 | 0.7 | GO:0070576 | vitamin D 24-hydroxylase activity(GO:0070576) |
| 0.1 | 2.4 | GO:0032454 | histone demethylase activity (H3-K9 specific)(GO:0032454) |
| 0.1 | 1.4 | GO:0022820 | potassium:chloride symporter activity(GO:0015379) potassium ion symporter activity(GO:0022820) |
| 0.1 | 1.7 | GO:0004653 | polypeptide N-acetylgalactosaminyltransferase activity(GO:0004653) |
| 0.1 | 6.1 | GO:0042379 | chemokine receptor binding(GO:0042379) |
| 0.1 | 3.9 | GO:0042056 | chemoattractant activity(GO:0042056) |
| 0.1 | 2.3 | GO:0070300 | phosphatidic acid binding(GO:0070300) |
| 0.1 | 1.3 | GO:0045294 | alpha-catenin binding(GO:0045294) |
| 0.1 | 3.1 | GO:0003950 | NAD+ ADP-ribosyltransferase activity(GO:0003950) |
| 0.1 | 6.1 | GO:0004004 | ATP-dependent RNA helicase activity(GO:0004004) RNA-dependent ATPase activity(GO:0008186) |
| 0.1 | 1.7 | GO:0008139 | nuclear localization sequence binding(GO:0008139) |
| 0.1 | 0.3 | GO:0051021 | GDP-dissociation inhibitor binding(GO:0051021) Rho GDP-dissociation inhibitor binding(GO:0051022) |
| 0.1 | 8.6 | GO:0051087 | chaperone binding(GO:0051087) |
| 0.1 | 3.4 | GO:0043027 | cysteine-type endopeptidase inhibitor activity involved in apoptotic process(GO:0043027) |
| 0.1 | 1.0 | GO:0008252 | nucleotidase activity(GO:0008252) |
| 0.1 | 2.2 | GO:0004869 | cysteine-type endopeptidase inhibitor activity(GO:0004869) |
| 0.1 | 9.5 | GO:0005200 | structural constituent of cytoskeleton(GO:0005200) |
| 0.1 | 2.2 | GO:0050681 | androgen receptor binding(GO:0050681) |
| 0.0 | 2.8 | GO:0005507 | copper ion binding(GO:0005507) |
| 0.0 | 2.9 | GO:0030374 | ligand-dependent nuclear receptor transcription coactivator activity(GO:0030374) |
| 0.0 | 0.2 | GO:0052740 | 1-acyl-2-lysophosphatidylserine acylhydrolase activity(GO:0052740) |
| 0.0 | 4.5 | GO:0001227 | transcriptional repressor activity, RNA polymerase II transcription regulatory region sequence-specific binding(GO:0001227) |
| 0.0 | 2.6 | GO:0008307 | structural constituent of muscle(GO:0008307) |
| 0.0 | 7.4 | GO:0003714 | transcription corepressor activity(GO:0003714) |
| 0.0 | 0.5 | GO:0070577 | lysine-acetylated histone binding(GO:0070577) |
| 0.0 | 5.6 | GO:0019887 | protein kinase regulator activity(GO:0019887) |
| 0.0 | 3.6 | GO:0005178 | integrin binding(GO:0005178) |
| 0.0 | 16.4 | GO:0005509 | calcium ion binding(GO:0005509) |
| 0.0 | 2.0 | GO:0005262 | calcium channel activity(GO:0005262) |
| 0.0 | 0.8 | GO:0005164 | tumor necrosis factor receptor binding(GO:0005164) |
| 0.0 | 1.4 | GO:0005254 | chloride channel activity(GO:0005254) |
| 0.0 | 1.3 | GO:0005070 | SH3/SH2 adaptor activity(GO:0005070) |
| 0.0 | 4.1 | GO:0004842 | ubiquitin-protein transferase activity(GO:0004842) |
| 0.0 | 1.0 | GO:0030165 | PDZ domain binding(GO:0030165) |
| 0.0 | 1.0 | GO:0004519 | endonuclease activity(GO:0004519) |
Gene overrepresentation in C2:CP category:
| Log-likelihood per target | Total log-likelihood | Term | Description |
|---|---|---|---|
| 0.7 | 18.9 | PID ARF6 DOWNSTREAM PATHWAY | Arf6 downstream pathway |
| 0.5 | 12.1 | PID INTEGRIN4 PATHWAY | Alpha6 beta4 integrin-ligand interactions |
| 0.5 | 22.0 | PID WNT NONCANONICAL PATHWAY | Noncanonical Wnt signaling pathway |
| 0.5 | 51.2 | PID CASPASE PATHWAY | Caspase cascade in apoptosis |
| 0.4 | 28.2 | PID P38 ALPHA BETA DOWNSTREAM PATHWAY | Signaling mediated by p38-alpha and p38-beta |
| 0.4 | 60.3 | PID P53 DOWNSTREAM PATHWAY | Direct p53 effectors |
| 0.4 | 18.0 | PID MYC PATHWAY | C-MYC pathway |
| 0.3 | 25.4 | PID TAP63 PATHWAY | Validated transcriptional targets of TAp63 isoforms |
| 0.3 | 13.9 | PID BARD1 PATHWAY | BARD1 signaling events |
| 0.3 | 13.8 | PID ARF6 TRAFFICKING PATHWAY | Arf6 trafficking events |
| 0.2 | 8.9 | PID CERAMIDE PATHWAY | Ceramide signaling pathway |
| 0.2 | 21.7 | PID CDC42 PATHWAY | CDC42 signaling events |
| 0.2 | 7.5 | PID TRAIL PATHWAY | TRAIL signaling pathway |
| 0.2 | 13.2 | PID LYSOPHOSPHOLIPID PATHWAY | LPA receptor mediated events |
| 0.2 | 1.0 | SA PTEN PATHWAY | PTEN is a tumor suppressor that dephosphorylates the lipid messenger phosphatidylinositol triphosphate. |
| 0.2 | 3.9 | PID TOLL ENDOGENOUS PATHWAY | Endogenous TLR signaling |
| 0.2 | 12.7 | PID P73PATHWAY | p73 transcription factor network |
| 0.1 | 3.1 | PID TNF PATHWAY | TNF receptor signaling pathway |
| 0.1 | 5.7 | PID NFAT 3PATHWAY | Role of Calcineurin-dependent NFAT signaling in lymphocytes |
| 0.1 | 1.3 | PID IL8 CXCR1 PATHWAY | IL8- and CXCR1-mediated signaling events |
| 0.1 | 5.4 | ST INTEGRIN SIGNALING PATHWAY | Integrin Signaling Pathway |
| 0.1 | 3.9 | PID AURORA B PATHWAY | Aurora B signaling |
| 0.0 | 1.7 | PID FRA PATHWAY | Validated transcriptional targets of AP1 family members Fra1 and Fra2 |
| 0.0 | 0.7 | ST PHOSPHOINOSITIDE 3 KINASE PATHWAY | PI3K Pathway |
| 0.0 | 1.3 | PID MET PATHWAY | Signaling events mediated by Hepatocyte Growth Factor Receptor (c-Met) |
| 0.0 | 4.8 | NABA ECM GLYCOPROTEINS | Genes encoding structural ECM glycoproteins |
Gene overrepresentation in C2:CP:REACTOME category:
| Log-likelihood per target | Total log-likelihood | Term | Description |
|---|---|---|---|
| 1.9 | 43.2 | REACTOME RNA POL III CHAIN ELONGATION | Genes involved in RNA Polymerase III Chain Elongation |
| 1.3 | 14.0 | REACTOME PURINE CATABOLISM | Genes involved in Purine catabolism |
| 1.0 | 9.2 | REACTOME MRNA DECAY BY 3 TO 5 EXORIBONUCLEASE | Genes involved in mRNA Decay by 3' to 5' Exoribonuclease |
| 0.8 | 59.4 | REACTOME FORMATION OF THE TERNARY COMPLEX AND SUBSEQUENTLY THE 43S COMPLEX | Genes involved in Formation of the ternary complex, and subsequently, the 43S complex |
| 0.7 | 37.6 | REACTOME INTRINSIC PATHWAY FOR APOPTOSIS | Genes involved in Intrinsic Pathway for Apoptosis |
| 0.6 | 14.9 | REACTOME REGULATION OF INSULIN LIKE GROWTH FACTOR IGF ACTIVITY BY INSULIN LIKE GROWTH FACTOR BINDING PROTEINS IGFBPS | Genes involved in Regulation of Insulin-like Growth Factor (IGF) Activity by Insulin-like Growth Factor Binding Proteins (IGFBPs) |
| 0.6 | 12.6 | REACTOME CHYLOMICRON MEDIATED LIPID TRANSPORT | Genes involved in Chylomicron-mediated lipid transport |
| 0.6 | 18.9 | REACTOME SYNTHESIS AND INTERCONVERSION OF NUCLEOTIDE DI AND TRIPHOSPHATES | Genes involved in Synthesis and interconversion of nucleotide di- and triphosphates |
| 0.5 | 9.6 | REACTOME HDL MEDIATED LIPID TRANSPORT | Genes involved in HDL-mediated lipid transport |
| 0.5 | 18.1 | REACTOME EXTENSION OF TELOMERES | Genes involved in Extension of Telomeres |
| 0.4 | 26.0 | REACTOME TRANSPORT TO THE GOLGI AND SUBSEQUENT MODIFICATION | Genes involved in Transport to the Golgi and subsequent modification |
| 0.4 | 10.5 | REACTOME SIGNALING BY HIPPO | Genes involved in Signaling by Hippo |
| 0.4 | 9.6 | REACTOME BIOSYNTHESIS OF THE N GLYCAN PRECURSOR DOLICHOL LIPID LINKED OLIGOSACCHARIDE LLO AND TRANSFER TO A NASCENT PROTEIN | Genes involved in Biosynthesis of the N-glycan precursor (dolichol lipid-linked oligosaccharide, LLO) and transfer to a nascent protein |
| 0.3 | 13.3 | REACTOME AMYLOIDS | Genes involved in Amyloids |
| 0.3 | 3.8 | REACTOME THE NLRP3 INFLAMMASOME | Genes involved in The NLRP3 inflammasome |
| 0.3 | 10.0 | REACTOME PEROXISOMAL LIPID METABOLISM | Genes involved in Peroxisomal lipid metabolism |
| 0.3 | 7.9 | REACTOME INHIBITION OF THE PROTEOLYTIC ACTIVITY OF APC C REQUIRED FOR THE ONSET OF ANAPHASE BY MITOTIC SPINDLE CHECKPOINT COMPONENTS | Genes involved in Inhibition of the proteolytic activity of APC/C required for the onset of anaphase by mitotic spindle checkpoint components |
| 0.3 | 8.2 | REACTOME ADVANCED GLYCOSYLATION ENDPRODUCT RECEPTOR SIGNALING | Genes involved in Advanced glycosylation endproduct receptor signaling |
| 0.3 | 6.8 | REACTOME EXTRINSIC PATHWAY FOR APOPTOSIS | Genes involved in Extrinsic Pathway for Apoptosis |
| 0.3 | 2.6 | REACTOME SYNTHESIS OF PIPS AT THE LATE ENDOSOME MEMBRANE | Genes involved in Synthesis of PIPs at the late endosome membrane |
| 0.2 | 29.7 | REACTOME CELL JUNCTION ORGANIZATION | Genes involved in Cell junction organization |
| 0.2 | 5.5 | REACTOME FORMATION OF ATP BY CHEMIOSMOTIC COUPLING | Genes involved in Formation of ATP by chemiosmotic coupling |
| 0.2 | 3.1 | REACTOME P75NTR RECRUITS SIGNALLING COMPLEXES | Genes involved in p75NTR recruits signalling complexes |
| 0.2 | 7.1 | REACTOME SIGNALING BY NODAL | Genes involved in Signaling by NODAL |
| 0.2 | 23.3 | REACTOME PEPTIDE CHAIN ELONGATION | Genes involved in Peptide chain elongation |
| 0.2 | 3.8 | REACTOME CASPASE MEDIATED CLEAVAGE OF CYTOSKELETAL PROTEINS | Genes involved in Caspase-mediated cleavage of cytoskeletal proteins |
| 0.2 | 3.1 | REACTOME MRNA DECAY BY 5 TO 3 EXORIBONUCLEASE | Genes involved in mRNA Decay by 5' to 3' Exoribonuclease |
| 0.2 | 11.7 | REACTOME DEPOSITION OF NEW CENPA CONTAINING NUCLEOSOMES AT THE CENTROMERE | Genes involved in Deposition of New CENPA-containing Nucleosomes at the Centromere |
| 0.2 | 17.4 | REACTOME TRANSCRIPTIONAL REGULATION OF WHITE ADIPOCYTE DIFFERENTIATION | Genes involved in Transcriptional Regulation of White Adipocyte Differentiation |
| 0.2 | 11.5 | REACTOME AUTODEGRADATION OF CDH1 BY CDH1 APC C | Genes involved in Autodegradation of Cdh1 by Cdh1:APC/C |
| 0.2 | 8.5 | REACTOME NEGATIVE REGULATORS OF RIG I MDA5 SIGNALING | Genes involved in Negative regulators of RIG-I/MDA5 signaling |
| 0.1 | 5.7 | REACTOME NEP NS2 INTERACTS WITH THE CELLULAR EXPORT MACHINERY | Genes involved in NEP/NS2 Interacts with the Cellular Export Machinery |
| 0.1 | 20.5 | REACTOME MRNA SPLICING | Genes involved in mRNA Splicing |
| 0.1 | 3.4 | REACTOME PURINE SALVAGE | Genes involved in Purine salvage |
| 0.1 | 2.2 | REACTOME HOMOLOGOUS RECOMBINATION REPAIR OF REPLICATION INDEPENDENT DOUBLE STRAND BREAKS | Genes involved in Homologous recombination repair of replication-independent double-strand breaks |
| 0.1 | 1.9 | REACTOME APOPTOSIS INDUCED DNA FRAGMENTATION | Genes involved in Apoptosis induced DNA fragmentation |
| 0.1 | 3.1 | REACTOME KINESINS | Genes involved in Kinesins |
| 0.1 | 4.6 | REACTOME ANTIVIRAL MECHANISM BY IFN STIMULATED GENES | Genes involved in Antiviral mechanism by IFN-stimulated genes |
| 0.1 | 1.3 | REACTOME RECYCLING PATHWAY OF L1 | Genes involved in Recycling pathway of L1 |
| 0.1 | 3.6 | REACTOME SPHINGOLIPID DE NOVO BIOSYNTHESIS | Genes involved in Sphingolipid de novo biosynthesis |
| 0.1 | 8.3 | REACTOME RESPIRATORY ELECTRON TRANSPORT | Genes involved in Respiratory electron transport |
| 0.1 | 4.0 | REACTOME AMINO ACID TRANSPORT ACROSS THE PLASMA MEMBRANE | Genes involved in Amino acid transport across the plasma membrane |
| 0.1 | 1.7 | REACTOME GAP JUNCTION DEGRADATION | Genes involved in Gap junction degradation |
| 0.1 | 6.1 | REACTOME METABOLISM OF VITAMINS AND COFACTORS | Genes involved in Metabolism of vitamins and cofactors |
| 0.1 | 6.9 | REACTOME DNA REPAIR | Genes involved in DNA Repair |
| 0.1 | 3.9 | REACTOME SIGNAL TRANSDUCTION BY L1 | Genes involved in Signal transduction by L1 |
| 0.1 | 3.9 | REACTOME MITOTIC PROMETAPHASE | Genes involved in Mitotic Prometaphase |
| 0.0 | 4.0 | REACTOME NUCLEAR RECEPTOR TRANSCRIPTION PATHWAY | Genes involved in Nuclear Receptor transcription pathway |
| 0.0 | 7.9 | REACTOME ANTIGEN PROCESSING UBIQUITINATION PROTEASOME DEGRADATION | Genes involved in Antigen processing: Ubiquitination & Proteasome degradation |
| 0.0 | 1.7 | REACTOME O LINKED GLYCOSYLATION OF MUCINS | Genes involved in O-linked glycosylation of mucins |
| 0.0 | 1.0 | REACTOME CYTOSOLIC SULFONATION OF SMALL MOLECULES | Genes involved in Cytosolic sulfonation of small molecules |
| 0.0 | 1.3 | REACTOME LYSOSOME VESICLE BIOGENESIS | Genes involved in Lysosome Vesicle Biogenesis |
| 0.0 | 1.1 | REACTOME GLUTATHIONE CONJUGATION | Genes involved in Glutathione conjugation |
| 0.0 | 0.7 | REACTOME STEROID HORMONES | Genes involved in Steroid hormones |
| 0.0 | 0.3 | REACTOME OTHER SEMAPHORIN INTERACTIONS | Genes involved in Other semaphorin interactions |