Project
GNF SymAtlas + NCI-60 cancer cell lines, comparison of cancers vs non-cancers, human (Su, 2004; Ross, 2000)
Navigation
Downloads
Results for UCACAUU
Z-value: 0.48
Motif logo

miRNA associated with seed UCACAUU
| Name | miRBASE accession |
|---|---|
|
hsa-miR-23a-3p
|
MIMAT0000078 |
|
hsa-miR-23b-3p
|
MIMAT0000418 |
|
hsa-miR-23c
|
MIMAT0018000 |
|
hsa-miR-130a-5p
|
MIMAT0004593 |
Activity profile of UCACAUU motif
Sorted Z-values of UCACAUU motif
| Promoter | Log-likelihood | Transcript | Gene | Gene Info |
|---|---|---|---|---|
| chr4_-_174256276 | 12.26 |
ENST00000296503.5
|
HMGB2
|
high mobility group box 2 |
| chr12_+_104682496 | 12.16 |
ENST00000378070.4
|
TXNRD1
|
thioredoxin reductase 1 |
| chr17_-_62658186 | 9.45 |
ENST00000262435.9
|
SMURF2
|
SMAD specific E3 ubiquitin protein ligase 2 |
| chr5_+_82767284 | 9.04 |
ENST00000265077.3
|
VCAN
|
versican |
| chr17_+_37026106 | 7.77 |
ENST00000318008.6
|
LASP1
|
LIM and SH3 protein 1 |
| chr12_-_76953284 | 7.76 |
ENST00000547544.1
ENST00000393249.2 |
OSBPL8
|
oxysterol binding protein-like 8 |
| chr5_+_162864575 | 7.61 |
ENST00000512163.1
ENST00000393929.1 ENST00000340828.2 ENST00000511683.2 ENST00000510097.1 ENST00000511490.2 ENST00000510664.1 |
CCNG1
|
cyclin G1 |
| chr12_-_46662772 | 7.23 |
ENST00000549049.1
ENST00000439706.1 ENST00000398637.5 |
SLC38A1
|
solute carrier family 38, member 1 |
| chr17_-_29151794 | 7.21 |
ENST00000324238.6
|
CRLF3
|
cytokine receptor-like factor 3 |
| chr5_+_65222299 | 6.61 |
ENST00000284037.5
|
ERBB2IP
|
erbb2 interacting protein |
| chr20_+_39657454 | 6.40 |
ENST00000361337.2
|
TOP1
|
topoisomerase (DNA) I |
| chr12_+_104324112 | 6.10 |
ENST00000299767.5
|
HSP90B1
|
heat shock protein 90kDa beta (Grp94), member 1 |
| chr14_-_64010046 | 6.08 |
ENST00000337537.3
|
PPP2R5E
|
protein phosphatase 2, regulatory subunit B', epsilon isoform |
| chr1_+_26798955 | 5.95 |
ENST00000361427.5
|
HMGN2
|
high mobility group nucleosomal binding domain 2 |
| chr3_-_182698381 | 5.89 |
ENST00000292782.4
|
DCUN1D1
|
DCN1, defective in cullin neddylation 1, domain containing 1 |
| chr8_+_126442563 | 5.77 |
ENST00000311922.3
|
TRIB1
|
tribbles pseudokinase 1 |
| chr3_-_113465065 | 5.59 |
ENST00000497255.1
ENST00000478020.1 ENST00000240922.3 ENST00000493900.1 |
NAA50
|
N(alpha)-acetyltransferase 50, NatE catalytic subunit |
| chr6_-_24721054 | 5.56 |
ENST00000378119.4
|
C6orf62
|
chromosome 6 open reading frame 62 |
| chr13_+_98605902 | 5.48 |
ENST00000460070.1
ENST00000481455.1 ENST00000261574.5 ENST00000493281.1 ENST00000463157.1 ENST00000471898.1 ENST00000489058.1 ENST00000481689.1 |
IPO5
|
importin 5 |
| chr6_+_119215308 | 5.44 |
ENST00000229595.5
|
ASF1A
|
anti-silencing function 1A histone chaperone |
| chr10_+_89622870 | 5.30 |
ENST00000371953.3
|
PTEN
|
phosphatase and tensin homolog |
| chr11_-_76091986 | 5.08 |
ENST00000260045.3
|
PRKRIR
|
protein-kinase, interferon-inducible double stranded RNA dependent inhibitor, repressor of (P58 repressor) |
| chr16_+_67596310 | 5.04 |
ENST00000264010.4
ENST00000401394.1 |
CTCF
|
CCCTC-binding factor (zinc finger protein) |
| chr1_+_112162381 | 5.00 |
ENST00000433097.1
ENST00000369709.3 ENST00000436150.2 |
RAP1A
|
RAP1A, member of RAS oncogene family |
| chr1_-_225615599 | 4.91 |
ENST00000421383.1
ENST00000272163.4 |
LBR
|
lamin B receptor |
| chrX_-_129244655 | 4.85 |
ENST00000335997.7
|
ELF4
|
E74-like factor 4 (ets domain transcription factor) |
| chr3_-_52713729 | 4.73 |
ENST00000296302.7
ENST00000356770.4 ENST00000337303.4 ENST00000409057.1 ENST00000410007.1 ENST00000409114.3 ENST00000409767.1 ENST00000423351.1 |
PBRM1
|
polybromo 1 |
| chr17_+_45608430 | 4.67 |
ENST00000322157.4
|
NPEPPS
|
aminopeptidase puromycin sensitive |
| chr8_-_103876965 | 4.61 |
ENST00000337198.5
|
AZIN1
|
antizyme inhibitor 1 |
| chr6_+_114178512 | 4.58 |
ENST00000368635.4
|
MARCKS
|
myristoylated alanine-rich protein kinase C substrate |
| chr11_+_32112431 | 4.47 |
ENST00000054950.3
|
RCN1
|
reticulocalbin 1, EF-hand calcium binding domain |
| chr5_-_157002775 | 4.45 |
ENST00000257527.4
|
ADAM19
|
ADAM metallopeptidase domain 19 |
| chr12_+_70636765 | 4.07 |
ENST00000552231.1
ENST00000229195.3 ENST00000547780.1 ENST00000418359.3 |
CNOT2
|
CCR4-NOT transcription complex, subunit 2 |
| chr2_-_175113301 | 3.96 |
ENST00000344357.5
ENST00000284719.3 |
OLA1
|
Obg-like ATPase 1 |
| chr2_-_200322723 | 3.90 |
ENST00000417098.1
|
SATB2
|
SATB homeobox 2 |
| chr14_+_103058948 | 3.89 |
ENST00000262241.6
|
RCOR1
|
REST corepressor 1 |
| chr3_+_196466710 | 3.88 |
ENST00000327134.3
|
PAK2
|
p21 protein (Cdc42/Rac)-activated kinase 2 |
| chr4_+_39699664 | 3.87 |
ENST00000261427.5
ENST00000510934.1 ENST00000295963.6 |
UBE2K
|
ubiquitin-conjugating enzyme E2K |
| chr10_+_1095416 | 3.86 |
ENST00000358220.1
|
WDR37
|
WD repeat domain 37 |
| chr4_-_185395672 | 3.72 |
ENST00000393593.3
|
IRF2
|
interferon regulatory factor 2 |
| chr4_-_40631859 | 3.71 |
ENST00000295971.7
ENST00000319592.4 |
RBM47
|
RNA binding motif protein 47 |
| chrX_+_21958674 | 3.63 |
ENST00000404933.2
|
SMS
|
spermine synthase |
| chr11_+_34073195 | 3.62 |
ENST00000341394.4
|
CAPRIN1
|
cell cycle associated protein 1 |
| chr10_+_93558069 | 3.62 |
ENST00000371627.4
|
TNKS2
|
tankyrase, TRF1-interacting ankyrin-related ADP-ribose polymerase 2 |
| chr12_-_10766184 | 3.58 |
ENST00000539554.1
ENST00000381881.2 ENST00000320756.2 |
MAGOHB
|
mago-nashi homolog B (Drosophila) |
| chr1_-_212004090 | 3.56 |
ENST00000366997.4
|
LPGAT1
|
lysophosphatidylglycerol acyltransferase 1 |
| chr10_+_81107216 | 3.50 |
ENST00000394579.3
ENST00000225174.3 |
PPIF
|
peptidylprolyl isomerase F |
| chr1_+_24286287 | 3.41 |
ENST00000334351.7
ENST00000374468.1 |
PNRC2
|
proline-rich nuclear receptor coactivator 2 |
| chr19_+_1026298 | 3.36 |
ENST00000263097.4
|
CNN2
|
calponin 2 |
| chr14_-_68141535 | 3.36 |
ENST00000554659.1
|
VTI1B
|
vesicle transport through interaction with t-SNAREs 1B |
| chr5_+_112312416 | 3.35 |
ENST00000389063.2
|
DCP2
|
decapping mRNA 2 |
| chr11_+_74660278 | 3.34 |
ENST00000263672.6
ENST00000530257.1 ENST00000526361.1 ENST00000532972.1 |
SPCS2
|
signal peptidase complex subunit 2 homolog (S. cerevisiae) |
| chr14_+_73525144 | 3.34 |
ENST00000261973.7
ENST00000540173.1 |
RBM25
|
RNA binding motif protein 25 |
| chr15_-_37390482 | 3.32 |
ENST00000559085.1
ENST00000397624.3 |
MEIS2
|
Meis homeobox 2 |
| chr10_-_120840309 | 3.32 |
ENST00000369144.3
|
EIF3A
|
eukaryotic translation initiation factor 3, subunit A |
| chr9_-_74383799 | 3.29 |
ENST00000377044.4
|
TMEM2
|
transmembrane protein 2 |
| chr10_+_11206925 | 3.27 |
ENST00000354440.2
ENST00000315874.4 ENST00000427450.1 |
CELF2
|
CUGBP, Elav-like family member 2 |
| chr1_-_205719295 | 3.16 |
ENST00000367142.4
|
NUCKS1
|
nuclear casein kinase and cyclin-dependent kinase substrate 1 |
| chr1_+_198126093 | 3.10 |
ENST00000367385.4
ENST00000442588.1 ENST00000538004.1 |
NEK7
|
NIMA-related kinase 7 |
| chr3_-_160283348 | 3.08 |
ENST00000334256.4
|
KPNA4
|
karyopherin alpha 4 (importin alpha 3) |
| chr7_+_27779714 | 3.07 |
ENST00000265393.6
ENST00000409980.1 ENST00000433216.2 ENST00000396319.2 |
TAX1BP1
|
Tax1 (human T-cell leukemia virus type I) binding protein 1 |
| chr9_+_110045537 | 3.05 |
ENST00000358015.3
|
RAD23B
|
RAD23 homolog B (S. cerevisiae) |
| chr9_-_127952032 | 3.05 |
ENST00000456642.1
ENST00000373546.3 ENST00000373547.4 |
PPP6C
|
protein phosphatase 6, catalytic subunit |
| chr6_-_16761678 | 2.98 |
ENST00000244769.4
ENST00000436367.1 |
ATXN1
|
ataxin 1 |
| chr20_+_31407692 | 2.98 |
ENST00000375571.5
|
MAPRE1
|
microtubule-associated protein, RP/EB family, member 1 |
| chr10_-_101989315 | 2.94 |
ENST00000370397.7
|
CHUK
|
conserved helix-loop-helix ubiquitous kinase |
| chr12_+_69004619 | 2.92 |
ENST00000250559.9
ENST00000393436.5 ENST00000425247.2 ENST00000489473.2 ENST00000422358.2 ENST00000541167.1 ENST00000538283.1 ENST00000341355.5 ENST00000537460.1 ENST00000450214.2 ENST00000545270.1 ENST00000538980.1 ENST00000542018.1 ENST00000543393.1 |
RAP1B
|
RAP1B, member of RAS oncogene family |
| chr17_-_40761375 | 2.87 |
ENST00000543197.1
ENST00000309428.5 |
FAM134C
|
family with sequence similarity 134, member C |
| chr4_+_140222609 | 2.79 |
ENST00000296543.5
ENST00000398947.1 |
NAA15
|
N(alpha)-acetyltransferase 15, NatA auxiliary subunit |
| chr2_-_10952922 | 2.74 |
ENST00000272227.3
|
PDIA6
|
protein disulfide isomerase family A, member 6 |
| chr6_+_15246501 | 2.73 |
ENST00000341776.2
|
JARID2
|
jumonji, AT rich interactive domain 2 |
| chr4_-_141677267 | 2.73 |
ENST00000442267.2
|
TBC1D9
|
TBC1 domain family, member 9 (with GRAM domain) |
| chr3_+_30648066 | 2.70 |
ENST00000359013.4
|
TGFBR2
|
transforming growth factor, beta receptor II (70/80kDa) |
| chr13_+_73302047 | 2.69 |
ENST00000377814.2
ENST00000377815.3 ENST00000390667.5 |
BORA
|
bora, aurora kinase A activator |
| chr4_+_17616253 | 2.67 |
ENST00000237380.7
|
MED28
|
mediator complex subunit 28 |
| chr1_-_150669500 | 2.67 |
ENST00000271732.3
|
GOLPH3L
|
golgi phosphoprotein 3-like |
| chr12_+_122242597 | 2.66 |
ENST00000267197.5
|
SETD1B
|
SET domain containing 1B |
| chr6_+_138188551 | 2.64 |
ENST00000237289.4
ENST00000433680.1 |
TNFAIP3
|
tumor necrosis factor, alpha-induced protein 3 |
| chr5_+_34656331 | 2.61 |
ENST00000265109.3
|
RAI14
|
retinoic acid induced 14 |
| chr6_-_82462425 | 2.60 |
ENST00000369754.3
ENST00000320172.6 ENST00000369756.3 |
FAM46A
|
family with sequence similarity 46, member A |
| chr8_+_20054878 | 2.58 |
ENST00000276390.2
ENST00000519667.1 |
ATP6V1B2
|
ATPase, H+ transporting, lysosomal 56/58kDa, V1 subunit B2 |
| chr12_+_66217911 | 2.51 |
ENST00000403681.2
|
HMGA2
|
high mobility group AT-hook 2 |
| chr1_-_245027833 | 2.50 |
ENST00000444376.2
|
HNRNPU
|
heterogeneous nuclear ribonucleoprotein U (scaffold attachment factor A) |
| chr1_-_114355083 | 2.50 |
ENST00000261441.5
|
RSBN1
|
round spermatid basic protein 1 |
| chr1_-_68962782 | 2.49 |
ENST00000456315.2
|
DEPDC1
|
DEP domain containing 1 |
| chr8_-_28243934 | 2.46 |
ENST00000521185.1
ENST00000520290.1 ENST00000344423.5 |
ZNF395
|
zinc finger protein 395 |
| chr10_-_65225722 | 2.44 |
ENST00000399251.1
|
JMJD1C
|
jumonji domain containing 1C |
| chr2_+_159313452 | 2.43 |
ENST00000389757.3
ENST00000389759.3 |
PKP4
|
plakophilin 4 |
| chrX_+_146993449 | 2.42 |
ENST00000218200.8
ENST00000370471.3 ENST00000370477.1 |
FMR1
|
fragile X mental retardation 1 |
| chr4_-_76598296 | 2.40 |
ENST00000395719.3
|
G3BP2
|
GTPase activating protein (SH3 domain) binding protein 2 |
| chr1_+_244214577 | 2.39 |
ENST00000358704.4
|
ZBTB18
|
zinc finger and BTB domain containing 18 |
| chr9_+_114423615 | 2.35 |
ENST00000374293.4
|
GNG10
|
guanine nucleotide binding protein (G protein), gamma 10 |
| chr4_-_140098339 | 2.33 |
ENST00000394235.2
|
ELF2
|
E74-like factor 2 (ets domain transcription factor) |
| chr9_+_36572851 | 2.26 |
ENST00000298048.2
ENST00000538311.1 ENST00000536987.1 ENST00000545008.1 ENST00000536860.1 ENST00000536329.1 ENST00000541717.1 ENST00000543751.1 |
MELK
|
maternal embryonic leucine zipper kinase |
| chr7_-_93520259 | 2.24 |
ENST00000222543.5
|
TFPI2
|
tissue factor pathway inhibitor 2 |
| chr8_+_26240414 | 2.23 |
ENST00000380629.2
|
BNIP3L
|
BCL2/adenovirus E1B 19kDa interacting protein 3-like |
| chr2_+_28974668 | 2.22 |
ENST00000296122.6
ENST00000395366.2 |
PPP1CB
|
protein phosphatase 1, catalytic subunit, beta isozyme |
| chr2_-_160472952 | 2.20 |
ENST00000541068.2
ENST00000355831.2 ENST00000343439.5 ENST00000392782.1 |
BAZ2B
|
bromodomain adjacent to zinc finger domain, 2B |
| chr4_-_102268628 | 2.20 |
ENST00000323055.6
ENST00000512215.1 ENST00000394854.3 |
PPP3CA
|
protein phosphatase 3, catalytic subunit, alpha isozyme |
| chr7_-_26240357 | 2.19 |
ENST00000354667.4
ENST00000356674.7 |
HNRNPA2B1
|
heterogeneous nuclear ribonucleoprotein A2/B1 |
| chr2_-_172017343 | 2.19 |
ENST00000431350.2
ENST00000360843.3 |
TLK1
|
tousled-like kinase 1 |
| chr3_+_152879985 | 2.18 |
ENST00000323534.2
|
RAP2B
|
RAP2B, member of RAS oncogene family |
| chr1_-_38325256 | 2.18 |
ENST00000373036.4
|
MTF1
|
metal-regulatory transcription factor 1 |
| chr7_+_114562172 | 2.16 |
ENST00000393486.1
ENST00000257724.3 |
MDFIC
|
MyoD family inhibitor domain containing |
| chr5_-_131826457 | 2.14 |
ENST00000437654.1
ENST00000245414.4 |
IRF1
|
interferon regulatory factor 1 |
| chr8_+_59465728 | 2.13 |
ENST00000260130.4
ENST00000422546.2 ENST00000447182.2 ENST00000413219.2 ENST00000424270.2 ENST00000523483.1 ENST00000520168.1 |
SDCBP
|
syndecan binding protein (syntenin) |
| chr14_+_60715928 | 2.10 |
ENST00000395076.4
|
PPM1A
|
protein phosphatase, Mg2+/Mn2+ dependent, 1A |
| chr7_-_123197733 | 2.09 |
ENST00000470123.1
ENST00000471770.1 |
NDUFA5
|
NADH dehydrogenase (ubiquinone) 1 alpha subcomplex, 5 |
| chr13_-_50367057 | 2.09 |
ENST00000261667.3
|
KPNA3
|
karyopherin alpha 3 (importin alpha 4) |
| chr7_+_99036543 | 2.09 |
ENST00000436336.2
ENST00000451876.1 ENST00000292476.5 |
CPSF4
|
cleavage and polyadenylation specific factor 4, 30kDa |
| chr1_-_108742957 | 2.06 |
ENST00000565488.1
|
SLC25A24
|
solute carrier family 25 (mitochondrial carrier; phosphate carrier), member 24 |
| chr5_-_176778523 | 2.04 |
ENST00000513877.1
ENST00000515209.1 ENST00000514458.1 ENST00000502560.1 |
LMAN2
|
lectin, mannose-binding 2 |
| chr3_+_69812877 | 2.03 |
ENST00000457080.1
ENST00000328528.6 |
MITF
|
microphthalmia-associated transcription factor |
| chr8_-_8751068 | 1.99 |
ENST00000276282.6
|
MFHAS1
|
malignant fibrous histiocytoma amplified sequence 1 |
| chr18_+_3451646 | 1.99 |
ENST00000345133.5
ENST00000330513.5 ENST00000549546.1 |
TGIF1
|
TGFB-induced factor homeobox 1 |
| chr1_-_205290865 | 1.99 |
ENST00000367157.3
|
NUAK2
|
NUAK family, SNF1-like kinase, 2 |
| chr4_+_154387480 | 1.97 |
ENST00000409663.3
ENST00000440693.1 ENST00000409959.3 |
KIAA0922
|
KIAA0922 |
| chr2_-_47168906 | 1.93 |
ENST00000444761.2
ENST00000409147.1 |
MCFD2
|
multiple coagulation factor deficiency 2 |
| chr7_-_93633684 | 1.91 |
ENST00000222547.3
ENST00000425626.1 |
BET1
|
Bet1 golgi vesicular membrane trafficking protein |
| chr18_+_9913977 | 1.90 |
ENST00000400000.2
ENST00000340541.4 |
VAPA
|
VAMP (vesicle-associated membrane protein)-associated protein A, 33kDa |
| chr1_-_65432171 | 1.89 |
ENST00000342505.4
|
JAK1
|
Janus kinase 1 |
| chr10_+_85899196 | 1.87 |
ENST00000372134.3
|
GHITM
|
growth hormone inducible transmembrane protein |
| chr3_-_72496035 | 1.86 |
ENST00000477973.2
|
RYBP
|
RING1 and YY1 binding protein |
| chr3_-_18466787 | 1.84 |
ENST00000338745.6
ENST00000450898.1 |
SATB1
|
SATB homeobox 1 |
| chr4_+_160188889 | 1.83 |
ENST00000264431.4
|
RAPGEF2
|
Rap guanine nucleotide exchange factor (GEF) 2 |
| chr4_-_24586140 | 1.82 |
ENST00000336812.4
|
DHX15
|
DEAH (Asp-Glu-Ala-His) box helicase 15 |
| chr4_-_103748880 | 1.81 |
ENST00000453744.2
ENST00000349311.8 |
UBE2D3
|
ubiquitin-conjugating enzyme E2D 3 |
| chr4_+_41937131 | 1.79 |
ENST00000504986.1
ENST00000508448.1 ENST00000513702.1 ENST00000325094.5 |
TMEM33
|
transmembrane protein 33 |
| chr14_+_55518349 | 1.72 |
ENST00000395468.4
|
MAPK1IP1L
|
mitogen-activated protein kinase 1 interacting protein 1-like |
| chr22_-_18111499 | 1.72 |
ENST00000413576.1
ENST00000399796.2 ENST00000399798.2 ENST00000253413.5 |
ATP6V1E1
|
ATPase, H+ transporting, lysosomal 31kDa, V1 subunit E1 |
| chr20_-_36156125 | 1.71 |
ENST00000397135.1
ENST00000397137.1 |
BLCAP
|
bladder cancer associated protein |
| chr10_+_93683519 | 1.70 |
ENST00000265990.6
|
BTAF1
|
BTAF1 RNA polymerase II, B-TFIID transcription factor-associated, 170kDa |
| chr17_-_40428359 | 1.66 |
ENST00000293328.3
|
STAT5B
|
signal transducer and activator of transcription 5B |
| chr17_+_57784826 | 1.64 |
ENST00000262291.4
|
VMP1
|
vacuole membrane protein 1 |
| chr3_-_133380731 | 1.64 |
ENST00000260810.5
|
TOPBP1
|
topoisomerase (DNA) II binding protein 1 |
| chr20_+_62371206 | 1.63 |
ENST00000266077.2
|
SLC2A4RG
|
SLC2A4 regulator |
| chrX_-_20284958 | 1.62 |
ENST00000379565.3
|
RPS6KA3
|
ribosomal protein S6 kinase, 90kDa, polypeptide 3 |
| chr10_-_99094458 | 1.59 |
ENST00000371019.2
|
FRAT2
|
frequently rearranged in advanced T-cell lymphomas 2 |
| chr1_-_86174065 | 1.56 |
ENST00000370574.3
ENST00000431532.2 |
ZNHIT6
|
zinc finger, HIT-type containing 6 |
| chr10_+_115438920 | 1.56 |
ENST00000429617.1
ENST00000369331.4 |
CASP7
|
caspase 7, apoptosis-related cysteine peptidase |
| chr6_+_110501344 | 1.56 |
ENST00000368932.1
|
CDC40
|
cell division cycle 40 |
| chr8_-_103668114 | 1.55 |
ENST00000285407.6
|
KLF10
|
Kruppel-like factor 10 |
| chr15_-_60690163 | 1.54 |
ENST00000558998.1
ENST00000560165.1 ENST00000557986.1 ENST00000559780.1 ENST00000559467.1 ENST00000559956.1 ENST00000332680.4 ENST00000396024.3 ENST00000421017.2 ENST00000560466.1 ENST00000558132.1 ENST00000559113.1 ENST00000557906.1 ENST00000558558.1 ENST00000560468.1 ENST00000559370.1 ENST00000558169.1 ENST00000559725.1 ENST00000558985.1 ENST00000451270.2 |
ANXA2
|
annexin A2 |
| chr14_+_39735411 | 1.54 |
ENST00000603904.1
|
RP11-407N17.3
|
cTAGE family member 5 isoform 4 |
| chr5_+_40679584 | 1.50 |
ENST00000302472.3
|
PTGER4
|
prostaglandin E receptor 4 (subtype EP4) |
| chr15_+_40532058 | 1.50 |
ENST00000260404.4
|
PAK6
|
p21 protein (Cdc42/Rac)-activated kinase 6 |
| chr17_-_3749515 | 1.49 |
ENST00000158149.3
ENST00000389005.4 |
C17orf85
|
chromosome 17 open reading frame 85 |
| chr3_+_107241783 | 1.47 |
ENST00000415149.2
ENST00000402543.1 ENST00000325805.8 ENST00000427402.1 |
BBX
|
bobby sox homolog (Drosophila) |
| chr13_-_30169807 | 1.47 |
ENST00000380752.5
|
SLC7A1
|
solute carrier family 7 (cationic amino acid transporter, y+ system), member 1 |
| chr2_-_209119831 | 1.47 |
ENST00000345146.2
|
IDH1
|
isocitrate dehydrogenase 1 (NADP+), soluble |
| chr1_+_36621529 | 1.46 |
ENST00000316156.4
|
MAP7D1
|
MAP7 domain containing 1 |
| chr2_-_153574480 | 1.46 |
ENST00000410080.1
|
PRPF40A
|
PRP40 pre-mRNA processing factor 40 homolog A (S. cerevisiae) |
| chrX_+_46433193 | 1.46 |
ENST00000276055.3
|
CHST7
|
carbohydrate (N-acetylglucosamine 6-O) sulfotransferase 7 |
| chr15_+_41709302 | 1.44 |
ENST00000389629.4
|
RTF1
|
Rtf1, Paf1/RNA polymerase II complex component, homolog (S. cerevisiae) |
| chr8_-_117886955 | 1.44 |
ENST00000297338.2
|
RAD21
|
RAD21 homolog (S. pombe) |
| chr7_+_116312411 | 1.43 |
ENST00000456159.1
ENST00000397752.3 ENST00000318493.6 |
MET
|
met proto-oncogene |
| chr1_+_93913713 | 1.41 |
ENST00000604705.1
ENST00000370253.2 |
FNBP1L
|
formin binding protein 1-like |
| chr22_+_38093005 | 1.38 |
ENST00000406386.3
|
TRIOBP
|
TRIO and F-actin binding protein |
| chr6_+_4021554 | 1.37 |
ENST00000337659.6
|
PRPF4B
|
pre-mRNA processing factor 4B |
| chr12_+_22778009 | 1.36 |
ENST00000266517.4
ENST00000335148.3 |
ETNK1
|
ethanolamine kinase 1 |
| chr4_-_140223670 | 1.36 |
ENST00000394228.1
ENST00000539387.1 |
NDUFC1
|
NADH dehydrogenase (ubiquinone) 1, subcomplex unknown, 1, 6kDa |
| chr8_+_86376081 | 1.34 |
ENST00000285379.5
|
CA2
|
carbonic anhydrase II |
| chr17_+_34900737 | 1.34 |
ENST00000304718.4
ENST00000485685.2 |
GGNBP2
|
gametogenetin binding protein 2 |
| chr10_+_60094735 | 1.31 |
ENST00000373910.4
|
UBE2D1
|
ubiquitin-conjugating enzyme E2D 1 |
| chr1_-_39339777 | 1.27 |
ENST00000397572.2
|
MYCBP
|
MYC binding protein |
| chr13_+_43597269 | 1.25 |
ENST00000379221.2
|
DNAJC15
|
DnaJ (Hsp40) homolog, subfamily C, member 15 |
| chr2_+_163200598 | 1.23 |
ENST00000437150.2
ENST00000453113.2 |
GCA
|
grancalcin, EF-hand calcium binding protein |
| chr10_+_99079008 | 1.22 |
ENST00000371021.3
|
FRAT1
|
frequently rearranged in advanced T-cell lymphomas |
| chr15_-_52861394 | 1.22 |
ENST00000563277.1
ENST00000566423.1 |
ARPP19
|
cAMP-regulated phosphoprotein, 19kDa |
| chr2_-_1748214 | 1.21 |
ENST00000433670.1
ENST00000425171.1 ENST00000252804.4 |
PXDN
|
peroxidasin homolog (Drosophila) |
| chr12_+_96588143 | 1.19 |
ENST00000228741.3
ENST00000547249.1 |
ELK3
|
ELK3, ETS-domain protein (SRF accessory protein 2) |
| chr8_+_61591337 | 1.18 |
ENST00000423902.2
|
CHD7
|
chromodomain helicase DNA binding protein 7 |
| chr6_+_89790490 | 1.18 |
ENST00000336032.3
|
PNRC1
|
proline-rich nuclear receptor coactivator 1 |
| chr11_+_124609823 | 1.17 |
ENST00000412681.2
|
NRGN
|
neurogranin (protein kinase C substrate, RC3) |
| chr2_+_120517174 | 1.15 |
ENST00000263708.2
|
PTPN4
|
protein tyrosine phosphatase, non-receptor type 4 (megakaryocyte) |
| chr16_-_48644061 | 1.13 |
ENST00000262384.3
|
N4BP1
|
NEDD4 binding protein 1 |
| chr8_+_37620097 | 1.13 |
ENST00000328195.3
ENST00000523358.1 ENST00000523187.1 |
PROSC
|
proline synthetase co-transcribed homolog (bacterial) |
| chr12_-_9102549 | 1.12 |
ENST00000000412.3
|
M6PR
|
mannose-6-phosphate receptor (cation dependent) |
| chr8_-_122653630 | 1.12 |
ENST00000303924.4
|
HAS2
|
hyaluronan synthase 2 |
| chr10_-_125851961 | 1.11 |
ENST00000346248.5
|
CHST15
|
carbohydrate (N-acetylgalactosamine 4-sulfate 6-O) sulfotransferase 15 |
| chr7_+_69064300 | 1.11 |
ENST00000342771.4
|
AUTS2
|
autism susceptibility candidate 2 |
| chr1_-_231560790 | 1.10 |
ENST00000366641.3
|
EGLN1
|
egl-9 family hypoxia-inducible factor 1 |
| chr7_+_5938351 | 1.10 |
ENST00000325974.6
|
CCZ1
|
CCZ1 vacuolar protein trafficking and biogenesis associated homolog (S. cerevisiae) |
| chr17_-_65241281 | 1.10 |
ENST00000358691.5
ENST00000580168.1 |
HELZ
|
helicase with zinc finger |
| chrX_-_132549506 | 1.06 |
ENST00000370828.3
|
GPC4
|
glypican 4 |
| chr8_+_64081118 | 1.06 |
ENST00000539294.1
|
YTHDF3
|
YTH domain family, member 3 |
| chr5_+_10353780 | 1.06 |
ENST00000449913.2
ENST00000503788.1 ENST00000274140.5 |
MARCH6
|
membrane-associated ring finger (C3HC4) 6, E3 ubiquitin protein ligase |
| chr17_+_28705921 | 1.05 |
ENST00000225719.4
|
CPD
|
carboxypeptidase D |
| chr17_-_62502639 | 1.04 |
ENST00000225792.5
ENST00000581697.1 ENST00000584279.1 ENST00000577922.1 |
DDX5
|
DEAD (Asp-Glu-Ala-Asp) box helicase 5 |
| chr11_+_86748863 | 1.04 |
ENST00000340353.7
|
TMEM135
|
transmembrane protein 135 |
| chr12_+_111843749 | 1.04 |
ENST00000341259.2
|
SH2B3
|
SH2B adaptor protein 3 |
| chr8_+_95653373 | 1.03 |
ENST00000358397.5
|
ESRP1
|
epithelial splicing regulatory protein 1 |
| chr10_+_43633914 | 1.03 |
ENST00000374466.3
ENST00000374464.1 |
CSGALNACT2
|
chondroitin sulfate N-acetylgalactosaminyltransferase 2 |
| chrX_-_109561294 | 1.03 |
ENST00000372059.2
ENST00000262844.5 |
AMMECR1
|
Alport syndrome, mental retardation, midface hypoplasia and elliptocytosis chromosomal region gene 1 |
| chr16_-_89007491 | 1.02 |
ENST00000327483.5
ENST00000564416.1 |
CBFA2T3
|
core-binding factor, runt domain, alpha subunit 2; translocated to, 3 |
| chr4_-_74124502 | 1.01 |
ENST00000358602.4
ENST00000330838.6 ENST00000561029.1 |
ANKRD17
|
ankyrin repeat domain 17 |
| chr6_+_143929307 | 1.01 |
ENST00000427704.2
ENST00000305766.6 |
PHACTR2
|
phosphatase and actin regulator 2 |
| chr16_-_46723066 | 1.01 |
ENST00000299138.7
|
VPS35
|
vacuolar protein sorting 35 homolog (S. cerevisiae) |
| chr4_+_129730779 | 0.98 |
ENST00000226319.6
|
PHF17
|
jade family PHD finger 1 |
| chr18_+_60190226 | 0.98 |
ENST00000269499.5
|
ZCCHC2
|
zinc finger, CCHC domain containing 2 |
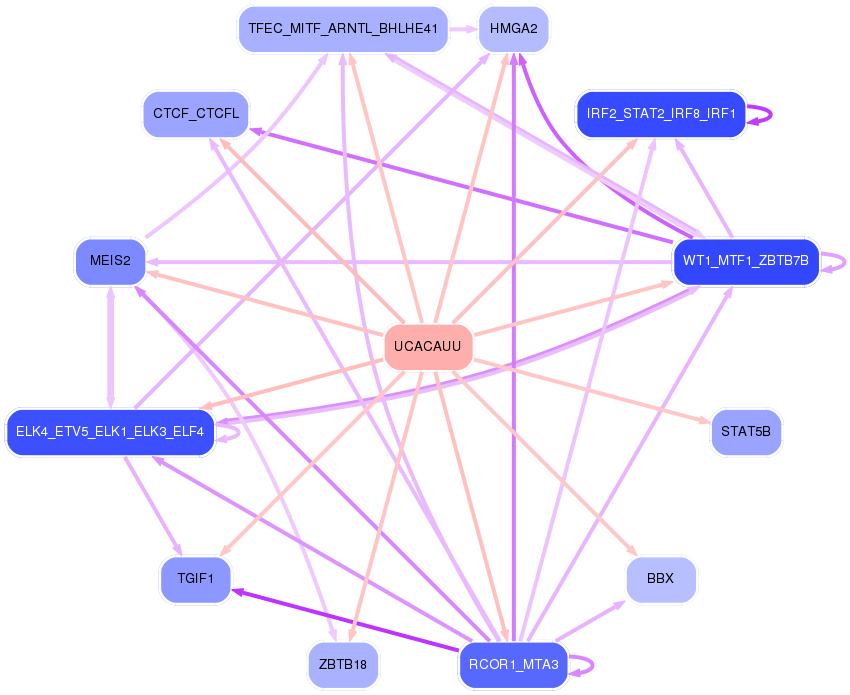
Network of associatons between targets according to the STRING database.

First level regulatory network of UCACAUU
Gene Ontology Analysis
Gene overrepresentation in biological_process category:
| Log-likelihood per target | Total log-likelihood | Term | Description |
|---|---|---|---|
| 2.4 | 9.5 | GO:1901165 | positive regulation of trophoblast cell migration(GO:1901165) |
| 1.9 | 5.8 | GO:0045658 | regulation of eosinophil differentiation(GO:0045643) positive regulation of eosinophil differentiation(GO:0045645) regulation of neutrophil differentiation(GO:0045658) negative regulation of neutrophil differentiation(GO:0045659) |
| 1.7 | 5.0 | GO:0070602 | regulation of centromeric sister chromatid cohesion(GO:0070602) |
| 1.7 | 5.0 | GO:0097327 | response to antineoplastic agent(GO:0097327) |
| 1.4 | 12.2 | GO:0001887 | selenium compound metabolic process(GO:0001887) |
| 1.3 | 5.3 | GO:1903984 | positive regulation of TRAIL-activated apoptotic signaling pathway(GO:1903984) |
| 1.2 | 12.3 | GO:0045654 | positive regulation of megakaryocyte differentiation(GO:0045654) |
| 1.2 | 3.6 | GO:0006597 | spermine biosynthetic process(GO:0006597) |
| 1.2 | 3.6 | GO:0070213 | protein auto-ADP-ribosylation(GO:0070213) |
| 1.2 | 3.5 | GO:1902445 | regulation of mitochondrial membrane permeability involved in programmed necrotic cell death(GO:1902445) negative regulation of oxidative phosphorylation uncoupler activity(GO:2000276) |
| 1.2 | 4.6 | GO:0033387 | putrescine biosynthetic process from ornithine(GO:0033387) |
| 1.1 | 5.6 | GO:0070601 | centromeric sister chromatid cohesion(GO:0070601) |
| 1.1 | 7.8 | GO:0090204 | protein localization to nuclear pore(GO:0090204) |
| 1.1 | 3.3 | GO:0002188 | formation of cytoplasmic translation initiation complex(GO:0001732) translation reinitiation(GO:0002188) |
| 1.0 | 3.0 | GO:1903033 | regulation of microtubule plus-end binding(GO:1903031) positive regulation of microtubule plus-end binding(GO:1903033) |
| 0.9 | 2.7 | GO:0002661 | B cell tolerance induction(GO:0002514) regulation of B cell tolerance induction(GO:0002661) positive regulation of B cell tolerance induction(GO:0002663) |
| 0.9 | 2.6 | GO:0034146 | B-1 B cell homeostasis(GO:0001922) toll-like receptor 5 signaling pathway(GO:0034146) regulation of nucleotide-binding oligomerization domain containing 1 signaling pathway(GO:0070428) |
| 0.8 | 2.5 | GO:0003131 | mesodermal-endodermal cell signaling(GO:0003131) programmed DNA elimination(GO:0031049) chromosome breakage(GO:0031052) histone H2A-S139 phosphorylation(GO:0035978) positive regulation of cellular response to X-ray(GO:2000685) |
| 0.8 | 3.2 | GO:0019046 | release from viral latency(GO:0019046) |
| 0.8 | 5.3 | GO:0048280 | vesicle fusion with Golgi apparatus(GO:0048280) |
| 0.7 | 2.2 | GO:1905205 | positive regulation of connective tissue replacement(GO:1905205) |
| 0.7 | 2.9 | GO:2001271 | negative regulation of cysteine-type endopeptidase activity involved in execution phase of apoptosis(GO:2001271) |
| 0.7 | 3.3 | GO:0000290 | deadenylation-dependent decapping of nuclear-transcribed mRNA(GO:0000290) |
| 0.6 | 1.9 | GO:0044828 | negative regulation by host of viral genome replication(GO:0044828) |
| 0.6 | 3.7 | GO:0016554 | cytidine to uridine editing(GO:0016554) |
| 0.6 | 1.8 | GO:0048022 | negative regulation of melanin biosynthetic process(GO:0048022) negative regulation of secondary metabolite biosynthetic process(GO:1900377) |
| 0.6 | 2.4 | GO:2000301 | negative regulation of synaptic vesicle exocytosis(GO:2000301) |
| 0.6 | 5.4 | GO:0031936 | negative regulation of chromatin silencing(GO:0031936) |
| 0.6 | 1.8 | GO:1903371 | regulation of endoplasmic reticulum tubular network organization(GO:1903371) |
| 0.6 | 4.1 | GO:0010606 | positive regulation of cytoplasmic mRNA processing body assembly(GO:0010606) |
| 0.6 | 4.6 | GO:0031087 | deadenylation-independent decapping of nuclear-transcribed mRNA(GO:0031087) |
| 0.6 | 1.1 | GO:0030820 | regulation of cyclic nucleotide catabolic process(GO:0030805) regulation of cAMP catabolic process(GO:0030820) regulation of purine nucleotide catabolic process(GO:0033121) |
| 0.5 | 2.1 | GO:2000564 | CD8-positive, alpha-beta T cell proliferation(GO:0035740) regulation of CD8-positive, alpha-beta T cell proliferation(GO:2000564) |
| 0.5 | 2.1 | GO:0046778 | modification by virus of host mRNA processing(GO:0046778) |
| 0.5 | 1.5 | GO:0032804 | negative regulation of low-density lipoprotein particle receptor catabolic process(GO:0032804) |
| 0.5 | 1.5 | GO:2000417 | negative regulation of eosinophil migration(GO:2000417) |
| 0.5 | 2.9 | GO:1902741 | interferon-alpha secretion(GO:0072642) regulation of interferon-alpha secretion(GO:1902739) positive regulation of interferon-alpha secretion(GO:1902741) |
| 0.5 | 1.5 | GO:0006097 | glyoxylate cycle(GO:0006097) |
| 0.5 | 3.9 | GO:0021902 | commitment of neuronal cell to specific neuron type in forebrain(GO:0021902) |
| 0.5 | 3.9 | GO:0010993 | regulation of ubiquitin homeostasis(GO:0010993) free ubiquitin chain polymerization(GO:0010994) |
| 0.5 | 6.5 | GO:0040016 | embryonic cleavage(GO:0040016) |
| 0.5 | 2.8 | GO:0017196 | N-terminal peptidyl-methionine acetylation(GO:0017196) |
| 0.4 | 1.3 | GO:0042938 | dipeptide transport(GO:0042938) |
| 0.4 | 1.3 | GO:0033140 | negative regulation of peptidyl-serine phosphorylation of STAT protein(GO:0033140) |
| 0.4 | 2.2 | GO:0044806 | G-quadruplex DNA unwinding(GO:0044806) |
| 0.4 | 6.1 | GO:0036500 | ATF6-mediated unfolded protein response(GO:0036500) |
| 0.4 | 0.9 | GO:0060920 | atrioventricular node development(GO:0003162) cardiac pacemaker cell differentiation(GO:0060920) cardiac pacemaker cell development(GO:0060926) |
| 0.4 | 2.1 | GO:1903553 | positive regulation of extracellular exosome assembly(GO:1903553) |
| 0.4 | 0.8 | GO:0023016 | signal transduction by trans-phosphorylation(GO:0023016) |
| 0.4 | 2.5 | GO:0070934 | CRD-mediated mRNA stabilization(GO:0070934) |
| 0.4 | 1.7 | GO:0000255 | allantoin metabolic process(GO:0000255) |
| 0.4 | 1.6 | GO:0033314 | mitotic DNA replication checkpoint(GO:0033314) |
| 0.4 | 4.0 | GO:0001866 | NK T cell proliferation(GO:0001866) |
| 0.4 | 1.2 | GO:0003221 | right ventricular cardiac muscle tissue morphogenesis(GO:0003221) |
| 0.4 | 13.7 | GO:0030206 | chondroitin sulfate biosynthetic process(GO:0030206) |
| 0.4 | 2.2 | GO:0035694 | mitochondrial protein catabolic process(GO:0035694) |
| 0.4 | 5.9 | GO:0045116 | protein neddylation(GO:0045116) |
| 0.4 | 1.5 | GO:1903826 | arginine transmembrane transport(GO:1903826) |
| 0.4 | 5.5 | GO:0006610 | ribosomal protein import into nucleus(GO:0006610) |
| 0.4 | 3.9 | GO:0070933 | histone H4 deacetylation(GO:0070933) |
| 0.3 | 2.1 | GO:0006499 | N-terminal protein myristoylation(GO:0006499) |
| 0.3 | 1.0 | GO:1903181 | positive regulation of Wnt protein secretion(GO:0061357) regulation of late endosome to lysosome transport(GO:1902822) regulation of dopamine biosynthetic process(GO:1903179) positive regulation of dopamine biosynthetic process(GO:1903181) negative regulation of vacuolar transport(GO:1903336) negative regulation of protein catabolic process in the vacuole(GO:1904351) negative regulation of lysosomal protein catabolic process(GO:1905166) |
| 0.3 | 5.1 | GO:0032486 | Rap protein signal transduction(GO:0032486) |
| 0.3 | 1.4 | GO:0045876 | positive regulation of sister chromatid cohesion(GO:0045876) |
| 0.3 | 0.9 | GO:2000687 | negative regulation of rubidium ion transport(GO:2000681) negative regulation of rubidium ion transmembrane transporter activity(GO:2000687) |
| 0.3 | 1.4 | GO:1905098 | negative regulation of guanyl-nucleotide exchange factor activity(GO:1905098) |
| 0.3 | 0.8 | GO:0051684 | maintenance of Golgi location(GO:0051684) |
| 0.3 | 1.1 | GO:2000620 | positive regulation of histone H4-K16 acetylation(GO:2000620) |
| 0.3 | 1.4 | GO:0030047 | actin modification(GO:0030047) |
| 0.3 | 0.8 | GO:0002036 | regulation of L-glutamate transport(GO:0002036) |
| 0.3 | 1.1 | GO:0051534 | negative regulation of NFAT protein import into nucleus(GO:0051534) |
| 0.3 | 1.9 | GO:0038110 | interleukin-2-mediated signaling pathway(GO:0038110) |
| 0.3 | 1.6 | GO:0048254 | snoRNA localization(GO:0048254) |
| 0.3 | 1.0 | GO:1900245 | positive regulation of MDA-5 signaling pathway(GO:1900245) |
| 0.2 | 2.7 | GO:0051574 | positive regulation of histone H3-K9 methylation(GO:0051574) |
| 0.2 | 2.2 | GO:0001672 | regulation of chromatin assembly or disassembly(GO:0001672) |
| 0.2 | 0.5 | GO:0003274 | endocardial cushion fusion(GO:0003274) |
| 0.2 | 0.5 | GO:0098923 | retrograde trans-synaptic signaling by soluble gas(GO:0098923) trans-synaptic signaling by soluble gas(GO:0099543) |
| 0.2 | 0.9 | GO:0075509 | receptor-mediated endocytosis of virus by host cell(GO:0019065) endocytosis involved in viral entry into host cell(GO:0075509) |
| 0.2 | 0.9 | GO:0070966 | nuclear-transcribed mRNA catabolic process, no-go decay(GO:0070966) |
| 0.2 | 1.1 | GO:0070295 | renal water absorption(GO:0070295) |
| 0.2 | 2.7 | GO:0048194 | Golgi vesicle budding(GO:0048194) |
| 0.2 | 4.6 | GO:0051764 | actin crosslink formation(GO:0051764) |
| 0.2 | 3.6 | GO:0036148 | phosphatidylglycerol acyl-chain remodeling(GO:0036148) |
| 0.2 | 1.3 | GO:1902956 | regulation of mitochondrial electron transport, NADH to ubiquinone(GO:1902956) negative regulation of mitochondrial electron transport, NADH to ubiquinone(GO:1902957) |
| 0.2 | 7.2 | GO:0001504 | neurotransmitter uptake(GO:0001504) |
| 0.2 | 1.0 | GO:0021764 | amygdala development(GO:0021764) |
| 0.2 | 1.6 | GO:0072733 | response to staurosporine(GO:0072733) cellular response to staurosporine(GO:0072734) |
| 0.2 | 1.0 | GO:1903751 | regulation of intrinsic apoptotic signaling pathway in response to hydrogen peroxide(GO:1903750) negative regulation of intrinsic apoptotic signaling pathway in response to hydrogen peroxide(GO:1903751) |
| 0.2 | 1.7 | GO:0035562 | negative regulation of chromatin binding(GO:0035562) |
| 0.2 | 0.6 | GO:1902938 | phospholipase C-activating G-protein coupled glutamate receptor signaling pathway(GO:0007206) regulation of intracellular calcium activated chloride channel activity(GO:1902938) |
| 0.2 | 1.0 | GO:1903715 | regulation of aerobic respiration(GO:1903715) |
| 0.2 | 0.5 | GO:0050923 | cerebral cortex tangential migration using cell-cell interactions(GO:0021823) postnatal olfactory bulb interneuron migration(GO:0021827) chemorepulsion involved in postnatal olfactory bulb interneuron migration(GO:0021836) regulation of negative chemotaxis(GO:0050923) |
| 0.2 | 4.8 | GO:0000470 | maturation of LSU-rRNA(GO:0000470) |
| 0.2 | 3.1 | GO:1904355 | positive regulation of telomere capping(GO:1904355) |
| 0.2 | 0.5 | GO:0051151 | negative regulation of smooth muscle cell differentiation(GO:0051151) |
| 0.2 | 3.3 | GO:0006465 | signal peptide processing(GO:0006465) |
| 0.2 | 2.2 | GO:0005981 | regulation of glycogen catabolic process(GO:0005981) |
| 0.2 | 0.8 | GO:0006041 | glucosamine metabolic process(GO:0006041) |
| 0.1 | 3.9 | GO:0030214 | hyaluronan catabolic process(GO:0030214) |
| 0.1 | 0.7 | GO:1900041 | negative regulation of interleukin-2 secretion(GO:1900041) |
| 0.1 | 3.2 | GO:0019054 | modulation by virus of host process(GO:0019054) |
| 0.1 | 0.3 | GO:0044111 | development involved in symbiotic interaction(GO:0044111) |
| 0.1 | 1.9 | GO:0035518 | histone H2A monoubiquitination(GO:0035518) |
| 0.1 | 2.4 | GO:0007253 | cytoplasmic sequestering of NF-kappaB(GO:0007253) stress granule assembly(GO:0034063) |
| 0.1 | 1.0 | GO:0070294 | renal sodium ion absorption(GO:0070294) |
| 0.1 | 0.9 | GO:1902962 | regulation of metalloendopeptidase activity involved in amyloid precursor protein catabolic process(GO:1902962) negative regulation of metalloendopeptidase activity involved in amyloid precursor protein catabolic process(GO:1902963) |
| 0.1 | 3.0 | GO:1904886 | beta-catenin destruction complex disassembly(GO:1904886) |
| 0.1 | 0.3 | GO:0016241 | regulation of macroautophagy(GO:0016241) |
| 0.1 | 4.3 | GO:0090383 | phagosome acidification(GO:0090383) |
| 0.1 | 0.8 | GO:0019367 | fatty acid elongation, saturated fatty acid(GO:0019367) fatty acid elongation, unsaturated fatty acid(GO:0019368) fatty acid elongation, monounsaturated fatty acid(GO:0034625) fatty acid elongation, polyunsaturated fatty acid(GO:0034626) |
| 0.1 | 0.8 | GO:0006177 | GMP biosynthetic process(GO:0006177) |
| 0.1 | 0.4 | GO:0002384 | hepatic immune response(GO:0002384) |
| 0.1 | 1.2 | GO:0045722 | positive regulation of gluconeogenesis(GO:0045722) |
| 0.1 | 1.8 | GO:0043374 | CD8-positive, alpha-beta T cell differentiation(GO:0043374) |
| 0.1 | 1.4 | GO:0001711 | endodermal cell fate commitment(GO:0001711) |
| 0.1 | 0.6 | GO:0045541 | negative regulation of cholesterol biosynthetic process(GO:0045541) negative regulation of cholesterol metabolic process(GO:0090206) |
| 0.1 | 0.4 | GO:0048936 | peripheral nervous system neuron axonogenesis(GO:0048936) |
| 0.1 | 0.3 | GO:0003175 | tricuspid valve development(GO:0003175) tricuspid valve morphogenesis(GO:0003186) |
| 0.1 | 0.6 | GO:1904016 | response to Thyroglobulin triiodothyronine(GO:1904016) |
| 0.1 | 0.4 | GO:0072396 | response to cell cycle checkpoint signaling(GO:0072396) response to DNA integrity checkpoint signaling(GO:0072402) response to DNA damage checkpoint signaling(GO:0072423) |
| 0.1 | 1.1 | GO:0033299 | secretion of lysosomal enzymes(GO:0033299) |
| 0.1 | 0.8 | GO:0035331 | negative regulation of hippo signaling(GO:0035331) |
| 0.1 | 1.4 | GO:0006782 | protoporphyrinogen IX biosynthetic process(GO:0006782) |
| 0.1 | 0.6 | GO:0036337 | Fas signaling pathway(GO:0036337) |
| 0.1 | 0.6 | GO:0097105 | presynaptic membrane assembly(GO:0097105) |
| 0.1 | 6.1 | GO:0031640 | killing of cells of other organism(GO:0031640) disruption of cells of other organism(GO:0044364) |
| 0.1 | 3.9 | GO:0006376 | mRNA splice site selection(GO:0006376) |
| 0.1 | 0.7 | GO:1900045 | negative regulation of histone ubiquitination(GO:0033183) negative regulation of protein K63-linked ubiquitination(GO:1900045) regulation of histone H2A K63-linked ubiquitination(GO:1901314) negative regulation of histone H2A K63-linked ubiquitination(GO:1901315) negative regulation of protein polyubiquitination(GO:1902915) |
| 0.1 | 3.1 | GO:0000717 | nucleotide-excision repair, DNA duplex unwinding(GO:0000717) |
| 0.1 | 0.3 | GO:0006864 | pyrimidine nucleotide transport(GO:0006864) mitochondrial pyrimidine nucleotide import(GO:1990519) |
| 0.1 | 0.5 | GO:0061767 | negative regulation of lung blood pressure(GO:0061767) |
| 0.1 | 4.7 | GO:0043171 | peptide catabolic process(GO:0043171) |
| 0.1 | 0.7 | GO:0018401 | peptidyl-proline hydroxylation to 4-hydroxy-L-proline(GO:0018401) |
| 0.1 | 1.5 | GO:0006004 | fucose metabolic process(GO:0006004) |
| 0.1 | 2.0 | GO:0042493 | response to drug(GO:0042493) |
| 0.1 | 0.4 | GO:2001288 | positive regulation of caveolin-mediated endocytosis(GO:2001288) |
| 0.1 | 0.4 | GO:0048388 | endosomal lumen acidification(GO:0048388) |
| 0.1 | 0.8 | GO:0048752 | semicircular canal morphogenesis(GO:0048752) |
| 0.1 | 3.1 | GO:0032480 | negative regulation of type I interferon production(GO:0032480) |
| 0.1 | 1.2 | GO:0045974 | miRNA mediated inhibition of translation(GO:0035278) negative regulation of translation, ncRNA-mediated(GO:0040033) regulation of translation, ncRNA-mediated(GO:0045974) |
| 0.1 | 3.5 | GO:0035666 | TRIF-dependent toll-like receptor signaling pathway(GO:0035666) |
| 0.1 | 0.2 | GO:1901873 | regulation of post-translational protein modification(GO:1901873) |
| 0.1 | 4.4 | GO:0000381 | regulation of alternative mRNA splicing, via spliceosome(GO:0000381) |
| 0.1 | 5.7 | GO:0006369 | termination of RNA polymerase II transcription(GO:0006369) |
| 0.1 | 2.2 | GO:0071498 | cellular response to fluid shear stress(GO:0071498) |
| 0.1 | 2.7 | GO:0060236 | regulation of mitotic spindle organization(GO:0060236) |
| 0.1 | 5.0 | GO:0046427 | positive regulation of JAK-STAT cascade(GO:0046427) positive regulation of STAT cascade(GO:1904894) |
| 0.1 | 5.1 | GO:0035722 | interleukin-12-mediated signaling pathway(GO:0035722) cellular response to interleukin-12(GO:0071349) |
| 0.1 | 0.2 | GO:0006556 | S-adenosylmethionine biosynthetic process(GO:0006556) |
| 0.1 | 0.2 | GO:1903659 | regulation of complement-dependent cytotoxicity(GO:1903659) |
| 0.1 | 1.6 | GO:0043555 | regulation of translation in response to stress(GO:0043555) |
| 0.1 | 6.5 | GO:0000079 | regulation of cyclin-dependent protein serine/threonine kinase activity(GO:0000079) |
| 0.1 | 1.9 | GO:0061003 | positive regulation of dendritic spine morphogenesis(GO:0061003) |
| 0.1 | 2.4 | GO:0008631 | intrinsic apoptotic signaling pathway in response to oxidative stress(GO:0008631) |
| 0.1 | 5.4 | GO:0006695 | cholesterol biosynthetic process(GO:0006695) |
| 0.1 | 1.1 | GO:1904380 | endoplasmic reticulum mannose trimming(GO:1904380) |
| 0.1 | 1.4 | GO:0006646 | phosphatidylethanolamine biosynthetic process(GO:0006646) |
| 0.1 | 2.1 | GO:0006509 | membrane protein ectodomain proteolysis(GO:0006509) |
| 0.1 | 0.7 | GO:1901898 | negative regulation of relaxation of cardiac muscle(GO:1901898) |
| 0.1 | 0.9 | GO:0044818 | mitotic G2 DNA damage checkpoint(GO:0007095) mitotic G2/M transition checkpoint(GO:0044818) |
| 0.1 | 1.5 | GO:0045672 | positive regulation of osteoclast differentiation(GO:0045672) |
| 0.1 | 0.5 | GO:2000270 | negative regulation of fibroblast apoptotic process(GO:2000270) |
| 0.1 | 2.0 | GO:0042149 | cellular response to glucose starvation(GO:0042149) |
| 0.1 | 2.2 | GO:0007257 | activation of JUN kinase activity(GO:0007257) |
| 0.1 | 3.4 | GO:0006120 | mitochondrial electron transport, NADH to ubiquinone(GO:0006120) |
| 0.1 | 2.7 | GO:0043277 | apoptotic cell clearance(GO:0043277) |
| 0.1 | 1.0 | GO:0090140 | regulation of mitochondrial fission(GO:0090140) |
| 0.1 | 1.8 | GO:0050855 | regulation of B cell receptor signaling pathway(GO:0050855) |
| 0.1 | 3.2 | GO:0032465 | regulation of cytokinesis(GO:0032465) |
| 0.1 | 1.2 | GO:1900273 | positive regulation of long-term synaptic potentiation(GO:1900273) |
| 0.1 | 2.0 | GO:0050766 | positive regulation of phagocytosis(GO:0050766) |
| 0.1 | 4.5 | GO:0048208 | vesicle coating(GO:0006901) vesicle targeting, rough ER to cis-Golgi(GO:0048207) COPII vesicle coating(GO:0048208) |
| 0.1 | 0.6 | GO:0006122 | mitochondrial electron transport, ubiquinol to cytochrome c(GO:0006122) |
| 0.1 | 0.3 | GO:1903421 | regulation of synaptic vesicle recycling(GO:1903421) |
| 0.1 | 1.1 | GO:0006518 | peptide metabolic process(GO:0006518) |
| 0.0 | 0.1 | GO:0010040 | response to iron(II) ion(GO:0010040) |
| 0.0 | 2.0 | GO:2000144 | positive regulation of DNA-templated transcription, initiation(GO:2000144) |
| 0.0 | 0.1 | GO:0009597 | detection of virus(GO:0009597) |
| 0.0 | 2.8 | GO:0032435 | negative regulation of proteasomal ubiquitin-dependent protein catabolic process(GO:0032435) |
| 0.0 | 1.2 | GO:0042744 | hydrogen peroxide catabolic process(GO:0042744) |
| 0.0 | 0.5 | GO:0060346 | bone trabecula formation(GO:0060346) |
| 0.0 | 2.4 | GO:0071377 | cellular response to glucagon stimulus(GO:0071377) |
| 0.0 | 1.1 | GO:0045948 | positive regulation of translational initiation(GO:0045948) |
| 0.0 | 0.3 | GO:0006655 | phosphatidylglycerol biosynthetic process(GO:0006655) |
| 0.0 | 0.2 | GO:0098735 | positive regulation of the force of heart contraction(GO:0098735) |
| 0.0 | 0.3 | GO:0039536 | negative regulation of RIG-I signaling pathway(GO:0039536) |
| 0.0 | 2.2 | GO:0046686 | response to cadmium ion(GO:0046686) |
| 0.0 | 3.7 | GO:0060333 | interferon-gamma-mediated signaling pathway(GO:0060333) |
| 0.0 | 0.2 | GO:0060283 | negative regulation of oocyte development(GO:0060283) regulation of oocyte maturation(GO:1900193) negative regulation of oocyte maturation(GO:1900194) |
| 0.0 | 1.6 | GO:0007566 | embryo implantation(GO:0007566) |
| 0.0 | 2.6 | GO:1900046 | regulation of blood coagulation(GO:0030193) regulation of hemostasis(GO:1900046) |
| 0.0 | 0.9 | GO:0006829 | zinc II ion transport(GO:0006829) |
| 0.0 | 0.2 | GO:0032383 | dolichol metabolic process(GO:0019348) regulation of intracellular lipid transport(GO:0032377) regulation of intracellular sterol transport(GO:0032380) regulation of intracellular cholesterol transport(GO:0032383) |
| 0.0 | 0.4 | GO:0090161 | Golgi ribbon formation(GO:0090161) |
| 0.0 | 0.2 | GO:1903608 | protein localization to cytoplasmic stress granule(GO:1903608) |
| 0.0 | 0.1 | GO:0018076 | N-terminal peptidyl-lysine acetylation(GO:0018076) |
| 0.0 | 0.5 | GO:0098781 | ncRNA transcription(GO:0098781) |
| 0.0 | 0.4 | GO:0046855 | inositol phosphate dephosphorylation(GO:0046855) |
| 0.0 | 0.3 | GO:0032287 | peripheral nervous system myelin maintenance(GO:0032287) |
| 0.0 | 0.6 | GO:0043010 | camera-type eye development(GO:0043010) |
| 0.0 | 0.7 | GO:1902857 | positive regulation of nonmotile primary cilium assembly(GO:1902857) |
| 0.0 | 0.6 | GO:0050775 | positive regulation of dendrite morphogenesis(GO:0050775) |
| 0.0 | 0.7 | GO:0043984 | histone H4-K16 acetylation(GO:0043984) |
| 0.0 | 4.6 | GO:0002576 | platelet degranulation(GO:0002576) |
| 0.0 | 3.1 | GO:0045931 | positive regulation of mitotic cell cycle(GO:0045931) |
| 0.0 | 4.5 | GO:0006338 | chromatin remodeling(GO:0006338) |
| 0.0 | 0.5 | GO:0090023 | positive regulation of neutrophil chemotaxis(GO:0090023) |
| 0.0 | 0.8 | GO:0050690 | regulation of defense response to virus by virus(GO:0050690) |
| 0.0 | 3.5 | GO:0051168 | nuclear export(GO:0051168) |
| 0.0 | 0.1 | GO:0051461 | positive regulation of corticotropin secretion(GO:0051461) |
| 0.0 | 0.6 | GO:0030262 | apoptotic nuclear changes(GO:0030262) |
| 0.0 | 0.3 | GO:0051412 | response to corticosterone(GO:0051412) |
| 0.0 | 0.8 | GO:0006027 | glycosaminoglycan catabolic process(GO:0006027) |
| 0.0 | 0.5 | GO:0006359 | regulation of transcription from RNA polymerase III promoter(GO:0006359) |
| 0.0 | 0.6 | GO:0071526 | semaphorin-plexin signaling pathway(GO:0071526) |
| 0.0 | 0.8 | GO:0006953 | acute-phase response(GO:0006953) |
| 0.0 | 1.4 | GO:0010324 | membrane invagination(GO:0010324) |
| 0.0 | 0.6 | GO:0001953 | negative regulation of cell-matrix adhesion(GO:0001953) |
| 0.0 | 0.1 | GO:0015866 | ADP transport(GO:0015866) |
| 0.0 | 0.1 | GO:0070327 | thyroid hormone transport(GO:0070327) |
| 0.0 | 0.0 | GO:0001188 | RNA polymerase I transcriptional preinitiation complex assembly(GO:0001188) RNA polymerase I transcriptional preinitiation complex assembly at the promoter for the nuclear large rRNA transcript(GO:0001189) |
| 0.0 | 0.2 | GO:0021772 | olfactory bulb development(GO:0021772) |
| 0.0 | 0.1 | GO:0034453 | microtubule anchoring(GO:0034453) |
Gene overrepresentation in cellular_component category:
| Log-likelihood per target | Total log-likelihood | Term | Description |
|---|---|---|---|
| 2.1 | 6.4 | GO:0009330 | DNA topoisomerase complex (ATP-hydrolyzing)(GO:0009330) |
| 1.2 | 8.4 | GO:0031415 | NatA complex(GO:0031415) |
| 0.8 | 2.4 | GO:0019034 | viral replication complex(GO:0019034) |
| 0.6 | 3.9 | GO:0070545 | PeBoW complex(GO:0070545) |
| 0.6 | 3.0 | GO:0042272 | nuclear RNA export factor complex(GO:0042272) |
| 0.6 | 7.1 | GO:0035749 | myelin sheath adaxonal region(GO:0035749) |
| 0.5 | 3.0 | GO:0030981 | cortical microtubule cytoskeleton(GO:0030981) |
| 0.5 | 1.4 | GO:0000798 | nuclear cohesin complex(GO:0000798) |
| 0.5 | 3.3 | GO:0005787 | signal peptidase complex(GO:0005787) |
| 0.5 | 8.8 | GO:0034663 | endoplasmic reticulum chaperone complex(GO:0034663) |
| 0.4 | 4.1 | GO:0030015 | CCR4-NOT core complex(GO:0030015) |
| 0.4 | 6.2 | GO:0043073 | germ cell nucleus(GO:0043073) |
| 0.4 | 3.3 | GO:0071541 | eukaryotic translation initiation factor 3 complex, eIF3m(GO:0071541) |
| 0.4 | 1.8 | GO:0071008 | U2-type post-mRNA release spliceosomal complex(GO:0071008) |
| 0.3 | 1.0 | GO:0030906 | retromer, cargo-selective complex(GO:0030906) |
| 0.3 | 2.7 | GO:0070022 | transforming growth factor beta receptor homodimeric complex(GO:0070022) |
| 0.3 | 0.9 | GO:0034665 | integrin alpha1-beta1 complex(GO:0034665) |
| 0.3 | 3.5 | GO:0032045 | guanyl-nucleotide exchange factor complex(GO:0032045) |
| 0.3 | 2.5 | GO:0070937 | CRD-mediated mRNA stability complex(GO:0070937) |
| 0.2 | 2.2 | GO:0005955 | calcineurin complex(GO:0005955) |
| 0.2 | 4.3 | GO:0032433 | filopodium tip(GO:0032433) |
| 0.2 | 0.9 | GO:0031414 | N-terminal protein acetyltransferase complex(GO:0031414) |
| 0.2 | 4.9 | GO:0044453 | integral component of nuclear inner membrane(GO:0005639) intrinsic component of nuclear inner membrane(GO:0031229) nuclear membrane part(GO:0044453) |
| 0.2 | 2.5 | GO:0035985 | senescence-associated heterochromatin focus(GO:0035985) |
| 0.2 | 3.6 | GO:0016442 | RISC complex(GO:0016442) RNAi effector complex(GO:0031332) |
| 0.2 | 2.9 | GO:0008385 | IkappaB kinase complex(GO:0008385) |
| 0.2 | 2.2 | GO:0072357 | glycogen granule(GO:0042587) PTW/PP1 phosphatase complex(GO:0072357) |
| 0.2 | 2.7 | GO:0048188 | Set1C/COMPASS complex(GO:0048188) |
| 0.2 | 2.6 | GO:0033180 | proton-transporting V-type ATPase, V1 domain(GO:0033180) |
| 0.2 | 1.6 | GO:0070761 | pre-snoRNP complex(GO:0070761) |
| 0.2 | 0.6 | GO:1990851 | Wnt-Frizzled-LRP5/6 complex(GO:1990851) |
| 0.2 | 3.1 | GO:0000109 | nucleotide-excision repair complex(GO:0000109) |
| 0.2 | 1.1 | GO:0000835 | ER ubiquitin ligase complex(GO:0000835) |
| 0.2 | 2.1 | GO:0005847 | mRNA cleavage and polyadenylation specificity factor complex(GO:0005847) |
| 0.2 | 1.7 | GO:0033178 | proton-transporting two-sector ATPase complex, catalytic domain(GO:0033178) |
| 0.2 | 6.2 | GO:0090544 | BAF-type complex(GO:0090544) |
| 0.2 | 0.9 | GO:0002193 | MAML1-RBP-Jkappa- ICN1 complex(GO:0002193) |
| 0.2 | 3.6 | GO:0000242 | pericentriolar material(GO:0000242) |
| 0.2 | 0.9 | GO:0070381 | endosome to plasma membrane transport vesicle(GO:0070381) |
| 0.2 | 3.5 | GO:0005753 | mitochondrial proton-transporting ATP synthase complex(GO:0005753) |
| 0.1 | 0.4 | GO:0030893 | meiotic cohesin complex(GO:0030893) |
| 0.1 | 1.4 | GO:0016593 | Cdc73/Paf1 complex(GO:0016593) |
| 0.1 | 0.8 | GO:0071256 | Sec61 translocon complex(GO:0005784) translocon complex(GO:0071256) |
| 0.1 | 0.9 | GO:0005956 | protein kinase CK2 complex(GO:0005956) |
| 0.1 | 3.6 | GO:0035145 | exon-exon junction complex(GO:0035145) |
| 0.1 | 3.9 | GO:1990391 | DNA repair complex(GO:1990391) |
| 0.1 | 0.8 | GO:0030121 | AP-1 adaptor complex(GO:0030121) |
| 0.1 | 3.3 | GO:0051233 | spindle midzone(GO:0051233) |
| 0.1 | 1.2 | GO:0012510 | trans-Golgi network transport vesicle membrane(GO:0012510) |
| 0.1 | 0.4 | GO:0005846 | nuclear cap binding complex(GO:0005846) |
| 0.1 | 2.7 | GO:0035098 | ESC/E(Z) complex(GO:0035098) |
| 0.1 | 0.6 | GO:0005652 | nuclear lamina(GO:0005652) |
| 0.1 | 0.7 | GO:0072487 | MSL complex(GO:0072487) |
| 0.1 | 17.8 | GO:0000793 | condensed chromosome(GO:0000793) |
| 0.1 | 0.4 | GO:0005896 | interleukin-6 receptor complex(GO:0005896) |
| 0.1 | 0.8 | GO:0005638 | lamin filament(GO:0005638) |
| 0.1 | 10.9 | GO:0005643 | nuclear pore(GO:0005643) |
| 0.1 | 12.8 | GO:0001650 | fibrillar center(GO:0001650) |
| 0.1 | 9.5 | GO:0000932 | cytoplasmic mRNA processing body(GO:0000932) |
| 0.1 | 0.3 | GO:0097422 | tubular endosome(GO:0097422) |
| 0.1 | 9.9 | GO:0005796 | Golgi lumen(GO:0005796) |
| 0.1 | 0.7 | GO:1990909 | Wnt signalosome(GO:1990909) |
| 0.1 | 0.2 | GO:0048269 | methionine adenosyltransferase complex(GO:0048269) |
| 0.1 | 4.9 | GO:1904724 | tertiary granule lumen(GO:1904724) |
| 0.1 | 5.9 | GO:0033116 | endoplasmic reticulum-Golgi intermediate compartment membrane(GO:0033116) |
| 0.1 | 6.2 | GO:0071013 | catalytic step 2 spliceosome(GO:0071013) |
| 0.1 | 6.9 | GO:0031093 | platelet alpha granule lumen(GO:0031093) |
| 0.1 | 1.3 | GO:0005720 | nuclear heterochromatin(GO:0005720) |
| 0.1 | 1.5 | GO:0071004 | U2-type prespliceosome(GO:0071004) |
| 0.1 | 2.3 | GO:0009925 | basal plasma membrane(GO:0009925) |
| 0.1 | 2.1 | GO:0031519 | PcG protein complex(GO:0031519) |
| 0.1 | 0.5 | GO:0071144 | SMAD2-SMAD3 protein complex(GO:0071144) |
| 0.1 | 0.2 | GO:0097165 | nuclear stress granule(GO:0097165) |
| 0.1 | 1.0 | GO:0071682 | endocytic vesicle lumen(GO:0071682) |
| 0.1 | 6.8 | GO:0030864 | cortical actin cytoskeleton(GO:0030864) |
| 0.1 | 0.4 | GO:0042382 | paraspeckles(GO:0042382) |
| 0.1 | 1.8 | GO:0031092 | platelet alpha granule membrane(GO:0031092) |
| 0.1 | 0.6 | GO:0045275 | mitochondrial respiratory chain complex III(GO:0005750) respiratory chain complex III(GO:0045275) |
| 0.1 | 4.3 | GO:0035577 | azurophil granule membrane(GO:0035577) |
| 0.1 | 4.7 | GO:0032580 | Golgi cisterna membrane(GO:0032580) |
| 0.1 | 3.4 | GO:0005747 | mitochondrial respiratory chain complex I(GO:0005747) NADH dehydrogenase complex(GO:0030964) respiratory chain complex I(GO:0045271) |
| 0.0 | 3.7 | GO:0000118 | histone deacetylase complex(GO:0000118) |
| 0.0 | 0.8 | GO:0043205 | microfibril(GO:0001527) fibril(GO:0043205) |
| 0.0 | 2.4 | GO:0005834 | heterotrimeric G-protein complex(GO:0005834) |
| 0.0 | 0.2 | GO:1990604 | IRE1-TRAF2-ASK1 complex(GO:1990604) |
| 0.0 | 1.5 | GO:0030529 | intracellular ribonucleoprotein complex(GO:0030529) ribonucleoprotein complex(GO:1990904) |
| 0.0 | 11.7 | GO:0000151 | ubiquitin ligase complex(GO:0000151) |
| 0.0 | 3.9 | GO:0035578 | azurophil granule lumen(GO:0035578) |
| 0.0 | 0.3 | GO:1990712 | HFE-transferrin receptor complex(GO:1990712) |
| 0.0 | 3.3 | GO:0005681 | spliceosomal complex(GO:0005681) |
| 0.0 | 0.9 | GO:0030687 | preribosome, large subunit precursor(GO:0030687) |
| 0.0 | 0.9 | GO:0099738 | cell cortex region(GO:0099738) |
| 0.0 | 0.7 | GO:0000930 | gamma-tubulin complex(GO:0000930) |
| 0.0 | 13.2 | GO:0000785 | chromatin(GO:0000785) |
| 0.0 | 0.6 | GO:0031265 | CD95 death-inducing signaling complex(GO:0031265) |
| 0.0 | 1.1 | GO:0016235 | aggresome(GO:0016235) |
| 0.0 | 0.8 | GO:0000775 | chromosome, centromeric region(GO:0000775) |
| 0.0 | 2.1 | GO:0000922 | spindle pole(GO:0000922) |
| 0.0 | 2.3 | GO:0070821 | tertiary granule membrane(GO:0070821) |
| 0.0 | 1.4 | GO:0005902 | microvillus(GO:0005902) |
| 0.0 | 0.4 | GO:0005922 | connexon complex(GO:0005922) |
| 0.0 | 0.9 | GO:0045171 | intercellular bridge(GO:0045171) |
| 0.0 | 0.7 | GO:0005793 | endoplasmic reticulum-Golgi intermediate compartment(GO:0005793) |
| 0.0 | 1.0 | GO:0005811 | lipid particle(GO:0005811) |
| 0.0 | 1.8 | GO:0030496 | midbody(GO:0030496) |
| 0.0 | 0.8 | GO:0033017 | sarcoplasmic reticulum membrane(GO:0033017) |
| 0.0 | 0.1 | GO:0051286 | cell tip(GO:0051286) |
| 0.0 | 0.1 | GO:0035371 | microtubule plus-end(GO:0035371) |
| 0.0 | 0.9 | GO:0036126 | sperm flagellum(GO:0036126) |
| 0.0 | 0.7 | GO:0005758 | mitochondrial intermembrane space(GO:0005758) |
Gene overrepresentation in molecular_function category:
| Log-likelihood per target | Total log-likelihood | Term | Description |
|---|---|---|---|
| 4.1 | 12.2 | GO:0098626 | methylselenol reductase activity(GO:0098625) methylseleninic acid reductase activity(GO:0098626) |
| 3.1 | 12.3 | GO:0044378 | non-sequence-specific DNA binding, bending(GO:0044378) |
| 1.8 | 5.3 | GO:0016314 | phosphatidylinositol-3,4,5-trisphosphate 3-phosphatase activity(GO:0016314) |
| 1.6 | 4.9 | GO:0050613 | delta14-sterol reductase activity(GO:0050613) |
| 1.1 | 5.4 | GO:0034046 | poly(G) binding(GO:0034046) |
| 1.1 | 6.4 | GO:0003917 | DNA topoisomerase type I activity(GO:0003917) |
| 0.8 | 2.5 | GO:0035501 | MH1 domain binding(GO:0035501) |
| 0.7 | 2.9 | GO:0008384 | IkappaB kinase activity(GO:0008384) |
| 0.7 | 2.9 | GO:0034481 | chondroitin sulfotransferase activity(GO:0034481) |
| 0.7 | 2.1 | GO:0005137 | interleukin-5 receptor binding(GO:0005137) |
| 0.7 | 2.7 | GO:0005026 | transforming growth factor beta receptor activity, type II(GO:0005026) |
| 0.7 | 4.6 | GO:0042978 | ornithine decarboxylase activator activity(GO:0042978) |
| 0.6 | 8.4 | GO:0004596 | peptide alpha-N-acetyltransferase activity(GO:0004596) |
| 0.6 | 1.9 | GO:0033149 | FFAT motif binding(GO:0033149) |
| 0.6 | 6.1 | GO:0046790 | virion binding(GO:0046790) |
| 0.5 | 6.8 | GO:0017034 | Rap guanyl-nucleotide exchange factor activity(GO:0017034) |
| 0.5 | 10.4 | GO:0070273 | phosphatidylinositol-4-phosphate binding(GO:0070273) |
| 0.5 | 1.5 | GO:0004450 | isocitrate dehydrogenase (NADP+) activity(GO:0004450) |
| 0.4 | 3.6 | GO:0047144 | 2-acylglycerol-3-phosphate O-acyltransferase activity(GO:0047144) |
| 0.4 | 5.7 | GO:0016018 | cyclosporin A binding(GO:0016018) |
| 0.4 | 1.1 | GO:0050501 | hyaluronan synthase activity(GO:0050501) |
| 0.4 | 4.1 | GO:0001224 | RNA polymerase II transcription cofactor binding(GO:0001224) |
| 0.4 | 2.2 | GO:0017018 | myosin phosphatase activity(GO:0017018) |
| 0.4 | 1.5 | GO:0015181 | arginine transmembrane transporter activity(GO:0015181) |
| 0.3 | 1.0 | GO:0035500 | MH2 domain binding(GO:0035500) |
| 0.3 | 3.1 | GO:0050072 | m7G(5')pppN diphosphatase activity(GO:0050072) |
| 0.3 | 5.8 | GO:0055106 | ubiquitin-protein transferase regulator activity(GO:0055106) |
| 0.3 | 3.3 | GO:0004415 | hyalurononglucosaminidase activity(GO:0004415) |
| 0.3 | 6.4 | GO:0005283 | sodium:amino acid symporter activity(GO:0005283) |
| 0.3 | 9.1 | GO:0005540 | hyaluronic acid binding(GO:0005540) |
| 0.3 | 5.9 | GO:0097602 | cullin family protein binding(GO:0097602) |
| 0.3 | 2.2 | GO:0030957 | Tat protein binding(GO:0030957) |
| 0.3 | 2.1 | GO:0033192 | calmodulin-dependent protein phosphatase activity(GO:0033192) |
| 0.3 | 1.7 | GO:0008553 | hydrogen-exporting ATPase activity, phosphorylative mechanism(GO:0008553) |
| 0.3 | 3.9 | GO:0034450 | ubiquitin-ubiquitin ligase activity(GO:0034450) |
| 0.3 | 1.5 | GO:0019834 | phospholipase A2 inhibitor activity(GO:0019834) |
| 0.3 | 3.3 | GO:1990247 | N6-methyladenosine-containing RNA binding(GO:1990247) |
| 0.2 | 5.5 | GO:0005095 | GTPase inhibitor activity(GO:0005095) |
| 0.2 | 1.7 | GO:0050815 | phosphoserine binding(GO:0050815) |
| 0.2 | 1.2 | GO:0005152 | interleukin-1 receptor antagonist activity(GO:0005152) |
| 0.2 | 0.7 | GO:0032422 | purine-rich negative regulatory element binding(GO:0032422) |
| 0.2 | 2.3 | GO:0061578 | Lys63-specific deubiquitinase activity(GO:0061578) |
| 0.2 | 1.1 | GO:0050656 | 3'-phosphoadenosine 5'-phosphosulfate binding(GO:0050656) |
| 0.2 | 0.7 | GO:0003870 | 5-aminolevulinate synthase activity(GO:0003870) N-succinyltransferase activity(GO:0016749) |
| 0.2 | 1.0 | GO:0035591 | signaling adaptor activity(GO:0035591) |
| 0.2 | 1.0 | GO:0047237 | glucuronylgalactosylproteoglycan 4-beta-N-acetylgalactosaminyltransferase activity(GO:0047237) |
| 0.2 | 4.7 | GO:0070006 | metalloaminopeptidase activity(GO:0070006) |
| 0.2 | 1.6 | GO:0071936 | coreceptor activity involved in Wnt signaling pathway(GO:0071936) |
| 0.2 | 1.9 | GO:0031730 | CCR5 chemokine receptor binding(GO:0031730) |
| 0.2 | 1.5 | GO:0004957 | prostaglandin E receptor activity(GO:0004957) |
| 0.2 | 0.9 | GO:0098639 | collagen binding involved in cell-matrix adhesion(GO:0098639) |
| 0.2 | 1.3 | GO:0004064 | arylesterase activity(GO:0004064) |
| 0.2 | 1.0 | GO:0004839 | ubiquitin activating enzyme activity(GO:0004839) |
| 0.2 | 2.7 | GO:0003756 | protein disulfide isomerase activity(GO:0003756) intramolecular oxidoreductase activity, transposing S-S bonds(GO:0016864) |
| 0.2 | 6.8 | GO:0031492 | nucleosomal DNA binding(GO:0031492) |
| 0.2 | 0.5 | GO:0034714 | type III transforming growth factor beta receptor binding(GO:0034714) |
| 0.2 | 1.4 | GO:0004305 | ethanolamine kinase activity(GO:0004305) |
| 0.1 | 4.2 | GO:0030296 | protein tyrosine kinase activator activity(GO:0030296) |
| 0.1 | 1.8 | GO:0031545 | peptidyl-proline 4-dioxygenase activity(GO:0031545) |
| 0.1 | 2.4 | GO:0042800 | histone methyltransferase activity (H3-K4 specific)(GO:0042800) |
| 0.1 | 0.6 | GO:0043120 | tumor necrosis factor binding(GO:0043120) |
| 0.1 | 0.8 | GO:0102337 | fatty acid elongase activity(GO:0009922) 3-oxo-arachidoyl-CoA synthase activity(GO:0102336) 3-oxo-cerotoyl-CoA synthase activity(GO:0102337) 3-oxo-lignoceronyl-CoA synthase activity(GO:0102338) |
| 0.1 | 0.4 | GO:0019981 | interleukin-6 receptor activity(GO:0004915) interleukin-6 binding(GO:0019981) |
| 0.1 | 1.0 | GO:0046920 | alpha-(1->3)-fucosyltransferase activity(GO:0046920) |
| 0.1 | 1.4 | GO:0045159 | myosin II binding(GO:0045159) |
| 0.1 | 1.6 | GO:0042043 | neurexin family protein binding(GO:0042043) |
| 0.1 | 1.9 | GO:0005537 | mannose binding(GO:0005537) |
| 0.1 | 3.6 | GO:0003950 | NAD+ ADP-ribosyltransferase activity(GO:0003950) |
| 0.1 | 2.6 | GO:0036442 | hydrogen-exporting ATPase activity(GO:0036442) proton-transporting ATPase activity, rotational mechanism(GO:0046961) |
| 0.1 | 0.4 | GO:0036033 | mediator complex binding(GO:0036033) |
| 0.1 | 3.0 | GO:0051010 | microtubule plus-end binding(GO:0051010) |
| 0.1 | 6.7 | GO:0005160 | transforming growth factor beta receptor binding(GO:0005160) |
| 0.1 | 0.9 | GO:0005049 | nuclear export signal receptor activity(GO:0005049) |
| 0.1 | 0.3 | GO:0004605 | phosphatidate cytidylyltransferase activity(GO:0004605) |
| 0.1 | 1.1 | GO:1904264 | ubiquitin protein ligase activity involved in ERAD pathway(GO:1904264) |
| 0.1 | 2.0 | GO:0070410 | co-SMAD binding(GO:0070410) |
| 0.1 | 1.6 | GO:0001094 | TFIID-class transcription factor binding(GO:0001094) |
| 0.1 | 3.9 | GO:0033558 | histone deacetylase activity(GO:0004407) protein deacetylase activity(GO:0033558) |
| 0.1 | 4.0 | GO:0031593 | polyubiquitin binding(GO:0031593) |
| 0.1 | 0.3 | GO:0015218 | pyrimidine nucleotide transmembrane transporter activity(GO:0015218) |
| 0.1 | 1.7 | GO:0035259 | glucocorticoid receptor binding(GO:0035259) |
| 0.1 | 1.8 | GO:0017056 | structural constituent of nuclear pore(GO:0017056) |
| 0.1 | 0.6 | GO:0016681 | ubiquinol-cytochrome-c reductase activity(GO:0008121) oxidoreductase activity, acting on diphenols and related substances as donors, cytochrome as acceptor(GO:0016681) |
| 0.1 | 1.3 | GO:0019870 | potassium channel inhibitor activity(GO:0019870) |
| 0.1 | 3.2 | GO:0008139 | nuclear localization sequence binding(GO:0008139) |
| 0.1 | 2.2 | GO:0005521 | lamin binding(GO:0005521) |
| 0.1 | 0.5 | GO:0008046 | axon guidance receptor activity(GO:0008046) |
| 0.1 | 1.0 | GO:0000774 | adenyl-nucleotide exchange factor activity(GO:0000774) |
| 0.1 | 3.3 | GO:0036002 | pre-mRNA binding(GO:0036002) |
| 0.1 | 1.6 | GO:0070064 | proline-rich region binding(GO:0070064) |
| 0.1 | 1.2 | GO:0070300 | phosphatidic acid binding(GO:0070300) |
| 0.1 | 0.9 | GO:0032050 | clathrin heavy chain binding(GO:0032050) |
| 0.1 | 1.1 | GO:0004726 | non-membrane spanning protein tyrosine phosphatase activity(GO:0004726) |
| 0.1 | 5.8 | GO:0019003 | GDP binding(GO:0019003) |
| 0.1 | 2.4 | GO:0030159 | receptor signaling complex scaffold activity(GO:0030159) |
| 0.1 | 3.1 | GO:0061631 | ubiquitin conjugating enzyme activity(GO:0061631) ubiquitin-like protein conjugating enzyme activity(GO:0061650) |
| 0.1 | 0.9 | GO:0032036 | myosin heavy chain binding(GO:0032036) |
| 0.1 | 0.2 | GO:0099580 | ion antiporter activity involved in regulation of postsynaptic membrane potential(GO:0099580) |
| 0.1 | 0.4 | GO:0072320 | volume-sensitive chloride channel activity(GO:0072320) |
| 0.1 | 7.7 | GO:0019888 | protein phosphatase regulator activity(GO:0019888) |
| 0.1 | 1.1 | GO:0004185 | serine-type carboxypeptidase activity(GO:0004185) |
| 0.1 | 0.7 | GO:0019784 | NEDD8-specific protease activity(GO:0019784) |
| 0.1 | 0.8 | GO:0016861 | intramolecular oxidoreductase activity, interconverting aldoses and ketoses(GO:0016861) |
| 0.1 | 2.4 | GO:0046966 | thyroid hormone receptor binding(GO:0046966) |
| 0.1 | 3.4 | GO:0008137 | NADH dehydrogenase (ubiquinone) activity(GO:0008137) NADH dehydrogenase (quinone) activity(GO:0050136) |
| 0.1 | 1.9 | GO:0016922 | ligand-dependent nuclear receptor binding(GO:0016922) |
| 0.1 | 0.6 | GO:0008526 | phosphatidylinositol transporter activity(GO:0008526) |
| 0.1 | 0.7 | GO:0016634 | oxidoreductase activity, acting on the CH-CH group of donors, oxygen as acceptor(GO:0016634) |
| 0.1 | 3.1 | GO:0005080 | protein kinase C binding(GO:0005080) |
| 0.1 | 0.2 | GO:0050509 | N-acetylglucosaminyl-proteoglycan 4-beta-glucuronosyltransferase activity(GO:0050509) |
| 0.1 | 0.4 | GO:0000340 | RNA 7-methylguanosine cap binding(GO:0000340) |
| 0.1 | 3.3 | GO:0004722 | protein serine/threonine phosphatase activity(GO:0004722) |
| 0.1 | 1.7 | GO:0004674 | protein serine/threonine kinase activity(GO:0004674) |
| 0.1 | 0.3 | GO:0098821 | BMP receptor activity(GO:0098821) |
| 0.1 | 3.1 | GO:0030971 | receptor tyrosine kinase binding(GO:0030971) |
| 0.1 | 0.8 | GO:0016884 | carbon-nitrogen ligase activity, with glutamine as amido-N-donor(GO:0016884) |
| 0.1 | 0.4 | GO:0004445 | inositol-polyphosphate 5-phosphatase activity(GO:0004445) |
| 0.1 | 1.0 | GO:0031748 | D1 dopamine receptor binding(GO:0031748) |
| 0.1 | 5.7 | GO:0005070 | SH3/SH2 adaptor activity(GO:0005070) |
| 0.1 | 1.6 | GO:0097200 | cysteine-type endopeptidase activity involved in execution phase of apoptosis(GO:0097200) |
| 0.0 | 4.0 | GO:0016765 | transferase activity, transferring alkyl or aryl (other than methyl) groups(GO:0016765) |
| 0.0 | 0.3 | GO:0039552 | RIG-I binding(GO:0039552) |
| 0.0 | 2.4 | GO:0070888 | E-box binding(GO:0070888) |
| 0.0 | 4.2 | GO:0004222 | metalloendopeptidase activity(GO:0004222) |
| 0.0 | 1.7 | GO:0005484 | SNAP receptor activity(GO:0005484) |
| 0.0 | 0.3 | GO:0005328 | neurotransmitter:sodium symporter activity(GO:0005328) |
| 0.0 | 0.6 | GO:0004861 | cyclin-dependent protein serine/threonine kinase inhibitor activity(GO:0004861) |
| 0.0 | 0.6 | GO:0017154 | semaphorin receptor activity(GO:0017154) |
| 0.0 | 1.9 | GO:0004521 | endoribonuclease activity(GO:0004521) |
| 0.0 | 0.7 | GO:0050321 | tau-protein kinase activity(GO:0050321) |
| 0.0 | 0.9 | GO:0061630 | ubiquitin protein ligase activity(GO:0061630) ubiquitin-like protein ligase activity(GO:0061659) |
| 0.0 | 0.2 | GO:0035005 | 1-phosphatidylinositol-4-phosphate 3-kinase activity(GO:0035005) |
| 0.0 | 0.1 | GO:0051538 | iron-responsive element binding(GO:0030350) 3 iron, 4 sulfur cluster binding(GO:0051538) |
| 0.0 | 0.5 | GO:0045236 | CXCR chemokine receptor binding(GO:0045236) |
| 0.0 | 0.3 | GO:0034452 | dynactin binding(GO:0034452) |
| 0.0 | 0.7 | GO:0070840 | dynein complex binding(GO:0070840) |
| 0.0 | 0.8 | GO:0015269 | calcium-activated potassium channel activity(GO:0015269) |
| 0.0 | 0.9 | GO:0051879 | Hsp90 protein binding(GO:0051879) |
| 0.0 | 0.7 | GO:0043015 | gamma-tubulin binding(GO:0043015) |
| 0.0 | 4.0 | GO:0004386 | helicase activity(GO:0004386) |
| 0.0 | 0.9 | GO:0042605 | peptide antigen binding(GO:0042605) |
| 0.0 | 0.7 | GO:0005104 | fibroblast growth factor receptor binding(GO:0005104) |
| 0.0 | 0.6 | GO:0070034 | telomerase RNA binding(GO:0070034) |
| 0.0 | 0.9 | GO:0004198 | calcium-dependent cysteine-type endopeptidase activity(GO:0004198) |
| 0.0 | 0.3 | GO:0035198 | miRNA binding(GO:0035198) |
| 0.0 | 0.1 | GO:0043426 | MRF binding(GO:0043426) |
| 0.0 | 1.0 | GO:0017080 | sodium channel regulator activity(GO:0017080) |
| 0.0 | 1.1 | GO:0030170 | pyridoxal phosphate binding(GO:0030170) |
| 0.0 | 1.1 | GO:0000979 | RNA polymerase II core promoter sequence-specific DNA binding(GO:0000979) |
| 0.0 | 7.8 | GO:0045296 | cadherin binding(GO:0045296) |
| 0.0 | 0.1 | GO:0015349 | thyroid hormone transmembrane transporter activity(GO:0015349) |
| 0.0 | 0.8 | GO:0050699 | WW domain binding(GO:0050699) |
| 0.0 | 1.2 | GO:0004715 | non-membrane spanning protein tyrosine kinase activity(GO:0004715) |
| 0.0 | 8.7 | GO:0003682 | chromatin binding(GO:0003682) |
| 0.0 | 0.8 | GO:0004693 | cyclin-dependent protein serine/threonine kinase activity(GO:0004693) |
| 0.0 | 0.8 | GO:0005044 | scavenger receptor activity(GO:0005044) |
| 0.0 | 0.2 | GO:0017160 | Ral GTPase binding(GO:0017160) |
| 0.0 | 1.2 | GO:0005201 | extracellular matrix structural constituent(GO:0005201) |
| 0.0 | 1.4 | GO:0005525 | GTP binding(GO:0005525) |
| 0.0 | 0.1 | GO:0000295 | adenine nucleotide transmembrane transporter activity(GO:0000295) purine ribonucleotide transmembrane transporter activity(GO:0005346) ATP transmembrane transporter activity(GO:0005347) purine nucleotide transmembrane transporter activity(GO:0015216) ADP transmembrane transporter activity(GO:0015217) |
| 0.0 | 0.6 | GO:0015485 | cholesterol binding(GO:0015485) |
| 0.0 | 0.1 | GO:0015194 | L-serine transmembrane transporter activity(GO:0015194) serine transmembrane transporter activity(GO:0022889) |
| 0.0 | 0.1 | GO:0019966 | interleukin-1 binding(GO:0019966) |
| 0.0 | 0.1 | GO:0035612 | AP-2 adaptor complex binding(GO:0035612) |
Gene overrepresentation in C2:CP category:
| Log-likelihood per target | Total log-likelihood | Term | Description |
|---|---|---|---|
| 0.4 | 12.0 | PID TOLL ENDOGENOUS PATHWAY | Endogenous TLR signaling |
| 0.2 | 1.9 | ST IL 13 PATHWAY | Interleukin 13 (IL-13) Pathway |
| 0.2 | 7.6 | PID NECTIN PATHWAY | Nectin adhesion pathway |
| 0.2 | 3.7 | PID IL5 PATHWAY | IL5-mediated signaling events |
| 0.1 | 0.6 | SA CASPASE CASCADE | Apoptosis is mediated by caspases, cysteine proteases arranged in a proteolytic cascade. |
| 0.1 | 9.5 | PID IL6 7 PATHWAY | IL6-mediated signaling events |
| 0.1 | 4.5 | PID NFKAPPAB CANONICAL PATHWAY | Canonical NF-kappaB pathway |
| 0.1 | 6.6 | PID BMP PATHWAY | BMP receptor signaling |
| 0.1 | 10.9 | ST INTEGRIN SIGNALING PATHWAY | Integrin Signaling Pathway |
| 0.1 | 1.6 | SA B CELL RECEPTOR COMPLEXES | Antigen binding to B cell receptors activates protein tyrosine kinases, such as the Src family, which ultimate activate MAP kinases. |
| 0.1 | 3.3 | PID IL2 PI3K PATHWAY | IL2 signaling events mediated by PI3K |
| 0.1 | 1.1 | PID PDGFRA PATHWAY | PDGFR-alpha signaling pathway |
| 0.1 | 3.8 | PID GLYPICAN 1PATHWAY | Glypican 1 network |
| 0.1 | 4.9 | PID PLK1 PATHWAY | PLK1 signaling events |
| 0.1 | 7.0 | PID CASPASE PATHWAY | Caspase cascade in apoptosis |
| 0.1 | 6.0 | PID P53 REGULATION PATHWAY | p53 pathway |
| 0.1 | 1.0 | PID EPO PATHWAY | EPO signaling pathway |
| 0.1 | 2.2 | PID IL12 STAT4 PATHWAY | IL12 signaling mediated by STAT4 |
| 0.1 | 2.3 | PID ANGIOPOIETIN RECEPTOR PATHWAY | Angiopoietin receptor Tie2-mediated signaling |
| 0.1 | 1.2 | PID P38 MKK3 6PATHWAY | p38 MAPK signaling pathway |
| 0.0 | 1.6 | PID BARD1 PATHWAY | BARD1 signaling events |
| 0.0 | 1.4 | PID NCADHERIN PATHWAY | N-cadherin signaling events |
| 0.0 | 3.2 | PID NOTCH PATHWAY | Notch signaling pathway |
| 0.0 | 1.2 | ST WNT BETA CATENIN PATHWAY | Wnt/beta-catenin Pathway |
| 0.0 | 1.9 | PID AJDISS 2PATHWAY | Posttranslational regulation of adherens junction stability and dissassembly |
| 0.0 | 0.6 | PID SYNDECAN 3 PATHWAY | Syndecan-3-mediated signaling events |
| 0.0 | 0.3 | PID NFKAPPAB ATYPICAL PATHWAY | Atypical NF-kappaB pathway |
| 0.0 | 0.5 | PID SMAD2 3PATHWAY | Regulation of cytoplasmic and nuclear SMAD2/3 signaling |
| 0.0 | 0.8 | PID WNT NONCANONICAL PATHWAY | Noncanonical Wnt signaling pathway |
| 0.0 | 1.1 | PID HIF1A PATHWAY | Hypoxic and oxygen homeostasis regulation of HIF-1-alpha |
| 0.0 | 0.6 | PID ERB GENOMIC PATHWAY | Validated nuclear estrogen receptor beta network |
| 0.0 | 0.1 | PID PI3KCI AKT PATHWAY | Class I PI3K signaling events mediated by Akt |
| 0.0 | 1.5 | PID AR PATHWAY | Coregulation of Androgen receptor activity |
| 0.0 | 4.2 | NABA ECM REGULATORS | Genes encoding enzymes and their regulators involved in the remodeling of the extracellular matrix |
| 0.0 | 0.4 | PID ATM PATHWAY | ATM pathway |
| 0.0 | 0.3 | PID PS1 PATHWAY | Presenilin action in Notch and Wnt signaling |
| 0.0 | 2.6 | NABA ECM AFFILIATED | Genes encoding proteins affiliated structurally or functionally to extracellular matrix proteins |
| 0.0 | 0.4 | PID IL1 PATHWAY | IL1-mediated signaling events |
| 0.0 | 0.6 | PID E2F PATHWAY | E2F transcription factor network |
Gene overrepresentation in C2:CP:REACTOME category:
| Log-likelihood per target | Total log-likelihood | Term | Description |
|---|---|---|---|
| 0.6 | 12.4 | REACTOME APOPTOSIS INDUCED DNA FRAGMENTATION | Genes involved in Apoptosis induced DNA fragmentation |
| 0.6 | 5.3 | REACTOME NEGATIVE REGULATION OF THE PI3K AKT NETWORK | Genes involved in Negative regulation of the PI3K/AKT network |
| 0.5 | 14.1 | REACTOME CHONDROITIN SULFATE BIOSYNTHESIS | Genes involved in Chondroitin sulfate biosynthesis |
| 0.4 | 6.1 | REACTOME ACTIVATION OF CHAPERONE GENES BY ATF6 ALPHA | Genes involved in Activation of Chaperone Genes by ATF6-alpha |
| 0.4 | 4.6 | REACTOME REGULATION OF INSULIN SECRETION BY ACETYLCHOLINE | Genes involved in Regulation of Insulin Secretion by Acetylcholine |
| 0.4 | 8.9 | REACTOME CTNNB1 PHOSPHORYLATION CASCADE | Genes involved in Beta-catenin phosphorylation cascade |
| 0.4 | 14.9 | REACTOME DOWNREGULATION OF TGF BETA RECEPTOR SIGNALING | Genes involved in Downregulation of TGF-beta receptor signaling |
| 0.4 | 12.2 | REACTOME SYNTHESIS AND INTERCONVERSION OF NUCLEOTIDE DI AND TRIPHOSPHATES | Genes involved in Synthesis and interconversion of nucleotide di- and triphosphates |
| 0.3 | 7.9 | REACTOME P130CAS LINKAGE TO MAPK SIGNALING FOR INTEGRINS | Genes involved in p130Cas linkage to MAPK signaling for integrins |
| 0.3 | 3.3 | REACTOME IKK COMPLEX RECRUITMENT MEDIATED BY RIP1 | Genes involved in IKK complex recruitment mediated by RIP1 |
| 0.2 | 12.7 | REACTOME NEGATIVE REGULATORS OF RIG I MDA5 SIGNALING | Genes involved in Negative regulators of RIG-I/MDA5 signaling |
| 0.2 | 5.9 | REACTOME ACTIVATION OF RAC | Genes involved in Activation of Rac |
| 0.2 | 3.6 | REACTOME ACYL CHAIN REMODELLING OF PG | Genes involved in Acyl chain remodelling of PG |
| 0.2 | 3.3 | REACTOME MRNA DECAY BY 5 TO 3 EXORIBONUCLEASE | Genes involved in mRNA Decay by 5' to 3' Exoribonuclease |
| 0.2 | 9.0 | REACTOME AMINO ACID TRANSPORT ACROSS THE PLASMA MEMBRANE | Genes involved in Amino acid transport across the plasma membrane |
| 0.2 | 6.0 | REACTOME TRAF6 MEDIATED IRF7 ACTIVATION | Genes involved in TRAF6 mediated IRF7 activation |
| 0.2 | 3.7 | REACTOME SYNTHESIS SECRETION AND INACTIVATION OF GIP | Genes involved in Synthesis, Secretion, and Inactivation of Glucose-dependent Insulinotropic Polypeptide (GIP) |
| 0.2 | 4.1 | REACTOME DOWNREGULATION OF SMAD2 3 SMAD4 TRANSCRIPTIONAL ACTIVITY | Genes involved in Downregulation of SMAD2/3:SMAD4 transcriptional activity |
| 0.2 | 5.4 | REACTOME CHOLESTEROL BIOSYNTHESIS | Genes involved in Cholesterol biosynthesis |
| 0.1 | 4.3 | REACTOME INSULIN RECEPTOR RECYCLING | Genes involved in Insulin receptor recycling |
| 0.1 | 3.6 | REACTOME METABOLISM OF POLYAMINES | Genes involved in Metabolism of polyamines |
| 0.1 | 2.3 | REACTOME IL 6 SIGNALING | Genes involved in Interleukin-6 signaling |
| 0.1 | 2.4 | REACTOME G BETA GAMMA SIGNALLING THROUGH PLC BETA | Genes involved in G beta:gamma signalling through PLC beta |
| 0.1 | 4.1 | REACTOME DEADENYLATION OF MRNA | Genes involved in Deadenylation of mRNA |
| 0.1 | 1.3 | REACTOME PROSTANOID LIGAND RECEPTORS | Genes involved in Prostanoid ligand receptors |
| 0.1 | 3.1 | REACTOME FORMATION OF INCISION COMPLEX IN GG NER | Genes involved in Formation of incision complex in GG-NER |
| 0.1 | 1.9 | REACTOME PRE NOTCH TRANSCRIPTION AND TRANSLATION | Genes involved in Pre-NOTCH Transcription and Translation |
| 0.1 | 1.3 | REACTOME REVERSIBLE HYDRATION OF CARBON DIOXIDE | Genes involved in Reversible Hydration of Carbon Dioxide |
| 0.1 | 1.4 | REACTOME SYNTHESIS OF PE | Genes involved in Synthesis of PE |
| 0.1 | 0.4 | REACTOME TRANSPORT OF MATURE MRNA DERIVED FROM AN INTRONLESS TRANSCRIPT | Genes involved in Transport of Mature mRNA Derived from an Intronless Transcript |
| 0.1 | 1.7 | REACTOME PROLACTIN RECEPTOR SIGNALING | Genes involved in Prolactin receptor signaling |
| 0.1 | 1.5 | REACTOME OTHER SEMAPHORIN INTERACTIONS | Genes involved in Other semaphorin interactions |
| 0.1 | 2.9 | REACTOME DARPP 32 EVENTS | Genes involved in DARPP-32 events |
| 0.1 | 3.5 | REACTOME ANTIVIRAL MECHANISM BY IFN STIMULATED GENES | Genes involved in Antiviral mechanism by IFN-stimulated genes |
| 0.1 | 4.6 | REACTOME REGULATION OF ORNITHINE DECARBOXYLASE ODC | Genes involved in Regulation of ornithine decarboxylase (ODC) |
| 0.1 | 1.6 | REACTOME ERK MAPK TARGETS | Genes involved in ERK/MAPK targets |
| 0.1 | 1.9 | REACTOME SPHINGOLIPID DE NOVO BIOSYNTHESIS | Genes involved in Sphingolipid de novo biosynthesis |
| 0.1 | 0.8 | REACTOME NEF MEDIATED DOWNREGULATION OF MHC CLASS I COMPLEX CELL SURFACE EXPRESSION | Genes involved in Nef mediated downregulation of MHC class I complex cell surface expression |
| 0.1 | 4.9 | REACTOME MITOTIC PROMETAPHASE | Genes involved in Mitotic Prometaphase |
| 0.1 | 1.6 | REACTOME TRANSPORT OF MATURE TRANSCRIPT TO CYTOPLASM | Genes involved in Transport of Mature Transcript to Cytoplasm |
| 0.1 | 1.4 | REACTOME METABOLISM OF PORPHYRINS | Genes involved in Metabolism of porphyrins |
| 0.1 | 1.1 | REACTOME HYALURONAN METABOLISM | Genes involved in Hyaluronan metabolism |
| 0.1 | 0.7 | REACTOME SIGNALING BY FGFR3 MUTANTS | Genes involved in Signaling by FGFR3 mutants |
| 0.0 | 5.6 | REACTOME FACTORS INVOLVED IN MEGAKARYOCYTE DEVELOPMENT AND PLATELET PRODUCTION | Genes involved in Factors involved in megakaryocyte development and platelet production |
| 0.0 | 2.3 | REACTOME SEMA4D IN SEMAPHORIN SIGNALING | Genes involved in Sema4D in semaphorin signaling |
| 0.0 | 3.6 | REACTOME APOPTOTIC CLEAVAGE OF CELLULAR PROTEINS | Genes involved in Apoptotic cleavage of cellular proteins |
| 0.0 | 4.1 | REACTOME RESPIRATORY ELECTRON TRANSPORT | Genes involved in Respiratory electron transport |
| 0.0 | 1.1 | REACTOME HS GAG DEGRADATION | Genes involved in HS-GAG degradation |
| 0.0 | 3.3 | REACTOME FORMATION OF THE TERNARY COMPLEX AND SUBSEQUENTLY THE 43S COMPLEX | Genes involved in Formation of the ternary complex, and subsequently, the 43S complex |
| 0.0 | 0.8 | REACTOME PURINE RIBONUCLEOSIDE MONOPHOSPHATE BIOSYNTHESIS | Genes involved in Purine ribonucleoside monophosphate biosynthesis |
| 0.0 | 0.6 | REACTOME ROLE OF SECOND MESSENGERS IN NETRIN1 SIGNALING | Genes involved in Role of second messengers in netrin-1 signaling |
| 0.0 | 1.5 | REACTOME PEROXISOMAL LIPID METABOLISM | Genes involved in Peroxisomal lipid metabolism |
| 0.0 | 2.7 | REACTOME ACTIVATION OF CHAPERONE GENES BY XBP1S | Genes involved in Activation of Chaperone Genes by XBP1(S) |
| 0.0 | 5.5 | REACTOME INFLUENZA VIRAL RNA TRANSCRIPTION AND REPLICATION | Genes involved in Influenza Viral RNA Transcription and Replication |
| 0.0 | 0.8 | REACTOME INSULIN SYNTHESIS AND PROCESSING | Genes involved in Insulin Synthesis and Processing |
| 0.0 | 2.9 | REACTOME TRANS GOLGI NETWORK VESICLE BUDDING | Genes involved in trans-Golgi Network Vesicle Budding |
| 0.0 | 3.4 | REACTOME MRNA SPLICING | Genes involved in mRNA Splicing |
| 0.0 | 0.8 | REACTOME SYNTHESIS OF VERY LONG CHAIN FATTY ACYL COAS | Genes involved in Synthesis of very long-chain fatty acyl-CoAs |
| 0.0 | 1.2 | REACTOME SIGNAL TRANSDUCTION BY L1 | Genes involved in Signal transduction by L1 |
| 0.0 | 0.6 | REACTOME EXTRINSIC PATHWAY FOR APOPTOSIS | Genes involved in Extrinsic Pathway for Apoptosis |
| 0.0 | 0.4 | REACTOME REGULATION OF GENE EXPRESSION IN BETA CELLS | Genes involved in Regulation of gene expression in beta cells |
| 0.0 | 1.1 | REACTOME TRANSPORT TO THE GOLGI AND SUBSEQUENT MODIFICATION | Genes involved in Transport to the Golgi and subsequent modification |
| 0.0 | 1.3 | REACTOME L1CAM INTERACTIONS | Genes involved in L1CAM interactions |
| 0.0 | 0.8 | REACTOME GENERATION OF SECOND MESSENGER MOLECULES | Genes involved in Generation of second messenger molecules |
| 0.0 | 0.7 | REACTOME INTERFERON GAMMA SIGNALING | Genes involved in Interferon gamma signaling |
| 0.0 | 0.2 | REACTOME PLATELET CALCIUM HOMEOSTASIS | Genes involved in Platelet calcium homeostasis |