Project
GNF SymAtlas + NCI-60 cancer cell lines, comparison of cancers vs non-cancers, human (Su, 2004; Ross, 2000)
Navigation
Downloads
Results for UGCAGUC
Z-value: 0.04
Motif logo

miRNA associated with seed UGCAGUC
| Name | miRBASE accession |
|---|---|
|
hsa-miR-455-3p.2
|
Activity profile of UGCAGUC motif
Sorted Z-values of UGCAGUC motif
| Promoter | Log-likelihood | Transcript | Gene | Gene Info |
|---|---|---|---|---|
| chr2_+_149632783 | 2.75 |
ENST00000435030.1
|
KIF5C
|
kinesin family member 5C |
| chr6_-_46293378 | 2.71 |
ENST00000330430.6
|
RCAN2
|
regulator of calcineurin 2 |
| chr14_+_100150622 | 2.52 |
ENST00000261835.3
|
CYP46A1
|
cytochrome P450, family 46, subfamily A, polypeptide 1 |
| chr2_-_2334888 | 2.18 |
ENST00000428368.2
ENST00000399161.2 |
MYT1L
|
myelin transcription factor 1-like |
| chr11_-_134281812 | 2.15 |
ENST00000392580.1
ENST00000312527.4 |
B3GAT1
|
beta-1,3-glucuronyltransferase 1 (glucuronosyltransferase P) |
| chr12_-_16761007 | 2.14 |
ENST00000354662.1
ENST00000441439.2 |
LMO3
|
LIM domain only 3 (rhombotin-like 2) |
| chr14_+_93389425 | 1.73 |
ENST00000216492.5
ENST00000334654.4 |
CHGA
|
chromogranin A (parathyroid secretory protein 1) |
| chr2_-_169104651 | 1.54 |
ENST00000355999.4
|
STK39
|
serine threonine kinase 39 |
| chr17_-_78450398 | 1.50 |
ENST00000306773.4
|
NPTX1
|
neuronal pentraxin I |
| chr1_-_70671216 | 1.48 |
ENST00000370952.3
|
LRRC40
|
leucine rich repeat containing 40 |
| chr10_-_62149433 | 1.48 |
ENST00000280772.2
|
ANK3
|
ankyrin 3, node of Ranvier (ankyrin G) |
| chr12_+_110906169 | 1.46 |
ENST00000377673.5
|
FAM216A
|
family with sequence similarity 216, member A |
| chr7_-_44365020 | 1.41 |
ENST00000395747.2
ENST00000347193.4 ENST00000346990.4 ENST00000258682.6 ENST00000353625.4 ENST00000421607.1 ENST00000424197.1 ENST00000502837.2 ENST00000350811.3 ENST00000395749.2 |
CAMK2B
|
calcium/calmodulin-dependent protein kinase II beta |
| chr16_-_66785699 | 1.33 |
ENST00000258198.2
|
DYNC1LI2
|
dynein, cytoplasmic 1, light intermediate chain 2 |
| chr9_-_131790550 | 1.23 |
ENST00000372554.4
ENST00000372564.3 |
SH3GLB2
|
SH3-domain GRB2-like endophilin B2 |
| chr11_-_132813566 | 1.15 |
ENST00000331898.7
|
OPCML
|
opioid binding protein/cell adhesion molecule-like |
| chr3_-_18466787 | 1.15 |
ENST00000338745.6
ENST00000450898.1 |
SATB1
|
SATB homeobox 1 |
| chr1_-_21377447 | 1.11 |
ENST00000374937.3
ENST00000264211.8 |
EIF4G3
|
eukaryotic translation initiation factor 4 gamma, 3 |
| chr2_-_11484710 | 1.09 |
ENST00000315872.6
|
ROCK2
|
Rho-associated, coiled-coil containing protein kinase 2 |
| chr5_-_133561752 | 1.06 |
ENST00000519718.1
ENST00000481195.1 |
CTD-2410N18.5
PPP2CA
|
S-phase kinase-associated protein 1 protein phosphatase 2, catalytic subunit, alpha isozyme |
| chr1_+_87794150 | 1.03 |
ENST00000370544.5
|
LMO4
|
LIM domain only 4 |
| chr15_-_83316254 | 1.00 |
ENST00000567678.1
ENST00000450751.2 |
CPEB1
|
cytoplasmic polyadenylation element binding protein 1 |
| chr15_-_42749711 | 0.91 |
ENST00000565611.1
ENST00000263805.4 ENST00000565948.1 |
ZNF106
|
zinc finger protein 106 |
| chr15_+_49170083 | 0.86 |
ENST00000530028.2
|
EID1
|
EP300 interacting inhibitor of differentiation 1 |
| chr1_+_244214577 | 0.85 |
ENST00000358704.4
|
ZBTB18
|
zinc finger and BTB domain containing 18 |
| chr5_+_152870106 | 0.85 |
ENST00000285900.5
|
GRIA1
|
glutamate receptor, ionotropic, AMPA 1 |
| chr7_+_94139105 | 0.83 |
ENST00000297273.4
|
CASD1
|
CAS1 domain containing 1 |
| chr12_+_120933904 | 0.77 |
ENST00000550178.1
ENST00000550845.1 ENST00000549989.1 ENST00000552870.1 |
DYNLL1
|
dynein, light chain, LC8-type 1 |
| chr11_-_73472096 | 0.77 |
ENST00000541588.1
ENST00000336083.3 ENST00000540771.1 ENST00000310653.6 |
RAB6A
|
RAB6A, member RAS oncogene family |
| chr6_-_16761678 | 0.73 |
ENST00000244769.4
ENST00000436367.1 |
ATXN1
|
ataxin 1 |
| chr19_-_12834739 | 0.71 |
ENST00000589337.1
ENST00000425528.1 ENST00000441499.1 ENST00000588216.1 |
TNPO2
|
transportin 2 |
| chr10_-_47213626 | 0.71 |
ENST00000452145.2
|
AGAP10
|
ArfGAP with GTPase domain, ankyrin repeat and PH domain 10 |
| chr4_-_76598296 | 0.65 |
ENST00000395719.3
|
G3BP2
|
GTPase activating protein (SH3 domain) binding protein 2 |
| chr10_+_48189612 | 0.65 |
ENST00000453919.1
|
AGAP9
|
ArfGAP with GTPase domain, ankyrin repeat and PH domain 9 |
| chr11_-_70507901 | 0.64 |
ENST00000449833.2
ENST00000357171.3 ENST00000449116.2 |
SHANK2
|
SH3 and multiple ankyrin repeat domains 2 |
| chr3_-_123304017 | 0.64 |
ENST00000383657.5
|
PTPLB
|
protein tyrosine phosphatase-like (proline instead of catalytic arginine), member b |
| chr1_-_23670817 | 0.61 |
ENST00000478691.1
|
HNRNPR
|
heterogeneous nuclear ribonucleoprotein R |
| chr2_+_166326157 | 0.60 |
ENST00000421875.1
ENST00000314499.7 ENST00000409664.1 |
CSRNP3
|
cysteine-serine-rich nuclear protein 3 |
| chr4_-_99851766 | 0.59 |
ENST00000450253.2
|
EIF4E
|
eukaryotic translation initiation factor 4E |
| chr3_-_53880401 | 0.58 |
ENST00000315251.6
|
CHDH
|
choline dehydrogenase |
| chr15_+_33603147 | 0.55 |
ENST00000415757.3
ENST00000389232.4 |
RYR3
|
ryanodine receptor 3 |
| chr12_+_862089 | 0.54 |
ENST00000315939.6
ENST00000537687.1 ENST00000447667.2 |
WNK1
|
WNK lysine deficient protein kinase 1 |
| chr10_-_75255724 | 0.52 |
ENST00000342558.3
ENST00000360663.5 ENST00000394829.2 ENST00000394828.2 ENST00000394822.2 |
PPP3CB
|
protein phosphatase 3, catalytic subunit, beta isozyme |
| chr13_-_50367057 | 0.50 |
ENST00000261667.3
|
KPNA3
|
karyopherin alpha 3 (importin alpha 4) |
| chr10_-_104262426 | 0.49 |
ENST00000487599.1
|
ACTR1A
|
ARP1 actin-related protein 1 homolog A, centractin alpha (yeast) |
| chr20_+_56884752 | 0.49 |
ENST00000244040.3
|
RAB22A
|
RAB22A, member RAS oncogene family |
| chr10_+_112679301 | 0.48 |
ENST00000265277.5
ENST00000369452.4 |
SHOC2
|
soc-2 suppressor of clear homolog (C. elegans) |
| chr21_+_17102311 | 0.46 |
ENST00000285679.6
ENST00000351097.5 ENST00000285681.2 ENST00000400183.2 |
USP25
|
ubiquitin specific peptidase 25 |
| chr3_-_164913777 | 0.43 |
ENST00000475390.1
|
SLITRK3
|
SLIT and NTRK-like family, member 3 |
| chr4_-_42659102 | 0.43 |
ENST00000264449.10
ENST00000510289.1 ENST00000381668.5 |
ATP8A1
|
ATPase, aminophospholipid transporter (APLT), class I, type 8A, member 1 |
| chr2_-_154335300 | 0.42 |
ENST00000325926.3
|
RPRM
|
reprimo, TP53 dependent G2 arrest mediator candidate |
| chr19_-_3700388 | 0.41 |
ENST00000589578.1
ENST00000537021.1 ENST00000539785.1 ENST00000335312.3 |
PIP5K1C
|
phosphatidylinositol-4-phosphate 5-kinase, type I, gamma |
| chr15_+_66161871 | 0.39 |
ENST00000569896.1
|
RAB11A
|
RAB11A, member RAS oncogene family |
| chr1_+_237205476 | 0.32 |
ENST00000366574.2
|
RYR2
|
ryanodine receptor 2 (cardiac) |
| chr17_+_66508537 | 0.31 |
ENST00000392711.1
ENST00000585427.1 ENST00000589228.1 ENST00000536854.2 ENST00000588702.1 ENST00000589309.1 |
PRKAR1A
|
protein kinase, cAMP-dependent, regulatory, type I, alpha |
| chr14_+_103243813 | 0.30 |
ENST00000560371.1
ENST00000347662.4 ENST00000392745.2 ENST00000539721.1 ENST00000560463.1 |
TRAF3
|
TNF receptor-associated factor 3 |
| chr4_+_170541660 | 0.30 |
ENST00000513761.1
ENST00000347613.4 |
CLCN3
|
chloride channel, voltage-sensitive 3 |
| chr12_-_53893399 | 0.30 |
ENST00000267079.2
|
MAP3K12
|
mitogen-activated protein kinase kinase kinase 12 |
| chr14_+_57046500 | 0.26 |
ENST00000261556.6
|
TMEM260
|
transmembrane protein 260 |
| chr1_-_35658736 | 0.26 |
ENST00000357214.5
|
SFPQ
|
splicing factor proline/glutamine-rich |
| chr7_+_101928380 | 0.25 |
ENST00000536178.1
|
SH2B2
|
SH2B adaptor protein 2 |
| chr2_-_148778258 | 0.24 |
ENST00000392857.5
ENST00000457954.1 ENST00000392858.1 ENST00000542387.1 |
ORC4
|
origin recognition complex, subunit 4 |
| chr1_-_43833628 | 0.23 |
ENST00000413844.2
ENST00000372458.3 |
ELOVL1
|
ELOVL fatty acid elongase 1 |
| chr17_-_62502639 | 0.22 |
ENST00000225792.5
ENST00000581697.1 ENST00000584279.1 ENST00000577922.1 |
DDX5
|
DEAD (Asp-Glu-Ala-Asp) box helicase 5 |
| chr3_+_126707437 | 0.22 |
ENST00000393409.2
ENST00000251772.4 |
PLXNA1
|
plexin A1 |
| chr20_+_3451650 | 0.22 |
ENST00000262919.5
|
ATRN
|
attractin |
| chr1_-_115880852 | 0.21 |
ENST00000369512.2
|
NGF
|
nerve growth factor (beta polypeptide) |
| chr14_+_71108460 | 0.21 |
ENST00000256367.2
|
TTC9
|
tetratricopeptide repeat domain 9 |
| chr7_-_32931387 | 0.20 |
ENST00000304056.4
|
KBTBD2
|
kelch repeat and BTB (POZ) domain containing 2 |
| chr16_-_4897266 | 0.20 |
ENST00000591451.1
ENST00000436648.5 ENST00000381983.3 ENST00000588297.1 ENST00000321919.9 |
GLYR1
|
glyoxylate reductase 1 homolog (Arabidopsis) |
| chr20_-_14318248 | 0.18 |
ENST00000378053.3
ENST00000341420.4 |
FLRT3
|
fibronectin leucine rich transmembrane protein 3 |
| chr2_-_69870835 | 0.15 |
ENST00000409085.4
ENST00000406297.3 |
AAK1
|
AP2 associated kinase 1 |
| chr3_+_58291965 | 0.15 |
ENST00000445193.3
ENST00000295959.5 ENST00000466547.1 |
RPP14
|
ribonuclease P/MRP 14kDa subunit |
| chr14_-_21737610 | 0.15 |
ENST00000320084.7
ENST00000449098.1 ENST00000336053.6 |
HNRNPC
|
heterogeneous nuclear ribonucleoprotein C (C1/C2) |
| chr3_-_129407535 | 0.14 |
ENST00000432054.2
|
TMCC1
|
transmembrane and coiled-coil domain family 1 |
| chr1_+_29063271 | 0.14 |
ENST00000373812.3
|
YTHDF2
|
YTH domain family, member 2 |
| chr6_+_161412759 | 0.13 |
ENST00000366919.2
ENST00000392142.4 ENST00000366920.2 ENST00000348824.7 |
MAP3K4
|
mitogen-activated protein kinase kinase kinase 4 |
| chr3_+_178866199 | 0.13 |
ENST00000263967.3
|
PIK3CA
|
phosphatidylinositol-4,5-bisphosphate 3-kinase, catalytic subunit alpha |
| chr2_+_48010221 | 0.12 |
ENST00000234420.5
|
MSH6
|
mutS homolog 6 |
| chr15_+_77287426 | 0.11 |
ENST00000558012.1
ENST00000267939.5 ENST00000379595.3 |
PSTPIP1
|
proline-serine-threonine phosphatase interacting protein 1 |
| chr5_+_122110691 | 0.11 |
ENST00000379516.2
ENST00000505934.1 ENST00000514949.1 |
SNX2
|
sorting nexin 2 |
| chr6_+_4021554 | 0.11 |
ENST00000337659.6
|
PRPF4B
|
pre-mRNA processing factor 4B |
| chrX_+_107683096 | 0.11 |
ENST00000328300.6
ENST00000361603.2 |
COL4A5
|
collagen, type IV, alpha 5 |
| chr5_+_167718604 | 0.10 |
ENST00000265293.4
|
WWC1
|
WW and C2 domain containing 1 |
| chr1_-_205326022 | 0.09 |
ENST00000367155.3
|
KLHDC8A
|
kelch domain containing 8A |
| chr1_+_171454659 | 0.09 |
ENST00000367742.3
ENST00000338920.4 |
PRRC2C
|
proline-rich coiled-coil 2C |
| chr9_+_112403088 | 0.07 |
ENST00000448454.2
|
PALM2
|
paralemmin 2 |
| chr3_-_15106747 | 0.05 |
ENST00000449354.2
ENST00000444840.2 ENST00000253686.2 |
MRPS25
|
mitochondrial ribosomal protein S25 |
| chr9_-_123555655 | 0.04 |
ENST00000340778.5
ENST00000453291.1 ENST00000608872.1 |
FBXW2
|
F-box and WD repeat domain containing 2 |
| chr8_-_68255912 | 0.04 |
ENST00000262215.3
ENST00000519436.1 |
ARFGEF1
|
ADP-ribosylation factor guanine nucleotide-exchange factor 1 (brefeldin A-inhibited) |
| chr1_-_53793584 | 0.04 |
ENST00000354412.3
ENST00000347547.2 ENST00000306052.6 |
LRP8
|
low density lipoprotein receptor-related protein 8, apolipoprotein e receptor |
| chr1_+_11751748 | 0.03 |
ENST00000294485.5
|
DRAXIN
|
dorsal inhibitory axon guidance protein |
| chr14_-_55878538 | 0.03 |
ENST00000247178.5
|
ATG14
|
autophagy related 14 |
| chr3_-_11762202 | 0.03 |
ENST00000445411.1
ENST00000404339.1 ENST00000273038.3 |
VGLL4
|
vestigial like 4 (Drosophila) |
| chr3_-_38835501 | 0.03 |
ENST00000449082.2
|
SCN10A
|
sodium channel, voltage-gated, type X, alpha subunit |
| chr3_+_137906109 | 0.02 |
ENST00000481646.1
ENST00000469044.1 ENST00000491704.1 ENST00000461600.1 |
ARMC8
|
armadillo repeat containing 8 |
| chr6_+_142468361 | 0.02 |
ENST00000367630.4
|
VTA1
|
vesicle (multivesicular body) trafficking 1 |
| chr5_-_81046922 | 0.02 |
ENST00000514493.1
ENST00000320672.4 |
SSBP2
|
single-stranded DNA binding protein 2 |
| chr5_-_32444828 | 0.00 |
ENST00000265069.8
|
ZFR
|
zinc finger RNA binding protein |
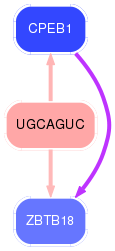
Network of associatons between targets according to the STRING database.

First level regulatory network of UGCAGUC
Gene Ontology Analysis
Gene overrepresentation in biological_process category:
| Log-likelihood per target | Total log-likelihood | Term | Description |
|---|---|---|---|
| 0.7 | 2.1 | GO:0023016 | signal transduction by trans-phosphorylation(GO:0023016) |
| 0.6 | 1.7 | GO:2000705 | dense core granule biogenesis(GO:0061110) positive regulation of relaxation of cardiac muscle(GO:1901899) regulation of dense core granule biogenesis(GO:2000705) |
| 0.4 | 1.5 | GO:0072660 | positive regulation of cell communication by electrical coupling(GO:0010650) maintenance of protein location in membrane(GO:0072658) maintenance of protein location in plasma membrane(GO:0072660) positive regulation of membrane depolarization during cardiac muscle cell action potential(GO:1900827) |
| 0.4 | 2.1 | GO:2000324 | positive regulation of glucocorticoid receptor signaling pathway(GO:2000324) |
| 0.3 | 1.1 | GO:1903347 | negative regulation of bicellular tight junction assembly(GO:1903347) |
| 0.3 | 2.5 | GO:0016127 | cholesterol catabolic process(GO:0006707) sterol catabolic process(GO:0016127) |
| 0.2 | 0.8 | GO:0018125 | peptidyl-cysteine methylation(GO:0018125) minus-end-directed organelle transport along microtubule(GO:0072385) |
| 0.2 | 1.5 | GO:0060385 | axonogenesis involved in innervation(GO:0060385) |
| 0.1 | 1.0 | GO:0021527 | spinal cord association neuron differentiation(GO:0021527) |
| 0.1 | 0.6 | GO:0071286 | cellular response to magnesium ion(GO:0071286) |
| 0.1 | 0.3 | GO:0003220 | left ventricular cardiac muscle tissue morphogenesis(GO:0003220) |
| 0.1 | 0.4 | GO:0061092 | regulation of phospholipid translocation(GO:0061091) positive regulation of phospholipid translocation(GO:0061092) |
| 0.1 | 0.8 | GO:0099566 | regulation of postsynaptic cytosolic calcium ion concentration(GO:0099566) |
| 0.1 | 3.0 | GO:0008045 | motor neuron axon guidance(GO:0008045) |
| 0.1 | 0.4 | GO:0010796 | regulation of multivesicular body size(GO:0010796) |
| 0.1 | 1.4 | GO:0051823 | regulation of synapse structural plasticity(GO:0051823) |
| 0.1 | 0.6 | GO:0042426 | choline catabolic process(GO:0042426) |
| 0.1 | 0.3 | GO:0008063 | Toll signaling pathway(GO:0008063) |
| 0.1 | 1.9 | GO:0048665 | neuron fate specification(GO:0048665) |
| 0.1 | 0.3 | GO:2000672 | negative regulation of motor neuron apoptotic process(GO:2000672) |
| 0.1 | 1.1 | GO:0043374 | CD8-positive, alpha-beta T cell differentiation(GO:0043374) |
| 0.1 | 1.1 | GO:0042532 | negative regulation of tyrosine phosphorylation of STAT protein(GO:0042532) |
| 0.1 | 0.8 | GO:0035721 | intraciliary retrograde transport(GO:0035721) positive regulation of microtubule motor activity(GO:2000576) regulation of ATP-dependent microtubule motor activity, plus-end-directed(GO:2000580) positive regulation of ATP-dependent microtubule motor activity, plus-end-directed(GO:2000582) |
| 0.1 | 0.5 | GO:2000766 | negative regulation of cytoplasmic translation(GO:2000766) |
| 0.1 | 2.7 | GO:0070884 | regulation of calcineurin-NFAT signaling cascade(GO:0070884) |
| 0.1 | 0.3 | GO:0048388 | endosomal lumen acidification(GO:0048388) |
| 0.0 | 2.0 | GO:0050650 | chondroitin sulfate proteoglycan biosynthetic process(GO:0050650) |
| 0.0 | 0.7 | GO:0006610 | ribosomal protein import into nucleus(GO:0006610) |
| 0.0 | 0.5 | GO:0033173 | calcineurin-NFAT signaling cascade(GO:0033173) |
| 0.0 | 0.1 | GO:2000653 | regulation of genetic imprinting(GO:2000653) |
| 0.0 | 0.6 | GO:0034063 | stress granule assembly(GO:0034063) |
| 0.0 | 0.3 | GO:0045876 | positive regulation of sister chromatid cohesion(GO:0045876) |
| 0.0 | 0.5 | GO:1904293 | negative regulation of ERAD pathway(GO:1904293) |
| 0.0 | 0.2 | GO:0032455 | nerve growth factor processing(GO:0032455) |
| 0.0 | 1.3 | GO:0051642 | centrosome localization(GO:0051642) |
| 0.0 | 0.2 | GO:0019367 | fatty acid elongation, saturated fatty acid(GO:0019367) fatty acid elongation, unsaturated fatty acid(GO:0019368) fatty acid elongation, monounsaturated fatty acid(GO:0034625) fatty acid elongation, polyunsaturated fatty acid(GO:0034626) |
| 0.0 | 0.1 | GO:0007538 | primary sex determination(GO:0007538) |
| 0.0 | 0.8 | GO:0061157 | mRNA destabilization(GO:0061157) |
| 0.0 | 1.0 | GO:0008038 | neuron recognition(GO:0008038) |
| 0.0 | 0.3 | GO:0046007 | negative regulation of activated T cell proliferation(GO:0046007) |
| 0.0 | 0.6 | GO:0071625 | vocalization behavior(GO:0071625) |
| 0.0 | 0.1 | GO:0000710 | meiotic mismatch repair(GO:0000710) |
| 0.0 | 0.2 | GO:0003344 | pericardium morphogenesis(GO:0003344) |
| 0.0 | 1.3 | GO:0010507 | negative regulation of autophagy(GO:0010507) |
| 0.0 | 0.1 | GO:0035331 | negative regulation of hippo signaling(GO:0035331) |
| 0.0 | 0.2 | GO:1903800 | positive regulation of production of miRNAs involved in gene silencing by miRNA(GO:1903800) |
| 0.0 | 0.0 | GO:0090283 | regulation of protein glycosylation in Golgi(GO:0090283) |
| 0.0 | 0.5 | GO:0046579 | positive regulation of Ras protein signal transduction(GO:0046579) |
| 0.0 | 0.4 | GO:0048488 | synaptic vesicle endocytosis(GO:0048488) |
| 0.0 | 0.9 | GO:0035065 | regulation of histone acetylation(GO:0035065) |
Gene overrepresentation in cellular_component category:
| Log-likelihood per target | Total log-likelihood | Term | Description |
|---|---|---|---|
| 0.2 | 2.8 | GO:0035253 | ciliary rootlet(GO:0035253) |
| 0.2 | 0.8 | GO:0044308 | axonal spine(GO:0044308) |
| 0.1 | 0.7 | GO:0042272 | nuclear RNA export factor complex(GO:0042272) |
| 0.1 | 0.8 | GO:0070381 | endosome to plasma membrane transport vesicle(GO:0070381) |
| 0.1 | 2.2 | GO:0042583 | chromaffin granule(GO:0042583) |
| 0.1 | 1.5 | GO:0043194 | axon initial segment(GO:0043194) |
| 0.1 | 0.5 | GO:0002177 | manchette(GO:0002177) |
| 0.1 | 0.4 | GO:0098837 | postsynaptic recycling endosome(GO:0098837) |
| 0.1 | 2.1 | GO:0005868 | cytoplasmic dynein complex(GO:0005868) |
| 0.1 | 1.3 | GO:0016281 | eukaryotic translation initiation factor 4F complex(GO:0016281) |
| 0.1 | 0.5 | GO:0005955 | calcineurin complex(GO:0005955) |
| 0.0 | 0.3 | GO:0014701 | junctional sarcoplasmic reticulum membrane(GO:0014701) |
| 0.0 | 2.0 | GO:0033017 | sarcoplasmic reticulum membrane(GO:0033017) |
| 0.0 | 0.6 | GO:0005883 | neurofilament(GO:0005883) |
| 0.0 | 0.2 | GO:0002116 | semaphorin receptor complex(GO:0002116) |
| 0.0 | 0.3 | GO:0042382 | paraspeckles(GO:0042382) |
| 0.0 | 1.1 | GO:0000159 | protein phosphatase type 2A complex(GO:0000159) |
| 0.0 | 0.1 | GO:0032301 | MutSalpha complex(GO:0032301) |
| 0.0 | 0.5 | GO:1990124 | messenger ribonucleoprotein complex(GO:1990124) |
| 0.0 | 0.1 | GO:0005943 | phosphatidylinositol 3-kinase complex, class IA(GO:0005943) |
| 0.0 | 1.1 | GO:0005720 | nuclear heterochromatin(GO:0005720) |
| 0.0 | 0.5 | GO:0031254 | uropod(GO:0001931) cell trailing edge(GO:0031254) |
| 0.0 | 0.8 | GO:0030173 | integral component of Golgi membrane(GO:0030173) |
| 0.0 | 0.3 | GO:0035631 | CD40 receptor complex(GO:0035631) |
| 0.0 | 0.1 | GO:0030905 | retromer, tubulation complex(GO:0030905) |
| 0.0 | 0.2 | GO:0000808 | origin recognition complex(GO:0000808) nuclear origin of replication recognition complex(GO:0005664) |
| 0.0 | 0.9 | GO:0045171 | intercellular bridge(GO:0045171) |
| 0.0 | 0.3 | GO:0031588 | cAMP-dependent protein kinase complex(GO:0005952) nucleotide-activated protein kinase complex(GO:0031588) |
| 0.0 | 0.1 | GO:0005587 | collagen type IV trimer(GO:0005587) |
| 0.0 | 0.1 | GO:0030681 | multimeric ribonuclease P complex(GO:0030681) |
| 0.0 | 0.0 | GO:1903349 | omegasome membrane(GO:1903349) |
| 0.0 | 0.2 | GO:0000164 | protein phosphatase type 1 complex(GO:0000164) |
Gene overrepresentation in molecular_function category:
| Log-likelihood per target | Total log-likelihood | Term | Description |
|---|---|---|---|
| 0.7 | 2.1 | GO:0015018 | galactosylgalactosylxylosylprotein 3-beta-glucuronosyltransferase activity(GO:0015018) |
| 0.5 | 2.7 | GO:0008597 | calcium-dependent protein serine/threonine phosphatase regulator activity(GO:0008597) |
| 0.2 | 0.9 | GO:0048763 | calcium-induced calcium release activity(GO:0048763) |
| 0.2 | 1.3 | GO:0045504 | dynein heavy chain binding(GO:0045504) |
| 0.2 | 0.5 | GO:1904455 | ubiquitin-specific protease activity involved in negative regulation of ERAD pathway(GO:1904455) |
| 0.1 | 0.7 | GO:0034046 | poly(G) binding(GO:0034046) |
| 0.1 | 3.5 | GO:0008574 | ATP-dependent microtubule motor activity, plus-end-directed(GO:0008574) |
| 0.1 | 0.8 | GO:0099583 | neurotransmitter receptor activity involved in regulation of postsynaptic membrane potential(GO:0099529) neurotransmitter receptor activity involved in regulation of postsynaptic cytosolic calcium ion concentration(GO:0099583) transmitter-gated ion channel activity involved in regulation of postsynaptic membrane potential(GO:1904315) |
| 0.1 | 0.4 | GO:0052812 | phosphatidylinositol-3,4-bisphosphate 5-kinase activity(GO:0052812) |
| 0.1 | 0.6 | GO:0030160 | GKAP/Homer scaffold activity(GO:0030160) |
| 0.1 | 1.7 | GO:0000339 | RNA cap binding(GO:0000339) |
| 0.1 | 0.8 | GO:0016413 | O-acetyltransferase activity(GO:0016413) |
| 0.1 | 2.5 | GO:0008395 | steroid hydroxylase activity(GO:0008395) |
| 0.1 | 0.2 | GO:0004616 | phosphogluconate dehydrogenase (decarboxylating) activity(GO:0004616) |
| 0.1 | 0.5 | GO:0033192 | calmodulin-dependent protein phosphatase activity(GO:0033192) |
| 0.1 | 1.1 | GO:0050811 | GABA receptor binding(GO:0050811) |
| 0.0 | 0.3 | GO:0072320 | volume-sensitive chloride channel activity(GO:0072320) |
| 0.0 | 1.2 | GO:0031489 | myosin V binding(GO:0031489) |
| 0.0 | 0.3 | GO:0008269 | JAK pathway signal transduction adaptor activity(GO:0008269) |
| 0.0 | 0.5 | GO:0019870 | potassium channel inhibitor activity(GO:0019870) |
| 0.0 | 0.2 | GO:0102338 | fatty acid elongase activity(GO:0009922) 3-oxo-arachidoyl-CoA synthase activity(GO:0102336) 3-oxo-cerotoyl-CoA synthase activity(GO:0102337) 3-oxo-lignoceronyl-CoA synthase activity(GO:0102338) |
| 0.0 | 0.2 | GO:0035500 | MH2 domain binding(GO:0035500) |
| 0.0 | 0.5 | GO:0035925 | mRNA 3'-UTR AU-rich region binding(GO:0035925) |
| 0.0 | 1.5 | GO:0030507 | spectrin binding(GO:0030507) |
| 0.0 | 1.4 | GO:0004683 | calmodulin-dependent protein kinase activity(GO:0004683) |
| 0.0 | 0.1 | GO:0032143 | single thymine insertion binding(GO:0032143) |
| 0.0 | 0.9 | GO:0008139 | nuclear localization sequence binding(GO:0008139) |
| 0.0 | 0.1 | GO:1990460 | leptin receptor binding(GO:1990460) |
| 0.0 | 0.3 | GO:1990247 | N6-methyladenosine-containing RNA binding(GO:1990247) |
| 0.0 | 0.6 | GO:0030159 | receptor signaling complex scaffold activity(GO:0030159) |
| 0.0 | 0.9 | GO:0035035 | histone acetyltransferase binding(GO:0035035) |
| 0.0 | 0.3 | GO:0031996 | thioesterase binding(GO:0031996) |
| 0.0 | 0.1 | GO:0035005 | 1-phosphatidylinositol-4-phosphate 3-kinase activity(GO:0035005) |
| 0.0 | 0.5 | GO:0008157 | protein phosphatase 1 binding(GO:0008157) |
| 0.0 | 0.4 | GO:0004012 | phospholipid-translocating ATPase activity(GO:0004012) |
| 0.0 | 0.3 | GO:0008603 | cAMP-dependent protein kinase inhibitor activity(GO:0004862) cAMP-dependent protein kinase regulator activity(GO:0008603) |
| 0.0 | 0.2 | GO:0003688 | DNA replication origin binding(GO:0003688) |
| 0.0 | 0.2 | GO:0017154 | semaphorin receptor activity(GO:0017154) |
| 0.0 | 0.4 | GO:0004709 | MAP kinase kinase kinase activity(GO:0004709) |
| 0.0 | 0.2 | GO:0045499 | chemorepellent activity(GO:0045499) |
| 0.0 | 0.2 | GO:0035612 | AP-2 adaptor complex binding(GO:0035612) |
| 0.0 | 0.2 | GO:0005165 | neurotrophin receptor binding(GO:0005165) |
Gene overrepresentation in C2:CP category:
| Log-likelihood per target | Total log-likelihood | Term | Description |
|---|---|---|---|
| 0.1 | 1.1 | PID THROMBIN PAR4 PATHWAY | PAR4-mediated thrombin signaling events |
| 0.1 | 3.0 | PID TCR CALCIUM PATHWAY | Calcium signaling in the CD4+ TCR pathway |
| 0.0 | 1.4 | ST WNT CA2 CYCLIC GMP PATHWAY | Wnt/Ca2+/cyclic GMP signaling. |
| 0.0 | 1.5 | PID IL8 CXCR2 PATHWAY | IL8- and CXCR2-mediated signaling events |
| 0.0 | 1.0 | PID AURORA A PATHWAY | Aurora A signaling |
| 0.0 | 0.2 | SA TRKA RECEPTOR | The TrkA receptor binds nerve growth factor to activate MAP kinase pathways and promote cell growth. |
| 0.0 | 0.4 | PID NECTIN PATHWAY | Nectin adhesion pathway |
| 0.0 | 1.0 | PID EPHB FWD PATHWAY | EPHB forward signaling |
| 0.0 | 1.0 | PID IL6 7 PATHWAY | IL6-mediated signaling events |
| 0.0 | 0.6 | ST ERK1 ERK2 MAPK PATHWAY | ERK1/ERK2 MAPK Pathway |
| 0.0 | 1.1 | PID TCR PATHWAY | TCR signaling in naïve CD4+ T cells |
| 0.0 | 0.3 | PID P38 ALPHA BETA PATHWAY | Regulation of p38-alpha and p38-beta |
| 0.0 | 1.1 | PID CASPASE PATHWAY | Caspase cascade in apoptosis |
Gene overrepresentation in C2:CP:REACTOME category:
| Log-likelihood per target | Total log-likelihood | Term | Description |
|---|---|---|---|
| 0.3 | 2.5 | REACTOME SYNTHESIS OF BILE ACIDS AND BILE SALTS VIA 24 HYDROXYCHOLESTEROL | Genes involved in Synthesis of bile acids and bile salts via 24-hydroxycholesterol |
| 0.1 | 2.3 | REACTOME UNBLOCKING OF NMDA RECEPTOR GLUTAMATE BINDING AND ACTIVATION | Genes involved in Unblocking of NMDA receptor, glutamate binding and activation |
| 0.1 | 1.1 | REACTOME ERKS ARE INACTIVATED | Genes involved in ERKs are inactivated |
| 0.1 | 2.0 | REACTOME A TETRASACCHARIDE LINKER SEQUENCE IS REQUIRED FOR GAG SYNTHESIS | Genes involved in A tetrasaccharide linker sequence is required for GAG synthesis |
| 0.0 | 1.5 | REACTOME INTERACTION BETWEEN L1 AND ANKYRINS | Genes involved in Interaction between L1 and Ankyrins |
| 0.0 | 0.8 | REACTOME PRE NOTCH PROCESSING IN GOLGI | Genes involved in Pre-NOTCH Processing in Golgi |
| 0.0 | 0.6 | REACTOME SEMA3A PLEXIN REPULSION SIGNALING BY INHIBITING INTEGRIN ADHESION | Genes involved in SEMA3A-Plexin repulsion signaling by inhibiting Integrin adhesion |
| 0.0 | 0.8 | REACTOME ACTIVATION OF BH3 ONLY PROTEINS | Genes involved in Activation of BH3-only proteins |
| 0.0 | 0.2 | REACTOME CDC6 ASSOCIATION WITH THE ORC ORIGIN COMPLEX | Genes involved in CDC6 association with the ORC:origin complex |
| 0.0 | 0.2 | REACTOME NFKB IS ACTIVATED AND SIGNALS SURVIVAL | Genes involved in NF-kB is activated and signals survival |
| 0.0 | 0.8 | REACTOME DARPP 32 EVENTS | Genes involved in DARPP-32 events |
| 0.0 | 0.3 | REACTOME TRAF3 DEPENDENT IRF ACTIVATION PATHWAY | Genes involved in TRAF3-dependent IRF activation pathway |
| 0.0 | 1.5 | REACTOME ANTIVIRAL MECHANISM BY IFN STIMULATED GENES | Genes involved in Antiviral mechanism by IFN-stimulated genes |
| 0.0 | 1.8 | REACTOME MHC CLASS II ANTIGEN PRESENTATION | Genes involved in MHC class II antigen presentation |
| 0.0 | 1.1 | REACTOME APOPTOTIC CLEAVAGE OF CELLULAR PROTEINS | Genes involved in Apoptotic cleavage of cellular proteins |
| 0.0 | 0.2 | REACTOME SYNTHESIS OF VERY LONG CHAIN FATTY ACYL COAS | Genes involved in Synthesis of very long-chain fatty acyl-CoAs |