Project
GNF SymAtlas + NCI-60 cancer cell lines, comparison of cancers vs non-cancers, human (Su, 2004; Ross, 2000)
Navigation
Downloads
Results for ZFHX3
Z-value: 0.16
Motif logo

Transcription factors associated with ZFHX3
| Gene Symbol | Gene ID | Gene Info |
|---|---|---|
|
ZFHX3
|
ENSG00000140836.10 | zinc finger homeobox 3 |
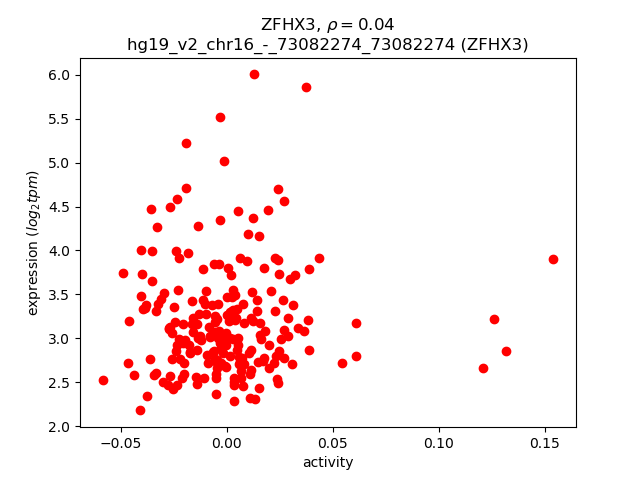
Activity-expression correlation:
| Gene | Promoter | Pearson corr. coef. | P-value | Plot |
|---|---|---|---|---|
| ZFHX3 | hg19_v2_chr16_-_73082274_73082274, hg19_v2_chr16_-_73093597_73093597 | 0.04 | 5.9e-01 | Click! |
Activity profile of ZFHX3 motif
Sorted Z-values of ZFHX3 motif
| Promoter | Log-likelihood | Transcript | Gene | Gene Info |
|---|---|---|---|---|
| chr14_+_95027772 | 5.41 |
ENST00000555095.1
ENST00000298841.5 ENST00000554220.1 ENST00000553780.1 |
SERPINA4
SERPINA5
|
serpin peptidase inhibitor, clade A (alpha-1 antiproteinase, antitrypsin), member 4 serpin peptidase inhibitor, clade A (alpha-1 antiproteinase, antitrypsin), member 5 |
| chr17_-_64225508 | 5.40 |
ENST00000205948.6
|
APOH
|
apolipoprotein H (beta-2-glycoprotein I) |
| chr4_-_155511887 | 5.02 |
ENST00000302053.3
ENST00000403106.3 |
FGA
|
fibrinogen alpha chain |
| chr7_+_130126012 | 4.55 |
ENST00000341441.5
|
MEST
|
mesoderm specific transcript |
| chr17_-_26697304 | 4.44 |
ENST00000536498.1
|
VTN
|
vitronectin |
| chr7_+_130126165 | 4.30 |
ENST00000427521.1
ENST00000416162.2 ENST00000378576.4 |
MEST
|
mesoderm specific transcript |
| chr6_+_161123270 | 4.06 |
ENST00000366924.2
ENST00000308192.9 ENST00000418964.1 |
PLG
|
plasminogen |
| chr15_+_58724184 | 3.92 |
ENST00000433326.2
|
LIPC
|
lipase, hepatic |
| chr17_+_41052808 | 3.19 |
ENST00000592383.1
ENST00000253801.2 ENST00000585489.1 |
G6PC
|
glucose-6-phosphatase, catalytic subunit |
| chr9_-_123812542 | 2.88 |
ENST00000223642.1
|
C5
|
complement component 5 |
| chr1_+_63063152 | 2.87 |
ENST00000371129.3
|
ANGPTL3
|
angiopoietin-like 3 |
| chr19_-_36304201 | 2.86 |
ENST00000301175.3
|
PRODH2
|
proline dehydrogenase (oxidase) 2 |
| chr1_+_159557607 | 2.45 |
ENST00000255040.2
|
APCS
|
amyloid P component, serum |
| chr2_+_234621551 | 2.40 |
ENST00000608381.1
ENST00000373414.3 |
UGT1A1
UGT1A5
|
UDP glucuronosyltransferase 1 family, polypeptide A8 UDP glucuronosyltransferase 1 family, polypeptide A5 |
| chr11_+_22696314 | 2.37 |
ENST00000532398.1
ENST00000433790.1 |
GAS2
|
growth arrest-specific 2 |
| chr2_+_234637754 | 2.28 |
ENST00000482026.1
ENST00000609767.1 |
UGT1A3
UGT1A1
|
UDP glucuronosyltransferase 1 family, polypeptide A3 UDP glucuronosyltransferase 1 family, polypeptide A8 |
| chr2_+_234627424 | 2.20 |
ENST00000373409.3
|
UGT1A4
|
UDP glucuronosyltransferase 1 family, polypeptide A4 |
| chr22_-_30970560 | 2.03 |
ENST00000402369.1
ENST00000406361.1 |
GAL3ST1
|
galactose-3-O-sulfotransferase 1 |
| chr2_+_88047606 | 1.96 |
ENST00000359481.4
|
PLGLB2
|
plasminogen-like B2 |
| chr7_-_100026280 | 1.94 |
ENST00000360951.4
ENST00000398027.2 ENST00000324725.6 ENST00000472716.1 |
ZCWPW1
|
zinc finger, CW type with PWWP domain 1 |
| chr2_-_87248975 | 1.86 |
ENST00000409310.2
ENST00000355705.3 |
PLGLB1
|
plasminogen-like B1 |
| chr6_-_161085291 | 1.72 |
ENST00000316300.5
|
LPA
|
lipoprotein, Lp(a) |
| chr4_-_149365827 | 1.61 |
ENST00000344721.4
|
NR3C2
|
nuclear receptor subfamily 3, group C, member 2 |
| chrX_-_18690210 | 1.58 |
ENST00000379984.3
|
RS1
|
retinoschisin 1 |
| chr3_-_114477787 | 1.53 |
ENST00000464560.1
|
ZBTB20
|
zinc finger and BTB domain containing 20 |
| chr3_+_35722487 | 1.34 |
ENST00000441454.1
|
ARPP21
|
cAMP-regulated phosphoprotein, 21kDa |
| chrX_-_110655306 | 1.34 |
ENST00000371993.2
|
DCX
|
doublecortin |
| chr19_+_50016610 | 1.26 |
ENST00000596975.1
|
FCGRT
|
Fc fragment of IgG, receptor, transporter, alpha |
| chr4_+_3443614 | 1.25 |
ENST00000382774.3
ENST00000511533.1 |
HGFAC
|
HGF activator |
| chr3_+_46919235 | 1.23 |
ENST00000449590.1
|
PTH1R
|
parathyroid hormone 1 receptor |
| chr11_+_8040739 | 1.15 |
ENST00000534099.1
|
TUB
|
tubby bipartite transcription factor |
| chr8_+_104831472 | 1.05 |
ENST00000262231.10
ENST00000507740.1 |
RIMS2
|
regulating synaptic membrane exocytosis 2 |
| chr4_+_74347400 | 1.04 |
ENST00000226355.3
|
AFM
|
afamin |
| chr7_-_44580861 | 1.03 |
ENST00000546276.1
ENST00000289547.4 ENST00000381160.3 ENST00000423141.1 |
NPC1L1
|
NPC1-like 1 |
| chrX_-_32173579 | 0.99 |
ENST00000359836.1
ENST00000343523.2 ENST00000378707.3 ENST00000541735.1 ENST00000474231.1 |
DMD
|
dystrophin |
| chr2_-_60780536 | 0.98 |
ENST00000538214.1
|
BCL11A
|
B-cell CLL/lymphoma 11A (zinc finger protein) |
| chr20_+_42187608 | 0.91 |
ENST00000373100.1
|
SGK2
|
serum/glucocorticoid regulated kinase 2 |
| chr20_+_42187682 | 0.88 |
ENST00000373092.3
ENST00000373077.1 |
SGK2
|
serum/glucocorticoid regulated kinase 2 |
| chr11_-_61687739 | 0.85 |
ENST00000531922.1
ENST00000301773.5 |
RAB3IL1
|
RAB3A interacting protein (rabin3)-like 1 |
| chr4_+_100495864 | 0.82 |
ENST00000265517.5
ENST00000422897.2 |
MTTP
|
microsomal triglyceride transfer protein |
| chr6_+_28317685 | 0.79 |
ENST00000252211.2
ENST00000341464.5 ENST00000377255.3 |
ZKSCAN3
|
zinc finger with KRAB and SCAN domains 3 |
| chr5_+_95066823 | 0.79 |
ENST00000506817.1
ENST00000379982.3 |
RHOBTB3
|
Rho-related BTB domain containing 3 |
| chr2_-_60780702 | 0.77 |
ENST00000359629.5
|
BCL11A
|
B-cell CLL/lymphoma 11A (zinc finger protein) |
| chrX_+_84258832 | 0.75 |
ENST00000373173.2
|
APOOL
|
apolipoprotein O-like |
| chr12_+_59989791 | 0.72 |
ENST00000552432.1
|
SLC16A7
|
solute carrier family 16 (monocarboxylate transporter), member 7 |
| chr7_+_150725510 | 0.70 |
ENST00000461373.1
ENST00000358849.4 ENST00000297504.6 ENST00000542328.1 ENST00000498578.1 ENST00000356058.4 ENST00000477719.1 ENST00000477092.1 |
ABCB8
|
ATP-binding cassette, sub-family B (MDR/TAP), member 8 |
| chr6_-_32374900 | 0.69 |
ENST00000374995.3
ENST00000374993.1 ENST00000414363.1 ENST00000540315.1 ENST00000544175.1 ENST00000429232.2 ENST00000454136.3 ENST00000446536.2 |
BTNL2
|
butyrophilin-like 2 (MHC class II associated) |
| chr9_-_95298314 | 0.68 |
ENST00000344604.5
ENST00000375540.1 |
ECM2
|
extracellular matrix protein 2, female organ and adipocyte specific |
| chr2_-_60780607 | 0.67 |
ENST00000537768.1
ENST00000335712.6 ENST00000356842.4 |
BCL11A
|
B-cell CLL/lymphoma 11A (zinc finger protein) |
| chr4_-_100356291 | 0.66 |
ENST00000476959.1
ENST00000482593.1 |
ADH7
|
alcohol dehydrogenase 7 (class IV), mu or sigma polypeptide |
| chr12_-_7818474 | 0.66 |
ENST00000229304.4
|
APOBEC1
|
apolipoprotein B mRNA editing enzyme, catalytic polypeptide 1 |
| chr5_-_125930929 | 0.63 |
ENST00000553117.1
ENST00000447989.2 ENST00000409134.3 |
ALDH7A1
|
aldehyde dehydrogenase 7 family, member A1 |
| chr5_+_140625147 | 0.60 |
ENST00000231173.3
|
PCDHB15
|
protocadherin beta 15 |
| chr6_+_126070726 | 0.58 |
ENST00000368364.3
|
HEY2
|
hes-related family bHLH transcription factor with YRPW motif 2 |
| chr16_+_87636474 | 0.57 |
ENST00000284262.2
|
JPH3
|
junctophilin 3 |
| chr22_-_22337204 | 0.56 |
ENST00000430142.1
ENST00000357179.5 |
TOP3B
|
topoisomerase (DNA) III beta |
| chr8_-_70745575 | 0.54 |
ENST00000524945.1
|
SLCO5A1
|
solute carrier organic anion transporter family, member 5A1 |
| chr21_+_40824003 | 0.53 |
ENST00000452550.1
|
SH3BGR
|
SH3 domain binding glutamic acid-rich protein |
| chr20_-_7921090 | 0.44 |
ENST00000378789.3
|
HAO1
|
hydroxyacid oxidase (glycolate oxidase) 1 |
| chrX_+_16668278 | 0.42 |
ENST00000380200.3
|
S100G
|
S100 calcium binding protein G |
| chr6_+_25754927 | 0.38 |
ENST00000377905.4
ENST00000439485.2 |
SLC17A4
|
solute carrier family 17, member 4 |
| chr11_-_125366089 | 0.32 |
ENST00000366139.3
ENST00000278919.3 |
FEZ1
|
fasciculation and elongation protein zeta 1 (zygin I) |
| chr3_-_108248169 | 0.30 |
ENST00000273353.3
|
MYH15
|
myosin, heavy chain 15 |
| chr7_+_100026406 | 0.28 |
ENST00000414441.1
|
MEPCE
|
methylphosphate capping enzyme |
| chr1_-_160549235 | 0.27 |
ENST00000368054.3
ENST00000368048.3 ENST00000311224.4 ENST00000368051.3 ENST00000534968.1 |
CD84
|
CD84 molecule |
| chr1_-_227505289 | 0.19 |
ENST00000366765.3
|
CDC42BPA
|
CDC42 binding protein kinase alpha (DMPK-like) |
| chrX_+_1710484 | 0.16 |
ENST00000313871.3
ENST00000381261.3 |
AKAP17A
|
A kinase (PRKA) anchor protein 17A |
| chr8_+_98900132 | 0.15 |
ENST00000520016.1
|
MATN2
|
matrilin 2 |
| chr2_+_185463093 | 0.15 |
ENST00000302277.6
|
ZNF804A
|
zinc finger protein 804A |
| chr19_-_46234119 | 0.14 |
ENST00000317683.3
|
FBXO46
|
F-box protein 46 |
| chr6_-_116447283 | 0.13 |
ENST00000452729.1
ENST00000243222.4 |
COL10A1
|
collagen, type X, alpha 1 |
| chr12_-_2944184 | 0.05 |
ENST00000337508.4
|
NRIP2
|
nuclear receptor interacting protein 2 |
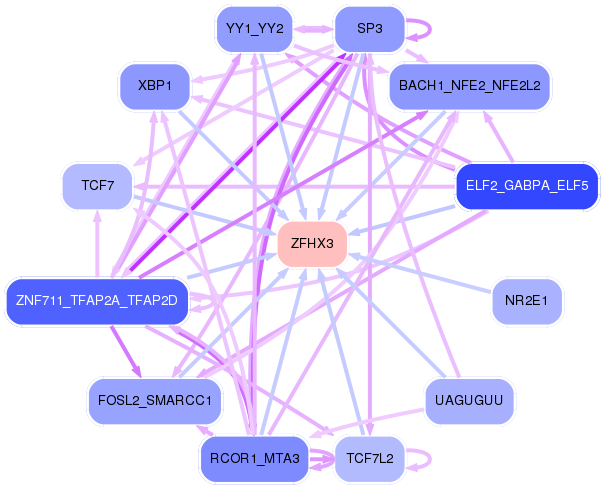
Network of associatons between targets according to the STRING database.

First level regulatory network of ZFHX3
Gene Ontology Analysis
Gene overrepresentation in biological_process category:
| Log-likelihood per target | Total log-likelihood | Term | Description |
|---|---|---|---|
| 1.4 | 4.1 | GO:2000048 | interaction with other organism via secreted substance involved in symbiotic interaction(GO:0052047) negative regulation of cell-cell adhesion mediated by cadherin(GO:2000048) |
| 1.1 | 6.9 | GO:0006789 | bilirubin conjugation(GO:0006789) |
| 1.1 | 5.4 | GO:0061107 | seminal vesicle development(GO:0061107) |
| 1.0 | 2.9 | GO:0010760 | negative regulation of macrophage chemotaxis(GO:0010760) |
| 0.8 | 2.4 | GO:1903860 | negative regulation of dendrite extension(GO:1903860) regulation of neuron remodeling(GO:1904799) negative regulation of neuron remodeling(GO:1904800) negative regulation of branching morphogenesis of a nerve(GO:2000173) |
| 0.6 | 4.4 | GO:0061302 | smooth muscle cell-matrix adhesion(GO:0061302) |
| 0.5 | 5.4 | GO:0051918 | negative regulation of fibrinolysis(GO:0051918) |
| 0.5 | 5.0 | GO:0043152 | induction of bacterial agglutination(GO:0043152) |
| 0.5 | 2.4 | GO:0052199 | negative regulation of catalytic activity in other organism involved in symbiotic interaction(GO:0052199) |
| 0.5 | 2.9 | GO:0010133 | proline catabolic process to glutamate(GO:0010133) |
| 0.5 | 3.2 | GO:0015760 | hexose phosphate transport(GO:0015712) glucose-6-phosphate transport(GO:0015760) |
| 0.4 | 2.9 | GO:0010519 | negative regulation of phospholipase activity(GO:0010519) |
| 0.3 | 5.6 | GO:0034374 | low-density lipoprotein particle remodeling(GO:0034374) |
| 0.2 | 2.0 | GO:0006682 | galactosylceramide biosynthetic process(GO:0006682) galactolipid biosynthetic process(GO:0019375) |
| 0.2 | 0.6 | GO:0010621 | negative regulation of transcription by transcription factor localization(GO:0010621) |
| 0.2 | 1.3 | GO:0002414 | immunoglobulin transcytosis in epithelial cells(GO:0002414) |
| 0.2 | 0.5 | GO:0010430 | fatty acid omega-oxidation(GO:0010430) |
| 0.1 | 1.6 | GO:0009642 | response to light intensity(GO:0009642) |
| 0.1 | 1.0 | GO:0061669 | spontaneous neurotransmitter secretion(GO:0061669) spontaneous synaptic transmission(GO:0098814) |
| 0.1 | 1.1 | GO:0097500 | receptor localization to nonmotile primary cilium(GO:0097500) protein localization to photoreceptor outer segment(GO:1903546) |
| 0.1 | 0.7 | GO:0016554 | cytidine to uridine editing(GO:0016554) DNA cytosine deamination(GO:0070383) |
| 0.1 | 0.8 | GO:0034196 | acylglycerol transport(GO:0034196) triglyceride transport(GO:0034197) |
| 0.1 | 0.6 | GO:0042426 | choline catabolic process(GO:0042426) |
| 0.1 | 1.0 | GO:0014809 | regulation of skeletal muscle contraction by regulation of release of sequestered calcium ion(GO:0014809) |
| 0.1 | 0.8 | GO:2000773 | negative regulation of cellular senescence(GO:2000773) |
| 0.1 | 1.0 | GO:0098856 | intestinal cholesterol absorption(GO:0030299) intestinal lipid absorption(GO:0098856) |
| 0.1 | 0.5 | GO:1901475 | pyruvate transport(GO:0006848) pyruvate transmembrane transport(GO:1901475) |
| 0.1 | 0.4 | GO:0009441 | glycolate metabolic process(GO:0009441) |
| 0.1 | 0.3 | GO:0032661 | regulation of interleukin-18 production(GO:0032661) |
| 0.1 | 0.3 | GO:1902902 | negative regulation of autophagosome assembly(GO:1902902) |
| 0.1 | 8.9 | GO:0007498 | mesoderm development(GO:0007498) |
| 0.0 | 0.3 | GO:0040031 | snRNA modification(GO:0040031) |
| 0.0 | 1.2 | GO:0060732 | positive regulation of inositol phosphate biosynthetic process(GO:0060732) |
| 0.0 | 1.5 | GO:0032728 | positive regulation of interferon-beta production(GO:0032728) |
| 0.0 | 0.6 | GO:0006265 | DNA topological change(GO:0006265) |
| 0.0 | 1.0 | GO:0051180 | vitamin transport(GO:0051180) |
| 0.0 | 0.4 | GO:0035435 | phosphate ion transmembrane transport(GO:0035435) |
| 0.0 | 0.6 | GO:0060314 | regulation of ryanodine-sensitive calcium-release channel activity(GO:0060314) |
| 0.0 | 1.8 | GO:0032411 | positive regulation of transporter activity(GO:0032411) |
| 0.0 | 0.8 | GO:0042407 | cristae formation(GO:0042407) |
| 0.0 | 0.5 | GO:0043252 | sodium-independent organic anion transport(GO:0043252) |
Gene overrepresentation in cellular_component category:
| Log-likelihood per target | Total log-likelihood | Term | Description |
|---|---|---|---|
| 1.8 | 5.4 | GO:0097182 | protein C inhibitor-TMPRSS7 complex(GO:0036024) protein C inhibitor-TMPRSS11E complex(GO:0036025) protein C inhibitor-PLAT complex(GO:0036026) protein C inhibitor-PLAU complex(GO:0036027) protein C inhibitor-thrombin complex(GO:0036028) protein C inhibitor-KLK3 complex(GO:0036029) protein C inhibitor-plasma kallikrein complex(GO:0036030) serine protease inhibitor complex(GO:0097180) protein C inhibitor-coagulation factor V complex(GO:0097181) protein C inhibitor-coagulation factor Xa complex(GO:0097182) protein C inhibitor-coagulation factor XI complex(GO:0097183) |
| 1.1 | 4.4 | GO:0071062 | rough endoplasmic reticulum lumen(GO:0048237) alphav-beta3 integrin-vitronectin complex(GO:0071062) |
| 0.7 | 4.1 | GO:0031232 | extrinsic component of external side of plasma membrane(GO:0031232) |
| 0.4 | 5.0 | GO:0005577 | fibrinogen complex(GO:0005577) |
| 0.3 | 2.9 | GO:0005579 | membrane attack complex(GO:0005579) |
| 0.3 | 5.4 | GO:0031089 | platelet dense granule lumen(GO:0031089) |
| 0.2 | 4.7 | GO:0034663 | endoplasmic reticulum chaperone complex(GO:0034663) |
| 0.1 | 0.6 | GO:0030314 | junctional membrane complex(GO:0030314) |
| 0.1 | 1.0 | GO:0016013 | syntrophin complex(GO:0016013) |
| 0.1 | 0.8 | GO:0061617 | MICOS complex(GO:0061617) |
| 0.1 | 3.9 | GO:0034364 | high-density lipoprotein particle(GO:0034364) |
| 0.1 | 1.7 | GO:0034358 | plasma lipoprotein particle(GO:0034358) lipoprotein particle(GO:1990777) |
| 0.1 | 0.7 | GO:0005614 | interstitial matrix(GO:0005614) |
| 0.1 | 0.7 | GO:0043190 | ATP-binding cassette (ABC) transporter complex(GO:0043190) |
| 0.0 | 2.3 | GO:0031526 | brush border membrane(GO:0031526) |
| 0.0 | 0.6 | GO:0016580 | Sin3 complex(GO:0016580) |
| 0.0 | 1.0 | GO:0048786 | presynaptic active zone(GO:0048786) |
| 0.0 | 3.2 | GO:0030176 | integral component of endoplasmic reticulum membrane(GO:0030176) |
| 0.0 | 3.5 | GO:0072562 | blood microparticle(GO:0072562) |
| 0.0 | 2.4 | GO:0005884 | actin filament(GO:0005884) |
| 0.0 | 0.6 | GO:0032391 | photoreceptor connecting cilium(GO:0032391) |
| 0.0 | 12.1 | GO:0005789 | endoplasmic reticulum membrane(GO:0005789) |
| 0.0 | 0.3 | GO:0032982 | myosin filament(GO:0032982) |
| 0.0 | 0.7 | GO:0032588 | trans-Golgi network membrane(GO:0032588) |
Gene overrepresentation in molecular_function category:
| Log-likelihood per target | Total log-likelihood | Term | Description |
|---|---|---|---|
| 1.1 | 5.4 | GO:0060230 | lipoprotein lipase activator activity(GO:0060230) |
| 0.8 | 3.2 | GO:0004346 | glucose-6-phosphatase activity(GO:0004346) sugar-terminal-phosphatase activity(GO:0050309) |
| 0.7 | 2.9 | GO:0004657 | proline dehydrogenase activity(GO:0004657) |
| 0.6 | 5.4 | GO:0032190 | acrosin binding(GO:0032190) |
| 0.5 | 4.1 | GO:1990405 | protein antigen binding(GO:1990405) |
| 0.3 | 1.3 | GO:0019770 | IgG receptor activity(GO:0019770) |
| 0.3 | 2.2 | GO:0001849 | complement component C1q binding(GO:0001849) |
| 0.3 | 2.0 | GO:0050694 | galactosylceramide sulfotransferase activity(GO:0001733) galactose 3-O-sulfotransferase activity(GO:0050694) |
| 0.3 | 5.6 | GO:0034185 | apolipoprotein binding(GO:0034185) |
| 0.3 | 4.4 | GO:0001871 | pattern binding(GO:0001871) polysaccharide binding(GO:0030247) |
| 0.3 | 1.0 | GO:0008431 | vitamin E binding(GO:0008431) |
| 0.2 | 1.2 | GO:0004991 | parathyroid hormone receptor activity(GO:0004991) |
| 0.2 | 0.7 | GO:0070052 | collagen V binding(GO:0070052) |
| 0.2 | 6.9 | GO:0001972 | retinoic acid binding(GO:0001972) glucuronosyltransferase activity(GO:0015020) |
| 0.2 | 0.9 | GO:0016623 | oxidoreductase activity, acting on the aldehyde or oxo group of donors, oxygen as acceptor(GO:0016623) |
| 0.2 | 1.6 | GO:0010314 | phosphatidylinositol-5-phosphate binding(GO:0010314) |
| 0.1 | 0.6 | GO:0035939 | microsatellite binding(GO:0035939) |
| 0.1 | 0.5 | GO:0005477 | pyruvate secondary active transmembrane transporter activity(GO:0005477) |
| 0.1 | 2.9 | GO:0004859 | phospholipase inhibitor activity(GO:0004859) |
| 0.1 | 0.7 | GO:0004126 | cytidine deaminase activity(GO:0004126) |
| 0.1 | 0.6 | GO:0003917 | DNA topoisomerase type I activity(GO:0003917) |
| 0.1 | 1.8 | GO:0017081 | chloride channel regulator activity(GO:0017081) |
| 0.1 | 0.4 | GO:0005499 | vitamin D binding(GO:0005499) |
| 0.1 | 2.9 | GO:0008009 | chemokine activity(GO:0008009) |
| 0.0 | 1.0 | GO:0050998 | nitric-oxide synthase binding(GO:0050998) |
| 0.0 | 1.0 | GO:0031489 | myosin V binding(GO:0031489) |
| 0.0 | 0.4 | GO:0005436 | sodium:phosphate symporter activity(GO:0005436) |
| 0.0 | 0.6 | GO:0099604 | calcium-release channel activity(GO:0015278) ligand-gated calcium channel activity(GO:0099604) |
| 0.0 | 4.7 | GO:0001078 | transcriptional repressor activity, RNA polymerase II core promoter proximal region sequence-specific binding(GO:0001078) |
| 0.0 | 0.6 | GO:0004029 | aldehyde dehydrogenase (NAD) activity(GO:0004029) |
| 0.0 | 0.3 | GO:0043015 | gamma-tubulin binding(GO:0043015) |
| 0.0 | 5.6 | GO:0030674 | protein binding, bridging(GO:0030674) |
| 0.0 | 1.6 | GO:0003707 | steroid hormone receptor activity(GO:0003707) |
| 0.0 | 0.8 | GO:0017112 | Rab guanyl-nucleotide exchange factor activity(GO:0017112) |
| 0.0 | 0.8 | GO:0005548 | phospholipid transporter activity(GO:0005548) |
| 0.0 | 0.5 | GO:0015347 | sodium-independent organic anion transmembrane transporter activity(GO:0015347) |
| 0.0 | 3.7 | GO:0008017 | microtubule binding(GO:0008017) |
| 0.0 | 1.8 | GO:0017137 | Rab GTPase binding(GO:0017137) |
Gene overrepresentation in C2:CP category:
| Log-likelihood per target | Total log-likelihood | Term | Description |
|---|---|---|---|
| 0.2 | 13.5 | PID UPA UPAR PATHWAY | Urokinase-type plasminogen activator (uPA) and uPAR-mediated signaling |
| 0.1 | 5.4 | ST INTERLEUKIN 4 PATHWAY | Interleukin 4 (IL-4) Pathway |
| 0.0 | 3.2 | PID HNF3B PATHWAY | FOXA2 and FOXA3 transcription factor networks |
| 0.0 | 1.3 | PID LIS1 PATHWAY | Lissencephaly gene (LIS1) in neuronal migration and development |
| 0.0 | 1.7 | PID AMB2 NEUTROPHILS PATHWAY | amb2 Integrin signaling |
| 0.0 | 2.4 | PID CASPASE PATHWAY | Caspase cascade in apoptosis |
| 0.0 | 2.5 | PID AVB3 INTEGRIN PATHWAY | Integrins in angiogenesis |
| 0.0 | 0.6 | PID HES HEY PATHWAY | Notch-mediated HES/HEY network |
Gene overrepresentation in C2:CP:REACTOME category:
| Log-likelihood per target | Total log-likelihood | Term | Description |
|---|---|---|---|
| 0.3 | 6.9 | REACTOME GLUCURONIDATION | Genes involved in Glucuronidation |
| 0.3 | 4.2 | REACTOME COMMON PATHWAY | Genes involved in Common Pathway |
| 0.2 | 4.7 | REACTOME CHYLOMICRON MEDIATED LIPID TRANSPORT | Genes involved in Chylomicron-mediated lipid transport |
| 0.2 | 4.1 | REACTOME REGULATION OF INSULIN LIKE GROWTH FACTOR IGF ACTIVITY BY INSULIN LIKE GROWTH FACTOR BINDING PROTEINS IGFBPS | Genes involved in Regulation of Insulin-like Growth Factor (IGF) Activity by Insulin-like Growth Factor Binding Proteins (IGFBPs) |
| 0.1 | 1.7 | REACTOME LIPOPROTEIN METABOLISM | Genes involved in Lipoprotein metabolism |
| 0.1 | 2.4 | REACTOME CASPASE MEDIATED CLEAVAGE OF CYTOSKELETAL PROTEINS | Genes involved in Caspase-mediated cleavage of cytoskeletal proteins |
| 0.1 | 3.2 | REACTOME GLUCOSE TRANSPORT | Genes involved in Glucose transport |
| 0.1 | 0.5 | REACTOME ETHANOL OXIDATION | Genes involved in Ethanol oxidation |
| 0.1 | 2.6 | REACTOME COMPLEMENT CASCADE | Genes involved in Complement cascade |
| 0.0 | 2.0 | REACTOME GLYCOSPHINGOLIPID METABOLISM | Genes involved in Glycosphingolipid metabolism |
| 0.0 | 0.5 | REACTOME BILE SALT AND ORGANIC ANION SLC TRANSPORTERS | Genes involved in Bile salt and organic anion SLC transporters |
| 0.0 | 4.0 | REACTOME INTEGRIN CELL SURFACE INTERACTIONS | Genes involved in Integrin cell surface interactions |
| 0.0 | 2.4 | REACTOME AMYLOIDS | Genes involved in Amyloids |
| 0.0 | 1.6 | REACTOME NUCLEAR RECEPTOR TRANSCRIPTION PATHWAY | Genes involved in Nuclear Receptor transcription pathway |
| 0.0 | 1.0 | REACTOME STRIATED MUSCLE CONTRACTION | Genes involved in Striated Muscle Contraction |
| 0.0 | 0.6 | REACTOME NOTCH1 INTRACELLULAR DOMAIN REGULATES TRANSCRIPTION | Genes involved in NOTCH1 Intracellular Domain Regulates Transcription |
| 0.0 | 1.2 | REACTOME CLASS B 2 SECRETIN FAMILY RECEPTORS | Genes involved in Class B/2 (Secretin family receptors) |
| 0.0 | 1.3 | REACTOME L1CAM INTERACTIONS | Genes involved in L1CAM interactions |