Project
GNF SymAtlas + NCI-60 cancer cell lines, comparison of cancers vs non-cancers, human (Su, 2004; Ross, 2000)
Navigation
Downloads
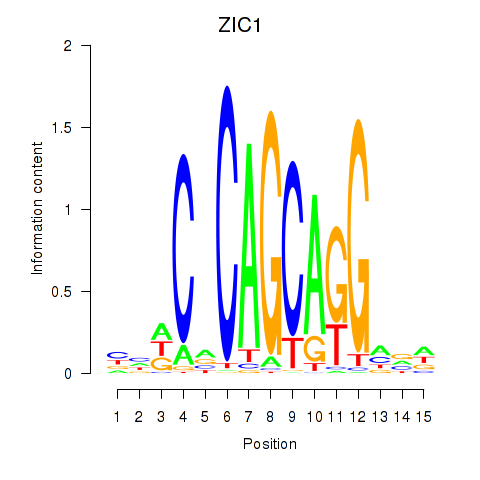
Results for ZIC1
Z-value: 0.99
Motif logo
Transcription factors associated with ZIC1
| Gene Symbol | Gene ID | Gene Info |
|---|---|---|
|
ZIC1
|
ENSG00000152977.5 | Zic family member 1 |
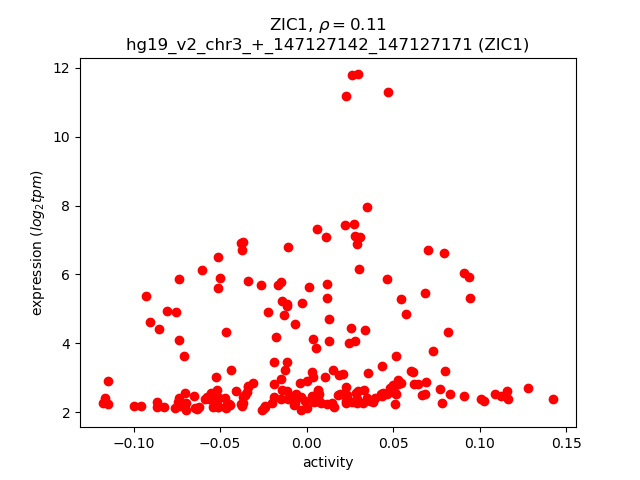
Activity-expression correlation:
| Gene | Promoter | Pearson corr. coef. | P-value | Plot |
|---|---|---|---|---|
| ZIC1 | hg19_v2_chr3_+_147127142_147127171 | 0.11 | 9.3e-02 | Click! |
Activity profile of ZIC1 motif
Sorted Z-values of ZIC1 motif
| Promoter | Log-likelihood | Transcript | Gene | Gene Info |
|---|---|---|---|---|
| chr19_-_3028354 | 25.85 |
ENST00000586422.1
|
TLE2
|
transducin-like enhancer of split 2 (E(sp1) homolog, Drosophila) |
| chr12_-_15038779 | 18.63 |
ENST00000228938.5
ENST00000539261.1 |
MGP
|
matrix Gla protein |
| chr6_+_31949801 | 16.47 |
ENST00000428956.2
ENST00000498271.1 |
C4A
|
complement component 4A (Rodgers blood group) |
| chr19_+_45409011 | 16.03 |
ENST00000252486.4
ENST00000446996.1 ENST00000434152.1 |
APOE
|
apolipoprotein E |
| chr11_-_2160180 | 15.94 |
ENST00000381406.4
|
IGF2
|
insulin-like growth factor 2 (somatomedin A) |
| chr19_+_41509851 | 14.31 |
ENST00000593831.1
ENST00000330446.5 |
CYP2B6
|
cytochrome P450, family 2, subfamily B, polypeptide 6 |
| chr3_-_58563094 | 14.27 |
ENST00000464064.1
|
FAM107A
|
family with sequence similarity 107, member A |
| chr8_-_120685608 | 14.11 |
ENST00000427067.2
|
ENPP2
|
ectonucleotide pyrophosphatase/phosphodiesterase 2 |
| chr2_-_99552620 | 13.47 |
ENST00000428096.1
ENST00000397899.2 ENST00000420294.1 |
KIAA1211L
|
KIAA1211-like |
| chr19_-_58609570 | 12.55 |
ENST00000600845.1
ENST00000240727.6 ENST00000600897.1 ENST00000421612.2 ENST00000601063.1 ENST00000601144.1 |
ZSCAN18
|
zinc finger and SCAN domain containing 18 |
| chr1_+_46668994 | 10.99 |
ENST00000371980.3
|
LURAP1
|
leucine rich adaptor protein 1 |
| chr4_+_24797085 | 10.79 |
ENST00000382120.3
|
SOD3
|
superoxide dismutase 3, extracellular |
| chr5_-_64920115 | 10.44 |
ENST00000381018.3
ENST00000274327.7 |
TRIM23
|
tripartite motif containing 23 |
| chr1_+_22962948 | 10.08 |
ENST00000374642.3
|
C1QA
|
complement component 1, q subcomponent, A chain |
| chr1_+_22963158 | 9.47 |
ENST00000438241.1
|
C1QA
|
complement component 1, q subcomponent, A chain |
| chr4_-_7105056 | 8.44 |
ENST00000504402.1
ENST00000499242.2 ENST00000501888.2 |
RP11-367J11.3
|
RP11-367J11.3 |
| chr11_-_2182388 | 8.34 |
ENST00000421783.1
ENST00000397262.1 ENST00000250971.3 ENST00000381330.4 ENST00000397270.1 |
INS
INS-IGF2
|
insulin INS-IGF2 readthrough |
| chr19_+_54024251 | 8.13 |
ENST00000253144.9
|
ZNF331
|
zinc finger protein 331 |
| chr5_+_64920543 | 7.64 |
ENST00000399438.3
ENST00000510585.2 |
TRAPPC13
CTC-534A2.2
|
trafficking protein particle complex 13 CDNA FLJ26957 fis, clone SLV00486; Uncharacterized protein |
| chr2_-_208989225 | 7.55 |
ENST00000264376.4
|
CRYGD
|
crystallin, gamma D |
| chr19_-_42931567 | 7.54 |
ENST00000244289.4
|
LIPE
|
lipase, hormone-sensitive |
| chr13_-_29069232 | 7.41 |
ENST00000282397.4
ENST00000541932.1 ENST00000539099.1 |
FLT1
|
fms-related tyrosine kinase 1 |
| chr19_-_16582815 | 7.32 |
ENST00000455140.2
ENST00000248070.6 ENST00000594975.1 |
EPS15L1
|
epidermal growth factor receptor pathway substrate 15-like 1 |
| chr3_+_71803201 | 7.29 |
ENST00000304411.2
|
GPR27
|
G protein-coupled receptor 27 |
| chr11_-_73309228 | 7.12 |
ENST00000356467.4
ENST00000064778.4 |
FAM168A
|
family with sequence similarity 168, member A |
| chr17_+_40913210 | 6.67 |
ENST00000253796.5
|
RAMP2
|
receptor (G protein-coupled) activity modifying protein 2 |
| chr2_-_89399845 | 6.65 |
ENST00000479981.1
|
IGKV1-16
|
immunoglobulin kappa variable 1-16 |
| chr1_+_18958008 | 6.51 |
ENST00000420770.2
ENST00000400661.3 |
PAX7
|
paired box 7 |
| chr18_+_76829441 | 6.48 |
ENST00000458297.2
|
ATP9B
|
ATPase, class II, type 9B |
| chr9_+_132934835 | 6.45 |
ENST00000372398.3
|
NCS1
|
neuronal calcium sensor 1 |
| chr9_-_127263265 | 6.31 |
ENST00000373587.3
|
NR5A1
|
nuclear receptor subfamily 5, group A, member 1 |
| chr2_+_90248739 | 6.30 |
ENST00000468879.1
|
IGKV1D-43
|
immunoglobulin kappa variable 1D-43 |
| chr17_-_43045439 | 6.03 |
ENST00000253407.3
|
C1QL1
|
complement component 1, q subcomponent-like 1 |
| chr19_-_16582754 | 5.97 |
ENST00000602151.1
ENST00000597937.1 ENST00000535753.2 |
EPS15L1
|
epidermal growth factor receptor pathway substrate 15-like 1 |
| chr14_-_50999190 | 5.89 |
ENST00000557390.1
|
MAP4K5
|
mitogen-activated protein kinase kinase kinase kinase 5 |
| chr7_-_135412925 | 5.83 |
ENST00000354042.4
|
SLC13A4
|
solute carrier family 13 (sodium/sulfate symporter), member 4 |
| chrX_+_77166172 | 5.78 |
ENST00000343533.5
ENST00000350425.4 ENST00000341514.6 |
ATP7A
|
ATPase, Cu++ transporting, alpha polypeptide |
| chr1_-_177134024 | 5.70 |
ENST00000367654.3
|
ASTN1
|
astrotactin 1 |
| chr2_+_79347577 | 5.68 |
ENST00000233735.1
|
REG1A
|
regenerating islet-derived 1 alpha |
| chr6_+_28109703 | 5.66 |
ENST00000457389.2
ENST00000330236.6 |
ZKSCAN8
|
zinc finger with KRAB and SCAN domains 8 |
| chrX_+_68835911 | 5.58 |
ENST00000525810.1
ENST00000527388.1 ENST00000374553.2 ENST00000374552.4 ENST00000338901.3 ENST00000524573.1 |
EDA
|
ectodysplasin A |
| chrX_+_134975858 | 5.56 |
ENST00000537770.1
|
SAGE1
|
sarcoma antigen 1 |
| chrX_+_134975753 | 5.56 |
ENST00000535938.1
|
SAGE1
|
sarcoma antigen 1 |
| chr22_-_24622080 | 5.44 |
ENST00000425408.1
|
GGT5
|
gamma-glutamyltransferase 5 |
| chrX_-_78622805 | 5.39 |
ENST00000373298.2
|
ITM2A
|
integral membrane protein 2A |
| chr1_-_71513471 | 5.26 |
ENST00000370931.3
ENST00000356595.4 ENST00000306666.5 ENST00000370932.2 ENST00000351052.5 ENST00000414819.1 ENST00000370924.4 |
PTGER3
|
prostaglandin E receptor 3 (subtype EP3) |
| chr3_-_53080047 | 5.26 |
ENST00000482396.1
ENST00000358080.2 ENST00000296295.6 ENST00000394752.3 |
SFMBT1
|
Scm-like with four mbt domains 1 |
| chr18_-_52989217 | 5.24 |
ENST00000570287.2
|
TCF4
|
transcription factor 4 |
| chr16_-_31100284 | 5.15 |
ENST00000280606.6
|
PRSS53
|
protease, serine, 53 |
| chr15_+_73976715 | 5.10 |
ENST00000558689.1
ENST00000560786.2 ENST00000561213.1 ENST00000563584.1 ENST00000561416.1 |
CD276
|
CD276 molecule |
| chr9_-_16870704 | 5.10 |
ENST00000380672.4
ENST00000380667.2 ENST00000380666.2 ENST00000486514.1 |
BNC2
|
basonuclin 2 |
| chrX_+_18725758 | 5.05 |
ENST00000472826.1
ENST00000544635.1 ENST00000496075.2 |
PPEF1
|
protein phosphatase, EF-hand calcium binding domain 1 |
| chr1_-_20446020 | 4.80 |
ENST00000375105.3
|
PLA2G2D
|
phospholipase A2, group IID |
| chr22_+_41956767 | 4.70 |
ENST00000306149.7
|
CSDC2
|
cold shock domain containing C2, RNA binding |
| chr2_+_11679963 | 4.57 |
ENST00000263834.5
|
GREB1
|
growth regulation by estrogen in breast cancer 1 |
| chr22_+_44319619 | 4.45 |
ENST00000216180.3
|
PNPLA3
|
patatin-like phospholipase domain containing 3 |
| chr1_+_62417957 | 4.40 |
ENST00000307297.7
ENST00000543708.1 |
INADL
|
InaD-like (Drosophila) |
| chr22_+_44319648 | 4.33 |
ENST00000423180.2
|
PNPLA3
|
patatin-like phospholipase domain containing 3 |
| chr6_-_87804815 | 4.31 |
ENST00000369582.2
|
CGA
|
glycoprotein hormones, alpha polypeptide |
| chr19_-_46142637 | 4.27 |
ENST00000590043.1
ENST00000589876.1 |
EML2
|
echinoderm microtubule associated protein like 2 |
| chr17_-_4464081 | 4.26 |
ENST00000574154.1
|
GGT6
|
gamma-glutamyltransferase 6 |
| chr15_-_71407806 | 4.23 |
ENST00000566432.1
ENST00000567117.1 |
CT62
|
cancer/testis antigen 62 |
| chr8_+_85097110 | 4.15 |
ENST00000517638.1
ENST00000522647.1 |
RALYL
|
RALY RNA binding protein-like |
| chr4_+_95917383 | 4.09 |
ENST00000512312.1
|
BMPR1B
|
bone morphogenetic protein receptor, type IB |
| chr10_-_62493223 | 4.09 |
ENST00000373827.2
|
ANK3
|
ankyrin 3, node of Ranvier (ankyrin G) |
| chr1_-_60392452 | 4.08 |
ENST00000371204.3
|
CYP2J2
|
cytochrome P450, family 2, subfamily J, polypeptide 2 |
| chr12_-_11002063 | 4.05 |
ENST00000544994.1
ENST00000228811.4 ENST00000540107.1 |
PRR4
|
proline rich 4 (lacrimal) |
| chrY_+_4868267 | 3.99 |
ENST00000333703.4
|
PCDH11Y
|
protocadherin 11 Y-linked |
| chr9_+_35792151 | 3.74 |
ENST00000342694.2
|
NPR2
|
natriuretic peptide receptor B/guanylate cyclase B (atrionatriuretic peptide receptor B) |
| chr12_-_11036844 | 3.71 |
ENST00000428168.2
|
PRH1
|
proline-rich protein HaeIII subfamily 1 |
| chr19_+_42772659 | 3.70 |
ENST00000572681.2
|
CIC
|
capicua transcriptional repressor |
| chr10_+_118350468 | 3.69 |
ENST00000358834.4
ENST00000528052.1 ENST00000442761.1 |
PNLIPRP1
|
pancreatic lipase-related protein 1 |
| chr18_+_76829385 | 3.68 |
ENST00000426216.2
ENST00000307671.7 ENST00000586672.1 ENST00000586722.1 |
ATP9B
|
ATPase, class II, type 9B |
| chr4_-_186733363 | 3.68 |
ENST00000393523.2
ENST00000393528.3 ENST00000449407.2 |
SORBS2
|
sorbin and SH3 domain containing 2 |
| chr17_+_60704762 | 3.64 |
ENST00000303375.5
|
MRC2
|
mannose receptor, C type 2 |
| chr7_+_29874341 | 3.64 |
ENST00000409290.1
ENST00000242140.5 |
WIPF3
|
WAS/WASL interacting protein family, member 3 |
| chr6_-_35656712 | 3.63 |
ENST00000357266.4
ENST00000542713.1 |
FKBP5
|
FK506 binding protein 5 |
| chrX_+_91034260 | 3.59 |
ENST00000395337.2
|
PCDH11X
|
protocadherin 11 X-linked |
| chr13_+_102104952 | 3.58 |
ENST00000376180.3
|
ITGBL1
|
integrin, beta-like 1 (with EGF-like repeat domains) |
| chr17_-_39197699 | 3.47 |
ENST00000306271.4
|
KRTAP1-1
|
keratin associated protein 1-1 |
| chr19_-_46142680 | 3.42 |
ENST00000245925.3
|
EML2
|
echinoderm microtubule associated protein like 2 |
| chr1_-_211307315 | 3.40 |
ENST00000271751.4
|
KCNH1
|
potassium voltage-gated channel, subfamily H (eag-related), member 1 |
| chr4_-_109089573 | 3.38 |
ENST00000265165.1
|
LEF1
|
lymphoid enhancer-binding factor 1 |
| chr10_+_118350522 | 3.31 |
ENST00000530319.1
ENST00000527980.1 ENST00000471549.1 ENST00000534537.1 |
PNLIPRP1
|
pancreatic lipase-related protein 1 |
| chr2_+_169926047 | 3.31 |
ENST00000428522.1
ENST00000450153.1 ENST00000421653.1 |
DHRS9
|
dehydrogenase/reductase (SDR family) member 9 |
| chr15_+_41245160 | 3.29 |
ENST00000444189.2
ENST00000446533.3 |
CHAC1
|
ChaC, cation transport regulator homolog 1 (E. coli) |
| chr15_-_71407833 | 3.26 |
ENST00000449977.2
|
CT62
|
cancer/testis antigen 62 |
| chr4_-_175750364 | 3.22 |
ENST00000340217.5
ENST00000274093.3 |
GLRA3
|
glycine receptor, alpha 3 |
| chr3_+_50192499 | 3.15 |
ENST00000413852.1
|
SEMA3F
|
sema domain, immunoglobulin domain (Ig), short basic domain, secreted, (semaphorin) 3F |
| chr12_+_13197218 | 3.13 |
ENST00000197268.8
|
KIAA1467
|
KIAA1467 |
| chr4_-_7941596 | 3.03 |
ENST00000420658.1
ENST00000358461.2 |
AFAP1
|
actin filament associated protein 1 |
| chr11_+_65779283 | 2.88 |
ENST00000312134.2
|
CST6
|
cystatin E/M |
| chr10_+_50818343 | 2.87 |
ENST00000374115.3
|
SLC18A3
|
solute carrier family 18 (vesicular acetylcholine transporter), member 3 |
| chr11_+_120207787 | 2.84 |
ENST00000397843.2
ENST00000356641.3 |
ARHGEF12
|
Rho guanine nucleotide exchange factor (GEF) 12 |
| chr11_+_63606477 | 2.79 |
ENST00000508192.1
ENST00000361128.5 |
MARK2
|
MAP/microtubule affinity-regulating kinase 2 |
| chr1_+_17559776 | 2.76 |
ENST00000537499.1
ENST00000413717.2 ENST00000536552.1 |
PADI1
|
peptidyl arginine deiminase, type I |
| chr17_-_56609302 | 2.75 |
ENST00000581607.1
ENST00000317256.6 ENST00000426861.1 ENST00000580809.1 ENST00000577729.1 ENST00000583291.1 |
SEPT4
|
septin 4 |
| chr22_-_23922448 | 2.65 |
ENST00000438703.1
ENST00000330377.2 |
IGLL1
|
immunoglobulin lambda-like polypeptide 1 |
| chr7_-_100493744 | 2.60 |
ENST00000428317.1
ENST00000441605.1 |
ACHE
|
acetylcholinesterase (Yt blood group) |
| chr22_+_21369316 | 2.54 |
ENST00000413302.2
ENST00000402329.3 ENST00000336296.2 ENST00000401443.1 ENST00000443995.3 |
P2RX6
|
purinergic receptor P2X, ligand-gated ion channel, 6 |
| chr3_-_45838011 | 2.50 |
ENST00000358525.4
ENST00000413781.1 |
SLC6A20
|
solute carrier family 6 (proline IMINO transporter), member 20 |
| chr18_-_52989525 | 2.49 |
ENST00000457482.3
|
TCF4
|
transcription factor 4 |
| chr17_-_5372271 | 2.46 |
ENST00000225296.3
|
DHX33
|
DEAH (Asp-Glu-Ala-His) box polypeptide 33 |
| chr2_-_98280383 | 2.45 |
ENST00000289228.5
|
ACTR1B
|
ARP1 actin-related protein 1 homolog B, centractin beta (yeast) |
| chr7_+_39017504 | 2.38 |
ENST00000403058.1
|
POU6F2
|
POU class 6 homeobox 2 |
| chr7_+_107384579 | 2.19 |
ENST00000222597.2
ENST00000415884.2 |
CBLL1
|
Cbl proto-oncogene-like 1, E3 ubiquitin protein ligase |
| chr11_+_63606373 | 2.19 |
ENST00000402010.2
ENST00000315032.8 ENST00000377809.4 ENST00000413835.2 ENST00000377810.3 |
MARK2
|
MAP/microtubule affinity-regulating kinase 2 |
| chr11_+_15095108 | 2.09 |
ENST00000324229.6
ENST00000533448.1 |
CALCB
|
calcitonin-related polypeptide beta |
| chr10_-_81708854 | 2.05 |
ENST00000372292.3
|
SFTPD
|
surfactant protein D |
| chr11_+_63606558 | 2.04 |
ENST00000350490.7
ENST00000502399.3 |
MARK2
|
MAP/microtubule affinity-regulating kinase 2 |
| chr11_+_66824276 | 1.89 |
ENST00000308831.2
|
RHOD
|
ras homolog family member D |
| chr3_-_45837959 | 1.87 |
ENST00000353278.4
ENST00000456124.2 |
SLC6A20
|
solute carrier family 6 (proline IMINO transporter), member 20 |
| chr1_+_1567474 | 1.86 |
ENST00000356026.5
|
MMP23B
|
matrix metallopeptidase 23B |
| chr4_-_121993673 | 1.85 |
ENST00000379692.4
|
NDNF
|
neuron-derived neurotrophic factor |
| chr19_+_34287751 | 1.84 |
ENST00000590771.1
ENST00000589786.1 ENST00000284006.6 ENST00000588881.1 |
KCTD15
|
potassium channel tetramerization domain containing 15 |
| chr2_+_89184868 | 1.79 |
ENST00000390243.2
|
IGKV4-1
|
immunoglobulin kappa variable 4-1 |
| chr6_-_35656685 | 1.61 |
ENST00000539068.1
ENST00000540787.1 |
FKBP5
|
FK506 binding protein 5 |
| chr21_+_45209394 | 1.58 |
ENST00000497547.1
|
RRP1
|
ribosomal RNA processing 1 |
| chr22_+_29702572 | 1.52 |
ENST00000407647.2
ENST00000416823.1 ENST00000428622.1 |
GAS2L1
|
growth arrest-specific 2 like 1 |
| chr15_+_81589254 | 1.48 |
ENST00000394652.2
|
IL16
|
interleukin 16 |
| chr19_+_10196781 | 1.45 |
ENST00000253110.11
|
C19orf66
|
chromosome 19 open reading frame 66 |
| chr1_+_89990431 | 1.39 |
ENST00000330947.2
ENST00000358200.4 |
LRRC8B
|
leucine rich repeat containing 8 family, member B |
| chr1_-_111991908 | 1.38 |
ENST00000235090.5
|
WDR77
|
WD repeat domain 77 |
| chr15_+_63340553 | 1.35 |
ENST00000334895.5
|
TPM1
|
tropomyosin 1 (alpha) |
| chr7_+_150264365 | 1.21 |
ENST00000255945.2
ENST00000461940.1 |
GIMAP4
|
GTPase, IMAP family member 4 |
| chr22_-_23922410 | 1.20 |
ENST00000249053.3
|
IGLL1
|
immunoglobulin lambda-like polypeptide 1 |
| chr10_-_101945771 | 1.17 |
ENST00000370408.2
ENST00000407654.3 |
ERLIN1
|
ER lipid raft associated 1 |
| chr11_-_22647350 | 1.17 |
ENST00000327470.3
|
FANCF
|
Fanconi anemia, complementation group F |
| chr16_-_67427389 | 1.09 |
ENST00000562206.1
ENST00000290942.5 ENST00000393957.2 |
TPPP3
|
tubulin polymerization-promoting protein family member 3 |
| chr3_-_50329835 | 1.05 |
ENST00000429673.2
|
IFRD2
|
interferon-related developmental regulator 2 |
| chr17_-_39507064 | 1.04 |
ENST00000007735.3
|
KRT33A
|
keratin 33A |
| chrX_+_24711997 | 1.02 |
ENST00000379068.3
ENST00000379059.3 |
POLA1
|
polymerase (DNA directed), alpha 1, catalytic subunit |
| chr6_-_168476511 | 1.02 |
ENST00000440994.2
|
FRMD1
|
FERM domain containing 1 |
| chr1_+_16348366 | 1.00 |
ENST00000375692.1
ENST00000420078.1 |
CLCNKA
|
chloride channel, voltage-sensitive Ka |
| chr4_+_111397216 | 0.90 |
ENST00000265162.5
|
ENPEP
|
glutamyl aminopeptidase (aminopeptidase A) |
| chr1_+_161087873 | 0.88 |
ENST00000368009.2
ENST00000368007.4 ENST00000368008.1 ENST00000392190.5 |
NIT1
|
nitrilase 1 |
| chr16_+_28858004 | 0.86 |
ENST00000322610.8
|
SH2B1
|
SH2B adaptor protein 1 |
| chr5_+_152870734 | 0.78 |
ENST00000521843.2
|
GRIA1
|
glutamate receptor, ionotropic, AMPA 1 |
| chrX_+_70364667 | 0.77 |
ENST00000536169.1
ENST00000395855.2 ENST00000374051.3 ENST00000358741.3 |
NLGN3
|
neuroligin 3 |
| chrX_+_53078273 | 0.75 |
ENST00000332582.4
|
GPR173
|
G protein-coupled receptor 173 |
| chr6_+_31540056 | 0.65 |
ENST00000418386.2
|
LTA
|
lymphotoxin alpha |
| chr7_-_37026108 | 0.59 |
ENST00000396045.3
|
ELMO1
|
engulfment and cell motility 1 |
| chr10_-_49701686 | 0.56 |
ENST00000417247.2
|
ARHGAP22
|
Rho GTPase activating protein 22 |
| chr19_+_10563567 | 0.53 |
ENST00000344979.3
|
PDE4A
|
phosphodiesterase 4A, cAMP-specific |
| chr1_+_100315613 | 0.50 |
ENST00000361915.3
|
AGL
|
amylo-alpha-1, 6-glucosidase, 4-alpha-glucanotransferase |
| chr14_+_55033815 | 0.49 |
ENST00000554335.1
|
SAMD4A
|
sterile alpha motif domain containing 4A |
| chr4_-_66535653 | 0.49 |
ENST00000354839.4
ENST00000432638.2 |
EPHA5
|
EPH receptor A5 |
| chr11_-_59612969 | 0.44 |
ENST00000541311.1
ENST00000257248.2 |
GIF
|
gastric intrinsic factor (vitamin B synthesis) |
| chr1_+_1567546 | 0.44 |
ENST00000378675.3
|
MMP23B
|
matrix metallopeptidase 23B |
| chr5_+_140514782 | 0.40 |
ENST00000231134.5
|
PCDHB5
|
protocadherin beta 5 |
| chr1_-_94586651 | 0.33 |
ENST00000535735.1
ENST00000370225.3 |
ABCA4
|
ATP-binding cassette, sub-family A (ABC1), member 4 |
| chr19_-_11450249 | 0.31 |
ENST00000222120.3
|
RAB3D
|
RAB3D, member RAS oncogene family |
| chr4_-_109090106 | 0.23 |
ENST00000379951.2
|
LEF1
|
lymphoid enhancer-binding factor 1 |
| chrX_+_118425471 | 0.22 |
ENST00000428222.1
|
RP5-1139I1.1
|
RP5-1139I1.1 |
| chr14_-_65409438 | 0.14 |
ENST00000557049.1
|
GPX2
|
glutathione peroxidase 2 (gastrointestinal) |
| chr1_+_65613217 | 0.10 |
ENST00000545314.1
|
AK4
|
adenylate kinase 4 |
| chr1_+_16348497 | 0.09 |
ENST00000439316.2
|
CLCNKA
|
chloride channel, voltage-sensitive Ka |
| chr17_-_76274572 | 0.07 |
ENST00000374945.1
|
RP11-219G17.4
|
RP11-219G17.4 |
| chr8_-_144623595 | 0.06 |
ENST00000262577.5
|
ZC3H3
|
zinc finger CCCH-type containing 3 |
| chr8_-_82754427 | 0.05 |
ENST00000353788.4
ENST00000520618.1 ENST00000518183.1 ENST00000396330.2 ENST00000519119.1 ENST00000345957.4 |
SNX16
|
sorting nexin 16 |
| chr1_+_233749739 | 0.00 |
ENST00000366621.3
|
KCNK1
|
potassium channel, subfamily K, member 1 |
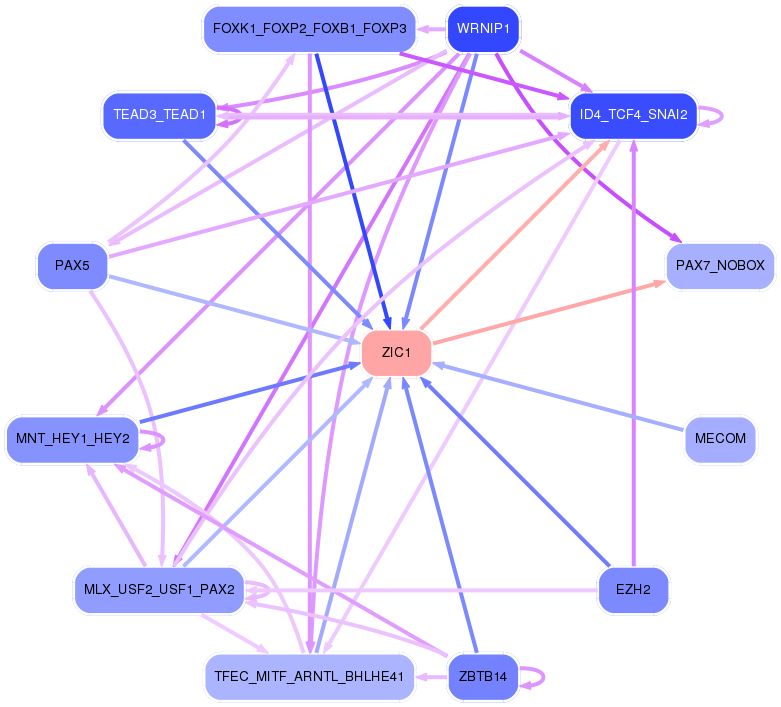
Network of associatons between targets according to the STRING database.

First level regulatory network of ZIC1
Gene Ontology Analysis
Gene overrepresentation in biological_process category:
| Log-likelihood per target | Total log-likelihood | Term | Description |
|---|---|---|---|
| 5.3 | 16.0 | GO:1902995 | regulation of phospholipid efflux(GO:1902994) positive regulation of phospholipid efflux(GO:1902995) |
| 2.8 | 8.3 | GO:0033861 | negative regulation of NAD(P)H oxidase activity(GO:0033861) |
| 1.9 | 5.8 | GO:0071284 | cellular response to lead ion(GO:0071284) |
| 1.8 | 15.9 | GO:0038028 | insulin receptor signaling pathway via phosphatidylinositol 3-kinase(GO:0038028) |
| 1.6 | 6.5 | GO:0014816 | skeletal muscle satellite cell differentiation(GO:0014816) |
| 1.6 | 6.3 | GO:0007538 | primary sex determination(GO:0007538) |
| 1.5 | 9.2 | GO:0061153 | trachea submucosa development(GO:0061152) trachea gland development(GO:0061153) |
| 1.5 | 6.0 | GO:0061743 | motor learning(GO:0061743) |
| 1.5 | 7.5 | GO:0046340 | diacylglycerol catabolic process(GO:0046340) |
| 1.5 | 16.5 | GO:2000427 | positive regulation of apoptotic cell clearance(GO:2000427) |
| 1.5 | 7.3 | GO:1900738 | positive regulation of phospholipase C-activating G-protein coupled receptor signaling pathway(GO:1900738) |
| 1.3 | 5.4 | GO:0002317 | plasma cell differentiation(GO:0002317) |
| 1.1 | 5.3 | GO:0060455 | negative regulation of gastric acid secretion(GO:0060455) |
| 1.0 | 14.3 | GO:0042738 | exogenous drug catabolic process(GO:0042738) |
| 1.0 | 4.1 | GO:1900827 | positive regulation of cell communication by electrical coupling(GO:0010650) maintenance of protein location in membrane(GO:0072658) maintenance of protein location in plasma membrane(GO:0072660) positive regulation of membrane depolarization during cardiac muscle cell action potential(GO:1900827) |
| 1.0 | 4.8 | GO:0002361 | CD4-positive, CD25-positive, alpha-beta regulatory T cell differentiation(GO:0002361) |
| 0.9 | 14.1 | GO:0034638 | phosphatidylcholine catabolic process(GO:0034638) |
| 0.9 | 3.7 | GO:1900194 | negative regulation of oocyte maturation(GO:1900194) |
| 0.9 | 22.7 | GO:0001502 | cartilage condensation(GO:0001502) |
| 0.9 | 8.8 | GO:0036155 | acylglycerol acyl-chain remodeling(GO:0036155) |
| 0.9 | 2.6 | GO:0032223 | negative regulation of synaptic transmission, cholinergic(GO:0032223) neurotransmitter receptor biosynthetic process(GO:0045212) |
| 0.9 | 13.0 | GO:0006751 | glutathione catabolic process(GO:0006751) |
| 0.8 | 2.4 | GO:0048867 | stem cell fate determination(GO:0048867) |
| 0.7 | 6.7 | GO:0097646 | calcitonin family receptor signaling pathway(GO:0097646) amylin receptor signaling pathway(GO:0097647) |
| 0.7 | 2.1 | GO:0045085 | negative regulation of interleukin-2 biosynthetic process(GO:0045085) |
| 0.6 | 7.7 | GO:0010968 | regulation of microtubule nucleation(GO:0010968) |
| 0.6 | 4.4 | GO:0015824 | proline transport(GO:0015824) |
| 0.6 | 5.1 | GO:0045078 | positive regulation of interferon-gamma biosynthetic process(GO:0045078) |
| 0.6 | 2.8 | GO:0018101 | protein citrullination(GO:0018101) histone citrullination(GO:0036414) |
| 0.5 | 2.7 | GO:0030382 | sperm mitochondrion organization(GO:0030382) |
| 0.5 | 25.9 | GO:1904837 | beta-catenin-TCF complex assembly(GO:1904837) |
| 0.5 | 3.4 | GO:0000160 | phosphorelay signal transduction system(GO:0000160) |
| 0.5 | 5.8 | GO:0008272 | sulfate transport(GO:0008272) |
| 0.4 | 2.9 | GO:0015870 | acetylcholine transport(GO:0015870) |
| 0.4 | 10.5 | GO:0045332 | lipid translocation(GO:0034204) phospholipid translocation(GO:0045332) |
| 0.4 | 1.2 | GO:0045541 | negative regulation of cholesterol biosynthetic process(GO:0045541) negative regulation of cholesterol metabolic process(GO:0090206) |
| 0.4 | 3.2 | GO:0060012 | synaptic transmission, glycinergic(GO:0060012) |
| 0.4 | 7.4 | GO:0030949 | positive regulation of vascular endothelial growth factor receptor signaling pathway(GO:0030949) |
| 0.3 | 19.5 | GO:0010039 | response to iron ion(GO:0010039) |
| 0.3 | 1.0 | GO:0006269 | DNA replication, synthesis of RNA primer(GO:0006269) |
| 0.3 | 10.8 | GO:0046688 | response to copper ion(GO:0046688) |
| 0.3 | 3.3 | GO:0042904 | 9-cis-retinoic acid biosynthetic process(GO:0042904) 9-cis-retinoic acid metabolic process(GO:0042905) |
| 0.3 | 0.7 | GO:0002874 | regulation of chronic inflammatory response to antigenic stimulus(GO:0002874) |
| 0.3 | 5.9 | GO:0000185 | activation of MAPKKK activity(GO:0000185) |
| 0.3 | 4.1 | GO:0019373 | epoxygenase P450 pathway(GO:0019373) |
| 0.3 | 5.1 | GO:0043586 | tongue development(GO:0043586) |
| 0.2 | 6.5 | GO:0007158 | neuron cell-cell adhesion(GO:0007158) |
| 0.2 | 1.8 | GO:0061042 | vascular wound healing(GO:0061042) |
| 0.2 | 11.6 | GO:0042059 | negative regulation of epidermal growth factor receptor signaling pathway(GO:0042059) |
| 0.2 | 0.8 | GO:0097211 | response to gonadotropin-releasing hormone(GO:0097210) cellular response to gonadotropin-releasing hormone(GO:0097211) |
| 0.2 | 7.6 | GO:0070306 | lens fiber cell differentiation(GO:0070306) |
| 0.2 | 1.3 | GO:0003065 | positive regulation of heart rate by epinephrine(GO:0003065) |
| 0.2 | 0.9 | GO:0060528 | secretory columnal luminar epithelial cell differentiation involved in prostate glandular acinus development(GO:0060528) |
| 0.1 | 5.0 | GO:0022400 | regulation of rhodopsin mediated signaling pathway(GO:0022400) |
| 0.1 | 7.0 | GO:0051646 | mitochondrion localization(GO:0051646) |
| 0.1 | 2.2 | GO:0035635 | entry of bacterium into host cell(GO:0035635) |
| 0.1 | 0.9 | GO:0044254 | angiotensin catabolic process in blood(GO:0002005) multicellular organismal protein catabolic process(GO:0044254) protein digestion(GO:0044256) multicellular organismal macromolecule catabolic process(GO:0044266) |
| 0.1 | 7.1 | GO:0045739 | positive regulation of DNA repair(GO:0045739) |
| 0.1 | 3.7 | GO:0003298 | physiological muscle hypertrophy(GO:0003298) physiological cardiac muscle hypertrophy(GO:0003301) cell growth involved in cardiac muscle cell development(GO:0061049) |
| 0.1 | 5.2 | GO:0000413 | protein peptidyl-prolyl isomerization(GO:0000413) |
| 0.1 | 5.3 | GO:0048635 | negative regulation of muscle organ development(GO:0048635) |
| 0.1 | 4.1 | GO:0016486 | peptide hormone processing(GO:0016486) |
| 0.1 | 0.8 | GO:0099566 | regulation of postsynaptic cytosolic calcium ion concentration(GO:0099566) |
| 0.1 | 2.5 | GO:0045943 | positive regulation of transcription from RNA polymerase I promoter(GO:0045943) |
| 0.1 | 12.3 | GO:0006958 | complement activation, classical pathway(GO:0006958) |
| 0.1 | 2.5 | GO:0035590 | purinergic nucleotide receptor signaling pathway(GO:0035590) |
| 0.1 | 0.4 | GO:0006824 | cobalt ion transport(GO:0006824) |
| 0.1 | 4.0 | GO:0001895 | retina homeostasis(GO:0001895) |
| 0.1 | 0.3 | GO:0018125 | peptidyl-cysteine methylation(GO:0018125) |
| 0.1 | 1.5 | GO:0097067 | cellular response to thyroid hormone stimulus(GO:0097067) |
| 0.0 | 3.6 | GO:0010923 | negative regulation of phosphatase activity(GO:0010923) |
| 0.0 | 3.6 | GO:0030574 | collagen catabolic process(GO:0030574) |
| 0.0 | 11.0 | GO:0031032 | actomyosin structure organization(GO:0031032) |
| 0.0 | 4.2 | GO:0038096 | immune response-regulating cell surface receptor signaling pathway involved in phagocytosis(GO:0002433) Fc-gamma receptor signaling pathway involved in phagocytosis(GO:0038096) |
| 0.0 | 1.2 | GO:0036297 | interstrand cross-link repair(GO:0036297) |
| 0.0 | 14.2 | GO:0001558 | regulation of cell growth(GO:0001558) |
| 0.0 | 7.7 | GO:0065004 | protein-DNA complex assembly(GO:0065004) |
| 0.0 | 5.2 | GO:0043488 | regulation of mRNA stability(GO:0043488) |
| 0.0 | 2.9 | GO:2000117 | negative regulation of cysteine-type endopeptidase activity(GO:2000117) |
| 0.0 | 3.4 | GO:0002377 | immunoglobulin production(GO:0002377) |
| 0.0 | 6.5 | GO:0070588 | calcium ion transmembrane transport(GO:0070588) |
| 0.0 | 1.1 | GO:0046785 | microtubule polymerization(GO:0046785) |
| 0.0 | 0.9 | GO:0045840 | positive regulation of mitotic nuclear division(GO:0045840) |
| 0.0 | 0.5 | GO:0043949 | regulation of cAMP-mediated signaling(GO:0043949) |
| 0.0 | 1.5 | GO:0051924 | regulation of calcium ion transport(GO:0051924) |
| 0.0 | 2.4 | GO:0019886 | antigen processing and presentation of exogenous peptide antigen via MHC class II(GO:0019886) |
| 0.0 | 0.4 | GO:0016339 | calcium-dependent cell-cell adhesion via plasma membrane cell adhesion molecules(GO:0016339) |
| 0.0 | 11.0 | GO:0043547 | positive regulation of GTPase activity(GO:0043547) |
| 0.0 | 1.8 | GO:0044070 | regulation of anion transport(GO:0044070) |
| 0.0 | 0.1 | GO:0010793 | regulation of mRNA export from nucleus(GO:0010793) |
| 0.0 | 1.6 | GO:0007156 | homophilic cell adhesion via plasma membrane adhesion molecules(GO:0007156) |
Gene overrepresentation in cellular_component category:
| Log-likelihood per target | Total log-likelihood | Term | Description |
|---|---|---|---|
| 5.3 | 16.0 | GO:0034365 | discoidal high-density lipoprotein particle(GO:0034365) |
| 3.9 | 19.5 | GO:0005602 | complement component C1 complex(GO:0005602) |
| 1.1 | 3.2 | GO:0016935 | glycine-gated chloride channel complex(GO:0016935) |
| 1.0 | 6.7 | GO:1903440 | calcitonin family receptor complex(GO:1903439) amylin receptor complex(GO:1903440) |
| 0.8 | 8.1 | GO:0097427 | microtubule bundle(GO:0097427) |
| 0.6 | 8.6 | GO:0043083 | synaptic cleft(GO:0043083) |
| 0.6 | 2.9 | GO:0060201 | clathrin-sculpted acetylcholine transport vesicle(GO:0060200) clathrin-sculpted acetylcholine transport vesicle membrane(GO:0060201) |
| 0.4 | 13.3 | GO:0030132 | clathrin coat of coated pit(GO:0030132) |
| 0.4 | 6.5 | GO:0031045 | dense core granule(GO:0031045) |
| 0.3 | 3.6 | GO:1990907 | beta-catenin-TCF complex(GO:1990907) |
| 0.3 | 4.1 | GO:1990712 | HFE-transferrin receptor complex(GO:1990712) |
| 0.2 | 3.9 | GO:0043194 | axon initial segment(GO:0043194) |
| 0.2 | 5.8 | GO:0030140 | trans-Golgi network transport vesicle(GO:0030140) |
| 0.2 | 1.6 | GO:0030688 | preribosome, small subunit precursor(GO:0030688) |
| 0.2 | 2.7 | GO:0097227 | sperm annulus(GO:0097227) |
| 0.2 | 16.3 | GO:0005811 | lipid particle(GO:0005811) |
| 0.2 | 23.4 | GO:0005796 | Golgi lumen(GO:0005796) |
| 0.2 | 1.0 | GO:0005658 | alpha DNA polymerase:primase complex(GO:0005658) |
| 0.2 | 1.2 | GO:0043240 | Fanconi anaemia nuclear complex(GO:0043240) |
| 0.2 | 2.4 | GO:0005869 | dynactin complex(GO:0005869) |
| 0.2 | 0.8 | GO:0044308 | axonal spine(GO:0044308) |
| 0.1 | 3.7 | GO:0008074 | guanylate cyclase complex, soluble(GO:0008074) |
| 0.1 | 2.5 | GO:0031229 | integral component of nuclear inner membrane(GO:0005639) intrinsic component of nuclear inner membrane(GO:0031229) nuclear membrane part(GO:0044453) |
| 0.1 | 2.1 | GO:0042599 | lamellar body(GO:0042599) |
| 0.1 | 22.1 | GO:0072562 | blood microparticle(GO:0072562) |
| 0.1 | 11.4 | GO:0031093 | platelet alpha granule lumen(GO:0031093) |
| 0.1 | 1.3 | GO:0032059 | bleb(GO:0032059) |
| 0.1 | 10.7 | GO:0042641 | actomyosin(GO:0042641) |
| 0.1 | 5.6 | GO:0005581 | collagen trimer(GO:0005581) |
| 0.1 | 3.4 | GO:0005637 | nuclear inner membrane(GO:0005637) |
| 0.1 | 38.6 | GO:0005925 | focal adhesion(GO:0005925) |
| 0.1 | 2.9 | GO:0001533 | cornified envelope(GO:0001533) |
| 0.1 | 15.1 | GO:0005578 | proteinaceous extracellular matrix(GO:0005578) |
| 0.1 | 0.9 | GO:0034709 | methylosome(GO:0034709) |
| 0.0 | 0.6 | GO:0032045 | guanyl-nucleotide exchange factor complex(GO:0032045) |
| 0.0 | 7.7 | GO:0005875 | microtubule associated complex(GO:0005875) |
| 0.0 | 6.3 | GO:0090575 | RNA polymerase II transcription factor complex(GO:0090575) |
| 0.0 | 1.7 | GO:0045095 | keratin filament(GO:0045095) |
| 0.0 | 17.9 | GO:0016607 | nuclear speck(GO:0016607) |
| 0.0 | 7.7 | GO:0032993 | protein-DNA complex(GO:0032993) |
| 0.0 | 5.7 | GO:0030136 | clathrin-coated vesicle(GO:0030136) |
| 0.0 | 40.0 | GO:0005615 | extracellular space(GO:0005615) |
| 0.0 | 0.3 | GO:0042588 | zymogen granule(GO:0042588) |
| 0.0 | 3.9 | GO:0005802 | trans-Golgi network(GO:0005802) |
| 0.0 | 0.3 | GO:0097381 | photoreceptor disc membrane(GO:0097381) |
| 0.0 | 5.3 | GO:0005635 | nuclear envelope(GO:0005635) |
| 0.0 | 3.1 | GO:0098852 | lysosomal membrane(GO:0005765) lytic vacuole membrane(GO:0098852) |
Gene overrepresentation in molecular_function category:
| Log-likelihood per target | Total log-likelihood | Term | Description |
|---|---|---|---|
| 5.3 | 16.0 | GO:0070326 | very-low-density lipoprotein particle receptor binding(GO:0070326) |
| 3.5 | 14.1 | GO:0047391 | alkylglycerophosphoethanolamine phosphodiesterase activity(GO:0047391) |
| 2.5 | 7.5 | GO:0033878 | hormone-sensitive lipase activity(GO:0033878) |
| 2.1 | 16.5 | GO:0001849 | complement component C1q binding(GO:0001849) |
| 1.9 | 5.8 | GO:0032767 | copper-dependent protein binding(GO:0032767) |
| 1.2 | 10.8 | GO:0004784 | superoxide dismutase activity(GO:0004784) oxidoreductase activity, acting on superoxide radicals as acceptor(GO:0016721) |
| 1.1 | 8.8 | GO:0004465 | lipoprotein lipase activity(GO:0004465) |
| 1.0 | 18.4 | GO:0008391 | arachidonic acid monooxygenase activity(GO:0008391) arachidonic acid epoxygenase activity(GO:0008392) |
| 1.0 | 6.7 | GO:0097643 | amylin receptor activity(GO:0097643) |
| 0.7 | 5.8 | GO:0008271 | secondary active sulfate transmembrane transporter activity(GO:0008271) |
| 0.7 | 2.9 | GO:0005277 | acetylcholine transmembrane transporter activity(GO:0005277) acetate ester transmembrane transporter activity(GO:1901375) |
| 0.7 | 9.7 | GO:0036374 | glutathione hydrolase activity(GO:0036374) |
| 0.7 | 2.6 | GO:0003990 | acetylcholinesterase activity(GO:0003990) |
| 0.6 | 3.2 | GO:0016933 | extracellular-glycine-gated ion channel activity(GO:0016933) extracellular-glycine-gated chloride channel activity(GO:0016934) |
| 0.6 | 3.7 | GO:0016941 | natriuretic peptide receptor activity(GO:0016941) |
| 0.6 | 7.7 | GO:0001087 | transcription factor activity, sequence-specific DNA binding, RNA polymerase recruiting(GO:0001011) transcription factor activity, TFIIB-class binding(GO:0001087) |
| 0.6 | 24.3 | GO:0005159 | insulin-like growth factor receptor binding(GO:0005159) |
| 0.6 | 3.4 | GO:0000155 | phosphorelay sensor kinase activity(GO:0000155) |
| 0.6 | 4.4 | GO:0004957 | prostaglandin E receptor activity(GO:0004957) |
| 0.6 | 2.8 | GO:0004668 | protein-arginine deiminase activity(GO:0004668) |
| 0.5 | 7.0 | GO:0004806 | triglyceride lipase activity(GO:0004806) |
| 0.5 | 4.1 | GO:0005025 | transforming growth factor beta receptor activity, type I(GO:0005025) |
| 0.4 | 10.5 | GO:0004012 | phospholipid-translocating ATPase activity(GO:0004012) |
| 0.4 | 4.4 | GO:0005021 | vascular endothelial growth factor-activated receptor activity(GO:0005021) |
| 0.3 | 3.3 | GO:0004022 | alcohol dehydrogenase (NAD) activity(GO:0004022) |
| 0.3 | 5.9 | GO:0008349 | MAP kinase kinase kinase kinase activity(GO:0008349) |
| 0.3 | 7.0 | GO:0050321 | tau-protein kinase activity(GO:0050321) |
| 0.3 | 2.5 | GO:0000182 | rDNA binding(GO:0000182) |
| 0.3 | 3.3 | GO:0016755 | transferase activity, transferring amino-acyl groups(GO:0016755) |
| 0.2 | 7.6 | GO:0005212 | structural constituent of eye lens(GO:0005212) |
| 0.2 | 2.5 | GO:0004931 | extracellular ATP-gated cation channel activity(GO:0004931) ATP-gated ion channel activity(GO:0035381) |
| 0.2 | 3.6 | GO:0030284 | estrogen receptor activity(GO:0030284) |
| 0.2 | 3.2 | GO:0045499 | chemorepellent activity(GO:0045499) |
| 0.2 | 4.8 | GO:0043395 | heparan sulfate proteoglycan binding(GO:0043395) |
| 0.2 | 5.2 | GO:0005527 | macrolide binding(GO:0005527) FK506 binding(GO:0005528) |
| 0.2 | 18.6 | GO:0005201 | extracellular matrix structural constituent(GO:0005201) |
| 0.2 | 4.5 | GO:0008093 | cytoskeletal adaptor activity(GO:0008093) |
| 0.2 | 3.5 | GO:0005328 | neurotransmitter:sodium symporter activity(GO:0005328) |
| 0.2 | 6.5 | GO:0000983 | transcription factor activity, RNA polymerase II core promoter sequence-specific(GO:0000983) |
| 0.1 | 6.5 | GO:0005245 | voltage-gated calcium channel activity(GO:0005245) |
| 0.1 | 7.6 | GO:0017112 | Rab guanyl-nucleotide exchange factor activity(GO:0017112) |
| 0.1 | 6.2 | GO:0005164 | tumor necrosis factor receptor binding(GO:0005164) |
| 0.1 | 1.4 | GO:0005225 | volume-sensitive anion channel activity(GO:0005225) |
| 0.1 | 32.9 | GO:0004252 | serine-type endopeptidase activity(GO:0004252) |
| 0.1 | 31.1 | GO:0003714 | transcription corepressor activity(GO:0003714) |
| 0.1 | 0.8 | GO:0099583 | neurotransmitter receptor activity involved in regulation of postsynaptic membrane potential(GO:0099529) neurotransmitter receptor activity involved in regulation of postsynaptic cytosolic calcium ion concentration(GO:0099583) transmitter-gated ion channel activity involved in regulation of postsynaptic membrane potential(GO:1904315) |
| 0.1 | 4.1 | GO:0030507 | spectrin binding(GO:0030507) |
| 0.1 | 6.3 | GO:0004879 | RNA polymerase II transcription factor activity, ligand-activated sequence-specific DNA binding(GO:0004879) transcription factor activity, direct ligand regulated sequence-specific DNA binding(GO:0098531) |
| 0.1 | 5.0 | GO:0030145 | manganese ion binding(GO:0030145) |
| 0.1 | 3.9 | GO:0034987 | immunoglobulin receptor binding(GO:0034987) |
| 0.1 | 5.4 | GO:0001540 | beta-amyloid binding(GO:0001540) |
| 0.1 | 1.5 | GO:0042609 | CD4 receptor binding(GO:0042609) |
| 0.1 | 0.9 | GO:0016273 | arginine N-methyltransferase activity(GO:0016273) protein-arginine N-methyltransferase activity(GO:0016274) |
| 0.1 | 2.1 | GO:0005184 | neuropeptide hormone activity(GO:0005184) |
| 0.1 | 0.8 | GO:0042043 | neurexin family protein binding(GO:0042043) |
| 0.1 | 4.3 | GO:0005179 | hormone activity(GO:0005179) |
| 0.0 | 6.3 | GO:0003823 | antigen binding(GO:0003823) |
| 0.0 | 3.6 | GO:0005518 | collagen binding(GO:0005518) |
| 0.0 | 4.7 | GO:0003730 | mRNA 3'-UTR binding(GO:0003730) |
| 0.0 | 0.9 | GO:0070006 | metalloaminopeptidase activity(GO:0070006) |
| 0.0 | 2.9 | GO:0004869 | cysteine-type endopeptidase inhibitor activity(GO:0004869) |
| 0.0 | 1.8 | GO:0008201 | heparin binding(GO:0008201) |
| 0.0 | 0.4 | GO:0031419 | cobalamin binding(GO:0031419) |
| 0.0 | 0.8 | GO:0016500 | protein-hormone receptor activity(GO:0016500) |
| 0.0 | 1.0 | GO:0003887 | DNA-directed DNA polymerase activity(GO:0003887) |
| 0.0 | 2.8 | GO:0005089 | Rho guanyl-nucleotide exchange factor activity(GO:0005089) |
| 0.0 | 7.7 | GO:0008022 | protein C-terminus binding(GO:0008022) |
| 0.0 | 21.3 | GO:0005509 | calcium ion binding(GO:0005509) |
| 0.0 | 0.9 | GO:0035591 | signaling adaptor activity(GO:0035591) |
| 0.0 | 1.2 | GO:0015485 | cholesterol binding(GO:0015485) |
| 0.0 | 0.5 | GO:0030371 | translation repressor activity(GO:0030371) |
| 0.0 | 0.4 | GO:0005247 | voltage-gated chloride channel activity(GO:0005247) |
| 0.0 | 1.3 | GO:0008307 | structural constituent of muscle(GO:0008307) |
| 0.0 | 5.4 | GO:0030246 | carbohydrate binding(GO:0030246) |
| 0.0 | 2.7 | GO:0000287 | magnesium ion binding(GO:0000287) |
| 0.0 | 10.7 | GO:0008270 | zinc ion binding(GO:0008270) |
| 0.0 | 6.6 | GO:0003779 | actin binding(GO:0003779) |
| 0.0 | 6.1 | GO:0004930 | G-protein coupled receptor activity(GO:0004930) |
| 0.0 | 0.3 | GO:0031489 | myosin V binding(GO:0031489) |
| 0.0 | 0.5 | GO:0030552 | cAMP binding(GO:0030552) |
Gene overrepresentation in C2:CP category:
| Log-likelihood per target | Total log-likelihood | Term | Description |
|---|---|---|---|
| 0.5 | 5.7 | ST JAK STAT PATHWAY | Jak-STAT Pathway |
| 0.3 | 37.2 | PID BETA CATENIN NUC PATHWAY | Regulation of nuclear beta catenin signaling and target gene transcription |
| 0.3 | 18.6 | PID FRA PATHWAY | Validated transcriptional targets of AP1 family members Fra1 and Fra2 |
| 0.2 | 15.7 | PID AJDISS 2PATHWAY | Posttranslational regulation of adherens junction stability and dissassembly |
| 0.2 | 7.4 | PID S1P S1P3 PATHWAY | S1P3 pathway |
| 0.2 | 30.8 | NABA ECM AFFILIATED | Genes encoding proteins affiliated structurally or functionally to extracellular matrix proteins |
| 0.2 | 8.3 | PID ARF6 TRAFFICKING PATHWAY | Arf6 trafficking events |
| 0.1 | 7.0 | PID NOTCH PATHWAY | Notch signaling pathway |
| 0.1 | 9.5 | PID REG GR PATHWAY | Glucocorticoid receptor regulatory network |
| 0.1 | 6.5 | ST FAS SIGNALING PATHWAY | Fas Signaling Pathway |
| 0.1 | 4.1 | PID BMP PATHWAY | BMP receptor signaling |
| 0.1 | 4.6 | PID ERA GENOMIC PATHWAY | Validated nuclear estrogen receptor alpha network |
| 0.0 | 2.8 | PID RHOA REG PATHWAY | Regulation of RhoA activity |
| 0.0 | 2.1 | PID ATF2 PATHWAY | ATF-2 transcription factor network |
| 0.0 | 1.2 | PID BARD1 PATHWAY | BARD1 signaling events |
| 0.0 | 1.5 | PID TRKR PATHWAY | Neurotrophic factor-mediated Trk receptor signaling |
| 0.0 | 5.0 | NABA ECM REGULATORS | Genes encoding enzymes and their regulators involved in the remodeling of the extracellular matrix |
| 0.0 | 0.7 | PID IL2 STAT5 PATHWAY | IL2 signaling events mediated by STAT5 |
| 0.0 | 1.0 | PID E2F PATHWAY | E2F transcription factor network |
| 0.0 | 0.9 | PID HDAC CLASSI PATHWAY | Signaling events mediated by HDAC Class I |
Gene overrepresentation in C2:CP:REACTOME category:
| Log-likelihood per target | Total log-likelihood | Term | Description |
|---|---|---|---|
| 1.8 | 19.5 | REACTOME CREATION OF C4 AND C2 ACTIVATORS | Genes involved in Creation of C4 and C2 activators |
| 1.6 | 16.5 | REACTOME INITIAL TRIGGERING OF COMPLEMENT | Genes involved in Initial triggering of complement |
| 0.8 | 14.3 | REACTOME XENOBIOTICS | Genes involved in Xenobiotics |
| 0.7 | 16.0 | REACTOME CHYLOMICRON MEDIATED LIPID TRANSPORT | Genes involved in Chylomicron-mediated lipid transport |
| 0.6 | 15.9 | REACTOME REGULATION OF INSULIN LIKE GROWTH FACTOR IGF ACTIVITY BY INSULIN LIKE GROWTH FACTOR BINDING PROTEINS IGFBPS | Genes involved in Regulation of Insulin-like Growth Factor (IGF) Activity by Insulin-like Growth Factor Binding Proteins (IGFBPs) |
| 0.5 | 8.3 | REACTOME SYNTHESIS SECRETION AND DEACYLATION OF GHRELIN | Genes involved in Synthesis, Secretion, and Deacylation of Ghrelin |
| 0.4 | 4.4 | REACTOME PROSTANOID LIGAND RECEPTORS | Genes involved in Prostanoid ligand receptors |
| 0.4 | 25.9 | REACTOME NOTCH1 INTRACELLULAR DOMAIN REGULATES TRANSCRIPTION | Genes involved in NOTCH1 Intracellular Domain Regulates Transcription |
| 0.4 | 13.3 | REACTOME EGFR DOWNREGULATION | Genes involved in EGFR downregulation |
| 0.3 | 4.8 | REACTOME ACYL CHAIN REMODELLING OF PG | Genes involved in Acyl chain remodelling of PG |
| 0.3 | 4.3 | REACTOME GLYCOPROTEIN HORMONES | Genes involved in Glycoprotein hormones |
| 0.3 | 15.9 | REACTOME ION TRANSPORT BY P TYPE ATPASES | Genes involved in Ion transport by P-type ATPases |
| 0.3 | 7.5 | REACTOME HORMONE SENSITIVE LIPASE HSL MEDIATED TRIACYLGLYCEROL HYDROLYSIS | Genes involved in Hormone-sensitive lipase (HSL)-mediated triacylglycerol hydrolysis |
| 0.2 | 3.5 | REACTOME NA CL DEPENDENT NEUROTRANSMITTER TRANSPORTERS | Genes involved in Na+/Cl- dependent neurotransmitter transporters |
| 0.2 | 5.4 | REACTOME GLUTATHIONE CONJUGATION | Genes involved in Glutathione conjugation |
| 0.1 | 2.9 | REACTOME ACETYLCHOLINE NEUROTRANSMITTER RELEASE CYCLE | Genes involved in Acetylcholine Neurotransmitter Release Cycle |
| 0.1 | 11.4 | REACTOME GLYCEROPHOSPHOLIPID BIOSYNTHESIS | Genes involved in Glycerophospholipid biosynthesis |
| 0.1 | 4.4 | REACTOME TIGHT JUNCTION INTERACTIONS | Genes involved in Tight junction interactions |
| 0.1 | 3.9 | REACTOME INTERACTION BETWEEN L1 AND ANKYRINS | Genes involved in Interaction between L1 and Ankyrins |
| 0.1 | 4.1 | REACTOME CYTOCHROME P450 ARRANGED BY SUBSTRATE TYPE | Genes involved in Cytochrome P450 - arranged by substrate type |
| 0.1 | 3.8 | REACTOME SIGNALING BY BMP | Genes involved in Signaling by BMP |
| 0.1 | 3.2 | REACTOME LIGAND GATED ION CHANNEL TRANSPORT | Genes involved in Ligand-gated ion channel transport |
| 0.1 | 8.8 | REACTOME CLASS B 2 SECRETIN FAMILY RECEPTORS | Genes involved in Class B/2 (Secretin family receptors) |
| 0.1 | 3.4 | REACTOME VOLTAGE GATED POTASSIUM CHANNELS | Genes involved in Voltage gated Potassium channels |
| 0.1 | 6.3 | REACTOME NUCLEAR RECEPTOR TRANSCRIPTION PATHWAY | Genes involved in Nuclear Receptor transcription pathway |
| 0.1 | 1.0 | REACTOME POL SWITCHING | Genes involved in Polymerase switching |
| 0.1 | 1.2 | REACTOME FANCONI ANEMIA PATHWAY | Genes involved in Fanconi Anemia pathway |
| 0.1 | 2.8 | REACTOME NRAGE SIGNALS DEATH THROUGH JNK | Genes involved in NRAGE signals death through JNK |
| 0.1 | 0.9 | REACTOME PROLACTIN RECEPTOR SIGNALING | Genes involved in Prolactin receptor signaling |
| 0.0 | 3.6 | REACTOME CROSS PRESENTATION OF SOLUBLE EXOGENOUS ANTIGENS ENDOSOMES | Genes involved in Cross-presentation of soluble exogenous antigens (endosomes) |
| 0.0 | 2.4 | REACTOME MYOGENESIS | Genes involved in Myogenesis |
| 0.0 | 0.8 | REACTOME TRAFFICKING OF GLUR2 CONTAINING AMPA RECEPTORS | Genes involved in Trafficking of GluR2-containing AMPA receptors |
| 0.0 | 8.1 | REACTOME GENERIC TRANSCRIPTION PATHWAY | Genes involved in Generic Transcription Pathway |
| 0.0 | 0.6 | REACTOME THE ROLE OF NEF IN HIV1 REPLICATION AND DISEASE PATHOGENESIS | Genes involved in The role of Nef in HIV-1 replication and disease pathogenesis |
| 0.0 | 1.3 | REACTOME SMOOTH MUSCLE CONTRACTION | Genes involved in Smooth Muscle Contraction |
| 0.0 | 2.4 | REACTOME MHC CLASS II ANTIGEN PRESENTATION | Genes involved in MHC class II antigen presentation |
| 0.0 | 0.9 | REACTOME METABOLISM OF NON CODING RNA | Genes involved in Metabolism of non-coding RNA |