Project
GNF SymAtlas + NCI-60 cancer cell lines, comparison of cancers vs non-cancers, human (Su, 2004; Ross, 2000)
Navigation
Downloads
Results for ZIC3_ZIC4
Z-value: 0.01
Motif logo
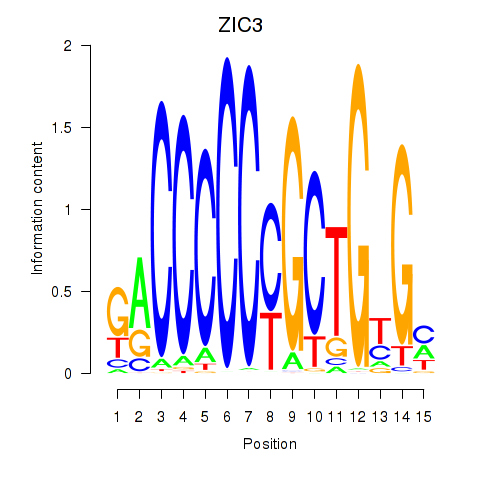
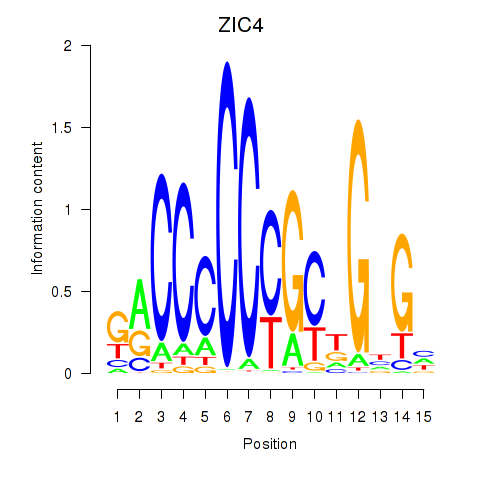
Transcription factors associated with ZIC3_ZIC4
| Gene Symbol | Gene ID | Gene Info |
|---|---|---|
|
ZIC3
|
ENSG00000156925.7 | Zic family member 3 |
|
ZIC4
|
ENSG00000174963.13 | Zic family member 4 |
Activity-expression correlation:
| Gene | Promoter | Pearson corr. coef. | P-value | Plot |
|---|---|---|---|---|
| ZIC3 | hg19_v2_chrX_+_136648297_136648319 | -0.05 | 4.5e-01 | Click! |
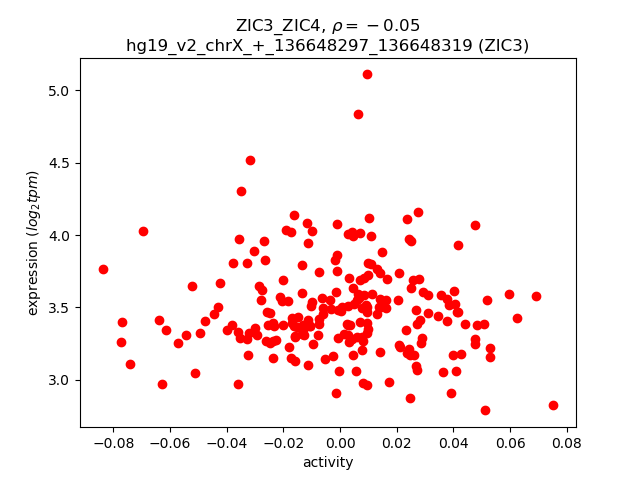
Activity profile of ZIC3_ZIC4 motif
Sorted Z-values of ZIC3_ZIC4 motif
| Promoter | Log-likelihood | Transcript | Gene | Gene Info |
|---|---|---|---|---|
| chr11_-_2182388 | 7.05 |
ENST00000421783.1
ENST00000397262.1 ENST00000250971.3 ENST00000381330.4 ENST00000397270.1 |
INS
INS-IGF2
|
insulin INS-IGF2 readthrough |
| chr7_-_994302 | 6.50 |
ENST00000265846.5
|
ADAP1
|
ArfGAP with dual PH domains 1 |
| chr5_+_75699149 | 5.85 |
ENST00000379730.3
|
IQGAP2
|
IQ motif containing GTPase activating protein 2 |
| chr5_+_75699040 | 5.57 |
ENST00000274364.6
|
IQGAP2
|
IQ motif containing GTPase activating protein 2 |
| chr16_-_88717482 | 5.20 |
ENST00000261623.3
|
CYBA
|
cytochrome b-245, alpha polypeptide |
| chr7_+_149571045 | 4.67 |
ENST00000479613.1
ENST00000606024.1 ENST00000464662.1 ENST00000425642.2 |
ATP6V0E2
|
ATPase, H+ transporting V0 subunit e2 |
| chr11_-_67272794 | 3.89 |
ENST00000436757.2
ENST00000356404.3 |
PITPNM1
|
phosphatidylinositol transfer protein, membrane-associated 1 |
| chr6_+_44238203 | 3.77 |
ENST00000451188.2
|
TMEM151B
|
transmembrane protein 151B |
| chr4_+_166128735 | 3.58 |
ENST00000226725.6
|
KLHL2
|
kelch-like family member 2 |
| chr17_-_1083078 | 3.52 |
ENST00000574266.1
ENST00000302538.5 |
ABR
|
active BCR-related |
| chrX_-_102319092 | 3.36 |
ENST00000372728.3
|
BEX1
|
brain expressed, X-linked 1 |
| chr15_+_31619013 | 3.22 |
ENST00000307145.3
|
KLF13
|
Kruppel-like factor 13 |
| chr11_+_121322832 | 3.14 |
ENST00000260197.7
|
SORL1
|
sortilin-related receptor, L(DLR class) A repeats containing |
| chr4_-_106395135 | 2.99 |
ENST00000310267.7
|
PPA2
|
pyrophosphatase (inorganic) 2 |
| chr4_-_40631859 | 2.87 |
ENST00000295971.7
ENST00000319592.4 |
RBM47
|
RNA binding motif protein 47 |
| chr4_-_17513851 | 2.80 |
ENST00000281243.5
|
QDPR
|
quinoid dihydropteridine reductase |
| chr1_+_155293702 | 2.76 |
ENST00000368347.4
|
RUSC1
|
RUN and SH3 domain containing 1 |
| chr6_-_29600832 | 2.74 |
ENST00000377016.4
ENST00000376977.3 ENST00000377034.4 |
GABBR1
|
gamma-aminobutyric acid (GABA) B receptor, 1 |
| chr17_-_4871085 | 2.65 |
ENST00000575142.1
ENST00000206020.3 |
SPAG7
|
sperm associated antigen 7 |
| chr1_-_32801825 | 2.61 |
ENST00000329421.7
|
MARCKSL1
|
MARCKS-like 1 |
| chr15_+_75074385 | 2.46 |
ENST00000220003.9
|
CSK
|
c-src tyrosine kinase |
| chrX_+_51927919 | 2.41 |
ENST00000416960.1
|
MAGED4
|
melanoma antigen family D, 4 |
| chr6_+_150070831 | 2.40 |
ENST00000367380.5
|
PCMT1
|
protein-L-isoaspartate (D-aspartate) O-methyltransferase |
| chr17_-_4890919 | 2.33 |
ENST00000572543.1
ENST00000381311.5 ENST00000348066.3 ENST00000358183.4 |
CAMTA2
|
calmodulin binding transcription activator 2 |
| chr16_+_2039946 | 2.33 |
ENST00000248121.2
ENST00000568896.1 |
SYNGR3
|
synaptogyrin 3 |
| chr16_+_56623433 | 2.32 |
ENST00000570176.1
|
MT3
|
metallothionein 3 |
| chr11_-_78128811 | 2.28 |
ENST00000530915.1
ENST00000361507.4 |
GAB2
|
GRB2-associated binding protein 2 |
| chr17_-_4890649 | 2.26 |
ENST00000361571.5
|
CAMTA2
|
calmodulin binding transcription activator 2 |
| chr8_-_67976509 | 2.26 |
ENST00000518747.1
|
COPS5
|
COP9 signalosome subunit 5 |
| chr4_+_154387480 | 2.21 |
ENST00000409663.3
ENST00000440693.1 ENST00000409959.3 |
KIAA0922
|
KIAA0922 |
| chr16_+_58497567 | 2.17 |
ENST00000258187.5
|
NDRG4
|
NDRG family member 4 |
| chr16_+_30205754 | 2.07 |
ENST00000354723.6
ENST00000355544.5 |
SULT1A3
|
sulfotransferase family, cytosolic, 1A, phenol-preferring, member 3 |
| chr22_-_22221900 | 2.06 |
ENST00000215832.6
ENST00000398822.3 |
MAPK1
|
mitogen-activated protein kinase 1 |
| chr3_+_11034403 | 2.04 |
ENST00000287766.4
ENST00000425938.1 |
SLC6A1
|
solute carrier family 6 (neurotransmitter transporter), member 1 |
| chr1_-_25256368 | 2.00 |
ENST00000308873.6
|
RUNX3
|
runt-related transcription factor 3 |
| chr20_-_62129163 | 2.00 |
ENST00000298049.7
|
EEF1A2
|
eukaryotic translation elongation factor 1 alpha 2 |
| chr16_+_67596310 | 1.98 |
ENST00000264010.4
ENST00000401394.1 |
CTCF
|
CCCTC-binding factor (zinc finger protein) |
| chrX_+_123095155 | 1.97 |
ENST00000371160.1
ENST00000435103.1 |
STAG2
|
stromal antigen 2 |
| chr10_-_88854518 | 1.94 |
ENST00000277865.4
|
GLUD1
|
glutamate dehydrogenase 1 |
| chr2_+_37571717 | 1.94 |
ENST00000338415.3
ENST00000404976.1 |
QPCT
|
glutaminyl-peptide cyclotransferase |
| chr1_+_33352036 | 1.94 |
ENST00000373467.3
|
HPCA
|
hippocalcin |
| chr12_-_57824739 | 1.93 |
ENST00000347140.3
ENST00000402412.1 |
R3HDM2
|
R3H domain containing 2 |
| chr5_+_169064245 | 1.93 |
ENST00000256935.8
|
DOCK2
|
dedicator of cytokinesis 2 |
| chr2_+_37571845 | 1.92 |
ENST00000537448.1
|
QPCT
|
glutaminyl-peptide cyclotransferase |
| chr3_+_54156664 | 1.91 |
ENST00000474759.1
ENST00000288197.5 |
CACNA2D3
|
calcium channel, voltage-dependent, alpha 2/delta subunit 3 |
| chr14_+_31343747 | 1.90 |
ENST00000216361.4
ENST00000396618.3 ENST00000475087.1 |
COCH
|
cochlin |
| chr2_+_8822113 | 1.89 |
ENST00000396290.1
ENST00000331129.3 |
ID2
|
inhibitor of DNA binding 2, dominant negative helix-loop-helix protein |
| chr12_+_132312931 | 1.86 |
ENST00000360564.1
ENST00000545671.1 ENST00000545790.1 |
MMP17
|
matrix metallopeptidase 17 (membrane-inserted) |
| chr6_+_150070857 | 1.85 |
ENST00000544496.1
|
PCMT1
|
protein-L-isoaspartate (D-aspartate) O-methyltransferase |
| chr1_-_114355083 | 1.84 |
ENST00000261441.5
|
RSBN1
|
round spermatid basic protein 1 |
| chr9_-_88356789 | 1.82 |
ENST00000357081.3
ENST00000376081.4 ENST00000337006.4 ENST00000376109.3 |
AGTPBP1
|
ATP/GTP binding protein 1 |
| chr3_+_54156570 | 1.78 |
ENST00000415676.2
|
CACNA2D3
|
calcium channel, voltage-dependent, alpha 2/delta subunit 3 |
| chr5_-_179499086 | 1.77 |
ENST00000261947.4
|
RNF130
|
ring finger protein 130 |
| chr15_+_75074410 | 1.77 |
ENST00000439220.2
|
CSK
|
c-src tyrosine kinase |
| chr11_-_64510409 | 1.77 |
ENST00000394429.1
ENST00000394428.1 |
RASGRP2
|
RAS guanyl releasing protein 2 (calcium and DAG-regulated) |
| chr14_-_93651186 | 1.74 |
ENST00000556883.1
ENST00000298894.4 |
MOAP1
|
modulator of apoptosis 1 |
| chr19_+_17858509 | 1.74 |
ENST00000594202.1
ENST00000252771.7 ENST00000389133.4 |
FCHO1
|
FCH domain only 1 |
| chr5_+_137688285 | 1.73 |
ENST00000314358.5
|
KDM3B
|
lysine (K)-specific demethylase 3B |
| chr5_-_179499108 | 1.73 |
ENST00000521389.1
|
RNF130
|
ring finger protein 130 |
| chr15_-_69113218 | 1.71 |
ENST00000560303.1
ENST00000465139.2 |
ANP32A
|
acidic (leucine-rich) nuclear phosphoprotein 32 family, member A |
| chr9_+_115913222 | 1.68 |
ENST00000259392.3
|
SLC31A2
|
solute carrier family 31 (copper transporter), member 2 |
| chr16_+_30205225 | 1.68 |
ENST00000345535.4
ENST00000251303.6 |
SLX1A
|
SLX1 structure-specific endonuclease subunit homolog A (S. cerevisiae) |
| chr16_+_29465822 | 1.67 |
ENST00000330181.5
ENST00000351581.4 |
SLX1B
|
SLX1 structure-specific endonuclease subunit homolog B (S. cerevisiae) |
| chr22_-_47134077 | 1.67 |
ENST00000541677.1
ENST00000216264.8 |
CERK
|
ceramide kinase |
| chr11_-_73694346 | 1.64 |
ENST00000310473.3
|
UCP2
|
uncoupling protein 2 (mitochondrial, proton carrier) |
| chr11_-_57004658 | 1.64 |
ENST00000606794.1
|
APLNR
|
apelin receptor |
| chr11_-_407103 | 1.63 |
ENST00000526395.1
|
SIGIRR
|
single immunoglobulin and toll-interleukin 1 receptor (TIR) domain |
| chr15_+_80696666 | 1.58 |
ENST00000303329.4
|
ARNT2
|
aryl-hydrocarbon receptor nuclear translocator 2 |
| chr5_-_179498703 | 1.56 |
ENST00000522208.2
|
RNF130
|
ring finger protein 130 |
| chr17_-_76124812 | 1.54 |
ENST00000592063.1
ENST00000589271.1 ENST00000322933.4 ENST00000589553.1 |
TMC6
|
transmembrane channel-like 6 |
| chr20_+_35201993 | 1.53 |
ENST00000373872.4
|
TGIF2
|
TGFB-induced factor homeobox 2 |
| chr3_+_50712672 | 1.49 |
ENST00000266037.9
|
DOCK3
|
dedicator of cytokinesis 3 |
| chr3_-_129035120 | 1.49 |
ENST00000333762.4
|
H1FX
|
H1 histone family, member X |
| chr1_-_21503337 | 1.47 |
ENST00000400422.1
ENST00000602326.1 ENST00000411888.1 ENST00000438975.1 |
EIF4G3
|
eukaryotic translation initiation factor 4 gamma, 3 |
| chr9_-_140351928 | 1.47 |
ENST00000339554.3
|
NSMF
|
NMDA receptor synaptonuclear signaling and neuronal migration factor |
| chr2_-_96811170 | 1.45 |
ENST00000288943.4
|
DUSP2
|
dual specificity phosphatase 2 |
| chr2_+_79740118 | 1.44 |
ENST00000496558.1
ENST00000451966.1 |
CTNNA2
|
catenin (cadherin-associated protein), alpha 2 |
| chr2_-_98280383 | 1.41 |
ENST00000289228.5
|
ACTR1B
|
ARP1 actin-related protein 1 homolog B, centractin beta (yeast) |
| chr20_+_3869423 | 1.38 |
ENST00000497424.1
|
PANK2
|
pantothenate kinase 2 |
| chrX_+_123094672 | 1.37 |
ENST00000354548.5
ENST00000458700.1 |
STAG2
|
stromal antigen 2 |
| chr1_-_153521597 | 1.37 |
ENST00000368712.1
|
S100A3
|
S100 calcium binding protein A3 |
| chr19_+_54926601 | 1.37 |
ENST00000301194.4
|
TTYH1
|
tweety family member 1 |
| chr2_+_128180842 | 1.36 |
ENST00000402125.2
|
PROC
|
protein C (inactivator of coagulation factors Va and VIIIa) |
| chr14_-_21994525 | 1.35 |
ENST00000538754.1
|
SALL2
|
spalt-like transcription factor 2 |
| chrX_+_106871713 | 1.35 |
ENST00000372435.4
ENST00000372428.4 ENST00000372419.3 ENST00000543248.1 |
PRPS1
|
phosphoribosyl pyrophosphate synthetase 1 |
| chr20_+_35201857 | 1.34 |
ENST00000373874.2
|
TGIF2
|
TGFB-induced factor homeobox 2 |
| chr3_+_38206975 | 1.33 |
ENST00000446845.1
ENST00000311806.3 |
OXSR1
|
oxidative stress responsive 1 |
| chr3_-_33686743 | 1.33 |
ENST00000333778.6
ENST00000539981.1 |
CLASP2
|
cytoplasmic linker associated protein 2 |
| chr10_+_51572339 | 1.32 |
ENST00000344348.6
|
NCOA4
|
nuclear receptor coactivator 4 |
| chr7_-_100808394 | 1.32 |
ENST00000445482.2
|
VGF
|
VGF nerve growth factor inducible |
| chr19_-_12992244 | 1.29 |
ENST00000538460.1
|
DNASE2
|
deoxyribonuclease II, lysosomal |
| chr3_+_184097836 | 1.29 |
ENST00000204604.1
ENST00000310236.3 |
CHRD
|
chordin |
| chr3_-_33759699 | 1.27 |
ENST00000399362.4
ENST00000359576.5 ENST00000307312.7 |
CLASP2
|
cytoplasmic linker associated protein 2 |
| chr7_-_100808843 | 1.26 |
ENST00000249330.2
|
VGF
|
VGF nerve growth factor inducible |
| chrX_+_123095546 | 1.26 |
ENST00000371157.3
ENST00000371145.3 ENST00000371144.3 |
STAG2
|
stromal antigen 2 |
| chr3_-_33759541 | 1.25 |
ENST00000468888.2
|
CLASP2
|
cytoplasmic linker associated protein 2 |
| chr1_+_28995231 | 1.25 |
ENST00000373816.1
|
GMEB1
|
glucocorticoid modulatory element binding protein 1 |
| chr7_+_65540780 | 1.24 |
ENST00000304874.9
|
ASL
|
argininosuccinate lyase |
| chr14_+_100848311 | 1.22 |
ENST00000542471.2
|
WDR25
|
WD repeat domain 25 |
| chr9_+_131580734 | 1.20 |
ENST00000372642.4
|
ENDOG
|
endonuclease G |
| chrX_-_153881842 | 1.20 |
ENST00000369585.3
ENST00000247306.4 |
CTAG2
|
cancer/testis antigen 2 |
| chr19_+_45409011 | 1.19 |
ENST00000252486.4
ENST00000446996.1 ENST00000434152.1 |
APOE
|
apolipoprotein E |
| chr14_+_71108460 | 1.18 |
ENST00000256367.2
|
TTC9
|
tetratricopeptide repeat domain 9 |
| chr19_+_10531150 | 1.17 |
ENST00000352831.6
|
PDE4A
|
phosphodiesterase 4A, cAMP-specific |
| chr19_+_54926621 | 1.17 |
ENST00000376530.3
ENST00000445095.1 ENST00000391739.3 ENST00000376531.3 |
TTYH1
|
tweety family member 1 |
| chr1_+_146714291 | 1.14 |
ENST00000431239.1
ENST00000369259.3 ENST00000369258.4 ENST00000361293.5 |
CHD1L
|
chromodomain helicase DNA binding protein 1-like |
| chr10_-_43903217 | 1.14 |
ENST00000357065.4
|
HNRNPF
|
heterogeneous nuclear ribonucleoprotein F |
| chr9_+_100174232 | 1.14 |
ENST00000355295.4
|
TDRD7
|
tudor domain containing 7 |
| chr3_-_50540854 | 1.14 |
ENST00000423994.2
ENST00000424201.2 ENST00000479441.1 ENST00000429770.1 |
CACNA2D2
|
calcium channel, voltage-dependent, alpha 2/delta subunit 2 |
| chr17_-_43045439 | 1.13 |
ENST00000253407.3
|
C1QL1
|
complement component 1, q subcomponent-like 1 |
| chrX_+_41192595 | 1.12 |
ENST00000399959.2
|
DDX3X
|
DEAD (Asp-Glu-Ala-Asp) box helicase 3, X-linked |
| chr7_-_752577 | 1.09 |
ENST00000544935.1
ENST00000430040.1 ENST00000456696.2 ENST00000406797.1 |
PRKAR1B
|
protein kinase, cAMP-dependent, regulatory, type I, beta |
| chr14_+_57046500 | 1.09 |
ENST00000261556.6
|
TMEM260
|
transmembrane protein 260 |
| chr16_-_11681023 | 1.09 |
ENST00000570904.1
ENST00000574701.1 |
LITAF
|
lipopolysaccharide-induced TNF factor |
| chr11_-_62477041 | 1.08 |
ENST00000433053.1
|
BSCL2
|
Berardinelli-Seip congenital lipodystrophy 2 (seipin) |
| chr8_-_80993010 | 1.08 |
ENST00000537855.1
ENST00000520527.1 ENST00000517427.1 ENST00000448733.2 ENST00000379097.3 |
TPD52
|
tumor protein D52 |
| chr16_+_89989687 | 1.07 |
ENST00000315491.7
ENST00000555576.1 ENST00000554336.1 ENST00000553967.1 |
TUBB3
|
Tubulin beta-3 chain |
| chr3_+_38179969 | 1.07 |
ENST00000396334.3
ENST00000417037.2 ENST00000424893.1 ENST00000495303.1 ENST00000443433.2 ENST00000421516.1 |
MYD88
|
myeloid differentiation primary response 88 |
| chr11_+_64692143 | 1.06 |
ENST00000164133.2
ENST00000532850.1 |
PPP2R5B
|
protein phosphatase 2, regulatory subunit B', beta |
| chr3_-_133614597 | 1.06 |
ENST00000285208.4
ENST00000460865.3 |
RAB6B
|
RAB6B, member RAS oncogene family |
| chr16_-_30205627 | 1.04 |
ENST00000305321.4
|
BOLA2B
|
bolA family member 2B |
| chr2_-_99552620 | 1.04 |
ENST00000428096.1
ENST00000397899.2 ENST00000420294.1 |
KIAA1211L
|
KIAA1211-like |
| chr16_-_1993260 | 1.04 |
ENST00000361871.3
|
MSRB1
|
methionine sulfoxide reductase B1 |
| chr11_+_2466218 | 1.03 |
ENST00000155840.5
|
KCNQ1
|
potassium voltage-gated channel, KQT-like subfamily, member 1 |
| chr3_-_64009658 | 1.02 |
ENST00000394431.2
|
PSMD6
|
proteasome (prosome, macropain) 26S subunit, non-ATPase, 6 |
| chr3_+_184097905 | 1.02 |
ENST00000450923.1
|
CHRD
|
chordin |
| chr1_+_28995258 | 1.01 |
ENST00000361872.4
ENST00000294409.2 |
GMEB1
|
glucocorticoid modulatory element binding protein 1 |
| chr20_+_3870024 | 1.00 |
ENST00000610179.1
|
PANK2
|
pantothenate kinase 2 |
| chr4_+_74718906 | 0.99 |
ENST00000226524.3
|
PF4V1
|
platelet factor 4 variant 1 |
| chr4_-_106395197 | 0.99 |
ENST00000508518.1
ENST00000354147.3 ENST00000432483.2 ENST00000510015.1 ENST00000504028.1 ENST00000348706.5 ENST00000357415.4 ENST00000380004.2 ENST00000341695.5 |
PPA2
|
pyrophosphatase (inorganic) 2 |
| chr16_+_56691911 | 0.99 |
ENST00000568475.1
|
MT1F
|
metallothionein 1F |
| chr10_+_45455207 | 0.97 |
ENST00000334940.6
ENST00000374417.2 ENST00000340258.5 ENST00000427758.1 |
RASSF4
|
Ras association (RalGDS/AF-6) domain family member 4 |
| chr16_-_11680791 | 0.97 |
ENST00000571976.1
ENST00000413364.2 |
LITAF
|
lipopolysaccharide-induced TNF factor |
| chr1_+_156024552 | 0.97 |
ENST00000368304.5
ENST00000368302.3 |
LAMTOR2
|
late endosomal/lysosomal adaptor, MAPK and MTOR activator 2 |
| chr16_-_29466285 | 0.97 |
ENST00000330978.3
|
BOLA2
|
bolA family member 2 |
| chr17_-_39191107 | 0.96 |
ENST00000344363.5
|
KRTAP1-3
|
keratin associated protein 1-3 |
| chr15_-_91565770 | 0.96 |
ENST00000535906.1
ENST00000333371.3 |
VPS33B
|
vacuolar protein sorting 33 homolog B (yeast) |
| chr6_+_15246501 | 0.96 |
ENST00000341776.2
|
JARID2
|
jumonji, AT rich interactive domain 2 |
| chr7_+_128577972 | 0.95 |
ENST00000357234.5
ENST00000477535.1 ENST00000479582.1 ENST00000464557.1 ENST00000402030.2 |
IRF5
|
interferon regulatory factor 5 |
| chr9_-_140082983 | 0.95 |
ENST00000323927.2
|
ANAPC2
|
anaphase promoting complex subunit 2 |
| chr15_-_66790146 | 0.95 |
ENST00000316634.5
|
SNAPC5
|
small nuclear RNA activating complex, polypeptide 5, 19kDa |
| chr2_+_65216462 | 0.94 |
ENST00000234256.3
|
SLC1A4
|
solute carrier family 1 (glutamate/neutral amino acid transporter), member 4 |
| chr1_-_6240183 | 0.94 |
ENST00000262450.3
ENST00000378021.1 |
CHD5
|
chromodomain helicase DNA binding protein 5 |
| chr2_+_134877740 | 0.94 |
ENST00000409645.1
|
MGAT5
|
mannosyl (alpha-1,6-)-glycoprotein beta-1,6-N-acetyl-glucosaminyltransferase |
| chr14_+_91580357 | 0.94 |
ENST00000298858.4
ENST00000521081.1 ENST00000520328.1 ENST00000256324.10 ENST00000524232.1 ENST00000522170.1 ENST00000519950.1 ENST00000523879.1 ENST00000521077.2 ENST00000518665.2 |
C14orf159
|
chromosome 14 open reading frame 159 |
| chr11_+_47291193 | 0.93 |
ENST00000428807.1
ENST00000402799.1 ENST00000406482.1 ENST00000349238.3 ENST00000311027.5 ENST00000407859.3 ENST00000395344.3 ENST00000444117.1 |
MADD
|
MAP-kinase activating death domain |
| chr7_+_65540853 | 0.93 |
ENST00000380839.4
ENST00000395332.3 ENST00000362000.5 ENST00000395331.3 |
ASL
|
argininosuccinate lyase |
| chr17_+_38219063 | 0.93 |
ENST00000584985.1
ENST00000264637.4 ENST00000450525.2 |
THRA
|
thyroid hormone receptor, alpha |
| chr1_-_212873267 | 0.92 |
ENST00000243440.1
|
BATF3
|
basic leucine zipper transcription factor, ATF-like 3 |
| chr8_-_41522719 | 0.92 |
ENST00000335651.6
|
ANK1
|
ankyrin 1, erythrocytic |
| chr14_+_91580732 | 0.92 |
ENST00000519019.1
ENST00000523816.1 ENST00000517518.1 |
C14orf159
|
chromosome 14 open reading frame 159 |
| chr14_+_91580708 | 0.91 |
ENST00000518868.1
|
C14orf159
|
chromosome 14 open reading frame 159 |
| chr4_+_115519577 | 0.91 |
ENST00000310836.6
|
UGT8
|
UDP glycosyltransferase 8 |
| chr14_+_91580777 | 0.91 |
ENST00000525393.2
ENST00000428926.2 ENST00000517362.1 |
C14orf159
|
chromosome 14 open reading frame 159 |
| chr12_-_51785182 | 0.91 |
ENST00000356317.3
ENST00000603188.1 ENST00000604847.1 ENST00000604506.1 |
GALNT6
|
UDP-N-acetyl-alpha-D-galactosamine:polypeptide N-acetylgalactosaminyltransferase 6 (GalNAc-T6) |
| chr14_-_23822080 | 0.90 |
ENST00000397267.1
ENST00000354772.3 |
SLC22A17
|
solute carrier family 22, member 17 |
| chr1_+_109792641 | 0.90 |
ENST00000271332.3
|
CELSR2
|
cadherin, EGF LAG seven-pass G-type receptor 2 |
| chr20_-_2644832 | 0.90 |
ENST00000380851.5
ENST00000380843.4 |
IDH3B
|
isocitrate dehydrogenase 3 (NAD+) beta |
| chr1_-_55680762 | 0.89 |
ENST00000407756.1
ENST00000294383.6 |
USP24
|
ubiquitin specific peptidase 24 |
| chr1_-_151119087 | 0.89 |
ENST00000341697.3
ENST00000368914.3 |
SEMA6C
|
sema domain, transmembrane domain (TM), and cytoplasmic domain, (semaphorin) 6C |
| chr1_+_156024525 | 0.87 |
ENST00000368305.4
|
LAMTOR2
|
late endosomal/lysosomal adaptor, MAPK and MTOR activator 2 |
| chr19_+_13135731 | 0.87 |
ENST00000587260.1
|
NFIX
|
nuclear factor I/X (CCAAT-binding transcription factor) |
| chr10_+_28821674 | 0.87 |
ENST00000526722.1
ENST00000375646.1 |
WAC
|
WW domain containing adaptor with coiled-coil |
| chrX_-_49056635 | 0.86 |
ENST00000472598.1
ENST00000538567.1 ENST00000479808.1 ENST00000263233.4 |
SYP
|
synaptophysin |
| chr6_-_29595779 | 0.86 |
ENST00000355973.3
ENST00000377012.4 |
GABBR1
|
gamma-aminobutyric acid (GABA) B receptor, 1 |
| chr1_-_45308616 | 0.86 |
ENST00000447098.2
ENST00000372192.3 |
PTCH2
|
patched 2 |
| chr17_-_38721711 | 0.85 |
ENST00000578085.1
ENST00000246657.2 |
CCR7
|
chemokine (C-C motif) receptor 7 |
| chr21_+_45725050 | 0.85 |
ENST00000403390.1
|
PFKL
|
phosphofructokinase, liver |
| chr8_-_41522779 | 0.85 |
ENST00000522231.1
ENST00000314214.8 ENST00000348036.4 ENST00000457297.1 ENST00000522543.1 |
ANK1
|
ankyrin 1, erythrocytic |
| chr10_+_13142075 | 0.84 |
ENST00000378757.2
ENST00000430081.1 ENST00000378752.3 ENST00000378748.3 |
OPTN
|
optineurin |
| chr15_-_91565743 | 0.84 |
ENST00000535843.1
|
VPS33B
|
vacuolar protein sorting 33 homolog B (yeast) |
| chr1_+_2407754 | 0.83 |
ENST00000419816.2
ENST00000378486.3 ENST00000378488.3 ENST00000288766.5 |
PLCH2
|
phospholipase C, eta 2 |
| chr14_+_57046530 | 0.83 |
ENST00000536419.1
ENST00000538838.1 |
TMEM260
|
transmembrane protein 260 |
| chr13_-_95131923 | 0.83 |
ENST00000377028.5
ENST00000446125.1 |
DCT
|
dopachrome tautomerase |
| chr19_+_55105085 | 0.83 |
ENST00000251372.3
ENST00000453777.1 |
LILRA1
|
leukocyte immunoglobulin-like receptor, subfamily A (with TM domain), member 1 |
| chr16_-_74808710 | 0.82 |
ENST00000219368.3
ENST00000544337.1 |
FA2H
|
fatty acid 2-hydroxylase |
| chr12_-_323689 | 0.82 |
ENST00000428720.1
|
SLC6A12
|
solute carrier family 6 (neurotransmitter transporter), member 12 |
| chr19_+_13135790 | 0.81 |
ENST00000358552.3
|
NFIX
|
nuclear factor I/X (CCAAT-binding transcription factor) |
| chr1_-_153521714 | 0.81 |
ENST00000368713.3
|
S100A3
|
S100 calcium binding protein A3 |
| chr19_+_49617581 | 0.81 |
ENST00000391864.3
|
LIN7B
|
lin-7 homolog B (C. elegans) |
| chr17_-_50236039 | 0.79 |
ENST00000451037.2
|
CA10
|
carbonic anhydrase X |
| chr11_+_64781575 | 0.79 |
ENST00000246747.4
ENST00000529384.1 |
ARL2
|
ADP-ribosylation factor-like 2 |
| chr9_+_134269439 | 0.79 |
ENST00000405995.1
|
PRRC2B
|
proline-rich coiled-coil 2B |
| chr2_-_51259229 | 0.78 |
ENST00000405472.3
|
NRXN1
|
neurexin 1 |
| chr16_-_11680759 | 0.78 |
ENST00000571459.1
ENST00000570798.1 ENST00000572255.1 ENST00000574763.1 ENST00000574703.1 ENST00000571277.1 ENST00000381810.3 |
LITAF
|
lipopolysaccharide-induced TNF factor |
| chr3_-_64009102 | 0.78 |
ENST00000478185.1
ENST00000482510.1 ENST00000497323.1 ENST00000492933.1 ENST00000295901.4 |
PSMD6
|
proteasome (prosome, macropain) 26S subunit, non-ATPase, 6 |
| chr9_+_100745615 | 0.77 |
ENST00000339399.4
|
ANP32B
|
acidic (leucine-rich) nuclear phosphoprotein 32 family, member B |
| chr4_-_71705027 | 0.76 |
ENST00000545193.1
|
GRSF1
|
G-rich RNA sequence binding factor 1 |
| chr7_-_752074 | 0.76 |
ENST00000360274.4
|
PRKAR1B
|
protein kinase, cAMP-dependent, regulatory, type I, beta |
| chr13_-_41345277 | 0.76 |
ENST00000323563.6
|
MRPS31
|
mitochondrial ribosomal protein S31 |
| chr17_-_40428359 | 0.76 |
ENST00000293328.3
|
STAT5B
|
signal transducer and activator of transcription 5B |
| chr16_+_1128781 | 0.75 |
ENST00000293897.4
ENST00000562758.1 |
SSTR5
|
somatostatin receptor 5 |
| chr9_+_100174344 | 0.75 |
ENST00000422139.2
|
TDRD7
|
tudor domain containing 7 |
| chr18_+_11752040 | 0.75 |
ENST00000423027.3
|
GNAL
|
guanine nucleotide binding protein (G protein), alpha activating activity polypeptide, olfactory type |
| chr5_+_110074685 | 0.74 |
ENST00000355943.3
ENST00000447245.2 |
SLC25A46
|
solute carrier family 25, member 46 |
| chr7_-_140178726 | 0.74 |
ENST00000480552.1
|
MKRN1
|
makorin ring finger protein 1 |
| chr13_+_35516390 | 0.74 |
ENST00000540320.1
ENST00000400445.3 ENST00000310336.4 |
NBEA
|
neurobeachin |
| chr11_-_66139617 | 0.73 |
ENST00000544554.1
ENST00000546034.1 |
SLC29A2
|
solute carrier family 29 (equilibrative nucleoside transporter), member 2 |
| chr11_-_116968987 | 0.72 |
ENST00000434315.2
ENST00000292055.4 ENST00000375288.1 ENST00000542607.1 ENST00000445177.1 ENST00000375300.1 ENST00000446921.2 |
SIK3
|
SIK family kinase 3 |
| chr20_+_60813535 | 0.71 |
ENST00000358053.2
ENST00000313733.3 ENST00000439951.2 |
OSBPL2
|
oxysterol binding protein-like 2 |
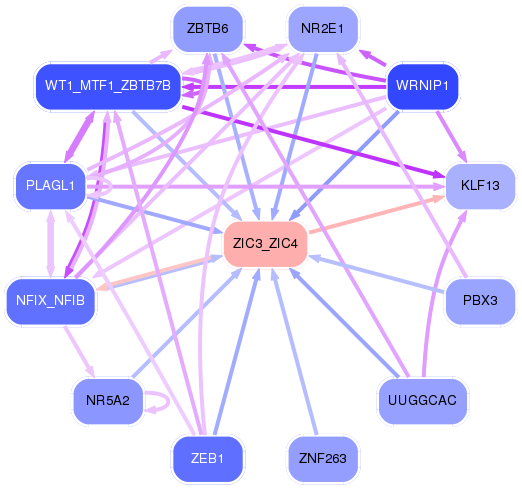
Network of associatons between targets according to the STRING database.

First level regulatory network of ZIC3_ZIC4
Gene Ontology Analysis
Gene overrepresentation in biological_process category:
| Log-likelihood per target | Total log-likelihood | Term | Description |
|---|---|---|---|
| 2.4 | 7.1 | GO:0033861 | negative regulation of NAD(P)H oxidase activity(GO:0033861) |
| 1.3 | 4.0 | GO:0071344 | diphosphate metabolic process(GO:0071344) |
| 1.3 | 3.9 | GO:0017186 | peptidyl-pyroglutamic acid biosynthetic process, using glutaminyl-peptide cyclotransferase(GO:0017186) |
| 1.2 | 3.5 | GO:0043314 | negative regulation of neutrophil degranulation(GO:0043314) |
| 1.0 | 3.1 | GO:1902997 | regulation of choline O-acetyltransferase activity(GO:1902769) positive regulation of choline O-acetyltransferase activity(GO:1902771) negative regulation of tau-protein kinase activity(GO:1902948) positive regulation of early endosome to recycling endosome transport(GO:1902955) negative regulation of aspartic-type endopeptidase activity involved in amyloid precursor protein catabolic process(GO:1902960) negative regulation of neurofibrillary tangle assembly(GO:1902997) negative regulation of aspartic-type peptidase activity(GO:1905246) |
| 1.0 | 5.2 | GO:1904844 | response to L-glutamine(GO:1904844) cellular response to L-glutamine(GO:1904845) |
| 0.9 | 2.8 | GO:0021919 | BMP signaling pathway involved in spinal cord dorsal/ventral patterning(GO:0021919) |
| 0.9 | 2.8 | GO:0051066 | dihydrobiopterin metabolic process(GO:0051066) |
| 0.8 | 4.2 | GO:0042997 | negative regulation of Golgi to plasma membrane protein transport(GO:0042997) |
| 0.8 | 2.3 | GO:0097212 | cadmium ion homeostasis(GO:0055073) lysosomal membrane organization(GO:0097212) negative regulation of hydrogen peroxide catabolic process(GO:2000296) regulation of oxygen metabolic process(GO:2000374) |
| 0.7 | 2.2 | GO:0042450 | arginine biosynthetic process via ornithine(GO:0042450) |
| 0.7 | 2.1 | GO:0019858 | cytosine metabolic process(GO:0019858) |
| 0.7 | 2.0 | GO:0070602 | regulation of centromeric sister chromatid cohesion(GO:0070602) |
| 0.6 | 1.8 | GO:0035610 | protein side chain deglutamylation(GO:0035610) |
| 0.6 | 1.2 | GO:1902512 | positive regulation of apoptotic DNA fragmentation(GO:1902512) |
| 0.6 | 5.3 | GO:0030091 | protein repair(GO:0030091) |
| 0.5 | 0.5 | GO:0036466 | synaptic vesicle recycling via endosome(GO:0036466) |
| 0.5 | 11.4 | GO:0070493 | thrombin receptor signaling pathway(GO:0070493) |
| 0.5 | 2.0 | GO:0014054 | positive regulation of gamma-aminobutyric acid secretion(GO:0014054) |
| 0.5 | 1.9 | GO:1902075 | cellular response to salt(GO:1902075) |
| 0.5 | 3.9 | GO:1903690 | negative regulation of wound healing, spreading of epidermal cells(GO:1903690) |
| 0.5 | 2.9 | GO:0016554 | cytidine to uridine editing(GO:0016554) |
| 0.5 | 1.9 | GO:0061030 | epithelial cell differentiation involved in mammary gland alveolus development(GO:0061030) |
| 0.5 | 1.4 | GO:0044537 | regulation of circulating fibrinogen levels(GO:0044537) |
| 0.4 | 1.3 | GO:2000687 | negative regulation of rubidium ion transport(GO:2000681) negative regulation of rubidium ion transmembrane transporter activity(GO:2000687) |
| 0.4 | 4.6 | GO:0032876 | negative regulation of DNA endoreduplication(GO:0032876) |
| 0.4 | 1.2 | GO:0006669 | sphinganine-1-phosphate biosynthetic process(GO:0006669) |
| 0.4 | 1.2 | GO:1902995 | regulation of phospholipid efflux(GO:1902994) positive regulation of phospholipid efflux(GO:1902995) |
| 0.4 | 4.0 | GO:0045647 | negative regulation of erythrocyte differentiation(GO:0045647) |
| 0.4 | 1.2 | GO:0031938 | pre-replicative complex assembly involved in nuclear cell cycle DNA replication(GO:0006267) regulation of chromatin silencing at telomere(GO:0031938) pre-replicative complex assembly(GO:0036388) pre-replicative complex assembly involved in cell cycle DNA replication(GO:1902299) |
| 0.3 | 1.3 | GO:0046101 | hypoxanthine metabolic process(GO:0046100) hypoxanthine biosynthetic process(GO:0046101) |
| 0.3 | 0.9 | GO:0008050 | female courtship behavior(GO:0008050) positive regulation of female receptivity(GO:0045925) |
| 0.3 | 0.3 | GO:0006543 | glutamine catabolic process(GO:0006543) |
| 0.3 | 2.1 | GO:0098989 | NMDA selective glutamate receptor signaling pathway(GO:0098989) |
| 0.3 | 0.3 | GO:0002514 | B cell tolerance induction(GO:0002514) regulation of B cell tolerance induction(GO:0002661) positive regulation of B cell tolerance induction(GO:0002663) |
| 0.3 | 0.9 | GO:2000523 | dendritic cell dendrite assembly(GO:0097026) regulation of T cell costimulation(GO:2000523) positive regulation of T cell costimulation(GO:2000525) regulation of dendritic cell dendrite assembly(GO:2000547) |
| 0.3 | 1.1 | GO:0060024 | rhythmic synaptic transmission(GO:0060024) |
| 0.3 | 1.1 | GO:0061743 | motor learning(GO:0061743) |
| 0.3 | 1.7 | GO:1904431 | positive regulation of t-circle formation(GO:1904431) |
| 0.3 | 1.9 | GO:0006537 | glutamate biosynthetic process(GO:0006537) |
| 0.3 | 1.1 | GO:0070317 | negative regulation of G0 to G1 transition(GO:0070317) |
| 0.2 | 0.7 | GO:0090149 | mitochondrial membrane fission(GO:0090149) |
| 0.2 | 1.5 | GO:0032483 | regulation of Rab protein signal transduction(GO:0032483) |
| 0.2 | 1.0 | GO:0044571 | [2Fe-2S] cluster assembly(GO:0044571) |
| 0.2 | 1.9 | GO:0044351 | macropinocytosis(GO:0044351) |
| 0.2 | 2.4 | GO:0015939 | pantothenate metabolic process(GO:0015939) |
| 0.2 | 2.4 | GO:0035434 | copper ion transmembrane transport(GO:0035434) |
| 0.2 | 0.9 | GO:0015808 | L-alanine transport(GO:0015808) |
| 0.2 | 1.6 | GO:0045079 | negative regulation of chemokine biosynthetic process(GO:0045079) |
| 0.2 | 2.3 | GO:1904415 | regulation of xenophagy(GO:1904415) positive regulation of xenophagy(GO:1904417) |
| 0.2 | 1.8 | GO:0017185 | peptidyl-lysine hydroxylation(GO:0017185) |
| 0.2 | 0.7 | GO:0016260 | selenocysteine biosynthetic process(GO:0016260) |
| 0.2 | 1.1 | GO:0042256 | mature ribosome assembly(GO:0042256) |
| 0.2 | 1.5 | GO:0021999 | neural plate anterior/posterior regionalization(GO:0021999) |
| 0.2 | 2.2 | GO:2001135 | regulation of endocytic recycling(GO:2001135) |
| 0.2 | 0.9 | GO:0071894 | histone H2B conserved C-terminal lysine ubiquitination(GO:0071894) |
| 0.2 | 1.7 | GO:0072718 | response to cisplatin(GO:0072718) |
| 0.2 | 0.4 | GO:0044828 | negative regulation by host of viral genome replication(GO:0044828) |
| 0.2 | 1.1 | GO:0032747 | positive regulation of interleukin-23 production(GO:0032747) |
| 0.2 | 1.9 | GO:0042756 | drinking behavior(GO:0042756) |
| 0.2 | 0.6 | GO:1905224 | clathrin-coated pit assembly(GO:1905224) |
| 0.2 | 0.9 | GO:0098532 | histone H3-K27 trimethylation(GO:0098532) |
| 0.2 | 0.9 | GO:0015891 | iron chelate transport(GO:0015688) siderophore transport(GO:0015891) |
| 0.2 | 0.5 | GO:0006478 | peptidyl-tyrosine sulfation(GO:0006478) |
| 0.2 | 4.7 | GO:0007035 | vacuolar acidification(GO:0007035) |
| 0.2 | 1.6 | GO:0061179 | negative regulation of insulin secretion involved in cellular response to glucose stimulus(GO:0061179) |
| 0.2 | 2.9 | GO:0038092 | nodal signaling pathway(GO:0038092) |
| 0.2 | 2.8 | GO:0045199 | maintenance of apical/basal cell polarity(GO:0035090) maintenance of epithelial cell apical/basal polarity(GO:0045199) |
| 0.2 | 0.5 | GO:0090611 | mitotic cytokinesis checkpoint(GO:0044878) ubiquitin-independent protein catabolic process via the multivesicular body sorting pathway(GO:0090611) |
| 0.2 | 0.8 | GO:0038169 | somatostatin receptor signaling pathway(GO:0038169) somatostatin signaling pathway(GO:0038170) |
| 0.1 | 4.6 | GO:0003299 | muscle hypertrophy in response to stress(GO:0003299) cardiac muscle adaptation(GO:0014887) cardiac muscle hypertrophy in response to stress(GO:0014898) |
| 0.1 | 0.6 | GO:0061762 | CAMKK-AMPK signaling cascade(GO:0061762) |
| 0.1 | 2.0 | GO:1904714 | regulation of chaperone-mediated autophagy(GO:1904714) |
| 0.1 | 0.6 | GO:1903347 | negative regulation of bicellular tight junction assembly(GO:1903347) |
| 0.1 | 2.3 | GO:0000338 | protein deneddylation(GO:0000338) |
| 0.1 | 1.3 | GO:0050713 | negative regulation of interleukin-1 beta secretion(GO:0050713) |
| 0.1 | 2.6 | GO:0002021 | response to dietary excess(GO:0002021) |
| 0.1 | 0.5 | GO:0008063 | Toll signaling pathway(GO:0008063) |
| 0.1 | 0.5 | GO:0009212 | dTTP biosynthetic process(GO:0006235) pyrimidine deoxyribonucleoside triphosphate biosynthetic process(GO:0009212) |
| 0.1 | 0.7 | GO:0006436 | tryptophanyl-tRNA aminoacylation(GO:0006436) |
| 0.1 | 0.4 | GO:0000967 | endonucleolytic cleavage to generate mature 5'-end of SSU-rRNA from (SSU-rRNA, 5.8S rRNA, LSU-rRNA)(GO:0000472) rRNA 5'-end processing(GO:0000967) ncRNA 5'-end processing(GO:0034471) |
| 0.1 | 0.9 | GO:0002175 | protein localization to paranode region of axon(GO:0002175) |
| 0.1 | 0.4 | GO:0021722 | superior olivary nucleus development(GO:0021718) superior olivary nucleus maturation(GO:0021722) |
| 0.1 | 0.9 | GO:0006102 | isocitrate metabolic process(GO:0006102) |
| 0.1 | 2.3 | GO:0043306 | positive regulation of mast cell activation involved in immune response(GO:0033008) positive regulation of mast cell degranulation(GO:0043306) |
| 0.1 | 0.5 | GO:0002572 | pro-T cell differentiation(GO:0002572) |
| 0.1 | 0.8 | GO:0021847 | ventricular zone neuroblast division(GO:0021847) |
| 0.1 | 2.0 | GO:0060044 | negative regulation of cardiac muscle cell proliferation(GO:0060044) |
| 0.1 | 0.9 | GO:0006528 | asparagine metabolic process(GO:0006528) |
| 0.1 | 1.9 | GO:2000480 | negative regulation of cAMP-dependent protein kinase activity(GO:2000480) |
| 0.1 | 0.5 | GO:0030822 | positive regulation of cyclic nucleotide catabolic process(GO:0030807) positive regulation of cAMP catabolic process(GO:0030822) positive regulation of purine nucleotide catabolic process(GO:0033123) |
| 0.1 | 1.4 | GO:0021942 | radial glia guided migration of Purkinje cell(GO:0021942) |
| 0.1 | 0.9 | GO:0038003 | opioid receptor signaling pathway(GO:0038003) |
| 0.1 | 1.5 | GO:0071257 | cellular response to electrical stimulus(GO:0071257) |
| 0.1 | 1.0 | GO:0060453 | regulation of gastric acid secretion(GO:0060453) |
| 0.1 | 0.8 | GO:0048733 | sebaceous gland development(GO:0048733) |
| 0.1 | 1.7 | GO:0090129 | positive regulation of synapse maturation(GO:0090129) |
| 0.1 | 0.9 | GO:0032776 | DNA methylation on cytosine(GO:0032776) |
| 0.1 | 0.3 | GO:0002296 | T-helper 1 cell lineage commitment(GO:0002296) |
| 0.1 | 0.3 | GO:1903348 | positive regulation of bicellular tight junction assembly(GO:1903348) |
| 0.1 | 0.4 | GO:0018364 | peptidyl-glutamine methylation(GO:0018364) |
| 0.1 | 3.7 | GO:0006536 | glutamate metabolic process(GO:0006536) |
| 0.1 | 0.8 | GO:0006384 | transcription initiation from RNA polymerase III promoter(GO:0006384) |
| 0.1 | 0.5 | GO:0033489 | cholesterol biosynthetic process via desmosterol(GO:0033489) cholesterol biosynthetic process via lathosterol(GO:0033490) |
| 0.1 | 0.4 | GO:0021784 | postganglionic parasympathetic fiber development(GO:0021784) |
| 0.1 | 1.2 | GO:0007191 | adenylate cyclase-activating dopamine receptor signaling pathway(GO:0007191) |
| 0.1 | 3.5 | GO:0007194 | negative regulation of adenylate cyclase activity(GO:0007194) |
| 0.1 | 0.3 | GO:1990086 | lens fiber cell apoptotic process(GO:1990086) |
| 0.1 | 0.6 | GO:0021853 | cerebral cortex GABAergic interneuron migration(GO:0021853) interneuron migration(GO:1904936) |
| 0.1 | 1.8 | GO:0022401 | desensitization of G-protein coupled receptor protein signaling pathway(GO:0002029) negative adaptation of signaling pathway(GO:0022401) |
| 0.1 | 0.7 | GO:0097033 | respiratory chain complex III assembly(GO:0017062) mitochondrial respiratory chain complex III assembly(GO:0034551) mitochondrial respiratory chain complex III biogenesis(GO:0097033) |
| 0.1 | 0.3 | GO:0007089 | traversing start control point of mitotic cell cycle(GO:0007089) |
| 0.1 | 2.3 | GO:0071294 | cellular response to zinc ion(GO:0071294) |
| 0.1 | 2.8 | GO:0042347 | negative regulation of NF-kappaB import into nucleus(GO:0042347) |
| 0.1 | 0.3 | GO:0060830 | ciliary receptor clustering involved in smoothened signaling pathway(GO:0060830) |
| 0.1 | 0.8 | GO:0032494 | response to peptidoglycan(GO:0032494) |
| 0.1 | 0.5 | GO:0006789 | bilirubin conjugation(GO:0006789) |
| 0.1 | 0.2 | GO:1901355 | response to rapamycin(GO:1901355) |
| 0.1 | 1.8 | GO:0034755 | iron ion transmembrane transport(GO:0034755) |
| 0.1 | 1.1 | GO:0030183 | B cell differentiation(GO:0030183) |
| 0.1 | 1.7 | GO:0002089 | lens morphogenesis in camera-type eye(GO:0002089) |
| 0.1 | 2.0 | GO:0048934 | peripheral nervous system neuron differentiation(GO:0048934) peripheral nervous system neuron development(GO:0048935) |
| 0.1 | 0.5 | GO:0060174 | limb bud formation(GO:0060174) |
| 0.1 | 0.5 | GO:1901223 | negative regulation of NIK/NF-kappaB signaling(GO:1901223) |
| 0.1 | 0.9 | GO:0046051 | UTP biosynthetic process(GO:0006228) UTP metabolic process(GO:0046051) |
| 0.1 | 0.3 | GO:0001927 | exocyst assembly(GO:0001927) |
| 0.1 | 1.7 | GO:0048268 | clathrin coat assembly(GO:0048268) |
| 0.1 | 0.5 | GO:0018401 | peptidyl-proline hydroxylation to 4-hydroxy-L-proline(GO:0018401) |
| 0.1 | 0.2 | GO:0021913 | glandular epithelial cell maturation(GO:0002071) regulation of transcription from RNA polymerase II promoter involved in ventral spinal cord interneuron specification(GO:0021913) type B pancreatic cell maturation(GO:0072560) |
| 0.1 | 0.5 | GO:0070995 | NADPH oxidation(GO:0070995) |
| 0.1 | 0.4 | GO:0052405 | negative regulation by host of symbiont molecular function(GO:0052405) |
| 0.1 | 0.9 | GO:0006002 | fructose 6-phosphate metabolic process(GO:0006002) |
| 0.1 | 3.9 | GO:0007602 | phototransduction(GO:0007602) |
| 0.1 | 0.9 | GO:1901642 | nucleoside transmembrane transport(GO:1901642) |
| 0.1 | 0.6 | GO:0007144 | female meiosis I(GO:0007144) |
| 0.1 | 0.8 | GO:0015812 | gamma-aminobutyric acid transport(GO:0015812) |
| 0.1 | 0.5 | GO:0035385 | Roundabout signaling pathway(GO:0035385) |
| 0.1 | 0.5 | GO:0072520 | seminiferous tubule development(GO:0072520) |
| 0.0 | 1.1 | GO:0006293 | nucleotide-excision repair, preincision complex stabilization(GO:0006293) nucleotide-excision repair, DNA incision, 3'-to lesion(GO:0006295) |
| 0.0 | 2.5 | GO:0043486 | histone exchange(GO:0043486) |
| 0.0 | 0.9 | GO:0007021 | tubulin complex assembly(GO:0007021) |
| 0.0 | 1.8 | GO:0090200 | positive regulation of release of cytochrome c from mitochondria(GO:0090200) |
| 0.0 | 0.2 | GO:0009957 | epidermal cell fate specification(GO:0009957) |
| 0.0 | 1.1 | GO:0034389 | lipid particle organization(GO:0034389) |
| 0.0 | 1.0 | GO:0090023 | positive regulation of neutrophil chemotaxis(GO:0090023) |
| 0.0 | 0.2 | GO:1903588 | negative regulation of blood vessel endothelial cell proliferation involved in sprouting angiogenesis(GO:1903588) |
| 0.0 | 0.2 | GO:0070305 | response to cGMP(GO:0070305) cellular response to cGMP(GO:0071321) |
| 0.0 | 0.3 | GO:0016024 | CDP-diacylglycerol biosynthetic process(GO:0016024) |
| 0.0 | 1.7 | GO:0071377 | cellular response to glucagon stimulus(GO:0071377) |
| 0.0 | 1.2 | GO:0031643 | positive regulation of myelination(GO:0031643) |
| 0.0 | 0.9 | GO:0043011 | myeloid dendritic cell differentiation(GO:0043011) |
| 0.0 | 0.3 | GO:0016080 | synaptic vesicle targeting(GO:0016080) |
| 0.0 | 1.6 | GO:0006699 | bile acid biosynthetic process(GO:0006699) |
| 0.0 | 0.6 | GO:0034497 | protein localization to pre-autophagosomal structure(GO:0034497) |
| 0.0 | 0.5 | GO:0070327 | thyroid hormone transport(GO:0070327) |
| 0.0 | 0.2 | GO:0006382 | adenosine to inosine editing(GO:0006382) |
| 0.0 | 0.4 | GO:1990403 | embryonic brain development(GO:1990403) |
| 0.0 | 0.1 | GO:0018076 | N-terminal peptidyl-lysine acetylation(GO:0018076) |
| 0.0 | 0.3 | GO:0051444 | negative regulation of ubiquitin-protein transferase activity(GO:0051444) |
| 0.0 | 0.1 | GO:0051835 | positive regulation of synapse structural plasticity(GO:0051835) |
| 0.0 | 0.0 | GO:0031291 | Ran protein signal transduction(GO:0031291) |
| 0.0 | 0.3 | GO:0086046 | membrane depolarization during SA node cell action potential(GO:0086046) |
| 0.0 | 0.4 | GO:0007320 | insemination(GO:0007320) |
| 0.0 | 2.2 | GO:0021762 | substantia nigra development(GO:0021762) |
| 0.0 | 0.1 | GO:0048073 | regulation of eye pigmentation(GO:0048073) |
| 0.0 | 1.1 | GO:0032008 | positive regulation of TOR signaling(GO:0032008) |
| 0.0 | 1.3 | GO:0000188 | inactivation of MAPK activity(GO:0000188) |
| 0.0 | 1.2 | GO:0010738 | regulation of protein kinase A signaling(GO:0010738) |
| 0.0 | 0.2 | GO:0035461 | vitamin transmembrane transport(GO:0035461) |
| 0.0 | 3.0 | GO:0031146 | SCF-dependent proteasomal ubiquitin-dependent protein catabolic process(GO:0031146) |
| 0.0 | 0.4 | GO:0034356 | NAD biosynthesis via nicotinamide riboside salvage pathway(GO:0034356) |
| 0.0 | 0.1 | GO:0000965 | mitochondrial RNA 3'-end processing(GO:0000965) |
| 0.0 | 0.4 | GO:0006705 | mineralocorticoid biosynthetic process(GO:0006705) mineralocorticoid metabolic process(GO:0008212) |
| 0.0 | 0.1 | GO:0072364 | regulation of cellular ketone metabolic process by regulation of transcription from RNA polymerase II promoter(GO:0072364) |
| 0.0 | 0.1 | GO:0061046 | foregut regionalization(GO:0060423) lung field specification(GO:0060424) lung induction(GO:0060492) regulation of branching involved in lung morphogenesis(GO:0061046) positive regulation of branching involved in lung morphogenesis(GO:0061047) |
| 0.0 | 0.5 | GO:0007614 | short-term memory(GO:0007614) |
| 0.0 | 0.2 | GO:0019375 | galactosylceramide biosynthetic process(GO:0006682) galactolipid biosynthetic process(GO:0019375) |
| 0.0 | 1.3 | GO:0006879 | cellular iron ion homeostasis(GO:0006879) |
| 0.0 | 0.1 | GO:0060120 | auditory receptor cell fate commitment(GO:0009912) inner ear receptor cell fate commitment(GO:0060120) |
| 0.0 | 0.7 | GO:0016578 | histone deubiquitination(GO:0016578) |
| 0.0 | 1.5 | GO:0010507 | negative regulation of autophagy(GO:0010507) |
| 0.0 | 1.8 | GO:0071277 | cellular response to calcium ion(GO:0071277) |
| 0.0 | 0.2 | GO:0046465 | dolichyl diphosphate biosynthetic process(GO:0006489) dolichyl diphosphate metabolic process(GO:0046465) |
| 0.0 | 0.6 | GO:0035116 | embryonic hindlimb morphogenesis(GO:0035116) |
| 0.0 | 1.4 | GO:0035722 | interleukin-12-mediated signaling pathway(GO:0035722) cellular response to interleukin-12(GO:0071349) |
| 0.0 | 0.1 | GO:0021539 | subthalamus development(GO:0021539) |
| 0.0 | 0.1 | GO:0031548 | regulation of brain-derived neurotrophic factor receptor signaling pathway(GO:0031548) |
| 0.0 | 0.1 | GO:1901409 | positive regulation of phosphorylation of RNA polymerase II C-terminal domain(GO:1901409) |
| 0.0 | 0.4 | GO:0001964 | startle response(GO:0001964) |
| 0.0 | 1.1 | GO:0006378 | mRNA polyadenylation(GO:0006378) |
| 0.0 | 0.3 | GO:0006610 | ribosomal protein import into nucleus(GO:0006610) |
| 0.0 | 0.3 | GO:0090083 | regulation of inclusion body assembly(GO:0090083) |
| 0.0 | 0.7 | GO:0010165 | response to X-ray(GO:0010165) |
| 0.0 | 0.1 | GO:0030860 | regulation of polarized epithelial cell differentiation(GO:0030860) |
| 0.0 | 0.5 | GO:0050855 | regulation of B cell receptor signaling pathway(GO:0050855) |
| 0.0 | 0.6 | GO:0043252 | sodium-independent organic anion transport(GO:0043252) |
| 0.0 | 0.1 | GO:0019262 | N-acetylneuraminate catabolic process(GO:0019262) |
| 0.0 | 0.0 | GO:0036480 | neuron intrinsic apoptotic signaling pathway in response to oxidative stress(GO:0036480) regulation of oxidative stress-induced neuron intrinsic apoptotic signaling pathway(GO:1903376) |
| 0.0 | 0.1 | GO:0071105 | response to interleukin-11(GO:0071105) |
| 0.0 | 0.0 | GO:0045715 | negative regulation of low-density lipoprotein particle receptor biosynthetic process(GO:0045715) |
| 0.0 | 2.6 | GO:0042787 | protein ubiquitination involved in ubiquitin-dependent protein catabolic process(GO:0042787) |
| 0.0 | 0.1 | GO:0019368 | fatty acid elongation, saturated fatty acid(GO:0019367) fatty acid elongation, unsaturated fatty acid(GO:0019368) fatty acid elongation, monounsaturated fatty acid(GO:0034625) fatty acid elongation, polyunsaturated fatty acid(GO:0034626) |
| 0.0 | 0.1 | GO:2000628 | regulation of miRNA metabolic process(GO:2000628) |
| 0.0 | 3.2 | GO:0070588 | calcium ion transmembrane transport(GO:0070588) |
| 0.0 | 0.4 | GO:0071480 | cellular response to gamma radiation(GO:0071480) |
| 0.0 | 0.6 | GO:0050911 | detection of chemical stimulus involved in sensory perception of smell(GO:0050911) |
| 0.0 | 0.2 | GO:0030277 | maintenance of gastrointestinal epithelium(GO:0030277) |
| 0.0 | 0.2 | GO:0010248 | establishment or maintenance of transmembrane electrochemical gradient(GO:0010248) |
| 0.0 | 0.1 | GO:0060605 | tube lumen cavitation(GO:0060605) salivary gland cavitation(GO:0060662) |
| 0.0 | 0.2 | GO:1904355 | positive regulation of telomere capping(GO:1904355) |
| 0.0 | 0.3 | GO:0043001 | Golgi to plasma membrane protein transport(GO:0043001) |
| 0.0 | 1.4 | GO:0019886 | antigen processing and presentation of exogenous peptide antigen via MHC class II(GO:0019886) |
| 0.0 | 0.2 | GO:0035235 | ionotropic glutamate receptor signaling pathway(GO:0035235) |
| 0.0 | 0.4 | GO:0000075 | cell cycle checkpoint(GO:0000075) |
| 0.0 | 0.0 | GO:2000824 | negative regulation of androgen receptor activity(GO:2000824) |
Gene overrepresentation in cellular_component category:
| Log-likelihood per target | Total log-likelihood | Term | Description |
|---|---|---|---|
| 1.2 | 3.6 | GO:0038039 | G-protein coupled receptor heterodimeric complex(GO:0038039) |
| 0.5 | 2.8 | GO:0098560 | cytoplasmic side of late endosome membrane(GO:0098560) |
| 0.4 | 1.2 | GO:0034365 | discoidal high-density lipoprotein particle(GO:0034365) |
| 0.4 | 1.2 | GO:0036387 | nuclear pre-replicative complex(GO:0005656) pre-replicative complex(GO:0036387) |
| 0.4 | 3.9 | GO:0045180 | basal cortex(GO:0045180) |
| 0.4 | 1.8 | GO:0071986 | Ragulator complex(GO:0071986) |
| 0.3 | 1.3 | GO:0002189 | ribose phosphate diphosphokinase complex(GO:0002189) |
| 0.3 | 4.7 | GO:0033179 | proton-transporting V-type ATPase, V0 domain(GO:0033179) |
| 0.3 | 2.0 | GO:0098574 | cytoplasmic side of lysosomal membrane(GO:0098574) |
| 0.3 | 5.2 | GO:0043020 | NADPH oxidase complex(GO:0043020) |
| 0.3 | 3.1 | GO:0005641 | nuclear envelope lumen(GO:0005641) |
| 0.3 | 2.5 | GO:0097425 | smooth endoplasmic reticulum membrane(GO:0030868) smooth endoplasmic reticulum part(GO:0097425) |
| 0.2 | 2.3 | GO:0097449 | astrocyte projection(GO:0097449) |
| 0.2 | 2.3 | GO:0030123 | AP-3 adaptor complex(GO:0030123) |
| 0.2 | 0.9 | GO:0005945 | 6-phosphofructokinase complex(GO:0005945) |
| 0.2 | 1.9 | GO:0044327 | dendritic spine head(GO:0044327) |
| 0.2 | 8.3 | GO:0031941 | filamentous actin(GO:0031941) |
| 0.2 | 0.5 | GO:0034991 | nuclear meiotic cohesin complex(GO:0034991) |
| 0.1 | 1.5 | GO:0033391 | chromatoid body(GO:0033391) |
| 0.1 | 0.7 | GO:0070826 | paraferritin complex(GO:0070826) |
| 0.1 | 3.4 | GO:0005852 | eukaryotic translation initiation factor 3 complex(GO:0005852) |
| 0.1 | 0.4 | GO:0030689 | Noc complex(GO:0030689) |
| 0.1 | 7.1 | GO:0031904 | endosome lumen(GO:0031904) |
| 0.1 | 0.5 | GO:1990031 | pinceau fiber(GO:1990031) |
| 0.1 | 0.9 | GO:0036157 | outer dynein arm(GO:0036157) |
| 0.1 | 1.3 | GO:0072559 | NLRP3 inflammasome complex(GO:0072559) |
| 0.1 | 0.5 | GO:0071008 | U2-type post-mRNA release spliceosomal complex(GO:0071008) |
| 0.1 | 0.4 | GO:0016533 | cyclin-dependent protein kinase 5 holoenzyme complex(GO:0016533) |
| 0.1 | 1.4 | GO:0005869 | dynactin complex(GO:0005869) |
| 0.1 | 1.9 | GO:0035098 | ESC/E(Z) complex(GO:0035098) |
| 0.1 | 1.9 | GO:0005952 | cAMP-dependent protein kinase complex(GO:0005952) |
| 0.1 | 0.3 | GO:0035189 | Rb-E2F complex(GO:0035189) |
| 0.1 | 1.3 | GO:0044754 | autolysosome(GO:0044754) |
| 0.1 | 1.1 | GO:0043083 | synaptic cleft(GO:0043083) |
| 0.1 | 1.0 | GO:0097025 | MPP7-DLG1-LIN7 complex(GO:0097025) |
| 0.1 | 1.8 | GO:0014731 | spectrin-associated cytoskeleton(GO:0014731) |
| 0.1 | 0.8 | GO:0033162 | melanosome membrane(GO:0033162) chitosome(GO:0045009) |
| 0.1 | 0.5 | GO:0031252 | cell leading edge(GO:0031252) |
| 0.1 | 2.3 | GO:0016581 | NuRD complex(GO:0016581) CHD-type complex(GO:0090545) |
| 0.1 | 2.4 | GO:0005838 | proteasome regulatory particle(GO:0005838) |
| 0.1 | 1.5 | GO:0016281 | eukaryotic translation initiation factor 4F complex(GO:0016281) |
| 0.1 | 2.1 | GO:0031143 | pseudopodium(GO:0031143) |
| 0.1 | 6.7 | GO:0035580 | specific granule lumen(GO:0035580) |
| 0.1 | 0.9 | GO:0030285 | integral component of synaptic vesicle membrane(GO:0030285) intrinsic component of synaptic vesicle membrane(GO:0098563) |
| 0.1 | 3.6 | GO:0031463 | Cul3-RING ubiquitin ligase complex(GO:0031463) |
| 0.0 | 0.5 | GO:0035631 | CD40 receptor complex(GO:0035631) |
| 0.0 | 0.5 | GO:0000118 | histone deacetylase complex(GO:0000118) |
| 0.0 | 0.6 | GO:0030877 | beta-catenin destruction complex(GO:0030877) |
| 0.0 | 4.1 | GO:0032580 | Golgi cisterna membrane(GO:0032580) |
| 0.0 | 0.7 | GO:0000124 | SAGA complex(GO:0000124) |
| 0.0 | 0.9 | GO:0097440 | apical dendrite(GO:0097440) |
| 0.0 | 2.2 | GO:0005834 | heterotrimeric G-protein complex(GO:0005834) |
| 0.0 | 0.5 | GO:0005583 | fibrillar collagen trimer(GO:0005583) banded collagen fibril(GO:0098643) |
| 0.0 | 0.2 | GO:0005889 | hydrogen:potassium-exchanging ATPase complex(GO:0005889) |
| 0.0 | 3.6 | GO:0005758 | mitochondrial intermembrane space(GO:0005758) organelle envelope lumen(GO:0031970) |
| 0.0 | 0.2 | GO:0070876 | SOSS complex(GO:0070876) |
| 0.0 | 4.3 | GO:0031234 | extrinsic component of cytoplasmic side of plasma membrane(GO:0031234) |
| 0.0 | 0.5 | GO:0000815 | ESCRT III complex(GO:0000815) |
| 0.0 | 1.1 | GO:0000159 | protein phosphatase type 2A complex(GO:0000159) |
| 0.0 | 0.9 | GO:0005905 | clathrin-coated pit(GO:0005905) |
| 0.0 | 2.5 | GO:0099501 | synaptic vesicle membrane(GO:0030672) exocytic vesicle membrane(GO:0099501) |
| 0.0 | 1.3 | GO:0045095 | keratin filament(GO:0045095) |
| 0.0 | 1.0 | GO:0005680 | anaphase-promoting complex(GO:0005680) |
| 0.0 | 1.2 | GO:0005813 | centrosome(GO:0005813) |
| 0.0 | 0.2 | GO:0031931 | TORC1 complex(GO:0031931) |
| 0.0 | 0.2 | GO:0005672 | transcription factor TFIIA complex(GO:0005672) |
| 0.0 | 1.5 | GO:0000786 | nucleosome(GO:0000786) |
| 0.0 | 1.4 | GO:0005891 | voltage-gated calcium channel complex(GO:0005891) |
| 0.0 | 12.1 | GO:0005759 | mitochondrial matrix(GO:0005759) |
| 0.0 | 4.4 | GO:0000775 | chromosome, centromeric region(GO:0000775) |
| 0.0 | 0.4 | GO:0070971 | endoplasmic reticulum exit site(GO:0070971) |
| 0.0 | 0.3 | GO:0098589 | membrane region(GO:0098589) |
| 0.0 | 0.3 | GO:0034663 | endoplasmic reticulum chaperone complex(GO:0034663) |
| 0.0 | 1.0 | GO:0008021 | synaptic vesicle(GO:0008021) |
| 0.0 | 0.3 | GO:0000145 | exocyst(GO:0000145) |
| 0.0 | 4.0 | GO:0014069 | postsynaptic density(GO:0014069) postsynaptic specialization(GO:0099572) |
| 0.0 | 1.7 | GO:0032587 | ruffle membrane(GO:0032587) |
| 0.0 | 0.3 | GO:0031092 | platelet alpha granule membrane(GO:0031092) |
| 0.0 | 1.0 | GO:0005882 | intermediate filament(GO:0005882) |
| 0.0 | 2.9 | GO:0005770 | late endosome(GO:0005770) |
| 0.0 | 2.5 | GO:0005741 | mitochondrial outer membrane(GO:0005741) |
| 0.0 | 0.5 | GO:0016592 | mediator complex(GO:0016592) |
| 0.0 | 0.1 | GO:0089717 | spanning component of plasma membrane(GO:0044214) spanning component of membrane(GO:0089717) |
| 0.0 | 1.9 | GO:0031225 | anchored component of membrane(GO:0031225) |
| 0.0 | 0.2 | GO:0008328 | ionotropic glutamate receptor complex(GO:0008328) neurotransmitter receptor complex(GO:0098878) |
| 0.0 | 1.2 | GO:0035579 | specific granule membrane(GO:0035579) |
| 0.0 | 1.2 | GO:0043204 | perikaryon(GO:0043204) |
| 0.0 | 0.5 | GO:0019005 | SCF ubiquitin ligase complex(GO:0019005) |
| 0.0 | 2.3 | GO:0016323 | basolateral plasma membrane(GO:0016323) |
| 0.0 | 0.3 | GO:0042629 | mast cell granule(GO:0042629) |
| 0.0 | 0.3 | GO:0032391 | photoreceptor connecting cilium(GO:0032391) |
Gene overrepresentation in molecular_function category:
| Log-likelihood per target | Total log-likelihood | Term | Description |
|---|---|---|---|
| 1.4 | 11.4 | GO:0071933 | Arp2/3 complex binding(GO:0071933) |
| 1.4 | 4.2 | GO:0004719 | protein-L-isoaspartate (D-aspartate) O-methyltransferase activity(GO:0004719) |
| 1.3 | 3.9 | GO:0016603 | glutaminyl-peptide cyclotransferase activity(GO:0016603) |
| 1.2 | 3.6 | GO:0004965 | G-protein coupled GABA receptor activity(GO:0004965) |
| 1.0 | 4.0 | GO:0004427 | inorganic diphosphatase activity(GO:0004427) |
| 0.9 | 6.5 | GO:0043533 | inositol 1,3,4,5 tetrakisphosphate binding(GO:0043533) |
| 0.7 | 3.7 | GO:0047820 | D-glutamate cyclase activity(GO:0047820) |
| 0.6 | 2.4 | GO:0004594 | pantothenate kinase activity(GO:0004594) |
| 0.6 | 1.7 | GO:0017108 | 5'-flap endonuclease activity(GO:0017108) |
| 0.6 | 2.8 | GO:0070404 | NADH binding(GO:0070404) |
| 0.5 | 1.9 | GO:0016639 | oxidoreductase activity, acting on the CH-NH2 group of donors, NAD or NADP as acceptor(GO:0016639) |
| 0.5 | 1.5 | GO:0008330 | protein tyrosine/threonine phosphatase activity(GO:0008330) |
| 0.5 | 2.9 | GO:0015185 | gamma-aminobutyric acid:sodium symporter activity(GO:0005332) gamma-aminobutyric acid transmembrane transporter activity(GO:0015185) |
| 0.4 | 3.9 | GO:0008526 | phosphatidylinositol transporter activity(GO:0008526) |
| 0.4 | 2.5 | GO:0072320 | volume-sensitive chloride channel activity(GO:0072320) |
| 0.4 | 1.3 | GO:0032089 | NACHT domain binding(GO:0032089) |
| 0.4 | 2.9 | GO:0001727 | lipid kinase activity(GO:0001727) |
| 0.4 | 1.2 | GO:0070326 | very-low-density lipoprotein particle receptor binding(GO:0070326) |
| 0.3 | 2.1 | GO:0047685 | amine sulfotransferase activity(GO:0047685) |
| 0.3 | 2.3 | GO:0046870 | cadmium ion binding(GO:0046870) |
| 0.3 | 7.1 | GO:0034236 | protein kinase A catalytic subunit binding(GO:0034236) |
| 0.3 | 2.2 | GO:0016842 | amidine-lyase activity(GO:0016842) |
| 0.3 | 5.2 | GO:0016175 | superoxide-generating NADPH oxidase activity(GO:0016175) |
| 0.3 | 1.0 | GO:0033743 | peptide-methionine (R)-S-oxide reductase activity(GO:0033743) |
| 0.2 | 2.4 | GO:0005375 | copper ion transmembrane transporter activity(GO:0005375) |
| 0.2 | 0.9 | GO:0015180 | L-alanine transmembrane transporter activity(GO:0015180) alanine transmembrane transporter activity(GO:0022858) |
| 0.2 | 0.9 | GO:0061628 | H3K27me3 modified histone binding(GO:0061628) |
| 0.2 | 1.6 | GO:0017077 | oxidative phosphorylation uncoupler activity(GO:0017077) |
| 0.2 | 0.7 | GO:0004967 | glucagon receptor activity(GO:0004967) |
| 0.2 | 2.3 | GO:0019784 | NEDD8-specific protease activity(GO:0019784) |
| 0.2 | 1.3 | GO:0004749 | ribose phosphate diphosphokinase activity(GO:0004749) |
| 0.2 | 0.7 | GO:0016781 | selenide, water dikinase activity(GO:0004756) phosphotransferase activity, paired acceptors(GO:0016781) |
| 0.2 | 0.9 | GO:0004449 | isocitrate dehydrogenase (NAD+) activity(GO:0004449) |
| 0.2 | 3.1 | GO:0030306 | ADP-ribosylation factor binding(GO:0030306) |
| 0.2 | 0.5 | GO:0008476 | protein-tyrosine sulfotransferase activity(GO:0008476) |
| 0.2 | 0.9 | GO:0070095 | fructose-6-phosphate binding(GO:0070095) |
| 0.2 | 4.7 | GO:0046961 | proton-transporting ATPase activity, rotational mechanism(GO:0046961) |
| 0.2 | 3.9 | GO:0002162 | dystroglycan binding(GO:0002162) |
| 0.2 | 0.8 | GO:0004994 | somatostatin receptor activity(GO:0004994) |
| 0.1 | 1.9 | GO:0042608 | T cell receptor binding(GO:0042608) |
| 0.1 | 5.0 | GO:0005159 | insulin-like growth factor receptor binding(GO:0005159) |
| 0.1 | 0.4 | GO:0033149 | FFAT motif binding(GO:0033149) |
| 0.1 | 0.8 | GO:0004167 | dopachrome isomerase activity(GO:0004167) |
| 0.1 | 0.5 | GO:0019826 | oxygen sensor activity(GO:0019826) |
| 0.1 | 0.7 | GO:0004830 | tryptophan-tRNA ligase activity(GO:0004830) |
| 0.1 | 0.4 | GO:0016534 | cyclin-dependent protein kinase 5 activator activity(GO:0016534) |
| 0.1 | 2.3 | GO:0005068 | transmembrane receptor protein tyrosine kinase adaptor activity(GO:0005068) |
| 0.1 | 0.4 | GO:0004514 | nicotinate-nucleotide diphosphorylase (carboxylating) activity(GO:0004514) |
| 0.1 | 0.9 | GO:0070324 | thyroid hormone binding(GO:0070324) |
| 0.1 | 1.6 | GO:0017162 | aryl hydrocarbon receptor binding(GO:0017162) |
| 0.1 | 0.5 | GO:0042289 | MHC class II protein binding(GO:0042289) |
| 0.1 | 1.1 | GO:0033592 | RNA strand annealing activity(GO:0033592) |
| 0.1 | 2.0 | GO:0070530 | K63-linked polyubiquitin binding(GO:0070530) |
| 0.1 | 1.8 | GO:0019992 | diacylglycerol binding(GO:0019992) |
| 0.1 | 2.1 | GO:0031435 | mitogen-activated protein kinase kinase kinase binding(GO:0031435) |
| 0.1 | 0.3 | GO:0004531 | deoxyribonuclease II activity(GO:0004531) |
| 0.1 | 0.7 | GO:0034711 | inhibin binding(GO:0034711) |
| 0.1 | 1.0 | GO:0097016 | L27 domain binding(GO:0097016) |
| 0.1 | 0.7 | GO:0089720 | caspase binding(GO:0089720) |
| 0.1 | 0.3 | GO:0008332 | low voltage-gated calcium channel activity(GO:0008332) |
| 0.1 | 1.1 | GO:0097371 | MDM2/MDM4 family protein binding(GO:0097371) |
| 0.1 | 1.5 | GO:0032454 | histone demethylase activity (H3-K9 specific)(GO:0032454) |
| 0.1 | 0.2 | GO:0008523 | sodium-dependent multivitamin transmembrane transporter activity(GO:0008523) |
| 0.1 | 2.5 | GO:0005123 | death receptor binding(GO:0005123) |
| 0.1 | 1.7 | GO:0000339 | RNA cap binding(GO:0000339) |
| 0.1 | 1.8 | GO:0070006 | metalloaminopeptidase activity(GO:0070006) |
| 0.1 | 0.4 | GO:0004468 | lysine N-acetyltransferase activity, acting on acetyl phosphate as donor(GO:0004468) |
| 0.1 | 1.2 | GO:0043138 | 3'-5' DNA helicase activity(GO:0043138) |
| 0.1 | 1.0 | GO:0030280 | structural constituent of epidermis(GO:0030280) |
| 0.1 | 2.6 | GO:0005184 | neuropeptide hormone activity(GO:0005184) |
| 0.1 | 1.9 | GO:0003746 | translation elongation factor activity(GO:0003746) |
| 0.1 | 3.2 | GO:0042169 | SH2 domain binding(GO:0042169) |
| 0.1 | 1.0 | GO:0032452 | histone demethylase activity(GO:0032452) |
| 0.1 | 0.9 | GO:0019957 | C-C chemokine binding(GO:0019957) |
| 0.1 | 0.5 | GO:0015349 | thyroid hormone transmembrane transporter activity(GO:0015349) |
| 0.1 | 1.0 | GO:0045236 | CXCR chemokine receptor binding(GO:0045236) |
| 0.1 | 1.8 | GO:0004181 | metallocarboxypeptidase activity(GO:0004181) |
| 0.1 | 0.9 | GO:0004653 | polypeptide N-acetylgalactosaminyltransferase activity(GO:0004653) |
| 0.1 | 2.4 | GO:0050699 | WW domain binding(GO:0050699) |
| 0.1 | 0.5 | GO:0048495 | Roundabout binding(GO:0048495) |
| 0.1 | 3.4 | GO:0001102 | RNA polymerase II activating transcription factor binding(GO:0001102) |
| 0.1 | 0.6 | GO:0035612 | AP-2 adaptor complex binding(GO:0035612) |
| 0.1 | 0.2 | GO:0005222 | intracellular cAMP activated cation channel activity(GO:0005222) |
| 0.1 | 0.9 | GO:0004550 | nucleoside diphosphate kinase activity(GO:0004550) |
| 0.1 | 0.2 | GO:0022897 | peptide:proton symporter activity(GO:0015333) proton-dependent peptide secondary active transmembrane transporter activity(GO:0022897) |
| 0.1 | 0.9 | GO:0005095 | GTPase inhibitor activity(GO:0005095) |
| 0.1 | 0.3 | GO:0050145 | nucleoside phosphate kinase activity(GO:0050145) |
| 0.1 | 1.6 | GO:0030552 | cAMP binding(GO:0030552) |
| 0.0 | 0.8 | GO:0097109 | neuroligin family protein binding(GO:0097109) |
| 0.0 | 0.5 | GO:0031996 | thioesterase binding(GO:0031996) |
| 0.0 | 1.3 | GO:0008093 | cytoskeletal adaptor activity(GO:0008093) |
| 0.0 | 0.2 | GO:0097108 | hedgehog family protein binding(GO:0097108) |
| 0.0 | 1.6 | GO:0015248 | sterol transporter activity(GO:0015248) |
| 0.0 | 0.6 | GO:0070411 | I-SMAD binding(GO:0070411) |
| 0.0 | 1.2 | GO:0031683 | G-protein beta/gamma-subunit complex binding(GO:0031683) |
| 0.0 | 0.9 | GO:0005337 | nucleoside transmembrane transporter activity(GO:0005337) |
| 0.0 | 0.8 | GO:0035259 | glucocorticoid receptor binding(GO:0035259) |
| 0.0 | 1.0 | GO:0008191 | metalloendopeptidase inhibitor activity(GO:0008191) |
| 0.0 | 0.2 | GO:0008900 | hydrogen:potassium-exchanging ATPase activity(GO:0008900) |
| 0.0 | 0.2 | GO:0003726 | double-stranded RNA adenosine deaminase activity(GO:0003726) |
| 0.0 | 4.8 | GO:0005262 | calcium channel activity(GO:0005262) |
| 0.0 | 4.5 | GO:0042826 | histone deacetylase binding(GO:0042826) |
| 0.0 | 1.4 | GO:0015020 | glucuronosyltransferase activity(GO:0015020) |
| 0.0 | 1.1 | GO:0004003 | ATP-dependent DNA helicase activity(GO:0004003) |
| 0.0 | 1.0 | GO:0031489 | myosin V binding(GO:0031489) |
| 0.0 | 3.6 | GO:0005070 | SH3/SH2 adaptor activity(GO:0005070) |
| 0.0 | 0.5 | GO:0032041 | histone deacetylase activity (H3-K14 specific)(GO:0031078) NAD-dependent histone deacetylase activity (H3-K14 specific)(GO:0032041) |
| 0.0 | 0.2 | GO:0003945 | N-acetyllactosamine synthase activity(GO:0003945) |
| 0.0 | 0.9 | GO:0000993 | RNA polymerase II core binding(GO:0000993) |
| 0.0 | 0.2 | GO:0015277 | kainate selective glutamate receptor activity(GO:0015277) |
| 0.0 | 2.9 | GO:0005089 | Rho guanyl-nucleotide exchange factor activity(GO:0005089) |
| 0.0 | 1.1 | GO:0017025 | TBP-class protein binding(GO:0017025) |
| 0.0 | 0.8 | GO:0004435 | phosphatidylinositol phospholipase C activity(GO:0004435) |
| 0.0 | 1.0 | GO:0003700 | nucleic acid binding transcription factor activity(GO:0001071) transcription factor activity, sequence-specific DNA binding(GO:0003700) |
| 0.0 | 0.4 | GO:0003995 | acyl-CoA dehydrogenase activity(GO:0003995) |
| 0.0 | 1.8 | GO:0032947 | protein complex scaffold(GO:0032947) |
| 0.0 | 0.2 | GO:0048406 | nerve growth factor binding(GO:0048406) |
| 0.0 | 0.1 | GO:0005113 | patched binding(GO:0005113) |
| 0.0 | 0.6 | GO:0015347 | sodium-independent organic anion transmembrane transporter activity(GO:0015347) |
| 0.0 | 0.5 | GO:0016628 | oxidoreductase activity, acting on the CH-CH group of donors, NAD or NADP as acceptor(GO:0016628) |
| 0.0 | 0.6 | GO:0004033 | aldo-keto reductase (NADP) activity(GO:0004033) |
| 0.0 | 2.3 | GO:0019955 | cytokine binding(GO:0019955) |
| 0.0 | 1.5 | GO:0048306 | calcium-dependent protein binding(GO:0048306) |
| 0.0 | 1.7 | GO:0003705 | transcription factor activity, RNA polymerase II distal enhancer sequence-specific binding(GO:0003705) |
| 0.0 | 0.6 | GO:0030332 | cyclin binding(GO:0030332) |
| 0.0 | 7.0 | GO:0004842 | ubiquitin-protein transferase activity(GO:0004842) |
| 0.0 | 1.2 | GO:0016811 | hydrolase activity, acting on carbon-nitrogen (but not peptide) bonds, in linear amides(GO:0016811) |
| 0.0 | 0.5 | GO:0003682 | chromatin binding(GO:0003682) |
| 0.0 | 0.7 | GO:0004683 | calmodulin-dependent protein kinase activity(GO:0004683) |
| 0.0 | 0.1 | GO:0102338 | fatty acid elongase activity(GO:0009922) 3-oxo-arachidoyl-CoA synthase activity(GO:0102336) 3-oxo-cerotoyl-CoA synthase activity(GO:0102337) 3-oxo-lignoceronyl-CoA synthase activity(GO:0102338) |
| 0.0 | 0.4 | GO:0030515 | snoRNA binding(GO:0030515) |
| 0.0 | 0.1 | GO:0001165 | RNA polymerase I upstream control element sequence-specific DNA binding(GO:0001165) |
| 0.0 | 0.2 | GO:0098505 | single-stranded telomeric DNA binding(GO:0043047) G-rich strand telomeric DNA binding(GO:0098505) |
| 0.0 | 1.0 | GO:0031490 | chromatin DNA binding(GO:0031490) |
| 0.0 | 0.6 | GO:0004984 | olfactory receptor activity(GO:0004984) |
| 0.0 | 0.4 | GO:0008395 | steroid hydroxylase activity(GO:0008395) |
| 0.0 | 0.2 | GO:0008510 | sodium:bicarbonate symporter activity(GO:0008510) |
| 0.0 | 0.1 | GO:0016681 | ubiquinol-cytochrome-c reductase activity(GO:0008121) oxidoreductase activity, acting on diphenols and related substances as donors, cytochrome as acceptor(GO:0016681) |
| 0.0 | 0.1 | GO:0004935 | adrenergic receptor activity(GO:0004935) |
| 0.0 | 0.2 | GO:0005158 | insulin receptor binding(GO:0005158) |
| 0.0 | 1.6 | GO:0005200 | structural constituent of cytoskeleton(GO:0005200) |
| 0.0 | 0.1 | GO:0005112 | Notch binding(GO:0005112) |
Gene overrepresentation in C2:CP category:
| Log-likelihood per target | Total log-likelihood | Term | Description |
|---|---|---|---|
| 0.1 | 5.8 | PID INSULIN GLUCOSE PATHWAY | Insulin-mediated glucose transport |
| 0.1 | 6.5 | PID ARF6 PATHWAY | Arf6 signaling events |
| 0.1 | 1.2 | PID S1P META PATHWAY | Sphingosine 1-phosphate (S1P) pathway |
| 0.1 | 2.1 | PID S1P S1P4 PATHWAY | S1P4 pathway |
| 0.1 | 5.7 | PID PLK1 PATHWAY | PLK1 signaling events |
| 0.1 | 1.2 | PID LPA4 PATHWAY | LPA4-mediated signaling events |
| 0.1 | 6.6 | ST T CELL SIGNAL TRANSDUCTION | T Cell Signal Transduction |
| 0.1 | 5.5 | PID RAC1 REG PATHWAY | Regulation of RAC1 activity |
| 0.1 | 1.7 | ST GRANULE CELL SURVIVAL PATHWAY | Granule Cell Survival Pathway is a specific case of more general PAC1 Receptor Pathway. |
| 0.1 | 3.0 | PID IL3 PATHWAY | IL3-mediated signaling events |
| 0.1 | 5.5 | PID RAC1 PATHWAY | RAC1 signaling pathway |
| 0.1 | 2.8 | PID HIF1A PATHWAY | Hypoxic and oxygen homeostasis regulation of HIF-1-alpha |
| 0.1 | 2.9 | PID MAPK TRK PATHWAY | Trk receptor signaling mediated by the MAPK pathway |
| 0.1 | 1.9 | PID AURORA A PATHWAY | Aurora A signaling |
| 0.0 | 0.6 | ST TYPE I INTERFERON PATHWAY | Type I Interferon (alpha/beta IFN) Pathway |
| 0.0 | 1.2 | PID MYC PATHWAY | C-MYC pathway |
| 0.0 | 0.7 | PID HIF2PATHWAY | HIF-2-alpha transcription factor network |
| 0.0 | 0.5 | ST G ALPHA S PATHWAY | G alpha s Pathway |
| 0.0 | 1.9 | PID INTEGRIN A4B1 PATHWAY | Alpha4 beta1 integrin signaling events |
| 0.0 | 2.5 | PID BMP PATHWAY | BMP receptor signaling |
| 0.0 | 3.3 | PID HIF1 TFPATHWAY | HIF-1-alpha transcription factor network |
| 0.0 | 0.5 | PID CD40 PATHWAY | CD40/CD40L signaling |
| 0.0 | 5.0 | PID SMAD2 3NUCLEAR PATHWAY | Regulation of nuclear SMAD2/3 signaling |
| 0.0 | 1.1 | PID TOLL ENDOGENOUS PATHWAY | Endogenous TLR signaling |
| 0.0 | 0.7 | PID IL27 PATHWAY | IL27-mediated signaling events |
| 0.0 | 1.6 | PID HNF3B PATHWAY | FOXA2 and FOXA3 transcription factor networks |
| 0.0 | 0.7 | PID NFKAPPAB CANONICAL PATHWAY | Canonical NF-kappaB pathway |
| 0.0 | 1.4 | PID INTEGRIN2 PATHWAY | Beta2 integrin cell surface interactions |
| 0.0 | 1.3 | PID TNF PATHWAY | TNF receptor signaling pathway |
| 0.0 | 0.3 | SA G1 AND S PHASES | Cdk2, 4, and 6 bind cyclin D in G1, while cdk2/cyclin E promotes the G1/S transition. |
| 0.0 | 1.0 | NABA PROTEOGLYCANS | Genes encoding proteoglycans |
| 0.0 | 0.8 | PID RXR VDR PATHWAY | RXR and RAR heterodimerization with other nuclear receptor |
| 0.0 | 0.1 | ST G ALPHA I PATHWAY | G alpha i Pathway |
| 0.0 | 0.5 | PID INSULIN PATHWAY | Insulin Pathway |
| 0.0 | 0.7 | PID LKB1 PATHWAY | LKB1 signaling events |
| 0.0 | 0.5 | PID ANGIOPOIETIN RECEPTOR PATHWAY | Angiopoietin receptor Tie2-mediated signaling |
| 0.0 | 0.6 | PID VEGFR1 2 PATHWAY | Signaling events mediated by VEGFR1 and VEGFR2 |
| 0.0 | 0.4 | PID LIS1 PATHWAY | Lissencephaly gene (LIS1) in neuronal migration and development |
| 0.0 | 0.7 | PID NOTCH PATHWAY | Notch signaling pathway |
| 0.0 | 0.7 | PID ERA GENOMIC PATHWAY | Validated nuclear estrogen receptor alpha network |
Gene overrepresentation in C2:CP:REACTOME category:
| Log-likelihood per target | Total log-likelihood | Term | Description |
|---|---|---|---|
| 0.4 | 7.1 | REACTOME SYNTHESIS SECRETION AND DEACYLATION OF GHRELIN | Genes involved in Synthesis, Secretion, and Deacylation of Ghrelin |
| 0.2 | 3.6 | REACTOME CLASS C 3 METABOTROPIC GLUTAMATE PHEROMONE RECEPTORS | Genes involved in Class C/3 (Metabotropic glutamate/pheromone receptors) |
| 0.2 | 4.0 | REACTOME MITOCHONDRIAL TRNA AMINOACYLATION | Genes involved in Mitochondrial tRNA aminoacylation |
| 0.2 | 2.4 | REACTOME VITAMIN B5 PANTOTHENATE METABOLISM | Genes involved in Vitamin B5 (pantothenate) metabolism |
| 0.2 | 4.2 | REACTOME PHOSPHORYLATION OF CD3 AND TCR ZETA CHAINS | Genes involved in Phosphorylation of CD3 and TCR zeta chains |
| 0.2 | 1.1 | REACTOME INFLUENZA VIRAL RNA TRANSCRIPTION AND REPLICATION | Genes involved in Influenza Viral RNA Transcription and Replication |
| 0.1 | 2.1 | REACTOME RAF MAP KINASE CASCADE | Genes involved in RAF/MAP kinase cascade |
| 0.1 | 2.4 | REACTOME COMMON PATHWAY | Genes involved in Common Pathway |
| 0.1 | 2.0 | REACTOME P75NTR RECRUITS SIGNALLING COMPLEXES | Genes involved in p75NTR recruits signalling complexes |
| 0.1 | 5.2 | REACTOME LATENT INFECTION OF HOMO SAPIENS WITH MYCOBACTERIUM TUBERCULOSIS | Genes involved in Latent infection of Homo sapiens with Mycobacterium tuberculosis |
| 0.1 | 2.6 | REACTOME NA CL DEPENDENT NEUROTRANSMITTER TRANSPORTERS | Genes involved in Na+/Cl- dependent neurotransmitter transporters |
| 0.1 | 1.2 | REACTOME ADENYLATE CYCLASE ACTIVATING PATHWAY | Genes involved in Adenylate cyclase activating pathway |
| 0.1 | 3.5 | REACTOME GLUCAGON SIGNALING IN METABOLIC REGULATION | Genes involved in Glucagon signaling in metabolic regulation |
| 0.1 | 3.0 | REACTOME SIGNALING BY FGFR1 FUSION MUTANTS | Genes involved in Signaling by FGFR1 fusion mutants |
| 0.1 | 2.1 | REACTOME CYTOSOLIC SULFONATION OF SMALL MOLECULES | Genes involved in Cytosolic sulfonation of small molecules |
| 0.1 | 1.2 | REACTOME UNWINDING OF DNA | Genes involved in Unwinding of DNA |
| 0.1 | 1.7 | REACTOME CTNNB1 PHOSPHORYLATION CASCADE | Genes involved in Beta-catenin phosphorylation cascade |
| 0.1 | 2.4 | REACTOME RAP1 SIGNALLING | Genes involved in Rap1 signalling |
| 0.1 | 3.0 | REACTOME DOWNREGULATION OF SMAD2 3 SMAD4 TRANSCRIPTIONAL ACTIVITY | Genes involved in Downregulation of SMAD2/3:SMAD4 transcriptional activity |
| 0.1 | 1.9 | REACTOME AMINO ACID SYNTHESIS AND INTERCONVERSION TRANSAMINATION | Genes involved in Amino acid synthesis and interconversion (transamination) |
| 0.1 | 1.2 | REACTOME CHYLOMICRON MEDIATED LIPID TRANSPORT | Genes involved in Chylomicron-mediated lipid transport |
| 0.1 | 1.8 | REACTOME INTERACTION BETWEEN L1 AND ANKYRINS | Genes involved in Interaction between L1 and Ankyrins |
| 0.1 | 2.9 | REACTOME NRAGE SIGNALS DEATH THROUGH JNK | Genes involved in NRAGE signals death through JNK |
| 0.1 | 1.9 | REACTOME THE ROLE OF NEF IN HIV1 REPLICATION AND DISEASE PATHOGENESIS | Genes involved in The role of Nef in HIV-1 replication and disease pathogenesis |
| 0.1 | 4.6 | REACTOME MITOTIC PROMETAPHASE | Genes involved in Mitotic Prometaphase |
| 0.0 | 1.1 | REACTOME N GLYCAN ANTENNAE ELONGATION | Genes involved in N-Glycan antennae elongation |
| 0.0 | 1.8 | REACTOME DEGRADATION OF THE EXTRACELLULAR MATRIX | Genes involved in Degradation of the extracellular matrix |
| 0.0 | 1.0 | REACTOME INHIBITION OF THE PROTEOLYTIC ACTIVITY OF APC C REQUIRED FOR THE ONSET OF ANAPHASE BY MITOTIC SPINDLE CHECKPOINT COMPONENTS | Genes involved in Inhibition of the proteolytic activity of APC/C required for the onset of anaphase by mitotic spindle checkpoint components |
| 0.0 | 1.1 | REACTOME POST CHAPERONIN TUBULIN FOLDING PATHWAY | Genes involved in Post-chaperonin tubulin folding pathway |
| 0.0 | 0.3 | REACTOME DOWNSTREAM SIGNAL TRANSDUCTION | Genes involved in Downstream signal transduction |
| 0.0 | 0.9 | REACTOME CITRIC ACID CYCLE TCA CYCLE | Genes involved in Citric acid cycle (TCA cycle) |
| 0.0 | 2.4 | REACTOME AUTODEGRADATION OF CDH1 BY CDH1 APC C | Genes involved in Autodegradation of Cdh1 by Cdh1:APC/C |
| 0.0 | 1.7 | REACTOME GLYCOSPHINGOLIPID METABOLISM | Genes involved in Glycosphingolipid metabolism |
| 0.0 | 0.6 | REACTOME TRAF3 DEPENDENT IRF ACTIVATION PATHWAY | Genes involved in TRAF3-dependent IRF activation pathway |
| 0.0 | 1.6 | REACTOME VOLTAGE GATED POTASSIUM CHANNELS | Genes involved in Voltage gated Potassium channels |
| 0.0 | 1.4 | REACTOME TRANSPORT OF VITAMINS NUCLEOSIDES AND RELATED MOLECULES | Genes involved in Transport of vitamins, nucleosides, and related molecules |
| 0.0 | 0.9 | REACTOME AMINO ACID TRANSPORT ACROSS THE PLASMA MEMBRANE | Genes involved in Amino acid transport across the plasma membrane |
| 0.0 | 1.8 | REACTOME REGULATION OF MRNA STABILITY BY PROTEINS THAT BIND AU RICH ELEMENTS | Genes involved in Regulation of mRNA Stability by Proteins that Bind AU-rich Elements |
| 0.0 | 0.5 | REACTOME OXYGEN DEPENDENT PROLINE HYDROXYLATION OF HYPOXIA INDUCIBLE FACTOR ALPHA | Genes involved in Oxygen-dependent Proline Hydroxylation of Hypoxia-inducible Factor Alpha |
| 0.0 | 0.6 | REACTOME CYCLIN A B1 ASSOCIATED EVENTS DURING G2 M TRANSITION | Genes involved in Cyclin A/B1 associated events during G2/M transition |
| 0.0 | 0.7 | REACTOME ACTIVATED NOTCH1 TRANSMITS SIGNAL TO THE NUCLEUS | Genes involved in Activated NOTCH1 Transmits Signal to the Nucleus |
| 0.0 | 0.4 | REACTOME MITOCHONDRIAL FATTY ACID BETA OXIDATION | Genes involved in Mitochondrial Fatty Acid Beta-Oxidation |
| 0.0 | 1.6 | REACTOME INTERFERON ALPHA BETA SIGNALING | Genes involved in Interferon alpha/beta signaling |
| 0.0 | 0.3 | REACTOME CDC6 ASSOCIATION WITH THE ORC ORIGIN COMPLEX | Genes involved in CDC6 association with the ORC:origin complex |
| 0.0 | 0.5 | REACTOME ENDOSOMAL SORTING COMPLEX REQUIRED FOR TRANSPORT ESCRT | Genes involved in Endosomal Sorting Complex Required For Transport (ESCRT) |
| 0.0 | 1.4 | REACTOME ANTIVIRAL MECHANISM BY IFN STIMULATED GENES | Genes involved in Antiviral mechanism by IFN-stimulated genes |
| 0.0 | 0.7 | REACTOME TRNA AMINOACYLATION | Genes involved in tRNA Aminoacylation |
| 0.0 | 0.2 | REACTOME SIGNAL ATTENUATION | Genes involved in Signal attenuation |
| 0.0 | 0.5 | REACTOME GLUCURONIDATION | Genes involved in Glucuronidation |
| 0.0 | 1.2 | REACTOME NCAM1 INTERACTIONS | Genes involved in NCAM1 interactions |
| 0.0 | 0.9 | REACTOME GLYCOLYSIS | Genes involved in Glycolysis |
| 0.0 | 0.4 | REACTOME ENDOGENOUS STEROLS | Genes involved in Endogenous sterols |
| 0.0 | 0.3 | REACTOME PURINE RIBONUCLEOSIDE MONOPHOSPHATE BIOSYNTHESIS | Genes involved in Purine ribonucleoside monophosphate biosynthesis |
| 0.0 | 1.3 | REACTOME TRANS GOLGI NETWORK VESICLE BUDDING | Genes involved in trans-Golgi Network Vesicle Budding |
| 0.0 | 0.9 | REACTOME SIGNALING BY NOTCH1 | Genes involved in Signaling by NOTCH1 |
| 0.0 | 0.5 | REACTOME ASSOCIATION OF TRIC CCT WITH TARGET PROTEINS DURING BIOSYNTHESIS | Genes involved in Association of TriC/CCT with target proteins during biosynthesis |
| 0.0 | 3.3 | REACTOME G ALPHA I SIGNALLING EVENTS | Genes involved in G alpha (i) signalling events |
| 0.0 | 3.1 | REACTOME METABOLISM OF AMINO ACIDS AND DERIVATIVES | Genes involved in Metabolism of amino acids and derivatives |
| 0.0 | 0.5 | REACTOME CHOLESTEROL BIOSYNTHESIS | Genes involved in Cholesterol biosynthesis |
| 0.0 | 1.4 | REACTOME MYD88 MAL CASCADE INITIATED ON PLASMA MEMBRANE | Genes involved in MyD88:Mal cascade initiated on plasma membrane |
| 0.0 | 1.7 | REACTOME RESPIRATORY ELECTRON TRANSPORT ATP SYNTHESIS BY CHEMIOSMOTIC COUPLING AND HEAT PRODUCTION BY UNCOUPLING PROTEINS | Genes involved in Respiratory electron transport, ATP synthesis by chemiosmotic coupling, and heat production by uncoupling proteins. |
| 0.0 | 1.4 | REACTOME MHC CLASS II ANTIGEN PRESENTATION | Genes involved in MHC class II antigen presentation |
| 0.0 | 1.5 | REACTOME FACTORS INVOLVED IN MEGAKARYOCYTE DEVELOPMENT AND PLATELET PRODUCTION | Genes involved in Factors involved in megakaryocyte development and platelet production |
| 0.0 | 0.6 | REACTOME OLFACTORY SIGNALING PATHWAY | Genes involved in Olfactory Signaling Pathway |
| 0.0 | 0.2 | REACTOME SYNTHESIS OF SUBSTRATES IN N GLYCAN BIOSYTHESIS | Genes involved in Synthesis of substrates in N-glycan biosythesis |
| 0.0 | 0.4 | REACTOME SPHINGOLIPID METABOLISM | Genes involved in Sphingolipid metabolism |
| 0.0 | 0.3 | REACTOME INSULIN SYNTHESIS AND PROCESSING | Genes involved in Insulin Synthesis and Processing |
| 0.0 | 0.2 | REACTOME REGULATION OF GENE EXPRESSION IN BETA CELLS | Genes involved in Regulation of gene expression in beta cells |
| 0.0 | 0.8 | REACTOME IMMUNOREGULATORY INTERACTIONS BETWEEN A LYMPHOID AND A NON LYMPHOID CELL | Genes involved in Immunoregulatory interactions between a Lymphoid and a non-Lymphoid cell |
| 0.0 | 0.3 | REACTOME GENERATION OF SECOND MESSENGER MOLECULES | Genes involved in Generation of second messenger molecules |