Project
GNF SymAtlas + NCI-60 cancer cell lines, human (Su, 2004; Ross, 2000)
Navigation
Downloads
Results for ACAGUAU
Z-value: 0.82
Motif logo

miRNA associated with seed ACAGUAU
| Name | miRBASE accession |
|---|---|
|
hsa-miR-144-3p
|
MIMAT0000436 |
Activity profile of ACAGUAU motif
Sorted Z-values of ACAGUAU motif
| Promoter | Log-likelihood | Transcript | Gene | Gene Info |
|---|---|---|---|---|
| chr12_-_31479045 | 15.68 |
ENST00000539409.1
ENST00000395766.1 |
FAM60A
|
family with sequence similarity 60, member A |
| chr2_+_172778952 | 15.28 |
ENST00000392584.1
ENST00000264108.4 |
HAT1
|
histone acetyltransferase 1 |
| chr20_-_32891151 | 13.51 |
ENST00000217426.2
|
AHCY
|
adenosylhomocysteinase |
| chr5_+_52776228 | 11.89 |
ENST00000256759.3
|
FST
|
follistatin |
| chr12_-_15942309 | 11.07 |
ENST00000544064.1
ENST00000543523.1 ENST00000536793.1 |
EPS8
|
epidermal growth factor receptor pathway substrate 8 |
| chr1_-_95392635 | 11.02 |
ENST00000538964.1
ENST00000394202.4 ENST00000370206.4 |
CNN3
|
calponin 3, acidic |
| chr5_+_65440032 | 10.95 |
ENST00000334121.6
|
SREK1
|
splicing regulatory glutamine/lysine-rich protein 1 |
| chr2_+_201676256 | 10.01 |
ENST00000452206.1
ENST00000410110.2 ENST00000409600.1 |
BZW1
|
basic leucine zipper and W2 domains 1 |
| chr9_-_117880477 | 9.82 |
ENST00000534839.1
ENST00000340094.3 ENST00000535648.1 ENST00000346706.3 ENST00000345230.3 ENST00000350763.4 |
TNC
|
tenascin C |
| chr6_+_13615554 | 9.71 |
ENST00000451315.2
|
NOL7
|
nucleolar protein 7, 27kDa |
| chr2_-_227664474 | 8.76 |
ENST00000305123.5
|
IRS1
|
insulin receptor substrate 1 |
| chr3_-_195808952 | 8.73 |
ENST00000540528.1
ENST00000392396.3 ENST00000535031.1 ENST00000420415.1 |
TFRC
|
transferrin receptor |
| chr1_+_165796753 | 8.51 |
ENST00000367879.4
|
UCK2
|
uridine-cytidine kinase 2 |
| chr18_+_3451646 | 8.51 |
ENST00000345133.5
ENST00000330513.5 ENST00000549546.1 |
TGIF1
|
TGFB-induced factor homeobox 1 |
| chr17_-_4269768 | 8.47 |
ENST00000396981.2
|
UBE2G1
|
ubiquitin-conjugating enzyme E2G 1 |
| chr1_+_113161778 | 8.42 |
ENST00000263168.3
|
CAPZA1
|
capping protein (actin filament) muscle Z-line, alpha 1 |
| chr15_+_52311398 | 7.92 |
ENST00000261845.5
|
MAPK6
|
mitogen-activated protein kinase 6 |
| chr6_-_86352642 | 7.82 |
ENST00000355238.6
|
SYNCRIP
|
synaptotagmin binding, cytoplasmic RNA interacting protein |
| chr1_+_26798955 | 7.63 |
ENST00000361427.5
|
HMGN2
|
high mobility group nucleosomal binding domain 2 |
| chr15_+_39873268 | 7.30 |
ENST00000397591.2
ENST00000260356.5 |
THBS1
|
thrombospondin 1 |
| chr3_+_30648066 | 6.93 |
ENST00000359013.4
|
TGFBR2
|
transforming growth factor, beta receptor II (70/80kDa) |
| chr15_-_49447835 | 6.89 |
ENST00000388901.5
ENST00000299259.6 |
COPS2
|
COP9 signalosome subunit 2 |
| chr10_+_89622870 | 6.67 |
ENST00000371953.3
|
PTEN
|
phosphatase and tensin homolog |
| chr5_-_127873659 | 6.53 |
ENST00000262464.4
|
FBN2
|
fibrillin 2 |
| chrX_-_108976521 | 6.51 |
ENST00000469796.2
ENST00000502391.1 ENST00000508092.1 ENST00000340800.2 ENST00000348502.6 |
ACSL4
|
acyl-CoA synthetase long-chain family member 4 |
| chr6_+_64281906 | 6.31 |
ENST00000370651.3
|
PTP4A1
|
protein tyrosine phosphatase type IVA, member 1 |
| chr1_-_225840747 | 6.18 |
ENST00000366843.2
ENST00000366844.3 |
ENAH
|
enabled homolog (Drosophila) |
| chr3_+_107241783 | 6.14 |
ENST00000415149.2
ENST00000402543.1 ENST00000325805.8 ENST00000427402.1 |
BBX
|
bobby sox homolog (Drosophila) |
| chr17_-_38574169 | 5.85 |
ENST00000423485.1
|
TOP2A
|
topoisomerase (DNA) II alpha 170kDa |
| chr3_+_152017181 | 5.65 |
ENST00000498502.1
ENST00000324196.5 ENST00000545754.1 ENST00000357472.3 |
MBNL1
|
muscleblind-like splicing regulator 1 |
| chr1_-_78148324 | 5.53 |
ENST00000370801.3
ENST00000433749.1 |
ZZZ3
|
zinc finger, ZZ-type containing 3 |
| chr2_-_178128528 | 5.50 |
ENST00000397063.4
ENST00000421929.1 |
NFE2L2
|
nuclear factor, erythroid 2-like 2 |
| chr4_-_139163491 | 5.46 |
ENST00000280612.5
|
SLC7A11
|
solute carrier family 7 (anionic amino acid transporter light chain, xc- system), member 11 |
| chr10_+_5454505 | 5.41 |
ENST00000355029.4
|
NET1
|
neuroepithelial cell transforming 1 |
| chr10_-_79686284 | 5.40 |
ENST00000372391.2
ENST00000372388.2 |
DLG5
|
discs, large homolog 5 (Drosophila) |
| chrX_-_109561294 | 5.38 |
ENST00000372059.2
ENST00000262844.5 |
AMMECR1
|
Alport syndrome, mental retardation, midface hypoplasia and elliptocytosis chromosomal region gene 1 |
| chr11_-_27494279 | 5.38 |
ENST00000379214.4
|
LGR4
|
leucine-rich repeat containing G protein-coupled receptor 4 |
| chr7_+_116139424 | 5.20 |
ENST00000222693.4
|
CAV2
|
caveolin 2 |
| chr15_-_48470558 | 5.17 |
ENST00000324324.7
|
MYEF2
|
myelin expression factor 2 |
| chr2_+_46926048 | 5.11 |
ENST00000306503.5
|
SOCS5
|
suppressor of cytokine signaling 5 |
| chr16_-_12009735 | 5.11 |
ENST00000439887.2
ENST00000434724.2 |
GSPT1
|
G1 to S phase transition 1 |
| chr18_-_18691739 | 4.99 |
ENST00000399799.2
|
ROCK1
|
Rho-associated, coiled-coil containing protein kinase 1 |
| chr2_-_37899323 | 4.95 |
ENST00000295324.3
ENST00000457889.1 |
CDC42EP3
|
CDC42 effector protein (Rho GTPase binding) 3 |
| chr2_+_198365122 | 4.94 |
ENST00000604458.1
|
HSPE1-MOB4
|
HSPE1-MOB4 readthrough |
| chrX_-_41782249 | 4.93 |
ENST00000442742.2
ENST00000421587.2 ENST00000378166.4 ENST00000318588.9 ENST00000361962.4 |
CASK
|
calcium/calmodulin-dependent serine protein kinase (MAGUK family) |
| chr1_+_955448 | 4.83 |
ENST00000379370.2
|
AGRN
|
agrin |
| chr7_-_27213893 | 4.75 |
ENST00000283921.4
|
HOXA10
|
homeobox A10 |
| chr11_+_92085262 | 4.68 |
ENST00000298047.6
ENST00000409404.2 ENST00000541502.1 |
FAT3
|
FAT atypical cadherin 3 |
| chr8_+_98881268 | 4.66 |
ENST00000254898.5
ENST00000524308.1 ENST00000522025.2 |
MATN2
|
matrilin 2 |
| chr5_+_177631497 | 4.62 |
ENST00000358344.3
|
HNRNPAB
|
heterogeneous nuclear ribonucleoprotein A/B |
| chr3_-_124774802 | 4.49 |
ENST00000311127.4
|
HEG1
|
heart development protein with EGF-like domains 1 |
| chr6_+_114178512 | 4.44 |
ENST00000368635.4
|
MARCKS
|
myristoylated alanine-rich protein kinase C substrate |
| chr16_-_65155833 | 4.37 |
ENST00000566827.1
ENST00000394156.3 ENST00000562998.1 |
CDH11
|
cadherin 11, type 2, OB-cadherin (osteoblast) |
| chrX_-_99891796 | 4.32 |
ENST00000373020.4
|
TSPAN6
|
tetraspanin 6 |
| chr10_+_95256356 | 4.28 |
ENST00000371485.3
|
CEP55
|
centrosomal protein 55kDa |
| chr5_-_38595498 | 4.26 |
ENST00000263409.4
|
LIFR
|
leukemia inhibitory factor receptor alpha |
| chr16_-_47177874 | 4.11 |
ENST00000562435.1
|
NETO2
|
neuropilin (NRP) and tolloid (TLL)-like 2 |
| chr1_+_93811438 | 4.05 |
ENST00000370272.4
ENST00000370267.1 |
DR1
|
down-regulator of transcription 1, TBP-binding (negative cofactor 2) |
| chr1_-_225615599 | 4.02 |
ENST00000421383.1
ENST00000272163.4 |
LBR
|
lamin B receptor |
| chr20_+_61427797 | 3.96 |
ENST00000370487.3
|
MRGBP
|
MRG/MORF4L binding protein |
| chr12_-_76425368 | 3.91 |
ENST00000602540.1
|
PHLDA1
|
pleckstrin homology-like domain, family A, member 1 |
| chr12_+_69004619 | 3.85 |
ENST00000250559.9
ENST00000393436.5 ENST00000425247.2 ENST00000489473.2 ENST00000422358.2 ENST00000541167.1 ENST00000538283.1 ENST00000341355.5 ENST00000537460.1 ENST00000450214.2 ENST00000545270.1 ENST00000538980.1 ENST00000542018.1 ENST00000543393.1 |
RAP1B
|
RAP1B, member of RAS oncogene family |
| chr6_-_99797522 | 3.76 |
ENST00000389677.5
|
FAXC
|
failed axon connections homolog (Drosophila) |
| chr3_-_98620500 | 3.73 |
ENST00000326840.6
|
DCBLD2
|
discoidin, CUB and LCCL domain containing 2 |
| chr3_+_69812877 | 3.66 |
ENST00000457080.1
ENST00000328528.6 |
MITF
|
microphthalmia-associated transcription factor |
| chr9_+_112810878 | 3.64 |
ENST00000434623.2
ENST00000374525.1 |
AKAP2
|
A kinase (PRKA) anchor protein 2 |
| chr8_-_57123815 | 3.59 |
ENST00000316981.3
ENST00000423799.2 ENST00000429357.2 |
PLAG1
|
pleiomorphic adenoma gene 1 |
| chr6_-_24721054 | 3.55 |
ENST00000378119.4
|
C6orf62
|
chromosome 6 open reading frame 62 |
| chr12_+_104359576 | 3.54 |
ENST00000392872.3
ENST00000436021.2 |
TDG
|
thymine-DNA glycosylase |
| chr6_+_160390102 | 3.53 |
ENST00000356956.1
|
IGF2R
|
insulin-like growth factor 2 receptor |
| chr15_-_48937982 | 3.44 |
ENST00000316623.5
|
FBN1
|
fibrillin 1 |
| chr17_+_1733276 | 3.43 |
ENST00000254719.5
|
RPA1
|
replication protein A1, 70kDa |
| chr11_+_9685604 | 3.37 |
ENST00000447399.2
ENST00000318950.6 |
SWAP70
|
SWAP switching B-cell complex 70kDa subunit |
| chr20_+_19867150 | 3.33 |
ENST00000255006.6
|
RIN2
|
Ras and Rab interactor 2 |
| chr14_+_23776024 | 3.31 |
ENST00000553781.1
ENST00000556100.1 ENST00000557236.1 ENST00000557579.1 |
BCL2L2-PABPN1
BCL2L2
|
BCL2L2-PABPN1 readthrough BCL2-like 2 |
| chr9_+_2621798 | 3.30 |
ENST00000382100.3
|
VLDLR
|
very low density lipoprotein receptor |
| chr12_+_67663056 | 3.27 |
ENST00000545606.1
|
CAND1
|
cullin-associated and neddylation-dissociated 1 |
| chr15_-_37390482 | 3.18 |
ENST00000559085.1
ENST00000397624.3 |
MEIS2
|
Meis homeobox 2 |
| chr8_-_41166953 | 3.15 |
ENST00000220772.3
|
SFRP1
|
secreted frizzled-related protein 1 |
| chr8_+_26149007 | 3.10 |
ENST00000380737.3
ENST00000524169.1 |
PPP2R2A
|
protein phosphatase 2, regulatory subunit B, alpha |
| chr4_-_103748880 | 3.04 |
ENST00000453744.2
ENST00000349311.8 |
UBE2D3
|
ubiquitin-conjugating enzyme E2D 3 |
| chr9_+_112542572 | 3.04 |
ENST00000374530.3
|
PALM2-AKAP2
|
PALM2-AKAP2 readthrough |
| chr7_+_115850547 | 3.02 |
ENST00000358204.4
ENST00000455989.1 ENST00000537767.1 |
TES
|
testis derived transcript (3 LIM domains) |
| chr20_-_48729670 | 3.02 |
ENST00000371657.5
|
UBE2V1
|
ubiquitin-conjugating enzyme E2 variant 1 |
| chr15_+_77223960 | 3.02 |
ENST00000394885.3
|
RCN2
|
reticulocalbin 2, EF-hand calcium binding domain |
| chr18_+_8717369 | 2.99 |
ENST00000359865.3
ENST00000400050.3 ENST00000306285.7 |
SOGA2
|
SOGA family member 2 |
| chr2_-_65357225 | 2.98 |
ENST00000398529.3
ENST00000409751.1 ENST00000356214.7 ENST00000409892.1 ENST00000409784.3 |
RAB1A
|
RAB1A, member RAS oncogene family |
| chr3_+_51575596 | 2.98 |
ENST00000409535.2
|
RAD54L2
|
RAD54-like 2 (S. cerevisiae) |
| chr12_+_50135588 | 2.97 |
ENST00000423828.1
ENST00000550445.1 |
TMBIM6
|
transmembrane BAX inhibitor motif containing 6 |
| chr5_+_82767284 | 2.97 |
ENST00000265077.3
|
VCAN
|
versican |
| chr20_-_48770174 | 2.96 |
ENST00000341698.2
|
TMEM189-UBE2V1
|
TMEM189-UBE2V1 readthrough |
| chr1_+_110091189 | 2.94 |
ENST00000369851.4
|
GNAI3
|
guanine nucleotide binding protein (G protein), alpha inhibiting activity polypeptide 3 |
| chr14_-_21737610 | 2.94 |
ENST00000320084.7
ENST00000449098.1 ENST00000336053.6 |
HNRNPC
|
heterogeneous nuclear ribonucleoprotein C (C1/C2) |
| chr15_-_56209306 | 2.94 |
ENST00000506154.1
ENST00000338963.2 ENST00000508342.1 |
NEDD4
|
neural precursor cell expressed, developmentally down-regulated 4, E3 ubiquitin protein ligase |
| chr5_+_86564739 | 2.94 |
ENST00000456692.2
ENST00000512763.1 ENST00000506290.1 |
RASA1
|
RAS p21 protein activator (GTPase activating protein) 1 |
| chr21_-_43346790 | 2.91 |
ENST00000329623.7
|
C2CD2
|
C2 calcium-dependent domain containing 2 |
| chr12_+_4430371 | 2.89 |
ENST00000179259.4
|
C12orf5
|
chromosome 12 open reading frame 5 |
| chr8_-_68255912 | 2.85 |
ENST00000262215.3
ENST00000519436.1 |
ARFGEF1
|
ADP-ribosylation factor guanine nucleotide-exchange factor 1 (brefeldin A-inhibited) |
| chr3_-_176914238 | 2.81 |
ENST00000430069.1
ENST00000428970.1 |
TBL1XR1
|
transducin (beta)-like 1 X-linked receptor 1 |
| chr1_+_153606513 | 2.77 |
ENST00000368694.3
|
CHTOP
|
chromatin target of PRMT1 |
| chr16_-_10674528 | 2.73 |
ENST00000359543.3
|
EMP2
|
epithelial membrane protein 2 |
| chr3_+_130569429 | 2.72 |
ENST00000505330.1
ENST00000504381.1 ENST00000507488.2 ENST00000393221.4 |
ATP2C1
|
ATPase, Ca++ transporting, type 2C, member 1 |
| chr1_+_116184566 | 2.71 |
ENST00000355485.2
ENST00000369510.4 |
VANGL1
|
VANGL planar cell polarity protein 1 |
| chr8_+_125486939 | 2.68 |
ENST00000303545.3
|
RNF139
|
ring finger protein 139 |
| chr8_-_23712312 | 2.63 |
ENST00000290271.2
|
STC1
|
stanniocalcin 1 |
| chr15_+_96873921 | 2.60 |
ENST00000394166.3
|
NR2F2
|
nuclear receptor subfamily 2, group F, member 2 |
| chr2_-_100106419 | 2.59 |
ENST00000393445.3
ENST00000258428.3 |
REV1
|
REV1, polymerase (DNA directed) |
| chr6_-_82462425 | 2.58 |
ENST00000369754.3
ENST00000320172.6 ENST00000369756.3 |
FAM46A
|
family with sequence similarity 46, member A |
| chr13_+_26828275 | 2.58 |
ENST00000381527.3
|
CDK8
|
cyclin-dependent kinase 8 |
| chrX_+_118708493 | 2.57 |
ENST00000371558.2
|
UBE2A
|
ubiquitin-conjugating enzyme E2A |
| chr8_-_67525473 | 2.57 |
ENST00000522677.3
|
MYBL1
|
v-myb avian myeloblastosis viral oncogene homolog-like 1 |
| chr10_+_60272814 | 2.52 |
ENST00000373886.3
|
BICC1
|
bicaudal C homolog 1 (Drosophila) |
| chr13_-_50367057 | 2.49 |
ENST00000261667.3
|
KPNA3
|
karyopherin alpha 3 (importin alpha 4) |
| chr2_+_85198216 | 2.48 |
ENST00000456682.1
ENST00000409785.4 |
KCMF1
|
potassium channel modulatory factor 1 |
| chr3_+_9439400 | 2.47 |
ENST00000450326.1
ENST00000402198.1 ENST00000402466.1 |
SETD5
|
SET domain containing 5 |
| chr10_-_13390270 | 2.46 |
ENST00000378614.4
ENST00000545675.1 ENST00000327347.5 |
SEPHS1
|
selenophosphate synthetase 1 |
| chr7_+_116312411 | 2.44 |
ENST00000456159.1
ENST00000397752.3 ENST00000318493.6 |
MET
|
met proto-oncogene |
| chr11_-_95657231 | 2.41 |
ENST00000409459.1
ENST00000352297.7 ENST00000393223.3 ENST00000346299.5 |
MTMR2
|
myotubularin related protein 2 |
| chr10_-_98346801 | 2.40 |
ENST00000371142.4
|
TM9SF3
|
transmembrane 9 superfamily member 3 |
| chr13_-_48575443 | 2.39 |
ENST00000378654.3
|
SUCLA2
|
succinate-CoA ligase, ADP-forming, beta subunit |
| chr7_-_148581251 | 2.38 |
ENST00000478654.1
ENST00000460911.1 ENST00000350995.2 |
EZH2
|
enhancer of zeste homolog 2 (Drosophila) |
| chr3_+_99357319 | 2.36 |
ENST00000452013.1
ENST00000261037.3 ENST00000273342.4 |
COL8A1
|
collagen, type VIII, alpha 1 |
| chr10_-_43903217 | 2.35 |
ENST00000357065.4
|
HNRNPF
|
heterogeneous nuclear ribonucleoprotein F |
| chr1_+_39456895 | 2.35 |
ENST00000432648.3
ENST00000446189.2 ENST00000372984.4 |
AKIRIN1
|
akirin 1 |
| chr10_-_126849068 | 2.34 |
ENST00000494626.2
ENST00000337195.5 |
CTBP2
|
C-terminal binding protein 2 |
| chr12_+_13349650 | 2.34 |
ENST00000256951.5
ENST00000431267.2 ENST00000542474.1 ENST00000544053.1 |
EMP1
|
epithelial membrane protein 1 |
| chr3_-_81811312 | 2.32 |
ENST00000429644.2
|
GBE1
|
glucan (1,4-alpha-), branching enzyme 1 |
| chr3_+_105085734 | 2.31 |
ENST00000306107.5
|
ALCAM
|
activated leukocyte cell adhesion molecule |
| chr4_+_146402925 | 2.30 |
ENST00000302085.4
|
SMAD1
|
SMAD family member 1 |
| chrX_-_131352152 | 2.29 |
ENST00000342983.2
|
RAP2C
|
RAP2C, member of RAS oncogene family |
| chr3_+_141106643 | 2.27 |
ENST00000514251.1
|
ZBTB38
|
zinc finger and BTB domain containing 38 |
| chr1_-_103574024 | 2.27 |
ENST00000512756.1
ENST00000370096.3 ENST00000358392.2 ENST00000353414.4 |
COL11A1
|
collagen, type XI, alpha 1 |
| chr8_-_42065187 | 2.23 |
ENST00000270189.6
ENST00000352041.3 ENST00000220809.4 |
PLAT
|
plasminogen activator, tissue |
| chr16_+_69221028 | 2.23 |
ENST00000336278.4
|
SNTB2
|
syntrophin, beta 2 (dystrophin-associated protein A1, 59kDa, basic component 2) |
| chr12_+_27485823 | 2.22 |
ENST00000395901.2
ENST00000546179.1 |
ARNTL2
|
aryl hydrocarbon receptor nuclear translocator-like 2 |
| chr16_-_87525651 | 2.22 |
ENST00000268616.4
|
ZCCHC14
|
zinc finger, CCHC domain containing 14 |
| chr2_+_170590321 | 2.22 |
ENST00000392647.2
|
KLHL23
|
kelch-like family member 23 |
| chr4_-_54930790 | 2.19 |
ENST00000263921.3
|
CHIC2
|
cysteine-rich hydrophobic domain 2 |
| chr3_-_122233723 | 2.19 |
ENST00000493510.1
ENST00000344337.6 ENST00000476916.1 ENST00000465882.1 |
KPNA1
|
karyopherin alpha 1 (importin alpha 5) |
| chr14_-_64010046 | 2.18 |
ENST00000337537.3
|
PPP2R5E
|
protein phosphatase 2, regulatory subunit B', epsilon isoform |
| chr7_-_131241361 | 2.14 |
ENST00000378555.3
ENST00000322985.9 ENST00000541194.1 ENST00000537928.1 |
PODXL
|
podocalyxin-like |
| chr7_-_93633684 | 2.12 |
ENST00000222547.3
ENST00000425626.1 |
BET1
|
Bet1 golgi vesicular membrane trafficking protein |
| chrX_+_40944871 | 2.11 |
ENST00000378308.2
ENST00000324545.8 |
USP9X
|
ubiquitin specific peptidase 9, X-linked |
| chr10_+_63661053 | 2.08 |
ENST00000279873.7
|
ARID5B
|
AT rich interactive domain 5B (MRF1-like) |
| chr2_+_204192942 | 2.08 |
ENST00000295851.5
ENST00000261017.5 |
ABI2
|
abl-interactor 2 |
| chr2_+_198380289 | 2.08 |
ENST00000233892.4
ENST00000409916.1 |
MOB4
|
MOB family member 4, phocein |
| chr2_+_191273052 | 2.06 |
ENST00000417958.1
ENST00000432036.1 ENST00000392328.1 |
MFSD6
|
major facilitator superfamily domain containing 6 |
| chr10_+_88516396 | 2.06 |
ENST00000372037.3
|
BMPR1A
|
bone morphogenetic protein receptor, type IA |
| chr10_+_17686124 | 2.05 |
ENST00000377524.3
|
STAM
|
signal transducing adaptor molecule (SH3 domain and ITAM motif) 1 |
| chrX_-_119694538 | 2.05 |
ENST00000371322.5
|
CUL4B
|
cullin 4B |
| chr1_+_87170247 | 2.02 |
ENST00000370558.4
|
SH3GLB1
|
SH3-domain GRB2-like endophilin B1 |
| chr9_-_125590818 | 2.00 |
ENST00000259467.4
|
PDCL
|
phosducin-like |
| chr6_-_79944336 | 1.99 |
ENST00000344726.5
ENST00000275036.7 |
HMGN3
|
high mobility group nucleosomal binding domain 3 |
| chr13_-_107187462 | 1.97 |
ENST00000245323.4
|
EFNB2
|
ephrin-B2 |
| chr21_-_27542972 | 1.97 |
ENST00000346798.3
ENST00000439274.2 ENST00000354192.3 ENST00000348990.5 ENST00000357903.3 ENST00000358918.3 ENST00000359726.3 |
APP
|
amyloid beta (A4) precursor protein |
| chr20_-_47804894 | 1.96 |
ENST00000371828.3
ENST00000371856.2 ENST00000360426.4 ENST00000347458.5 ENST00000340954.7 ENST00000371802.1 ENST00000371792.1 ENST00000437404.2 |
STAU1
|
staufen double-stranded RNA binding protein 1 |
| chr15_-_83876758 | 1.96 |
ENST00000299633.4
|
HDGFRP3
|
Hepatoma-derived growth factor-related protein 3 |
| chr18_+_57567180 | 1.96 |
ENST00000316660.6
ENST00000269518.9 |
PMAIP1
|
phorbol-12-myristate-13-acetate-induced protein 1 |
| chr11_+_9406169 | 1.95 |
ENST00000379719.3
ENST00000527431.1 |
IPO7
|
importin 7 |
| chr1_-_245027833 | 1.94 |
ENST00000444376.2
|
HNRNPU
|
heterogeneous nuclear ribonucleoprotein U (scaffold attachment factor A) |
| chr16_-_88851618 | 1.92 |
ENST00000301015.9
|
PIEZO1
|
piezo-type mechanosensitive ion channel component 1 |
| chr18_-_9614515 | 1.87 |
ENST00000400556.3
ENST00000400555.3 |
PPP4R1
|
protein phosphatase 4, regulatory subunit 1 |
| chr9_-_14314066 | 1.85 |
ENST00000397575.3
|
NFIB
|
nuclear factor I/B |
| chr14_+_23790655 | 1.84 |
ENST00000397276.2
|
PABPN1
|
poly(A) binding protein, nuclear 1 |
| chr7_+_55086794 | 1.82 |
ENST00000275493.2
ENST00000442591.1 |
EGFR
|
epidermal growth factor receptor |
| chr20_+_39657454 | 1.74 |
ENST00000361337.2
|
TOP1
|
topoisomerase (DNA) I |
| chr13_+_49550015 | 1.73 |
ENST00000492622.2
|
FNDC3A
|
fibronectin type III domain containing 3A |
| chr1_-_186649543 | 1.72 |
ENST00000367468.5
|
PTGS2
|
prostaglandin-endoperoxide synthase 2 (prostaglandin G/H synthase and cyclooxygenase) |
| chr4_-_7873981 | 1.70 |
ENST00000360265.4
|
AFAP1
|
actin filament associated protein 1 |
| chr3_+_150321068 | 1.69 |
ENST00000471696.1
ENST00000477889.1 ENST00000485923.1 |
SELT
|
Selenoprotein T |
| chr3_-_136471204 | 1.67 |
ENST00000480733.1
ENST00000383202.2 ENST00000236698.5 ENST00000434713.2 |
STAG1
|
stromal antigen 1 |
| chr10_+_31608054 | 1.66 |
ENST00000320985.10
ENST00000361642.5 ENST00000560721.2 ENST00000558440.1 ENST00000424869.1 ENST00000542815.3 |
ZEB1
|
zinc finger E-box binding homeobox 1 |
| chr17_-_60142609 | 1.65 |
ENST00000397786.2
|
MED13
|
mediator complex subunit 13 |
| chr10_+_115674530 | 1.65 |
ENST00000451472.1
|
AL162407.1
|
CDNA FLJ20147 fis, clone COL07954; HCG1781466; Uncharacterized protein |
| chr6_+_4890226 | 1.64 |
ENST00000343762.5
|
CDYL
|
chromodomain protein, Y-like |
| chr6_-_53409890 | 1.61 |
ENST00000229416.6
|
GCLC
|
glutamate-cysteine ligase, catalytic subunit |
| chr1_+_112162381 | 1.60 |
ENST00000433097.1
ENST00000369709.3 ENST00000436150.2 |
RAP1A
|
RAP1A, member of RAS oncogene family |
| chr1_+_2985760 | 1.58 |
ENST00000378391.2
ENST00000514189.1 ENST00000270722.5 |
PRDM16
|
PR domain containing 16 |
| chr1_+_198126093 | 1.55 |
ENST00000367385.4
ENST00000442588.1 ENST00000538004.1 |
NEK7
|
NIMA-related kinase 7 |
| chr2_-_216300784 | 1.55 |
ENST00000421182.1
ENST00000432072.2 ENST00000323926.6 ENST00000336916.4 ENST00000357867.4 ENST00000359671.1 ENST00000346544.3 ENST00000345488.5 ENST00000357009.2 ENST00000446046.1 ENST00000356005.4 ENST00000443816.1 ENST00000426059.1 ENST00000354785.4 |
FN1
|
fibronectin 1 |
| chr10_+_93683519 | 1.54 |
ENST00000265990.6
|
BTAF1
|
BTAF1 RNA polymerase II, B-TFIID transcription factor-associated, 170kDa |
| chr4_-_66536057 | 1.54 |
ENST00000273854.3
|
EPHA5
|
EPH receptor A5 |
| chr2_-_40679186 | 1.53 |
ENST00000406785.2
|
SLC8A1
|
solute carrier family 8 (sodium/calcium exchanger), member 1 |
| chr2_+_208394616 | 1.53 |
ENST00000432329.2
ENST00000353267.3 ENST00000445803.1 |
CREB1
|
cAMP responsive element binding protein 1 |
| chr5_+_138940742 | 1.49 |
ENST00000398733.3
ENST00000253815.2 ENST00000505007.1 |
UBE2D2
|
ubiquitin-conjugating enzyme E2D 2 |
| chr1_-_217262969 | 1.47 |
ENST00000361525.3
|
ESRRG
|
estrogen-related receptor gamma |
| chr5_-_142783175 | 1.47 |
ENST00000231509.3
ENST00000394464.2 |
NR3C1
|
nuclear receptor subfamily 3, group C, member 1 (glucocorticoid receptor) |
| chr9_-_16870704 | 1.46 |
ENST00000380672.4
ENST00000380667.2 ENST00000380666.2 ENST00000486514.1 |
BNC2
|
basonuclin 2 |
| chr12_-_57505121 | 1.42 |
ENST00000538913.2
ENST00000537215.2 ENST00000454075.3 ENST00000554825.1 ENST00000553275.1 ENST00000300134.3 |
STAT6
|
signal transducer and activator of transcription 6, interleukin-4 induced |
| chr9_+_118916082 | 1.40 |
ENST00000328252.3
|
PAPPA
|
pregnancy-associated plasma protein A, pappalysin 1 |
| chr1_+_193091080 | 1.40 |
ENST00000367435.3
|
CDC73
|
cell division cycle 73 |
| chr12_+_121124599 | 1.40 |
ENST00000228506.3
|
MLEC
|
malectin |
| chr9_+_133454943 | 1.38 |
ENST00000319725.9
|
FUBP3
|
far upstream element (FUSE) binding protein 3 |
| chr6_-_139695757 | 1.38 |
ENST00000367651.2
|
CITED2
|
Cbp/p300-interacting transactivator, with Glu/Asp-rich carboxy-terminal domain, 2 |
| chr2_-_183903133 | 1.37 |
ENST00000361354.4
|
NCKAP1
|
NCK-associated protein 1 |
| chr6_+_143929307 | 1.36 |
ENST00000427704.2
ENST00000305766.6 |
PHACTR2
|
phosphatase and actin regulator 2 |
| chr20_-_48770244 | 1.35 |
ENST00000371650.5
ENST00000371652.4 ENST00000557021.1 |
TMEM189
|
transmembrane protein 189 |
| chr6_-_111804393 | 1.35 |
ENST00000368802.3
ENST00000368805.1 |
REV3L
|
REV3-like, polymerase (DNA directed), zeta, catalytic subunit |
| chr12_-_54069856 | 1.33 |
ENST00000602871.1
|
ATP5G2
|
ATP synthase, H+ transporting, mitochondrial Fo complex, subunit C2 (subunit 9) |
| chr2_-_225450013 | 1.33 |
ENST00000264414.4
|
CUL3
|
cullin 3 |
Network of associatons between targets according to the STRING database.

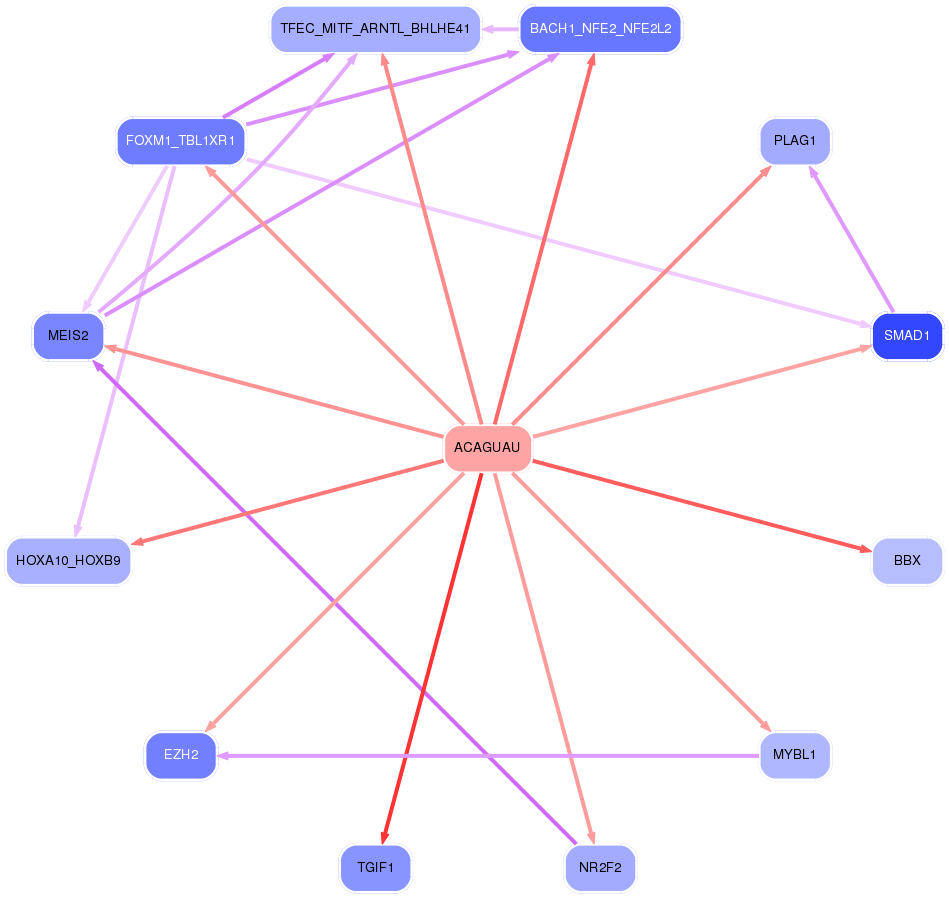
First level regulatory network of ACAGUAU
Gene Ontology Analysis
Gene overrepresentation in biological_process category:
| Log-likelihood per target | Total log-likelihood | Term | Description |
|---|---|---|---|
| 3.4 | 13.5 | GO:0002439 | chronic inflammatory response to antigenic stimulus(GO:0002439) |
| 2.8 | 11.1 | GO:0070358 | actin polymerization-dependent cell motility(GO:0070358) |
| 2.4 | 7.3 | GO:0002605 | negative regulation of antigen processing and presentation of peptide or polysaccharide antigen via MHC class II(GO:0002581) negative regulation of dendritic cell antigen processing and presentation(GO:0002605) |
| 2.4 | 7.2 | GO:0060447 | bud outgrowth involved in lung branching(GO:0060447) |
| 2.3 | 6.9 | GO:0002661 | B cell tolerance induction(GO:0002514) regulation of B cell tolerance induction(GO:0002661) positive regulation of B cell tolerance induction(GO:0002663) |
| 2.1 | 8.5 | GO:0009224 | CMP salvage(GO:0006238) CMP biosynthetic process(GO:0009224) CMP metabolic process(GO:0046035) |
| 2.1 | 2.1 | GO:0048377 | lateral mesodermal cell fate commitment(GO:0048372) lateral mesodermal cell fate specification(GO:0048377) regulation of lateral mesodermal cell fate specification(GO:0048378) |
| 2.0 | 5.9 | GO:0002184 | cytoplasmic translational termination(GO:0002184) |
| 1.9 | 15.3 | GO:0006348 | chromatin silencing at telomere(GO:0006348) |
| 1.7 | 5.0 | GO:0035509 | negative regulation of myosin-light-chain-phosphatase activity(GO:0035509) negative regulation of bicellular tight junction assembly(GO:1903347) |
| 1.7 | 6.7 | GO:1903984 | positive regulation of TRAIL-activated apoptotic signaling pathway(GO:1903984) |
| 1.4 | 9.8 | GO:0070934 | CRD-mediated mRNA stabilization(GO:0070934) |
| 1.4 | 5.5 | GO:1903786 | mycotoxin catabolic process(GO:0043387) aflatoxin catabolic process(GO:0046223) organic heteropentacyclic compound catabolic process(GO:1901377) regulation of glutathione biosynthetic process(GO:1903786) positive regulation of glutathione biosynthetic process(GO:1903788) |
| 1.3 | 3.9 | GO:0045210 | FasL biosynthetic process(GO:0045210) |
| 1.2 | 5.0 | GO:0072204 | cell-cell signaling involved in kidney development(GO:0060995) Wnt signaling pathway involved in kidney development(GO:0061289) canonical Wnt signaling pathway involved in metanephric kidney development(GO:0061290) cell-cell signaling involved in metanephros development(GO:0072204) |
| 1.2 | 9.8 | GO:0032926 | negative regulation of activin receptor signaling pathway(GO:0032926) |
| 1.2 | 4.8 | GO:1904398 | positive regulation of neuromuscular junction development(GO:1904398) |
| 1.2 | 2.4 | GO:2000645 | negative regulation of receptor catabolic process(GO:2000645) |
| 1.1 | 10.0 | GO:0035583 | sequestering of TGFbeta in extracellular matrix(GO:0035583) |
| 1.1 | 6.5 | GO:0060136 | embryonic process involved in female pregnancy(GO:0060136) |
| 1.1 | 4.3 | GO:0048861 | oncostatin-M-mediated signaling pathway(GO:0038165) leukemia inhibitory factor signaling pathway(GO:0048861) |
| 1.1 | 3.2 | GO:0090244 | Wnt signaling pathway involved in somitogenesis(GO:0090244) |
| 1.0 | 4.1 | GO:0033634 | positive regulation of cell-cell adhesion mediated by integrin(GO:0033634) |
| 0.9 | 2.8 | GO:0090283 | regulation of protein glycosylation in Golgi(GO:0090283) |
| 0.9 | 6.2 | GO:0090270 | fibroblast growth factor production(GO:0090269) regulation of fibroblast growth factor production(GO:0090270) |
| 0.9 | 3.5 | GO:1902544 | oxidative DNA demethylation(GO:0035511) regulation of DNA N-glycosylase activity(GO:1902544) |
| 0.9 | 8.8 | GO:0032000 | positive regulation of fatty acid beta-oxidation(GO:0032000) |
| 0.9 | 5.2 | GO:0044791 | modulation by host of viral release from host cell(GO:0044789) positive regulation by host of viral release from host cell(GO:0044791) |
| 0.9 | 5.1 | GO:0045629 | negative regulation of T-helper 2 cell differentiation(GO:0045629) |
| 0.8 | 3.4 | GO:0033632 | regulation of cell-cell adhesion mediated by integrin(GO:0033632) |
| 0.8 | 2.5 | GO:0016260 | selenocysteine biosynthetic process(GO:0016260) |
| 0.8 | 2.4 | GO:0036333 | hepatocyte homeostasis(GO:0036333) response to tetrachloromethane(GO:1904772) |
| 0.8 | 5.4 | GO:0071896 | negative regulation of hippo signaling(GO:0035331) protein localization to adherens junction(GO:0071896) |
| 0.7 | 0.7 | GO:0048369 | lateral mesoderm morphogenesis(GO:0048369) lateral mesoderm formation(GO:0048370) lateral mesodermal cell differentiation(GO:0048371) |
| 0.7 | 2.9 | GO:0044111 | development involved in symbiotic interaction(GO:0044111) |
| 0.7 | 3.6 | GO:1905098 | negative regulation of guanyl-nucleotide exchange factor activity(GO:1905098) |
| 0.7 | 1.4 | GO:0061428 | negative regulation of transcription from RNA polymerase II promoter in response to hypoxia(GO:0061428) |
| 0.7 | 3.3 | GO:0038026 | reelin-mediated signaling pathway(GO:0038026) |
| 0.7 | 2.0 | GO:0046726 | positive regulation by virus of viral protein levels in host cell(GO:0046726) |
| 0.7 | 2.6 | GO:0009956 | radial pattern formation(GO:0009956) |
| 0.6 | 8.8 | GO:0040016 | embryonic cleavage(GO:0040016) |
| 0.6 | 1.8 | GO:1904247 | positive regulation of polynucleotide adenylyltransferase activity(GO:1904247) |
| 0.6 | 1.8 | GO:0043006 | activation of phospholipase A2 activity by calcium-mediated signaling(GO:0043006) |
| 0.6 | 2.4 | GO:0046502 | uroporphyrinogen III biosynthetic process(GO:0006780) uroporphyrinogen III metabolic process(GO:0046502) |
| 0.5 | 1.1 | GO:0060849 | regulation of transcription involved in lymphatic endothelial cell fate commitment(GO:0060849) |
| 0.5 | 1.6 | GO:0097068 | response to thyroxine(GO:0097068) response to L-phenylalanine derivative(GO:1904386) |
| 0.5 | 1.6 | GO:0097327 | response to antineoplastic agent(GO:0097327) |
| 0.5 | 1.5 | GO:0052047 | interaction with other organism via secreted substance involved in symbiotic interaction(GO:0052047) |
| 0.5 | 7.2 | GO:0046852 | positive regulation of bone resorption(GO:0045780) positive regulation of bone remodeling(GO:0046852) |
| 0.5 | 2.0 | GO:1903778 | protein localization to vacuolar membrane(GO:1903778) |
| 0.5 | 2.0 | GO:0046116 | queuosine biosynthetic process(GO:0008616) queuosine metabolic process(GO:0046116) |
| 0.5 | 3.0 | GO:0051025 | negative regulation of mRNA cleavage(GO:0031438) negative regulation of immunoglobulin secretion(GO:0051025) negative regulation of ribonuclease activity(GO:0060701) negative regulation of endoribonuclease activity(GO:0060702) negative regulation of mRNA endonucleolytic cleavage involved in unfolded protein response(GO:1904721) |
| 0.5 | 5.4 | GO:0051451 | myoblast migration(GO:0051451) |
| 0.5 | 11.0 | GO:0032780 | negative regulation of ATPase activity(GO:0032780) |
| 0.5 | 3.3 | GO:0060011 | Sertoli cell proliferation(GO:0060011) |
| 0.5 | 2.8 | GO:0060613 | fat pad development(GO:0060613) |
| 0.5 | 2.7 | GO:0032468 | Golgi calcium ion homeostasis(GO:0032468) |
| 0.4 | 5.4 | GO:1901223 | negative regulation of NIK/NF-kappaB signaling(GO:1901223) |
| 0.4 | 2.2 | GO:0006893 | Golgi to plasma membrane transport(GO:0006893) |
| 0.4 | 4.4 | GO:0021957 | corticospinal tract morphogenesis(GO:0021957) |
| 0.4 | 1.3 | GO:0045659 | regulation of eosinophil differentiation(GO:0045643) positive regulation of eosinophil differentiation(GO:0045645) regulation of neutrophil differentiation(GO:0045658) negative regulation of neutrophil differentiation(GO:0045659) |
| 0.4 | 6.9 | GO:0000338 | protein deneddylation(GO:0000338) |
| 0.4 | 2.0 | GO:0071874 | cellular response to norepinephrine stimulus(GO:0071874) |
| 0.4 | 1.2 | GO:0090427 | activation of meiosis(GO:0090427) |
| 0.4 | 1.1 | GO:0051083 | 'de novo' cotranslational protein folding(GO:0051083) |
| 0.4 | 2.3 | GO:0035989 | tendon development(GO:0035989) |
| 0.4 | 5.5 | GO:0010839 | negative regulation of keratinocyte proliferation(GO:0010839) |
| 0.4 | 1.1 | GO:1901350 | cell-cell signaling involved in cell-cell junction organization(GO:1901350) |
| 0.4 | 1.4 | GO:0002296 | T-helper 1 cell lineage commitment(GO:0002296) |
| 0.4 | 2.1 | GO:0048280 | vesicle fusion with Golgi apparatus(GO:0048280) |
| 0.4 | 1.4 | GO:0051534 | negative regulation of NFAT protein import into nucleus(GO:0051534) |
| 0.3 | 1.0 | GO:0070634 | transepithelial ammonium transport(GO:0070634) |
| 0.3 | 3.4 | GO:2000601 | positive regulation of Arp2/3 complex-mediated actin nucleation(GO:2000601) |
| 0.3 | 1.0 | GO:0070460 | thyroid-stimulating hormone secretion(GO:0070460) regulation of thyroid-stimulating hormone secretion(GO:2000612) |
| 0.3 | 3.3 | GO:0010265 | SCF complex assembly(GO:0010265) |
| 0.3 | 1.3 | GO:1903691 | positive regulation of wound healing, spreading of epidermal cells(GO:1903691) |
| 0.3 | 0.6 | GO:0090611 | ubiquitin-independent protein catabolic process via the multivesicular body sorting pathway(GO:0090611) |
| 0.3 | 0.9 | GO:0070213 | protein auto-ADP-ribosylation(GO:0070213) |
| 0.3 | 2.1 | GO:1903551 | regulation of extracellular exosome assembly(GO:1903551) |
| 0.3 | 2.6 | GO:0001886 | endothelial cell morphogenesis(GO:0001886) |
| 0.3 | 0.9 | GO:0097368 | establishment of Sertoli cell barrier(GO:0097368) |
| 0.3 | 4.3 | GO:0000920 | cell separation after cytokinesis(GO:0000920) |
| 0.3 | 2.0 | GO:1900246 | positive regulation of RIG-I signaling pathway(GO:1900246) |
| 0.3 | 2.8 | GO:0051096 | positive regulation of helicase activity(GO:0051096) |
| 0.3 | 0.8 | GO:1901252 | regulation of intracellular transport of viral material(GO:1901252) |
| 0.3 | 7.4 | GO:0042276 | error-prone translesion synthesis(GO:0042276) |
| 0.3 | 8.4 | GO:0051016 | barbed-end actin filament capping(GO:0051016) |
| 0.3 | 5.1 | GO:0032060 | bleb assembly(GO:0032060) |
| 0.3 | 1.8 | GO:0021740 | trigeminal sensory nucleus development(GO:0021730) principal sensory nucleus of trigeminal nerve development(GO:0021740) negative regulation of epithelial cell proliferation involved in lung morphogenesis(GO:2000795) |
| 0.3 | 5.0 | GO:2000114 | regulation of establishment of cell polarity(GO:2000114) |
| 0.3 | 0.8 | GO:0090155 | glucosylceramide biosynthetic process(GO:0006679) negative regulation of sphingolipid biosynthetic process(GO:0090155) negative regulation of ceramide biosynthetic process(GO:1900060) |
| 0.3 | 1.0 | GO:1904059 | regulation of locomotor rhythm(GO:1904059) |
| 0.3 | 4.4 | GO:0051764 | actin crosslink formation(GO:0051764) |
| 0.3 | 2.3 | GO:0048386 | positive regulation of retinoic acid receptor signaling pathway(GO:0048386) |
| 0.3 | 2.0 | GO:0000715 | nucleotide-excision repair, DNA damage recognition(GO:0000715) |
| 0.3 | 1.5 | GO:0034670 | chemotaxis to arachidonic acid(GO:0034670) response to arachidonic acid(GO:1904550) |
| 0.3 | 0.8 | GO:0072137 | condensed mesenchymal cell proliferation(GO:0072137) |
| 0.2 | 11.8 | GO:0070534 | protein K63-linked ubiquitination(GO:0070534) |
| 0.2 | 1.2 | GO:0003408 | optic cup formation involved in camera-type eye development(GO:0003408) maintenance of chromatin silencing(GO:0006344) |
| 0.2 | 1.7 | GO:0045602 | negative regulation of endothelial cell differentiation(GO:0045602) |
| 0.2 | 3.5 | GO:0090557 | establishment of endothelial intestinal barrier(GO:0090557) |
| 0.2 | 0.9 | GO:0007538 | primary sex determination(GO:0007538) |
| 0.2 | 4.6 | GO:0089711 | L-glutamate transmembrane transport(GO:0089711) |
| 0.2 | 1.6 | GO:0090336 | positive regulation of brown fat cell differentiation(GO:0090336) |
| 0.2 | 1.6 | GO:0002051 | osteoblast fate commitment(GO:0002051) |
| 0.2 | 2.6 | GO:0033522 | histone H2A ubiquitination(GO:0033522) |
| 0.2 | 2.0 | GO:0010917 | negative regulation of mitochondrial membrane potential(GO:0010917) |
| 0.2 | 1.5 | GO:0098735 | positive regulation of the force of heart contraction(GO:0098735) |
| 0.2 | 0.8 | GO:0070562 | regulation of vitamin D receptor signaling pathway(GO:0070562) |
| 0.2 | 1.1 | GO:0007352 | zygotic specification of dorsal/ventral axis(GO:0007352) |
| 0.2 | 3.6 | GO:0060736 | prostate gland growth(GO:0060736) |
| 0.2 | 1.1 | GO:0007386 | compartment pattern specification(GO:0007386) |
| 0.2 | 1.3 | GO:0035166 | post-embryonic hemopoiesis(GO:0035166) |
| 0.2 | 0.5 | GO:0021540 | corpus callosum morphogenesis(GO:0021540) |
| 0.2 | 0.7 | GO:0090107 | aminophospholipid transport(GO:0015917) regulation of high-density lipoprotein particle assembly(GO:0090107) |
| 0.2 | 2.7 | GO:0060628 | regulation of ER to Golgi vesicle-mediated transport(GO:0060628) |
| 0.2 | 10.1 | GO:0000381 | regulation of alternative mRNA splicing, via spliceosome(GO:0000381) |
| 0.2 | 1.2 | GO:0086048 | membrane depolarization during bundle of His cell action potential(GO:0086048) |
| 0.2 | 3.1 | GO:0007084 | mitotic nuclear envelope reassembly(GO:0007084) |
| 0.2 | 0.6 | GO:0035720 | intraciliary anterograde transport(GO:0035720) |
| 0.2 | 1.5 | GO:0035562 | negative regulation of chromatin binding(GO:0035562) |
| 0.1 | 4.7 | GO:0009954 | proximal/distal pattern formation(GO:0009954) |
| 0.1 | 0.4 | GO:0045898 | regulation of RNA polymerase II transcriptional preinitiation complex assembly(GO:0045898) |
| 0.1 | 0.7 | GO:0072385 | minus-end-directed organelle transport along microtubule(GO:0072385) |
| 0.1 | 0.7 | GO:0007070 | negative regulation of transcription during mitosis(GO:0007068) negative regulation of transcription from RNA polymerase II promoter during mitosis(GO:0007070) |
| 0.1 | 0.9 | GO:0016584 | nucleosome positioning(GO:0016584) |
| 0.1 | 0.7 | GO:0035881 | amacrine cell differentiation(GO:0035881) |
| 0.1 | 0.9 | GO:0009755 | hormone-mediated signaling pathway(GO:0009755) steroid hormone mediated signaling pathway(GO:0043401) |
| 0.1 | 1.4 | GO:0001711 | endodermal cell fate commitment(GO:0001711) |
| 0.1 | 5.2 | GO:0035666 | TRIF-dependent toll-like receptor signaling pathway(GO:0035666) |
| 0.1 | 1.9 | GO:0097264 | self proteolysis(GO:0097264) |
| 0.1 | 0.6 | GO:0060665 | regulation of branching involved in salivary gland morphogenesis by mesenchymal-epithelial signaling(GO:0060665) |
| 0.1 | 2.6 | GO:0070935 | 3'-UTR-mediated mRNA stabilization(GO:0070935) |
| 0.1 | 7.2 | GO:0031640 | killing of cells of other organism(GO:0031640) disruption of cells of other organism(GO:0044364) |
| 0.1 | 1.3 | GO:0060340 | positive regulation of type I interferon-mediated signaling pathway(GO:0060340) |
| 0.1 | 3.0 | GO:0030208 | dermatan sulfate biosynthetic process(GO:0030208) |
| 0.1 | 0.7 | GO:1900748 | positive regulation of vascular endothelial growth factor signaling pathway(GO:1900748) |
| 0.1 | 0.3 | GO:0061386 | closure of optic fissure(GO:0061386) |
| 0.1 | 6.2 | GO:0060999 | positive regulation of dendritic spine development(GO:0060999) |
| 0.1 | 1.0 | GO:0036066 | protein O-linked fucosylation(GO:0036066) |
| 0.1 | 0.9 | GO:0003406 | retinal pigment epithelium development(GO:0003406) |
| 0.1 | 0.3 | GO:0000414 | regulation of histone H3-K36 methylation(GO:0000414) |
| 0.1 | 0.6 | GO:0015742 | alpha-ketoglutarate transport(GO:0015742) |
| 0.1 | 0.4 | GO:0006663 | platelet activating factor biosynthetic process(GO:0006663) |
| 0.1 | 0.7 | GO:0090481 | pyrimidine nucleotide-sugar transmembrane transport(GO:0090481) |
| 0.1 | 3.7 | GO:2000144 | positive regulation of DNA-templated transcription, initiation(GO:2000144) |
| 0.1 | 0.3 | GO:0045617 | negative regulation of keratinocyte differentiation(GO:0045617) |
| 0.1 | 0.9 | GO:0030183 | B cell differentiation(GO:0030183) |
| 0.1 | 0.5 | GO:0003344 | pericardium morphogenesis(GO:0003344) |
| 0.1 | 0.5 | GO:0017196 | N-terminal peptidyl-methionine acetylation(GO:0017196) |
| 0.1 | 0.4 | GO:0035973 | aggrephagy(GO:0035973) |
| 0.1 | 0.3 | GO:0071934 | thiamine transport(GO:0015888) thiamine transmembrane transport(GO:0071934) |
| 0.1 | 1.7 | GO:0042753 | positive regulation of circadian rhythm(GO:0042753) |
| 0.1 | 0.8 | GO:0061179 | negative regulation of insulin secretion involved in cellular response to glucose stimulus(GO:0061179) |
| 0.1 | 0.2 | GO:0060940 | epithelial to mesenchymal transition involved in cardiac fibroblast development(GO:0060940) |
| 0.1 | 2.3 | GO:0048846 | axon extension involved in axon guidance(GO:0048846) neuron projection extension involved in neuron projection guidance(GO:1902284) |
| 0.1 | 2.2 | GO:0031639 | plasminogen activation(GO:0031639) fibrinolysis(GO:0042730) |
| 0.1 | 0.4 | GO:0090050 | positive regulation of cell migration involved in sprouting angiogenesis(GO:0090050) |
| 0.1 | 3.1 | GO:1900449 | regulation of neurotransmitter receptor activity(GO:0099601) regulation of glutamate receptor signaling pathway(GO:1900449) |
| 0.1 | 1.1 | GO:0033147 | negative regulation of intracellular estrogen receptor signaling pathway(GO:0033147) |
| 0.1 | 3.5 | GO:0048009 | insulin-like growth factor receptor signaling pathway(GO:0048009) |
| 0.1 | 2.0 | GO:0007026 | negative regulation of microtubule depolymerization(GO:0007026) |
| 0.1 | 5.6 | GO:0045445 | myoblast differentiation(GO:0045445) |
| 0.1 | 1.1 | GO:0060009 | Sertoli cell development(GO:0060009) |
| 0.1 | 0.4 | GO:0035279 | mRNA cleavage involved in gene silencing by miRNA(GO:0035279) mRNA cleavage involved in gene silencing by siRNA(GO:0090625) mRNA cleavage involved in gene silencing(GO:0098795) |
| 0.1 | 1.5 | GO:0003416 | endochondral bone growth(GO:0003416) |
| 0.1 | 2.2 | GO:0006309 | apoptotic DNA fragmentation(GO:0006309) |
| 0.1 | 2.8 | GO:0035987 | endodermal cell differentiation(GO:0035987) |
| 0.1 | 2.9 | GO:0046039 | GTP metabolic process(GO:0046039) |
| 0.1 | 3.6 | GO:0031102 | neuron projection regeneration(GO:0031102) |
| 0.1 | 2.9 | GO:0001953 | negative regulation of cell-matrix adhesion(GO:0001953) |
| 0.1 | 0.8 | GO:0031274 | regulation of pseudopodium assembly(GO:0031272) positive regulation of pseudopodium assembly(GO:0031274) |
| 0.1 | 0.5 | GO:0001675 | acrosome assembly(GO:0001675) |
| 0.1 | 0.3 | GO:0009298 | GDP-mannose biosynthetic process(GO:0009298) |
| 0.1 | 0.2 | GO:1902938 | phospholipase C-activating G-protein coupled glutamate receptor signaling pathway(GO:0007206) regulation of intracellular calcium activated chloride channel activity(GO:1902938) |
| 0.1 | 0.4 | GO:0021521 | ventral spinal cord interneuron specification(GO:0021521) cell fate specification involved in pattern specification(GO:0060573) |
| 0.1 | 0.2 | GO:0007185 | transmembrane receptor protein tyrosine phosphatase signaling pathway(GO:0007185) |
| 0.1 | 2.1 | GO:0060612 | adipose tissue development(GO:0060612) |
| 0.1 | 0.9 | GO:0002643 | regulation of tolerance induction(GO:0002643) |
| 0.1 | 1.6 | GO:0055090 | acylglycerol homeostasis(GO:0055090) triglyceride homeostasis(GO:0070328) |
| 0.1 | 0.2 | GO:0010157 | response to chlorate(GO:0010157) |
| 0.1 | 0.9 | GO:0090161 | Golgi ribbon formation(GO:0090161) |
| 0.1 | 1.2 | GO:0043403 | skeletal muscle tissue regeneration(GO:0043403) |
| 0.1 | 0.2 | GO:0042986 | positive regulation of amyloid precursor protein biosynthetic process(GO:0042986) |
| 0.0 | 3.2 | GO:0045638 | negative regulation of myeloid cell differentiation(GO:0045638) |
| 0.0 | 1.1 | GO:0046475 | glycerophospholipid catabolic process(GO:0046475) |
| 0.0 | 2.9 | GO:0061178 | regulation of insulin secretion involved in cellular response to glucose stimulus(GO:0061178) |
| 0.0 | 0.7 | GO:0051491 | positive regulation of filopodium assembly(GO:0051491) |
| 0.0 | 0.7 | GO:0032354 | response to follicle-stimulating hormone(GO:0032354) |
| 0.0 | 0.6 | GO:0032331 | negative regulation of chondrocyte differentiation(GO:0032331) |
| 0.0 | 2.3 | GO:0005978 | glycogen biosynthetic process(GO:0005978) glucan biosynthetic process(GO:0009250) |
| 0.0 | 0.3 | GO:0035162 | embryonic hemopoiesis(GO:0035162) |
| 0.0 | 1.3 | GO:0042776 | mitochondrial ATP synthesis coupled proton transport(GO:0042776) |
| 0.0 | 1.3 | GO:0007129 | synapsis(GO:0007129) |
| 0.0 | 1.1 | GO:0046627 | negative regulation of insulin receptor signaling pathway(GO:0046627) |
| 0.0 | 0.7 | GO:0000042 | protein targeting to Golgi(GO:0000042) |
| 0.0 | 2.6 | GO:1900046 | regulation of blood coagulation(GO:0030193) regulation of hemostasis(GO:1900046) |
| 0.0 | 2.4 | GO:0035722 | interleukin-12-mediated signaling pathway(GO:0035722) cellular response to interleukin-12(GO:0071349) |
| 0.0 | 3.6 | GO:0051225 | spindle assembly(GO:0051225) |
| 0.0 | 3.6 | GO:0001837 | epithelial to mesenchymal transition(GO:0001837) |
| 0.0 | 2.6 | GO:0006695 | cholesterol biosynthetic process(GO:0006695) |
| 0.0 | 2.3 | GO:0075733 | intracellular transport of virus(GO:0075733) |
| 0.0 | 3.5 | GO:0035335 | peptidyl-tyrosine dephosphorylation(GO:0035335) |
| 0.0 | 0.7 | GO:0071549 | cellular response to dexamethasone stimulus(GO:0071549) |
| 0.0 | 5.0 | GO:0016573 | histone acetylation(GO:0016573) |
| 0.0 | 0.2 | GO:0033504 | floor plate development(GO:0033504) |
| 0.0 | 0.9 | GO:0006694 | steroid biosynthetic process(GO:0006694) |
| 0.0 | 0.9 | GO:0016579 | protein deubiquitination(GO:0016579) |
| 0.0 | 0.4 | GO:0042759 | long-chain fatty acid biosynthetic process(GO:0042759) |
| 0.0 | 0.4 | GO:0034605 | cellular response to heat(GO:0034605) |
| 0.0 | 0.1 | GO:0008090 | retrograde axonal transport(GO:0008090) |
| 0.0 | 3.4 | GO:0007156 | homophilic cell adhesion via plasma membrane adhesion molecules(GO:0007156) |
| 0.0 | 0.0 | GO:1901187 | regulation of ephrin receptor signaling pathway(GO:1901187) |
| 0.0 | 0.2 | GO:0051497 | negative regulation of actin filament bundle assembly(GO:0032232) negative regulation of stress fiber assembly(GO:0051497) |
| 0.0 | 2.4 | GO:0060071 | Wnt signaling pathway, planar cell polarity pathway(GO:0060071) regulation of establishment of planar polarity(GO:0090175) |
| 0.0 | 3.1 | GO:0030336 | negative regulation of cell migration(GO:0030336) |
| 0.0 | 2.8 | GO:0030308 | negative regulation of cell growth(GO:0030308) |
| 0.0 | 1.1 | GO:0021762 | substantia nigra development(GO:0021762) |
| 0.0 | 0.3 | GO:0016973 | poly(A)+ mRNA export from nucleus(GO:0016973) |
| 0.0 | 0.2 | GO:0072718 | response to cisplatin(GO:0072718) |
| 0.0 | 4.9 | GO:0006457 | protein folding(GO:0006457) |
| 0.0 | 1.0 | GO:0016925 | protein sumoylation(GO:0016925) |
| 0.0 | 0.8 | GO:0045454 | cell redox homeostasis(GO:0045454) |
| 0.0 | 0.1 | GO:0032455 | nerve growth factor processing(GO:0032455) |
| 0.0 | 0.1 | GO:0007064 | mitotic sister chromatid cohesion(GO:0007064) |
| 0.0 | 1.1 | GO:0008033 | tRNA processing(GO:0008033) |
| 0.0 | 0.2 | GO:0006123 | mitochondrial electron transport, cytochrome c to oxygen(GO:0006123) |
Gene overrepresentation in cellular_component category:
| Log-likelihood per target | Total log-likelihood | Term | Description |
|---|---|---|---|
| 2.5 | 7.6 | GO:0009330 | DNA topoisomerase complex (ATP-hydrolyzing)(GO:0009330) |
| 2.0 | 5.9 | GO:0018444 | translation release factor complex(GO:0018444) |
| 1.8 | 8.8 | GO:0005899 | insulin receptor complex(GO:0005899) |
| 1.2 | 8.4 | GO:0071203 | WASH complex(GO:0071203) |
| 1.1 | 7.8 | GO:0097452 | GAIT complex(GO:0097452) |
| 0.9 | 9.8 | GO:0005614 | interstitial matrix(GO:0005614) |
| 0.8 | 6.9 | GO:0070022 | transforming growth factor beta receptor homodimeric complex(GO:0070022) |
| 0.7 | 11.1 | GO:0017146 | NMDA selective glutamate receptor complex(GO:0017146) |
| 0.7 | 9.3 | GO:1990712 | HFE-transferrin receptor complex(GO:1990712) |
| 0.7 | 2.1 | GO:0033565 | ESCRT-0 complex(GO:0033565) |
| 0.7 | 8.8 | GO:0005577 | fibrinogen complex(GO:0005577) |
| 0.6 | 1.9 | GO:0030289 | protein phosphatase 4 complex(GO:0030289) |
| 0.6 | 14.7 | GO:0016580 | Sin3 complex(GO:0016580) |
| 0.6 | 1.8 | GO:0097489 | multivesicular body, internal vesicle lumen(GO:0097489) |
| 0.6 | 3.0 | GO:0035370 | UBC13-UEV1A complex(GO:0035370) |
| 0.6 | 6.5 | GO:0044233 | ER-mitochondrion membrane contact site(GO:0044233) |
| 0.6 | 6.7 | GO:0035749 | myelin sheath adaxonal region(GO:0035749) |
| 0.5 | 9.6 | GO:0005671 | Ada2/Gcn5/Ada3 transcription activator complex(GO:0005671) |
| 0.5 | 2.6 | GO:0033503 | HULC complex(GO:0033503) |
| 0.5 | 2.8 | GO:0030532 | small nuclear ribonucleoprotein complex(GO:0030532) |
| 0.5 | 10.0 | GO:0043205 | microfibril(GO:0001527) fibril(GO:0043205) |
| 0.4 | 3.9 | GO:0016593 | Cdc73/Paf1 complex(GO:0016593) |
| 0.4 | 5.5 | GO:0005641 | nuclear envelope lumen(GO:0005641) |
| 0.3 | 5.6 | GO:0043073 | germ cell nucleus(GO:0043073) |
| 0.3 | 7.9 | GO:0032156 | septin cytoskeleton(GO:0032156) |
| 0.3 | 4.9 | GO:0090543 | Flemming body(GO:0090543) |
| 0.3 | 1.3 | GO:0097135 | cyclin E2-CDK2 complex(GO:0097135) |
| 0.3 | 4.9 | GO:0005652 | nuclear lamina(GO:0005652) |
| 0.3 | 0.9 | GO:0031213 | RSF complex(GO:0031213) |
| 0.3 | 5.0 | GO:0032059 | bleb(GO:0032059) |
| 0.3 | 0.8 | GO:0019034 | viral replication complex(GO:0019034) |
| 0.3 | 2.4 | GO:0098645 | network-forming collagen trimer(GO:0098642) collagen network(GO:0098645) |
| 0.3 | 2.0 | GO:0031465 | Cul4B-RING E3 ubiquitin ligase complex(GO:0031465) |
| 0.2 | 3.4 | GO:0031209 | SCAR complex(GO:0031209) |
| 0.2 | 1.9 | GO:0070937 | CRD-mediated mRNA stability complex(GO:0070937) |
| 0.2 | 1.5 | GO:1990589 | ATF4-CREB1 transcription factor complex(GO:1990589) |
| 0.2 | 2.8 | GO:0097136 | Bcl-2 family protein complex(GO:0097136) |
| 0.2 | 5.2 | GO:0002080 | acrosomal membrane(GO:0002080) |
| 0.2 | 2.3 | GO:0036513 | Derlin-1 retrotranslocation complex(GO:0036513) |
| 0.2 | 4.0 | GO:0044453 | integral component of nuclear inner membrane(GO:0005639) intrinsic component of nuclear inner membrane(GO:0031229) nuclear membrane part(GO:0044453) |
| 0.2 | 0.8 | GO:0005726 | perichromatin fibrils(GO:0005726) |
| 0.2 | 2.9 | GO:0000346 | transcription export complex(GO:0000346) |
| 0.2 | 2.3 | GO:0005583 | fibrillar collagen trimer(GO:0005583) banded collagen fibril(GO:0098643) |
| 0.2 | 2.3 | GO:0097470 | ribbon synapse(GO:0097470) |
| 0.2 | 2.4 | GO:0045120 | pronucleus(GO:0045120) |
| 0.2 | 2.9 | GO:0031235 | intrinsic component of the cytoplasmic side of the plasma membrane(GO:0031235) |
| 0.2 | 1.8 | GO:0044300 | cerebellar mossy fiber(GO:0044300) |
| 0.2 | 9.9 | GO:0010494 | cytoplasmic stress granule(GO:0010494) |
| 0.1 | 1.3 | GO:0005827 | polar microtubule(GO:0005827) |
| 0.1 | 4.0 | GO:1902562 | NuA4 histone acetyltransferase complex(GO:0035267) H4/H2A histone acetyltransferase complex(GO:0043189) H4 histone acetyltransferase complex(GO:1902562) |
| 0.1 | 1.7 | GO:0042405 | nuclear inclusion body(GO:0042405) |
| 0.1 | 0.5 | GO:0031417 | NatC complex(GO:0031417) |
| 0.1 | 1.3 | GO:0042575 | DNA polymerase complex(GO:0042575) |
| 0.1 | 6.9 | GO:0008180 | COP9 signalosome(GO:0008180) |
| 0.1 | 4.8 | GO:0005605 | basal lamina(GO:0005605) |
| 0.1 | 16.5 | GO:0000784 | nuclear chromosome, telomeric region(GO:0000784) |
| 0.1 | 2.1 | GO:0042588 | zymogen granule(GO:0042588) |
| 0.1 | 14.9 | GO:0005913 | cell-cell adherens junction(GO:0005913) |
| 0.1 | 2.9 | GO:0005697 | telomerase holoenzyme complex(GO:0005697) |
| 0.1 | 0.4 | GO:0034274 | Atg12-Atg5-Atg16 complex(GO:0034274) |
| 0.1 | 2.6 | GO:0071564 | npBAF complex(GO:0071564) |
| 0.1 | 3.3 | GO:0034385 | very-low-density lipoprotein particle(GO:0034361) triglyceride-rich lipoprotein particle(GO:0034385) |
| 0.1 | 15.0 | GO:0048770 | melanosome(GO:0042470) pigment granule(GO:0048770) |
| 0.1 | 2.9 | GO:0016327 | apicolateral plasma membrane(GO:0016327) |
| 0.1 | 2.7 | GO:0016328 | lateral plasma membrane(GO:0016328) |
| 0.1 | 3.4 | GO:0030027 | lamellipodium(GO:0030027) |
| 0.1 | 1.6 | GO:0090665 | dystrophin-associated glycoprotein complex(GO:0016010) glycoprotein complex(GO:0090665) |
| 0.1 | 2.1 | GO:0031528 | microvillus membrane(GO:0031528) |
| 0.1 | 0.7 | GO:0005642 | annulate lamellae(GO:0005642) |
| 0.1 | 2.7 | GO:0000159 | protein phosphatase type 2A complex(GO:0000159) |
| 0.1 | 2.3 | GO:0042101 | T cell receptor complex(GO:0042101) |
| 0.1 | 1.3 | GO:0000276 | mitochondrial proton-transporting ATP synthase complex, coupling factor F(o)(GO:0000276) |
| 0.1 | 1.1 | GO:0030426 | growth cone(GO:0030426) |
| 0.1 | 14.4 | GO:0005681 | spliceosomal complex(GO:0005681) |
| 0.1 | 1.6 | GO:0071141 | SMAD protein complex(GO:0071141) |
| 0.1 | 4.0 | GO:0005801 | cis-Golgi network(GO:0005801) |
| 0.1 | 0.5 | GO:0005818 | astral microtubule(GO:0000235) aster(GO:0005818) |
| 0.1 | 5.5 | GO:0005791 | rough endoplasmic reticulum(GO:0005791) |
| 0.1 | 3.3 | GO:0035577 | azurophil granule membrane(GO:0035577) |
| 0.1 | 2.0 | GO:0000421 | autophagosome membrane(GO:0000421) |
| 0.1 | 1.9 | GO:0031258 | lamellipodium membrane(GO:0031258) |
| 0.1 | 4.7 | GO:0043657 | host(GO:0018995) host cell(GO:0043657) |
| 0.1 | 0.9 | GO:0044295 | axonal growth cone(GO:0044295) |
| 0.1 | 4.7 | GO:0030175 | filopodium(GO:0030175) |
| 0.1 | 3.0 | GO:0055038 | recycling endosome membrane(GO:0055038) |
| 0.0 | 2.3 | GO:0005604 | basement membrane(GO:0005604) |
| 0.0 | 0.4 | GO:0035068 | micro-ribonucleoprotein complex(GO:0035068) |
| 0.0 | 0.3 | GO:1990909 | Wnt signalosome(GO:1990909) |
| 0.0 | 1.2 | GO:0097228 | sperm principal piece(GO:0097228) |
| 0.0 | 3.6 | GO:0017053 | transcriptional repressor complex(GO:0017053) |
| 0.0 | 0.8 | GO:0031588 | nucleotide-activated protein kinase complex(GO:0031588) |
| 0.0 | 0.5 | GO:0090544 | BAF-type complex(GO:0090544) |
| 0.0 | 1.7 | GO:0001669 | acrosomal vesicle(GO:0001669) |
| 0.0 | 0.9 | GO:0031092 | platelet alpha granule membrane(GO:0031092) |
| 0.0 | 5.7 | GO:0101002 | ficolin-1-rich granule(GO:0101002) ficolin-1-rich granule lumen(GO:1904813) |
| 0.0 | 1.5 | GO:0043198 | dendritic shaft(GO:0043198) |
| 0.0 | 0.7 | GO:0034364 | high-density lipoprotein particle(GO:0034364) |
| 0.0 | 1.0 | GO:0016592 | mediator complex(GO:0016592) |
| 0.0 | 2.9 | GO:0035579 | specific granule membrane(GO:0035579) |
| 0.0 | 3.0 | GO:0005796 | Golgi lumen(GO:0005796) |
| 0.0 | 2.0 | GO:0005901 | caveola(GO:0005901) |
| 0.0 | 0.4 | GO:0035102 | PRC1 complex(GO:0035102) |
| 0.0 | 2.1 | GO:0032580 | Golgi cisterna membrane(GO:0032580) |
| 0.0 | 0.6 | GO:0097542 | ciliary tip(GO:0097542) |
| 0.0 | 7.1 | GO:0005819 | spindle(GO:0005819) |
| 0.0 | 0.5 | GO:0001772 | immunological synapse(GO:0001772) |
| 0.0 | 1.2 | GO:0016529 | sarcoplasmic reticulum(GO:0016529) |
| 0.0 | 1.1 | GO:0042645 | nucleoid(GO:0009295) mitochondrial nucleoid(GO:0042645) |
| 0.0 | 9.5 | GO:0000785 | chromatin(GO:0000785) |
| 0.0 | 0.2 | GO:0005751 | mitochondrial respiratory chain complex IV(GO:0005751) |
| 0.0 | 0.5 | GO:0005763 | organellar small ribosomal subunit(GO:0000314) mitochondrial small ribosomal subunit(GO:0005763) |
| 0.0 | 1.2 | GO:0031093 | platelet alpha granule lumen(GO:0031093) |
| 0.0 | 1.0 | GO:0031463 | Cul3-RING ubiquitin ligase complex(GO:0031463) |
| 0.0 | 2.4 | GO:0043209 | myelin sheath(GO:0043209) |
| 0.0 | 1.3 | GO:0016459 | myosin complex(GO:0016459) |
| 0.0 | 1.5 | GO:0031901 | early endosome membrane(GO:0031901) |
| 0.0 | 0.8 | GO:0005798 | Golgi-associated vesicle(GO:0005798) |
| 0.0 | 2.3 | GO:0072562 | blood microparticle(GO:0072562) |
| 0.0 | 4.5 | GO:0005667 | transcription factor complex(GO:0005667) |
| 0.0 | 2.6 | GO:0005788 | endoplasmic reticulum lumen(GO:0005788) |
| 0.0 | 1.8 | GO:0005802 | trans-Golgi network(GO:0005802) |
| 0.0 | 0.8 | GO:0005778 | peroxisomal membrane(GO:0005778) microbody membrane(GO:0031903) |
| 0.0 | 0.0 | GO:0031466 | Cul5-RING ubiquitin ligase complex(GO:0031466) |
| 0.0 | 0.9 | GO:0016605 | PML body(GO:0016605) |
Gene overrepresentation in molecular_function category:
| Log-likelihood per target | Total log-likelihood | Term | Description |
|---|---|---|---|
| 2.9 | 8.7 | GO:0015091 | ferric iron transmembrane transporter activity(GO:0015091) trivalent inorganic cation transmembrane transporter activity(GO:0072510) |
| 2.4 | 7.3 | GO:0070052 | collagen V binding(GO:0070052) |
| 2.3 | 13.5 | GO:0004013 | adenosylhomocysteinase activity(GO:0004013) trialkylsulfonium hydrolase activity(GO:0016802) |
| 2.2 | 6.7 | GO:0016314 | phosphatidylinositol-3,4,5-trisphosphate 3-phosphatase activity(GO:0016314) |
| 1.9 | 5.8 | GO:0061505 | DNA topoisomerase type II (ATP-hydrolyzing) activity(GO:0003918) DNA topoisomerase II activity(GO:0061505) |
| 1.9 | 5.6 | GO:0001069 | regulatory region RNA binding(GO:0001069) |
| 1.7 | 6.9 | GO:0005026 | transforming growth factor beta receptor activity, type II(GO:0005026) |
| 1.4 | 4.3 | GO:0004924 | oncostatin-M receptor activity(GO:0004924) |
| 1.3 | 4.0 | GO:0050613 | delta14-sterol reductase activity(GO:0050613) |
| 1.2 | 10.0 | GO:0030023 | extracellular matrix constituent conferring elasticity(GO:0030023) |
| 1.2 | 8.5 | GO:0004849 | uridine kinase activity(GO:0004849) |
| 1.2 | 3.5 | GO:0043739 | G/U mismatch-specific uracil-DNA glycosylase activity(GO:0043739) |
| 1.1 | 5.5 | GO:0005294 | neutral L-amino acid secondary active transmembrane transporter activity(GO:0005294) |
| 1.0 | 5.9 | GO:0003747 | translation release factor activity(GO:0003747) translation termination factor activity(GO:0008079) |
| 1.0 | 9.8 | GO:0045545 | syndecan binding(GO:0045545) |
| 0.9 | 15.3 | GO:0017049 | GTP-Rho binding(GO:0017049) |
| 0.8 | 1.7 | GO:0001228 | transcriptional activator activity, RNA polymerase II transcription regulatory region sequence-specific binding(GO:0001228) |
| 0.8 | 3.3 | GO:0038025 | glycoprotein transporter activity(GO:0034437) reelin receptor activity(GO:0038025) |
| 0.8 | 2.5 | GO:0004756 | selenide, water dikinase activity(GO:0004756) phosphotransferase activity, paired acceptors(GO:0016781) |
| 0.8 | 2.4 | GO:0004775 | succinate-CoA ligase (ADP-forming) activity(GO:0004775) |
| 0.7 | 16.7 | GO:0043395 | heparan sulfate proteoglycan binding(GO:0043395) |
| 0.7 | 15.3 | GO:0010485 | H4 histone acetyltransferase activity(GO:0010485) |
| 0.5 | 1.5 | GO:0099580 | ion antiporter activity involved in regulation of postsynaptic membrane potential(GO:0099580) |
| 0.5 | 3.0 | GO:0060698 | endoribonuclease inhibitor activity(GO:0060698) |
| 0.5 | 11.0 | GO:0098641 | cadherin binding involved in cell-cell adhesion(GO:0098641) |
| 0.5 | 6.5 | GO:0031957 | very long-chain fatty acid-CoA ligase activity(GO:0031957) |
| 0.5 | 1.8 | GO:0048408 | epidermal growth factor binding(GO:0048408) |
| 0.4 | 12.9 | GO:0070410 | co-SMAD binding(GO:0070410) |
| 0.4 | 1.7 | GO:0004666 | prostaglandin-endoperoxide synthase activity(GO:0004666) arachidonate 15-lipoxygenase activity(GO:0050473) |
| 0.4 | 2.9 | GO:0050815 | phosphoserine binding(GO:0050815) |
| 0.4 | 2.0 | GO:0008479 | queuine tRNA-ribosyltransferase activity(GO:0008479) |
| 0.4 | 7.0 | GO:0005068 | transmembrane receptor protein tyrosine kinase adaptor activity(GO:0005068) |
| 0.4 | 16.2 | GO:0061631 | ubiquitin conjugating enzyme activity(GO:0061631) |
| 0.3 | 2.1 | GO:0098821 | BMP receptor activity(GO:0098821) |
| 0.3 | 2.3 | GO:0016618 | hydroxypyruvate reductase activity(GO:0016618) glyoxylate reductase (NADP) activity(GO:0030267) |
| 0.3 | 1.3 | GO:0031208 | POZ domain binding(GO:0031208) |
| 0.3 | 3.5 | GO:0031995 | insulin-like growth factor II binding(GO:0031995) |
| 0.3 | 1.9 | GO:0022833 | mechanically-gated ion channel activity(GO:0008381) mechanically gated channel activity(GO:0022833) |
| 0.3 | 3.4 | GO:0098505 | G-rich strand telomeric DNA binding(GO:0098505) |
| 0.3 | 6.6 | GO:0004707 | MAP kinase activity(GO:0004707) |
| 0.3 | 1.5 | GO:0038051 | glucocorticoid receptor activity(GO:0004883) glucocorticoid-activated RNA polymerase II transcription factor binding transcription factor activity(GO:0038051) |
| 0.3 | 1.7 | GO:0003917 | DNA topoisomerase activity(GO:0003916) DNA topoisomerase type I activity(GO:0003917) |
| 0.3 | 3.4 | GO:1990247 | N6-methyladenosine-containing RNA binding(GO:1990247) |
| 0.3 | 2.0 | GO:0051425 | PTB domain binding(GO:0051425) |
| 0.3 | 1.1 | GO:0008889 | glycerophosphodiester phosphodiesterase activity(GO:0008889) |
| 0.3 | 2.4 | GO:0070878 | primary miRNA binding(GO:0070878) |
| 0.3 | 0.8 | GO:0047322 | [hydroxymethylglutaryl-CoA reductase (NADPH)] kinase activity(GO:0047322) [acetyl-CoA carboxylase] kinase activity(GO:0050405) |
| 0.3 | 5.0 | GO:0008327 | methyl-CpG binding(GO:0008327) |
| 0.2 | 2.5 | GO:0050693 | LBD domain binding(GO:0050693) |
| 0.2 | 2.9 | GO:0031821 | G-protein coupled serotonin receptor binding(GO:0031821) |
| 0.2 | 0.7 | GO:0030226 | apolipoprotein receptor activity(GO:0030226) apolipoprotein A-I receptor activity(GO:0034188) phosphatidylserine-translocating ATPase activity(GO:0090556) |
| 0.2 | 10.3 | GO:0031492 | nucleosomal DNA binding(GO:0031492) |
| 0.2 | 2.7 | GO:1904264 | ubiquitin protein ligase activity involved in ERAD pathway(GO:1904264) |
| 0.2 | 5.8 | GO:0008143 | poly(A) binding(GO:0008143) |
| 0.2 | 1.2 | GO:0086007 | voltage-gated calcium channel activity involved in cardiac muscle cell action potential(GO:0086007) |
| 0.2 | 1.5 | GO:1990763 | arrestin family protein binding(GO:1990763) |
| 0.2 | 1.1 | GO:0061649 | ubiquitinated histone binding(GO:0061649) |
| 0.2 | 2.4 | GO:0052629 | phosphatidylinositol-3,5-bisphosphate 3-phosphatase activity(GO:0052629) |
| 0.2 | 1.1 | GO:0008269 | JAK pathway signal transduction adaptor activity(GO:0008269) |
| 0.2 | 3.9 | GO:0042813 | Wnt-activated receptor activity(GO:0042813) |
| 0.2 | 1.9 | GO:0001135 | transcription factor activity, RNA polymerase II transcription factor recruiting(GO:0001135) |
| 0.2 | 3.3 | GO:0051400 | BH domain binding(GO:0051400) |
| 0.2 | 0.7 | GO:0034046 | poly(G) binding(GO:0034046) |
| 0.2 | 3.1 | GO:0048156 | tau protein binding(GO:0048156) |
| 0.2 | 11.6 | GO:0048365 | Rac GTPase binding(GO:0048365) |
| 0.2 | 2.3 | GO:0019870 | potassium channel inhibitor activity(GO:0019870) |
| 0.2 | 2.2 | GO:0042043 | neurexin family protein binding(GO:0042043) |
| 0.2 | 1.5 | GO:0005005 | transmembrane-ephrin receptor activity(GO:0005005) |
| 0.2 | 0.8 | GO:0034056 | estrogen response element binding(GO:0034056) |
| 0.1 | 6.6 | GO:0001205 | transcriptional activator activity, RNA polymerase II distal enhancer sequence-specific binding(GO:0001205) |
| 0.1 | 1.0 | GO:0004996 | thyroid-stimulating hormone receptor activity(GO:0004996) |
| 0.1 | 1.6 | GO:0017034 | Rap guanyl-nucleotide exchange factor activity(GO:0017034) |
| 0.1 | 1.1 | GO:0004726 | non-membrane spanning protein tyrosine phosphatase activity(GO:0004726) |
| 0.1 | 0.3 | GO:0042799 | histone methyltransferase activity (H4-K20 specific)(GO:0042799) |
| 0.1 | 0.6 | GO:0005310 | dicarboxylic acid transmembrane transporter activity(GO:0005310) |
| 0.1 | 3.0 | GO:0005540 | hyaluronic acid binding(GO:0005540) |
| 0.1 | 1.2 | GO:0034452 | dynactin binding(GO:0034452) |
| 0.1 | 3.8 | GO:0017025 | TBP-class protein binding(GO:0017025) |
| 0.1 | 3.2 | GO:0030159 | receptor signaling complex scaffold activity(GO:0030159) |
| 0.1 | 5.1 | GO:0030971 | receptor tyrosine kinase binding(GO:0030971) |
| 0.1 | 2.0 | GO:0031491 | nucleosome binding(GO:0031491) |
| 0.1 | 0.7 | GO:0015165 | pyrimidine nucleotide-sugar transmembrane transporter activity(GO:0015165) |
| 0.1 | 0.8 | GO:0008266 | poly(U) RNA binding(GO:0008266) |
| 0.1 | 0.3 | GO:0015234 | thiamine transmembrane transporter activity(GO:0015234) thiamine uptake transmembrane transporter activity(GO:0015403) |
| 0.1 | 3.8 | GO:0005080 | protein kinase C binding(GO:0005080) |
| 0.1 | 2.0 | GO:0008157 | protein phosphatase 1 binding(GO:0008157) |
| 0.1 | 4.0 | GO:0017112 | Rab guanyl-nucleotide exchange factor activity(GO:0017112) |
| 0.1 | 5.5 | GO:0019003 | GDP binding(GO:0019003) |
| 0.1 | 3.3 | GO:0008138 | protein tyrosine/serine/threonine phosphatase activity(GO:0008138) |
| 0.1 | 3.6 | GO:0035255 | ionotropic glutamate receptor binding(GO:0035255) |
| 0.1 | 1.0 | GO:0015377 | cation:chloride symporter activity(GO:0015377) |
| 0.1 | 2.6 | GO:0001972 | retinoic acid binding(GO:0001972) |
| 0.1 | 1.6 | GO:0016881 | acid-amino acid ligase activity(GO:0016881) |
| 0.1 | 0.5 | GO:0004596 | peptide alpha-N-acetyltransferase activity(GO:0004596) |
| 0.1 | 0.9 | GO:0003708 | retinoic acid receptor activity(GO:0003708) |
| 0.1 | 3.0 | GO:0050699 | WW domain binding(GO:0050699) |
| 0.1 | 1.3 | GO:0031434 | mitogen-activated protein kinase kinase binding(GO:0031434) |
| 0.1 | 1.8 | GO:0005388 | calcium-transporting ATPase activity(GO:0005388) |
| 0.1 | 3.0 | GO:0042826 | histone deacetylase binding(GO:0042826) |
| 0.1 | 0.6 | GO:0030620 | U2 snRNA binding(GO:0030620) |
| 0.1 | 25.5 | GO:0045296 | cadherin binding(GO:0045296) |
| 0.1 | 0.9 | GO:0033558 | histone deacetylase activity(GO:0004407) protein deacetylase activity(GO:0033558) |
| 0.1 | 0.3 | GO:0001162 | RNA polymerase II intronic transcription regulatory region sequence-specific DNA binding(GO:0001162) |
| 0.1 | 0.6 | GO:0031386 | protein tag(GO:0031386) |
| 0.1 | 4.6 | GO:0003684 | damaged DNA binding(GO:0003684) |
| 0.1 | 1.3 | GO:0016538 | cyclin-dependent protein serine/threonine kinase regulator activity(GO:0016538) |
| 0.1 | 1.4 | GO:0000993 | RNA polymerase II core binding(GO:0000993) |
| 0.0 | 1.3 | GO:0046933 | proton-transporting ATP synthase activity, rotational mechanism(GO:0046933) |
| 0.0 | 1.9 | GO:0008139 | nuclear localization sequence binding(GO:0008139) |
| 0.0 | 3.4 | GO:0008013 | beta-catenin binding(GO:0008013) |
| 0.0 | 1.2 | GO:0000062 | fatty-acyl-CoA binding(GO:0000062) |
| 0.0 | 1.7 | GO:0046966 | thyroid hormone receptor binding(GO:0046966) |
| 0.0 | 2.7 | GO:0003697 | single-stranded DNA binding(GO:0003697) |
| 0.0 | 1.4 | GO:0004864 | protein phosphatase inhibitor activity(GO:0004864) |
| 0.0 | 0.9 | GO:0004709 | MAP kinase kinase kinase activity(GO:0004709) |
| 0.0 | 0.2 | GO:0015111 | iodide transmembrane transporter activity(GO:0015111) |
| 0.0 | 0.4 | GO:0047498 | calcium-dependent phospholipase A2 activity(GO:0047498) |
| 0.0 | 1.1 | GO:0070063 | RNA polymerase binding(GO:0070063) |
| 0.0 | 1.3 | GO:0046875 | ephrin receptor binding(GO:0046875) |
| 0.0 | 1.3 | GO:0000146 | microfilament motor activity(GO:0000146) |
| 0.0 | 2.1 | GO:0003727 | single-stranded RNA binding(GO:0003727) |
| 0.0 | 0.8 | GO:0070402 | NADPH binding(GO:0070402) |
| 0.0 | 5.3 | GO:0005178 | integrin binding(GO:0005178) |
| 0.0 | 1.1 | GO:0051059 | NF-kappaB binding(GO:0051059) |
| 0.0 | 4.6 | GO:0004386 | helicase activity(GO:0004386) |
| 0.0 | 1.6 | GO:0035064 | methylated histone binding(GO:0035064) |
| 0.0 | 0.2 | GO:0097108 | hedgehog family protein binding(GO:0097108) |
| 0.0 | 0.4 | GO:0003831 | beta-N-acetylglucosaminylglycopeptide beta-1,4-galactosyltransferase activity(GO:0003831) |
| 0.0 | 2.0 | GO:0017022 | myosin binding(GO:0017022) |
| 0.0 | 0.2 | GO:0032454 | histone demethylase activity (H3-K9 specific)(GO:0032454) |
| 0.0 | 1.4 | GO:0032947 | protein complex scaffold(GO:0032947) |
| 0.0 | 2.1 | GO:0019905 | syntaxin binding(GO:0019905) |
| 0.0 | 1.3 | GO:0008408 | 3'-5' exonuclease activity(GO:0008408) |
| 0.0 | 1.0 | GO:0004198 | calcium-dependent cysteine-type endopeptidase activity(GO:0004198) |
| 0.0 | 0.9 | GO:0003950 | NAD+ ADP-ribosyltransferase activity(GO:0003950) |
| 0.0 | 2.2 | GO:0005201 | extracellular matrix structural constituent(GO:0005201) |
| 0.0 | 1.7 | GO:0050839 | cell adhesion molecule binding(GO:0050839) |
| 0.0 | 6.0 | GO:0003714 | transcription corepressor activity(GO:0003714) |
| 0.0 | 0.2 | GO:0099583 | neurotransmitter receptor activity involved in regulation of postsynaptic cytosolic calcium ion concentration(GO:0099583) |
| 0.0 | 2.3 | GO:0004553 | hydrolase activity, hydrolyzing O-glycosyl compounds(GO:0004553) |
| 0.0 | 2.8 | GO:0005179 | hormone activity(GO:0005179) |
| 0.0 | 0.3 | GO:0016868 | intramolecular transferase activity, phosphotransferases(GO:0016868) |
| 0.0 | 0.6 | GO:0008536 | Ran GTPase binding(GO:0008536) |
| 0.0 | 1.0 | GO:0005518 | collagen binding(GO:0005518) |
| 0.0 | 0.6 | GO:0042056 | chemoattractant activity(GO:0042056) |
| 0.0 | 1.2 | GO:0019903 | protein phosphatase binding(GO:0019903) |
| 0.0 | 0.5 | GO:0018024 | histone-lysine N-methyltransferase activity(GO:0018024) |
| 0.0 | 0.3 | GO:0070006 | metalloaminopeptidase activity(GO:0070006) |
| 0.0 | 0.7 | GO:0030145 | manganese ion binding(GO:0030145) |
| 0.0 | 0.2 | GO:0008353 | RNA polymerase II carboxy-terminal domain kinase activity(GO:0008353) |
| 0.0 | 0.6 | GO:0003707 | steroid hormone receptor activity(GO:0003707) |
| 0.0 | 2.0 | GO:0001227 | transcriptional repressor activity, RNA polymerase II transcription regulatory region sequence-specific binding(GO:0001227) |
Gene overrepresentation in C2:CP category:
| Log-likelihood per target | Total log-likelihood | Term | Description |
|---|---|---|---|
| 0.4 | 1.7 | PID S1P S1P1 PATHWAY | S1P1 pathway |
| 0.4 | 29.0 | PID INTEGRIN3 PATHWAY | Beta3 integrin cell surface interactions |
| 0.3 | 10.0 | PID S1P S1P2 PATHWAY | S1P2 pathway |
| 0.3 | 4.7 | PID THROMBIN PAR4 PATHWAY | PAR4-mediated thrombin signaling events |
| 0.2 | 8.1 | PID SYNDECAN 2 PATHWAY | Syndecan-2-mediated signaling events |
| 0.2 | 12.4 | PID SYNDECAN 1 PATHWAY | Syndecan-1-mediated signaling events |
| 0.2 | 14.3 | PID BMP PATHWAY | BMP receptor signaling |
| 0.2 | 13.0 | PID ECADHERIN NASCENT AJ PATHWAY | E-cadherin signaling in the nascent adherens junction |
| 0.2 | 6.4 | SA PTEN PATHWAY | PTEN is a tumor suppressor that dephosphorylates the lipid messenger phosphatidylinositol triphosphate. |
| 0.2 | 5.8 | NABA BASEMENT MEMBRANES | Genes encoding structural components of basement membranes |
| 0.2 | 5.3 | PID PRL SIGNALING EVENTS PATHWAY | Signaling events mediated by PRL |
| 0.2 | 5.2 | ST GA12 PATHWAY | G alpha 12 Pathway |
| 0.2 | 5.1 | PID UPA UPAR PATHWAY | Urokinase-type plasminogen activator (uPA) and uPAR-mediated signaling |
| 0.1 | 10.0 | PID HNF3B PATHWAY | FOXA2 and FOXA3 transcription factor networks |
| 0.1 | 8.2 | PID RAC1 REG PATHWAY | Regulation of RAC1 activity |
| 0.1 | 3.0 | PID TOLL ENDOGENOUS PATHWAY | Endogenous TLR signaling |
| 0.1 | 4.7 | PID ERBB1 INTERNALIZATION PATHWAY | Internalization of ErbB1 |
| 0.1 | 6.7 | PID IL4 2PATHWAY | IL4-mediated signaling events |
| 0.1 | 2.7 | PID HDAC CLASSIII PATHWAY | Signaling events mediated by HDAC Class III |
| 0.1 | 1.4 | SA B CELL RECEPTOR COMPLEXES | Antigen binding to B cell receptors activates protein tyrosine kinases, such as the Src family, which ultimate activate MAP kinases. |
| 0.1 | 4.1 | PID P38 ALPHA BETA DOWNSTREAM PATHWAY | Signaling mediated by p38-alpha and p38-beta |
| 0.1 | 1.2 | PID P38 GAMMA DELTA PATHWAY | Signaling mediated by p38-gamma and p38-delta |
| 0.1 | 3.4 | PID ATR PATHWAY | ATR signaling pathway |
| 0.1 | 2.2 | PID INTEGRIN2 PATHWAY | Beta2 integrin cell surface interactions |
| 0.1 | 3.0 | PID IL1 PATHWAY | IL1-mediated signaling events |
| 0.1 | 4.2 | PID PLK1 PATHWAY | PLK1 signaling events |
| 0.1 | 0.2 | ST JAK STAT PATHWAY | Jak-STAT Pathway |
| 0.1 | 2.3 | PID PS1 PATHWAY | Presenilin action in Notch and Wnt signaling |
| 0.1 | 2.2 | PID IL2 1PATHWAY | IL2-mediated signaling events |
| 0.1 | 2.1 | ST WNT BETA CATENIN PATHWAY | Wnt/beta-catenin Pathway |
| 0.1 | 1.3 | SA REG CASCADE OF CYCLIN EXPR | Expression of cyclins regulates progression through the cell cycle by activating cyclin-dependent kinases. |
| 0.1 | 2.2 | PID PI3KCI AKT PATHWAY | Class I PI3K signaling events mediated by Akt |
| 0.1 | 4.5 | PID BETA CATENIN NUC PATHWAY | Regulation of nuclear beta catenin signaling and target gene transcription |
| 0.1 | 2.0 | PID EPHRINB REV PATHWAY | Ephrin B reverse signaling |
| 0.1 | 4.6 | PID TELOMERASE PATHWAY | Regulation of Telomerase |
| 0.1 | 11.1 | NABA ECM GLYCOPROTEINS | Genes encoding structural ECM glycoproteins |
| 0.1 | 2.6 | PID AJDISS 2PATHWAY | Posttranslational regulation of adherens junction stability and dissassembly |
| 0.1 | 2.0 | PID GLYPICAN 1PATHWAY | Glypican 1 network |
| 0.1 | 1.3 | PID WNT CANONICAL PATHWAY | Canonical Wnt signaling pathway |
| 0.1 | 4.7 | PID AR PATHWAY | Coregulation of Androgen receptor activity |
| 0.0 | 0.9 | PID HEDGEHOG 2PATHWAY | Signaling events mediated by the Hedgehog family |
| 0.0 | 2.1 | PID RAC1 PATHWAY | RAC1 signaling pathway |
| 0.0 | 1.8 | PID HIF2PATHWAY | HIF-2-alpha transcription factor network |
| 0.0 | 0.9 | PID P38 MKK3 6PATHWAY | p38 MAPK signaling pathway |
| 0.0 | 0.6 | PID CXCR4 PATHWAY | CXCR4-mediated signaling events |
| 0.0 | 0.8 | PID EPHA FWDPATHWAY | EPHA forward signaling |
| 0.0 | 0.3 | PID EPO PATHWAY | EPO signaling pathway |
| 0.0 | 2.1 | PID RHOA REG PATHWAY | Regulation of RhoA activity |
| 0.0 | 1.7 | PID ILK PATHWAY | Integrin-linked kinase signaling |
| 0.0 | 1.7 | PID CASPASE PATHWAY | Caspase cascade in apoptosis |
| 0.0 | 0.9 | ST TUMOR NECROSIS FACTOR PATHWAY | Tumor Necrosis Factor Pathway. |
| 0.0 | 0.6 | ST ERK1 ERK2 MAPK PATHWAY | ERK1/ERK2 MAPK Pathway |
| 0.0 | 1.1 | PID P53 REGULATION PATHWAY | p53 pathway |
| 0.0 | 0.7 | PID TGFBR PATHWAY | TGF-beta receptor signaling |
| 0.0 | 1.5 | PID MYC ACTIV PATHWAY | Validated targets of C-MYC transcriptional activation |
| 0.0 | 0.4 | PID HDAC CLASSII PATHWAY | Signaling events mediated by HDAC Class II |
| 0.0 | 0.7 | WNT SIGNALING | Genes related to Wnt-mediated signal transduction |
Gene overrepresentation in C2:CP:REACTOME category:
| Log-likelihood per target | Total log-likelihood | Term | Description |
|---|---|---|---|
| 0.7 | 6.7 | REACTOME NEGATIVE REGULATION OF THE PI3K AKT NETWORK | Genes involved in Negative regulation of the PI3K/AKT network |
| 0.4 | 8.5 | REACTOME SIGNAL ATTENUATION | Genes involved in Signal attenuation |
| 0.4 | 4.4 | REACTOME REGULATION OF INSULIN SECRETION BY ACETYLCHOLINE | Genes involved in Regulation of Insulin Secretion by Acetylcholine |
| 0.4 | 15.1 | REACTOME SULFUR AMINO ACID METABOLISM | Genes involved in Sulfur amino acid metabolism |
| 0.3 | 9.1 | REACTOME ADVANCED GLYCOSYLATION ENDPRODUCT RECEPTOR SIGNALING | Genes involved in Advanced glycosylation endproduct receptor signaling |
| 0.3 | 13.8 | REACTOME DOWNREGULATION OF SMAD2 3 SMAD4 TRANSCRIPTIONAL ACTIVITY | Genes involved in Downregulation of SMAD2/3:SMAD4 transcriptional activity |
| 0.3 | 6.5 | REACTOME SYNTHESIS OF VERY LONG CHAIN FATTY ACYL COAS | Genes involved in Synthesis of very long-chain fatty acyl-CoAs |
| 0.3 | 6.9 | REACTOME TGF BETA RECEPTOR SIGNALING IN EMT EPITHELIAL TO MESENCHYMAL TRANSITION | Genes involved in TGF-beta receptor signaling in EMT (epithelial to mesenchymal transition) |
| 0.3 | 3.4 | REACTOME REMOVAL OF THE FLAP INTERMEDIATE FROM THE C STRAND | Genes involved in Removal of the Flap Intermediate from the C-strand |
| 0.3 | 8.7 | REACTOME TRANSFERRIN ENDOCYTOSIS AND RECYCLING | Genes involved in Transferrin endocytosis and recycling |
| 0.3 | 6.0 | REACTOME GRB2 SOS PROVIDES LINKAGE TO MAPK SIGNALING FOR INTERGRINS | Genes involved in GRB2:SOS provides linkage to MAPK signaling for Intergrins |
| 0.2 | 3.0 | REACTOME IRAK1 RECRUITS IKK COMPLEX | Genes involved in IRAK1 recruits IKK complex |
| 0.2 | 8.5 | REACTOME PYRIMIDINE METABOLISM | Genes involved in Pyrimidine metabolism |
| 0.2 | 2.4 | REACTOME SYNTHESIS OF PIPS AT THE LATE ENDOSOME MEMBRANE | Genes involved in Synthesis of PIPs at the late endosome membrane |
| 0.2 | 7.8 | REACTOME A TETRASACCHARIDE LINKER SEQUENCE IS REQUIRED FOR GAG SYNTHESIS | Genes involved in A tetrasaccharide linker sequence is required for GAG synthesis |
| 0.2 | 3.5 | REACTOME BASE FREE SUGAR PHOSPHATE REMOVAL VIA THE SINGLE NUCLEOTIDE REPLACEMENT PATHWAY | Genes involved in Base-free sugar-phosphate removal via the single-nucleotide replacement pathway |
| 0.2 | 18.3 | REACTOME INTEGRIN CELL SURFACE INTERACTIONS | Genes involved in Integrin cell surface interactions |
| 0.2 | 2.9 | REACTOME ADENYLATE CYCLASE INHIBITORY PATHWAY | Genes involved in Adenylate cyclase inhibitory pathway |
| 0.2 | 4.9 | REACTOME CHOLESTEROL BIOSYNTHESIS | Genes involved in Cholesterol biosynthesis |
| 0.2 | 7.5 | REACTOME SEMA4D IN SEMAPHORIN SIGNALING | Genes involved in Sema4D in semaphorin signaling |
| 0.1 | 5.5 | REACTOME BASIGIN INTERACTIONS | Genes involved in Basigin interactions |
| 0.1 | 6.2 | REACTOME SIGNALING BY ROBO RECEPTOR | Genes involved in Signaling by Robo receptor |
| 0.1 | 4.3 | REACTOME ADHERENS JUNCTIONS INTERACTIONS | Genes involved in Adherens junctions interactions |
| 0.1 | 2.2 | REACTOME APOPTOSIS INDUCED DNA FRAGMENTATION | Genes involved in Apoptosis induced DNA fragmentation |
| 0.1 | 1.8 | REACTOME SHC1 EVENTS IN EGFR SIGNALING | Genes involved in SHC1 events in EGFR signaling |
| 0.1 | 2.7 | REACTOME ENDOSOMAL SORTING COMPLEX REQUIRED FOR TRANSPORT ESCRT | Genes involved in Endosomal Sorting Complex Required For Transport (ESCRT) |
| 0.1 | 2.9 | REACTOME CIRCADIAN REPRESSION OF EXPRESSION BY REV ERBA | Genes involved in Circadian Repression of Expression by REV-ERBA |
| 0.1 | 1.8 | REACTOME PROCESSING OF INTRONLESS PRE MRNAS | Genes involved in Processing of Intronless Pre-mRNAs |
| 0.1 | 2.6 | REACTOME PLATELET SENSITIZATION BY LDL | Genes involved in Platelet sensitization by LDL |
| 0.1 | 1.9 | REACTOME OXYGEN DEPENDENT PROLINE HYDROXYLATION OF HYPOXIA INDUCIBLE FACTOR ALPHA | Genes involved in Oxygen-dependent Proline Hydroxylation of Hypoxia-inducible Factor Alpha |
| 0.1 | 5.3 | REACTOME COLLAGEN FORMATION | Genes involved in Collagen formation |
| 0.1 | 1.3 | REACTOME G0 AND EARLY G1 | Genes involved in G0 and Early G1 |
| 0.1 | 2.0 | REACTOME CITRIC ACID CYCLE TCA CYCLE | Genes involved in Citric acid cycle (TCA cycle) |
| 0.1 | 1.5 | REACTOME ACTIVATION OF BH3 ONLY PROTEINS | Genes involved in Activation of BH3-only proteins |
| 0.1 | 1.7 | REACTOME SIGNALING BY BMP | Genes involved in Signaling by BMP |
| 0.1 | 3.6 | REACTOME NRAGE SIGNALS DEATH THROUGH JNK | Genes involved in NRAGE signals death through JNK |
| 0.1 | 1.9 | REACTOME TRANSCRIPTIONAL ACTIVITY OF SMAD2 SMAD3 SMAD4 HETEROTRIMER | Genes involved in Transcriptional activity of SMAD2/SMAD3:SMAD4 heterotrimer |
| 0.1 | 1.1 | REACTOME APOPTOTIC CLEAVAGE OF CELL ADHESION PROTEINS | Genes involved in Apoptotic cleavage of cell adhesion proteins |
| 0.1 | 3.1 | REACTOME G1 PHASE | Genes involved in G1 Phase |
| 0.1 | 1.5 | REACTOME PKA MEDIATED PHOSPHORYLATION OF CREB | Genes involved in PKA-mediated phosphorylation of CREB |
| 0.1 | 5.4 | REACTOME ANTIVIRAL MECHANISM BY IFN STIMULATED GENES | Genes involved in Antiviral mechanism by IFN-stimulated genes |
| 0.1 | 1.8 | REACTOME RNA POL III TRANSCRIPTION TERMINATION | Genes involved in RNA Polymerase III Transcription Termination |
| 0.1 | 1.5 | REACTOME PLATELET CALCIUM HOMEOSTASIS | Genes involved in Platelet calcium homeostasis |
| 0.1 | 7.2 | REACTOME MRNA SPLICING | Genes involved in mRNA Splicing |
| 0.1 | 1.3 | REACTOME REGULATION OF INSULIN LIKE GROWTH FACTOR IGF ACTIVITY BY INSULIN LIKE GROWTH FACTOR BINDING PROTEINS IGFBPS | Genes involved in Regulation of Insulin-like Growth Factor (IGF) Activity by Insulin-like Growth Factor Binding Proteins (IGFBPs) |
| 0.1 | 4.0 | REACTOME GOLGI ASSOCIATED VESICLE BIOGENESIS | Genes involved in Golgi Associated Vesicle Biogenesis |
| 0.0 | 3.5 | REACTOME SIGNALING BY PDGF | Genes involved in Signaling by PDGF |
| 0.0 | 1.2 | REACTOME KINESINS | Genes involved in Kinesins |
| 0.0 | 0.8 | REACTOME REGULATION OF RHEB GTPASE ACTIVITY BY AMPK | Genes involved in Regulation of Rheb GTPase activity by AMPK |
| 0.0 | 3.9 | REACTOME DNA REPAIR | Genes involved in DNA Repair |
| 0.0 | 0.8 | REACTOME NONSENSE MEDIATED DECAY ENHANCED BY THE EXON JUNCTION COMPLEX | Genes involved in Nonsense Mediated Decay Enhanced by the Exon Junction Complex |
| 0.0 | 0.4 | REACTOME IL 7 SIGNALING | Genes involved in Interleukin-7 signaling |
| 0.0 | 0.7 | REACTOME HDL MEDIATED LIPID TRANSPORT | Genes involved in HDL-mediated lipid transport |
| 0.0 | 2.2 | REACTOME MITOTIC PROMETAPHASE | Genes involved in Mitotic Prometaphase |
| 0.0 | 1.1 | REACTOME ION TRANSPORT BY P TYPE ATPASES | Genes involved in Ion transport by P-type ATPases |
| 0.0 | 2.3 | REACTOME GLUCOSE METABOLISM | Genes involved in Glucose metabolism |
| 0.0 | 0.5 | REACTOME INSULIN SYNTHESIS AND PROCESSING | Genes involved in Insulin Synthesis and Processing |
| 0.0 | 0.4 | REACTOME CELL DEATH SIGNALLING VIA NRAGE NRIF AND NADE | Genes involved in Cell death signalling via NRAGE, NRIF and NADE |
| 0.0 | 1.7 | REACTOME PHASE1 FUNCTIONALIZATION OF COMPOUNDS | Genes involved in Phase 1 - Functionalization of compounds |
| 0.0 | 0.9 | REACTOME DEPOSITION OF NEW CENPA CONTAINING NUCLEOSOMES AT THE CENTROMERE | Genes involved in Deposition of New CENPA-containing Nucleosomes at the Centromere |
| 0.0 | 0.0 | REACTOME VIF MEDIATED DEGRADATION OF APOBEC3G | Genes involved in Vif-mediated degradation of APOBEC3G |
| 0.0 | 0.3 | REACTOME SYNTHESIS OF SUBSTRATES IN N GLYCAN BIOSYTHESIS | Genes involved in Synthesis of substrates in N-glycan biosythesis |
| 0.0 | 0.7 | REACTOME TRANSPORT OF VITAMINS NUCLEOSIDES AND RELATED MOLECULES | Genes involved in Transport of vitamins, nucleosides, and related molecules |
| 0.0 | 1.0 | REACTOME TRANSCRIPTIONAL REGULATION OF WHITE ADIPOCYTE DIFFERENTIATION | Genes involved in Transcriptional Regulation of White Adipocyte Differentiation |
| 0.0 | 1.2 | REACTOME NUCLEAR RECEPTOR TRANSCRIPTION PATHWAY | Genes involved in Nuclear Receptor transcription pathway |
| 0.0 | 0.3 | REACTOME SIGNALING BY FGFR1 FUSION MUTANTS | Genes involved in Signaling by FGFR1 fusion mutants |
| 0.0 | 0.4 | REACTOME EXTRACELLULAR MATRIX ORGANIZATION | Genes involved in Extracellular matrix organization |
| 0.0 | 0.4 | REACTOME NOTCH1 INTRACELLULAR DOMAIN REGULATES TRANSCRIPTION | Genes involved in NOTCH1 Intracellular Domain Regulates Transcription |
| 0.0 | 0.2 | REACTOME ACTIVATED POINT MUTANTS OF FGFR2 | Genes involved in Activated point mutants of FGFR2 |