Project
GNF SymAtlas + NCI-60 cancer cell lines, human (Su, 2004; Ross, 2000)
Navigation
Downloads
Results for AUGACAC
Z-value: 0.06
Motif logo

miRNA associated with seed AUGACAC
| Name | miRBASE accession |
|---|---|
|
hsa-miR-425-5p
|
MIMAT0003393 |
Activity profile of AUGACAC motif
Sorted Z-values of AUGACAC motif
| Promoter | Log-likelihood | Transcript | Gene | Gene Info |
|---|---|---|---|---|
| chr15_-_48937982 | 0.21 |
ENST00000316623.5
|
FBN1
|
fibrillin 1 |
| chr6_-_86352642 | 0.12 |
ENST00000355238.6
|
SYNCRIP
|
synaptotagmin binding, cytoplasmic RNA interacting protein |
| chr10_+_89622870 | 0.11 |
ENST00000371953.3
|
PTEN
|
phosphatase and tensin homolog |
| chr6_+_118869452 | 0.11 |
ENST00000357525.5
|
PLN
|
phospholamban |
| chr2_+_208394616 | 0.10 |
ENST00000432329.2
ENST00000353267.3 ENST00000445803.1 |
CREB1
|
cAMP responsive element binding protein 1 |
| chr3_+_187930719 | 0.09 |
ENST00000312675.4
|
LPP
|
LIM domain containing preferred translocation partner in lipoma |
| chrX_-_119694538 | 0.08 |
ENST00000371322.5
|
CUL4B
|
cullin 4B |
| chr5_-_72744336 | 0.08 |
ENST00000499003.3
|
FOXD1
|
forkhead box D1 |
| chr12_-_102874416 | 0.07 |
ENST00000392904.1
ENST00000337514.6 |
IGF1
|
insulin-like growth factor 1 (somatomedin C) |
| chr18_-_54305658 | 0.06 |
ENST00000586262.1
ENST00000217515.6 |
TXNL1
|
thioredoxin-like 1 |
| chr3_-_150481164 | 0.06 |
ENST00000312960.3
|
SIAH2
|
siah E3 ubiquitin protein ligase 2 |
| chr2_+_114647504 | 0.06 |
ENST00000263238.2
|
ACTR3
|
ARP3 actin-related protein 3 homolog (yeast) |
| chr13_-_107187462 | 0.05 |
ENST00000245323.4
|
EFNB2
|
ephrin-B2 |
| chr3_-_125094093 | 0.05 |
ENST00000484491.1
ENST00000492394.1 ENST00000471196.1 ENST00000468369.1 ENST00000544464.1 ENST00000485866.1 ENST00000360647.4 |
ZNF148
|
zinc finger protein 148 |
| chr9_-_16870704 | 0.05 |
ENST00000380672.4
ENST00000380667.2 ENST00000380666.2 ENST00000486514.1 |
BNC2
|
basonuclin 2 |
| chr17_-_65362678 | 0.04 |
ENST00000357146.4
ENST00000356126.3 |
PSMD12
|
proteasome (prosome, macropain) 26S subunit, non-ATPase, 12 |
| chrX_-_39956656 | 0.04 |
ENST00000397354.3
ENST00000378444.4 |
BCOR
|
BCL6 corepressor |
| chr14_-_91976488 | 0.04 |
ENST00000554684.1
ENST00000337238.4 ENST00000428424.2 ENST00000554511.1 |
SMEK1
|
SMEK homolog 1, suppressor of mek1 (Dictyostelium) |
| chr6_-_136610911 | 0.04 |
ENST00000530767.1
ENST00000527759.1 ENST00000527536.1 ENST00000529826.1 ENST00000531224.1 ENST00000353331.4 |
BCLAF1
|
BCL2-associated transcription factor 1 |
| chr11_-_77532050 | 0.04 |
ENST00000308488.6
|
RSF1
|
remodeling and spacing factor 1 |
| chr1_+_111991474 | 0.03 |
ENST00000369722.3
|
ATP5F1
|
ATP synthase, H+ transporting, mitochondrial Fo complex, subunit B1 |
| chr13_+_22245522 | 0.03 |
ENST00000382353.5
|
FGF9
|
fibroblast growth factor 9 |
| chr3_-_24536253 | 0.03 |
ENST00000428492.1
ENST00000396671.2 ENST00000431815.1 ENST00000418247.1 ENST00000416420.1 ENST00000356447.4 |
THRB
|
thyroid hormone receptor, beta |
| chr18_-_45456930 | 0.03 |
ENST00000262160.6
ENST00000587269.1 |
SMAD2
|
SMAD family member 2 |
| chr2_-_40679186 | 0.03 |
ENST00000406785.2
|
SLC8A1
|
solute carrier family 8 (sodium/calcium exchanger), member 1 |
| chr5_+_141348598 | 0.03 |
ENST00000394520.2
ENST00000347642.3 |
RNF14
|
ring finger protein 14 |
| chr22_+_21771656 | 0.03 |
ENST00000407464.2
|
HIC2
|
hypermethylated in cancer 2 |
| chr12_-_65146636 | 0.03 |
ENST00000418919.2
|
GNS
|
glucosamine (N-acetyl)-6-sulfatase |
| chr9_-_102861267 | 0.02 |
ENST00000262455.6
|
ERP44
|
endoplasmic reticulum protein 44 |
| chr10_-_98346801 | 0.02 |
ENST00000371142.4
|
TM9SF3
|
transmembrane 9 superfamily member 3 |
| chr5_+_179159813 | 0.02 |
ENST00000292599.3
|
MAML1
|
mastermind-like 1 (Drosophila) |
| chr2_+_176987088 | 0.02 |
ENST00000249499.6
|
HOXD9
|
homeobox D9 |
| chr19_-_44143939 | 0.02 |
ENST00000222374.2
|
CADM4
|
cell adhesion molecule 4 |
| chrX_+_28605516 | 0.02 |
ENST00000378993.1
|
IL1RAPL1
|
interleukin 1 receptor accessory protein-like 1 |
| chr2_+_113033164 | 0.02 |
ENST00000409871.1
ENST00000343936.4 |
ZC3H6
|
zinc finger CCCH-type containing 6 |
| chr21_+_39628655 | 0.02 |
ENST00000398925.1
ENST00000398928.1 ENST00000328656.4 ENST00000443341.1 |
KCNJ15
|
potassium inwardly-rectifying channel, subfamily J, member 15 |
| chrX_+_9983602 | 0.01 |
ENST00000380861.4
|
WWC3
|
WWC family member 3 |
| chr15_-_35261996 | 0.01 |
ENST00000156471.5
|
AQR
|
aquarius intron-binding spliceosomal factor |
| chr5_-_132299313 | 0.01 |
ENST00000265343.5
|
AFF4
|
AF4/FMR2 family, member 4 |
| chr1_+_237205476 | 0.01 |
ENST00000366574.2
|
RYR2
|
ryanodine receptor 2 (cardiac) |
| chr15_-_27018175 | 0.01 |
ENST00000311550.5
|
GABRB3
|
gamma-aminobutyric acid (GABA) A receptor, beta 3 |
| chr3_-_57678772 | 0.01 |
ENST00000311128.5
|
DENND6A
|
DENN/MADD domain containing 6A |
| chr4_+_144434584 | 0.01 |
ENST00000283131.3
|
SMARCA5
|
SWI/SNF related, matrix associated, actin dependent regulator of chromatin, subfamily a, member 5 |
| chr5_+_135468516 | 0.01 |
ENST00000507118.1
ENST00000511116.1 ENST00000545279.1 ENST00000545620.1 |
SMAD5
|
SMAD family member 5 |
| chr6_+_44355257 | 0.00 |
ENST00000371477.3
|
CDC5L
|
cell division cycle 5-like |
| chr15_+_72766651 | 0.00 |
ENST00000379887.4
|
ARIH1
|
ariadne RBR E3 ubiquitin protein ligase 1 |
| chr3_-_186080012 | 0.00 |
ENST00000544847.1
ENST00000265022.3 |
DGKG
|
diacylglycerol kinase, gamma 90kDa |
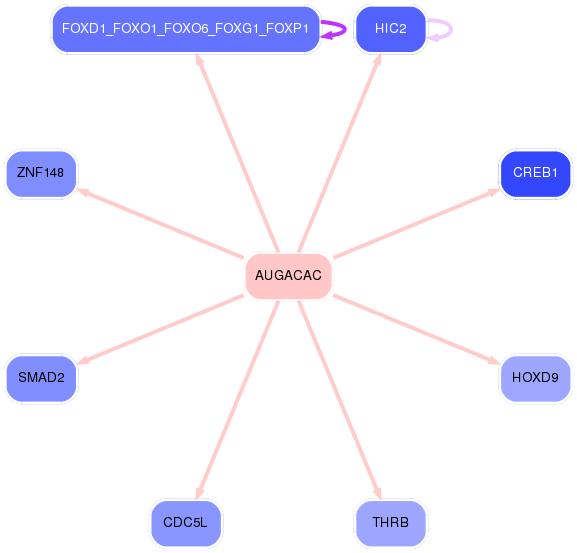
Network of associatons between targets according to the STRING database.

First level regulatory network of AUGACAC
Gene Ontology Analysis
Gene overrepresentation in biological_process category:
| Log-likelihood per target | Total log-likelihood | Term | Description |
|---|---|---|---|
| 0.0 | 0.2 | GO:0035582 | sequestering of BMP in extracellular matrix(GO:0035582) |
| 0.0 | 0.1 | GO:0086092 | regulation of the force of heart contraction by cardiac conduction(GO:0086092) regulation of calcium ion binding(GO:1901876) negative regulation of calcium ion binding(GO:1901877) regulation of calcium ion import into sarcoplasmic reticulum(GO:1902080) negative regulation of calcium ion import into sarcoplasmic reticulum(GO:1902081) |
| 0.0 | 0.1 | GO:1903984 | positive regulation of TRAIL-activated apoptotic signaling pathway(GO:1903984) |
| 0.0 | 0.1 | GO:0016344 | meiotic chromosome movement towards spindle pole(GO:0016344) |
| 0.0 | 0.1 | GO:0070934 | CRD-mediated mRNA stabilization(GO:0070934) |
| 0.0 | 0.1 | GO:1904550 | chemotaxis to arachidonic acid(GO:0034670) response to arachidonic acid(GO:1904550) |
| 0.0 | 0.1 | GO:0072076 | nephrogenic mesenchyme development(GO:0072076) |
| 0.0 | 0.0 | GO:0070171 | negative regulation of tooth mineralization(GO:0070171) |
| 0.0 | 0.1 | GO:1904075 | trophectodermal cell proliferation(GO:0001834) regulation of trophectodermal cell proliferation(GO:1904073) positive regulation of trophectodermal cell proliferation(GO:1904075) |
| 0.0 | 0.0 | GO:0008050 | female courtship behavior(GO:0008050) |
Gene overrepresentation in cellular_component category:
| Log-likelihood per target | Total log-likelihood | Term | Description |
|---|---|---|---|
| 0.0 | 0.1 | GO:0097452 | GAIT complex(GO:0097452) |
| 0.0 | 0.0 | GO:0031213 | RSF complex(GO:0031213) |
| 0.0 | 0.1 | GO:1990589 | ATF4-CREB1 transcription factor complex(GO:1990589) |
| 0.0 | 0.1 | GO:0031465 | Cul4B-RING E3 ubiquitin ligase complex(GO:0031465) |
| 0.0 | 0.1 | GO:0035867 | alphav-beta3 integrin-IGF-1-IGF1R complex(GO:0035867) |
Gene overrepresentation in molecular_function category:
| Log-likelihood per target | Total log-likelihood | Term | Description |
|---|---|---|---|
| 0.0 | 0.1 | GO:0016314 | phosphatidylinositol-3,4,5-trisphosphate 3-phosphatase activity(GO:0016314) |
| 0.0 | 0.1 | GO:0042030 | ATPase inhibitor activity(GO:0042030) |
| 0.0 | 0.2 | GO:0030023 | extracellular matrix constituent conferring elasticity(GO:0030023) |
| 0.0 | 0.1 | GO:1990763 | arrestin family protein binding(GO:1990763) |
Gene overrepresentation in C2:CP:REACTOME category:
| Log-likelihood per target | Total log-likelihood | Term | Description |
|---|---|---|---|
| 0.0 | 0.1 | REACTOME NEGATIVE REGULATION OF THE PI3K AKT NETWORK | Genes involved in Negative regulation of the PI3K/AKT network |