|
chr6_-_143266283
|
3.393
|
NM_006734
|
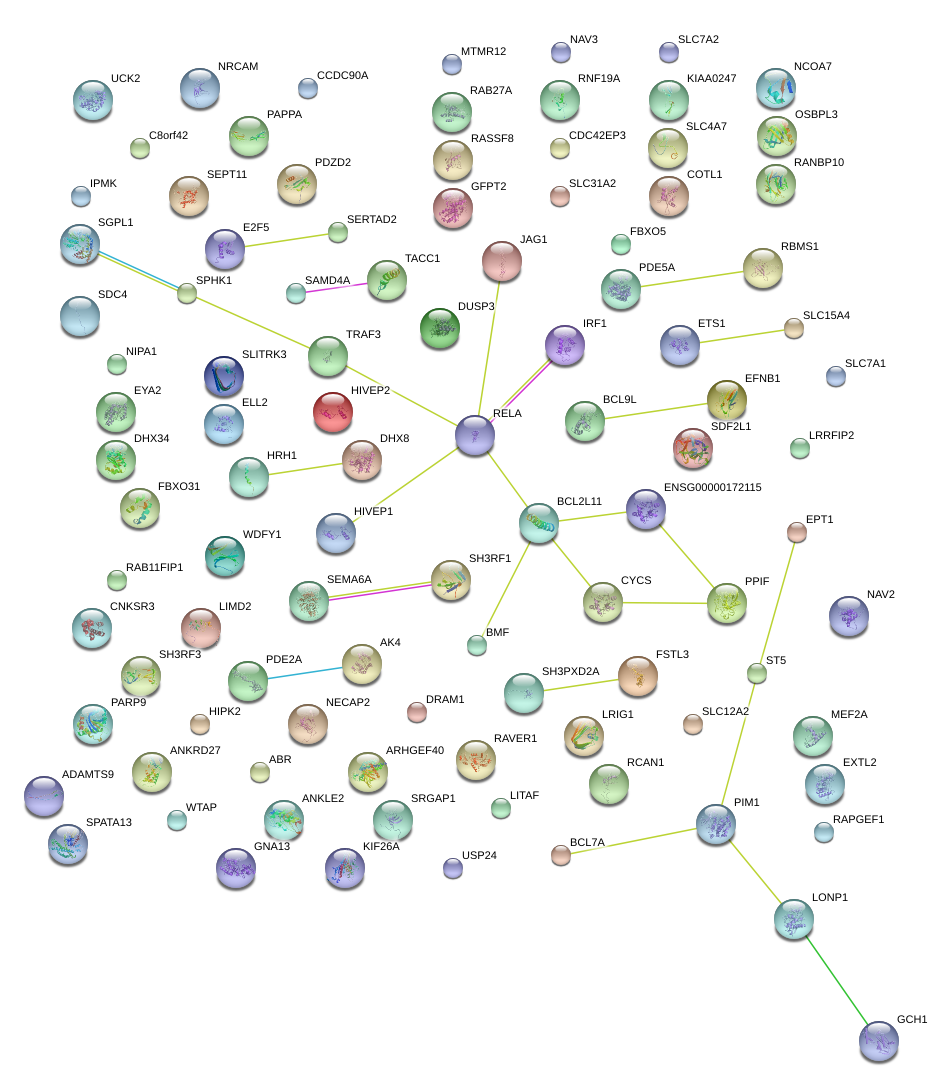
HIVEP2
|
human immunodeficiency virus type I enhancer binding protein 2
|
|
chr6_-_154831704
|
3.294
|
NM_173515
|
CNKSR3
|
CNKSR family member 3
|
|
chr4_-_120549115
|
3.256
|
NM_033437
|
PDE5A
|
phosphodiesterase 5A, cGMP-specific
|
|
chr5_-_131826426
|
2.564
|
NM_002198
|
IRF1
|
interferon regulatory factor 1
|
|
chr11_-_72380107
|
2.412
|
NM_001146209
|
PDE2A
|
phosphodiesterase 2A, cGMP-stimulated
|
|
chr11_-_72353435
|
2.381
|
NM_001143839
NM_001243784
|
PDE2A
|
phosphodiesterase 2A, cGMP-stimulated
|
|
chr9_+_115913227
|
2.305
|
NM_001860
|
SLC31A2
|
solute carrier family 31 (copper transporters), member 2
|
|
chr4_-_120549827
|
2.289
|
NM_001083
|
PDE5A
|
phosphodiesterase 5A, cGMP-specific
|
|
chr16_-_11680756
|
2.189
|
NM_001136472
NM_001136473
|
LITAF
|
lipopolysaccharide-induced TNF factor
|
|
chr7_-_25019625
|
2.156
|
NM_015550
NM_145320
NM_145321
NM_145322
|
OSBPL3
|
oxysterol binding protein-like 3
|
|
chr16_-_11680146
|
2.088
|
NM_004862
|
LITAF
|
lipopolysaccharide-induced TNF factor
|
|
chr11_-_72385411
|
2.055
|
NM_002599
|
PDE2A
|
phosphodiesterase 2A, cGMP-stimulated
|
|
chr6_+_37137882
|
2.005
|
NM_001243186
NM_002648
|
PIM1
|
pim-1 oncogene
|
|
chr11_-_128457452
|
1.998
|
NM_001143820
|
ETS1
|
v-ets erythroblastosis virus E26 oncogene homolog 1 (avian)
|
|
chr5_+_127419407
|
1.996
|
NM_001046
|
SLC12A2
|
solute carrier family 12 (sodium/potassium/chloride transporters), member 2
|
|
chr11_-_128392061
|
1.861
|
NM_001162422
NM_005238
|
ETS1
|
v-ets erythroblastosis virus E26 oncogene homolog 1 (avian)
|
|
chr6_+_126111782
|
1.850
|
NM_001122842
NM_001199621
NM_181782
|
NCOA7
|
nuclear receptor coactivator 7
|
|
chr4_-_120548329
|
1.849
|
NM_033430
|
PDE5A
|
phosphodiesterase 5A, cGMP-specific
|
|
chr5_-_179780314
|
1.843
|
NM_005110
|
GFPT2
|
glutamine-fructose-6-phosphate transaminase 2
|
|
chr8_-_37756971
|
1.829
|
NM_001002814
NM_025151
|
RAB11FIP1
|
RAB11 family interacting protein 1 (class I)
|
|
chr19_+_676346
|
1.776
|
NM_005860
|
FSTL3
|
follistatin-like 3 (secreted glycoprotein)
|
|
chr6_+_126240369
|
1.748
|
NM_001199622
|
NCOA7
|
nuclear receptor coactivator 7
|
|
chr14_+_55034329
|
1.745
|
NM_001161576
NM_015589
|
SAMD4A
|
sterile alpha motif domain containing 4A
|
|
chrX_+_68048792
|
1.738
|
NM_004429
|
EFNB1
|
ephrin-B1
|
|
chr11_+_19372270
|
1.715
|
NM_001111018
|
NAV2
|
neuron navigator 2
|
|
chr14_+_55221505
|
1.714
|
NM_001161577
|
SAMD4A
|
sterile alpha motif domain containing 4A
|
|
chr14_-_55369163
|
1.710
|
NM_000161
NM_001024024
NM_001024070
NM_001024071
|
GCH1
|
GTP cyclohydrolase 1
|
|
chr5_-_95297597
|
1.681
|
NM_012081
|
ELL2
|
elongation factor, RNA polymerase II, 2
|
|
chr11_+_19734821
|
1.677
|
NM_001244963
NM_145117
NM_182964
|
NAV2
|
neuron navigator 2
|
|
chr12_+_64238511
|
1.657
|
NM_020762
|
SRGAP1
|
SLIT-ROBO Rho GTPase activating protein 1
|
|
chr15_-_55562483
|
1.656
|
NM_183234
NM_004580
|
RAB27A
|
RAB27A, member RAS oncogene family
|
|
chr14_+_21538339
|
1.650
|
NM_018071
|
ARHGEF40
|
Rho guanine nucleotide exchange factor (GEF) 40
|
|
chr12_+_102271082
|
1.598
|
NM_018370
|
DRAM1
|
DNA-damage regulated autophagy modulator 1
|
|
chr6_+_126102278
|
1.540
|
NM_001199619
NM_001199620
|
NCOA7
|
nuclear receptor coactivator 7
|
|
chr15_-_55563091
|
1.530
|
NM_183236
|
RAB27A
|
RAB27A, member RAS oncogene family
|
|
chr10_+_74451838
|
1.489
|
NM_138357
|
MCU
|
mitochondrial calcium uniporter
|
|
chr5_-_32313069
|
1.467
|
NM_001040446
|
MTMR12
|
myotubularin related protein 12
|
|
chr21_-_35987144
|
1.439
|
NM_004414
|
RCAN1
|
regulator of calcineurin 1
|
|
chr10_-_105614952
|
1.432
|
NM_014631
|
SH3PXD2A
|
SH3 and PX domains 2A
|
|
chr12_+_78225068
|
1.425
|
NM_014903
|
NAV3
|
neuron navigator 3
|
|
chr15_-_23086842
|
1.424
|
NM_001142275
|
NIPA1
|
non imprinted in Prader-Willi/Angelman syndrome 1
|
|
chr15_-_55581969
|
1.413
|
NM_183235
|
RAB27A
|
RAB27A, member RAS oncogene family
|
|
chr11_-_118781612
|
1.402
|
NM_182557
|
BCL9L
|
B-cell CLL/lymphoma 9-like
|
|
chr7_-_139477437
|
1.388
|
NM_001113239
NM_022740
|
HIPK2
|
homeodomain interacting protein kinase 2
|
|
chr21_-_35986744
|
1.368
|
NM_203417
|
RCAN1
|
regulator of calcineurin 1
|
|
chr14_+_70078309
|
1.368
|
NM_014734
|
KIAA0247
|
KIAA0247
|
|
chr3_+_11196213
|
1.362
|
NM_001098212
|
HRH1
|
histamine receptor H1
|
|
chr2_-_37899227
|
1.354
|
NM_006449
|
CDC42EP3
|
CDC42 effector protein (Rho GTPase binding) 3
|
|
chr15_-_23086290
|
1.342
|
NM_144599
|
NIPA1
|
non imprinted in Prader-Willi/Angelman syndrome 1
|
|
chr1_+_165796652
|
1.330
|
NM_012474
|
UCK2
|
uridine-cytidine kinase 2
|
|
chr8_+_86099909
|
1.298
|
NM_001083589
|
E2F5
|
E2F transcription factor 5, p130-binding
|
|
chr9_-_134585107
|
1.288
|
NM_198679
|
RAPGEF1
|
Rap guanine nucleotide exchange factor (GEF) 1
|
|
chr3_+_11294384
|
1.284
|
NM_000861
|
HRH1
|
histamine receptor H1
|
|
chr8_+_86089618
|
1.283
|
NM_001083588
NM_001951
|
E2F5
|
E2F transcription factor 5, p130-binding
|
|
chr20_-_43977023
|
1.282
|
NM_002999
|
SDC4
|
syndecan 4
|
|
chr10_+_72575623
|
1.274
|
NM_003901
|
SGPL1
|
sphingosine-1-phosphate lyase 1
|
|
chr2_+_111878450
|
1.252
|
NM_001204106
NM_001204107
NM_001204108
NM_001204109
NM_001204110
NM_001204111
NM_001204112
NM_001204113
NM_006538
NM_138621
NM_138622
NM_138623
NM_138624
NM_138625
NM_138626
NM_138627
NM_207002
NM_207003
|
BCL2L11
|
BCL2-like 11 (apoptosis facilitator)
|
|
chr2_+_109745996
|
1.250
|
NM_001099289
|
SH3RF3
|
SH3 domain containing ring finger 3
|
|
chr8_+_17396285
|
1.245
|
NM_001164771
NM_003046
|
SLC7A2
|
solute carrier family 7 (cationic amino acid transporter, y+ system), member 2
|
|
chr3_-_122283423
|
1.236
|
NM_001146103
NM_031458
|
PARP9
|
poly (ADP-ribose) polymerase family, member 9
|
|
chr8_+_17354562
|
1.235
|
NM_001008539
|
SLC7A2
|
solute carrier family 7 (cationic amino acid transporter, y+ system), member 2
|
|
chr9_-_134612924
|
1.225
|
NM_005312
|
RAPGEF1
|
Rap guanine nucleotide exchange factor (GEF) 1
|
|
chr17_+_74380676
|
1.213
|
NM_001142601
NM_021972
NM_182965
|
SPHK1
|
sphingosine kinase 1
|
|
chr3_+_11267666
|
1.198
|
NM_001098211
|
HRH1
|
histamine receptor H1
|
|
chr16_-_84651639
|
1.176
|
NM_021149
|
COTL1
|
coactosin-like 1 (Dictyostelium)
|
|
chr17_+_74381186
|
1.169
|
NM_001142602
|
SPHK1
|
sphingosine kinase 1
|
|
chr5_+_31799030
|
1.142
|
NM_178140
|
PDZD2
|
PDZ domain containing 2
|
|
chr5_-_115910406
|
1.129
|
NM_020796
|
SEMA6A
|
sema domain, transmembrane domain (TM), and cytoplasmic domain, (semaphorin) 6A
|
|
chr10_+_81107219
|
1.118
|
NM_005729
|
PPIF
|
peptidylprolyl isomerase F
|
|
chr12_-_129308293
|
1.102
|
NM_145648
|
SLC15A4
|
solute carrier family 15, member 4
|
|
chr12_-_133338389
|
1.099
|
NM_015114
|
ANKLE2
|
ankyrin repeat and LEM domain containing 2
|
|
chr8_-_495330
|
1.096
|
NM_175075
|
C8orf42
|
chromosome 8 open reading frame 42
|
|
chr3_-_64673330
|
1.082
|
NM_182920
|
ADAMTS9
|
ADAM metallopeptidase with thrombospondin type 1 motif, 9
|
|
chr11_-_8832881
|
1.075
|
NM_139157
|
ST5
|
suppression of tumorigenicity 5
|
|
chr13_-_30169795
|
1.074
|
NM_003045
|
SLC7A1
|
solute carrier family 7 (cationic amino acid transporter, y+ system), member 1
|
|
chr21_-_35899046
|
1.051
|
NM_203418
|
RCAN1
|
regulator of calcineurin 1
|
|
chr9_+_118916069
|
1.051
|
NM_002581
|
PAPPA
|
pregnancy-associated plasma protein A, pappalysin 1
|
|
chr11_-_8832189
|
1.035
|
NM_213618
|
ST5
|
suppression of tumorigenicity 5
|
|
chr11_-_8932497
|
1.032
|
NM_005418
|
ST5
|
suppression of tumorigenicity 5
|
|
chr10_-_60027630
|
1.024
|
NM_152230
|
IPMK
|
inositol polyphosphate multikinase
|
|
chr16_-_67840464
|
1.018
|
NM_020850
|
RANBP10
|
RAN binding protein 10
|
|
chr3_+_11178778
|
1.018
|
NM_001098213
|
HRH1
|
histamine receptor H1
|
|
chr14_+_103243813
|
1.016
|
NM_001199427
NM_003300
NM_145725
NM_145726
|
TRAF3
|
TNF receptor-associated factor 3
|
|
chr2_-_161350304
|
1.014
|
NM_002897
NM_016836
|
RBMS1
|
RNA binding motif, single stranded interacting protein 1
|
|
chr7_-_108096693
|
1.010
|
NM_001193582
NM_001193583
NM_001193584
NM_005010
|
NRCAM
|
neuronal cell adhesion molecule
|
|
chr12_+_122459791
|
0.976
|
NM_001024808
NM_020993
|
BCL7A
|
B-cell CLL/lymphoma 7A
|
|
chr13_+_24734788
|
0.968
|
NM_001166271
NM_153023
|
SPATA13
|
spermatogenesis associated 13
|
|
chr2_+_26568900
|
0.961
|
NM_033505
|
EPT1
|
ethanolaminephosphotransferase 1 (CDP-ethanolamine-specific)
|
|
chr17_-_41856180
|
0.947
|
NM_004090
|
DUSP3
|
dual specificity phosphatase 3
|
|
chr3_+_119187782
|
0.930
|
NM_152305
|
POGLUT1
|
protein O-glucosyltransferase 1
|
|
chr3_-_66550844
|
0.889
|
NM_015541
|
LRIG1
|
leucine-rich repeats and immunoglobulin-like domains 1
|
|
chr20_-_10654429
|
0.884
|
NM_000214
|
JAG1
|
jagged 1
|
|
chr2_-_64881040
|
0.877
|
NM_014755
|
SERTAD2
|
SERTA domain containing 2
|
|
chr7_-_107880492
|
0.874
|
NM_001037132
|
NRCAM
|
neuronal cell adhesion molecule
|
|
chr1_-_101360405
|
0.872
|
NM_001033025
NM_001439
|
EXTL2
|
exostoses (multiple)-like 2
|
|
chr15_+_100173182
|
0.863
|
NM_001130928
|
MEF2A
|
myocyte enhancer factor 2A
|
|
chr6_+_160148608
|
0.862
|
NM_152857
|
WTAP
|
Wilms tumor 1 associated protein
|
|
chr14_+_104605059
|
0.844
|
NM_015656
|
KIF26A
|
kinesin family member 26A
|
|
chr12_+_26126687
|
0.843
|
NM_001164747
|
RASSF8
|
Ras association (RalGDS/AF-6) domain family (N-terminal) member 8
|
|
chr17_-_63052884
|
0.833
|
NM_006572
|
GNA13
|
guanine nucleotide binding protein (G protein), alpha 13
|
|
chr3_-_27498244
|
0.821
|
NM_003615
|
SLC4A7
|
solute carrier family 4, sodium bicarbonate cotransporter, member 7
|
|
chr3_-_37217716
|
0.805
|
NM_001134369
NM_006309
NM_017724
|
LRRFIP2
|
leucine rich repeat (in FLII) interacting protein 2
|
|
chr15_-_40401041
|
0.798
|
NM_001003940
|
BMF
|
Bcl2 modifying factor
|
|
chr8_-_101315457
|
0.791
|
NM_015435
|
RNF19A
|
ring finger protein 19A
|
|
chr3_-_164914448
|
0.790
|
NM_014926
|
SLITRK3
|
SLIT and NTRK-like family, member 3
|
|
chr8_+_38585703
|
0.789
|
NM_001146216
|
TACC1
|
transforming, acidic coiled-coil containing protein 1
|
|
chr6_-_13814546
|
0.788
|
NM_001031713
|
CCDC90A
|
coiled-coil domain containing 90A
|
|
chr20_+_45523247
|
0.780
|
NM_005244
NM_172110
|
EYA2
|
eyes absent homolog 2 (Drosophila)
|
|
chr16_-_87417309
|
0.777
|
NM_024735
|
FBXO31
|
F-box protein 31
|
|
chr1_-_55681024
|
0.772
|
NM_015306
|
USP24
|
ubiquitin specific peptidase 24
|
|
chr4_+_77870864
|
0.770
|
NM_018243
|
SEPT11
|
septin 11
|
|
chr2_-_224810041
|
0.770
|
NM_020830
|
WDFY1
|
WD repeat and FYVE domain containing 1
|
|
chr12_+_26205490
|
0.766
|
NM_001164746
|
RASSF8
|
Ras association (RalGDS/AF-6) domain family (N-terminal) member 8
|
|
chr17_-_61777478
|
0.764
|
NM_030576
|
LIMD2
|
LIM domain containing 2
|
|
chr1_+_16767166
|
0.760
|
NM_001145277
NM_001145278
NM_018090
|
NECAP2
|
NECAP endocytosis associated 2
|
|
chr15_-_40398573
|
0.759
|
NM_033503
|
BMF
|
Bcl2 modifying factor
|
|
chr17_-_1012257
|
0.757
|
NM_001092
|
ABR
|
active BCR-related gene
|
|
chr19_-_10444186
|
0.757
|
NM_133452
|
RAVER1
|
ribonucleoprotein, PTB-binding 1
|
|
chr15_+_100106132
|
0.752
|
NM_001130926
NM_001130927
NM_001171894
NM_005587
|
MEF2A
|
myocyte enhancer factor 2A
|
|
chr1_+_65613771
|
0.748
|
NM_013410
|
AK4
|
adenylate kinase 4
|
|
chr15_-_77712436
|
0.745
|
NM_024776
|
PEAK1
|
NKF3 kinase family member
|
|
chr11_-_65430427
|
0.744
|
NM_001145138
NM_001243984
NM_001243985
NM_021975
|
RELA
|
v-rel reticuloendotheliosis viral oncogene homolog A (avian)
|
|
chr8_-_101322245
|
0.739
|
NM_183419
|
RNF19A
|
ring finger protein 19A
|
|
chr7_-_25164902
|
0.734
|
NM_018947
|
CYCS
|
cytochrome c, somatic
|
|
chr19_-_33166057
|
0.734
|
NM_032139
|
ANKRD27
|
ankyrin repeat domain 27 (VPS9 domain)
|
|
chr22_+_21996541
|
0.730
|
NM_022044
|
SDF2L1
|
stromal cell-derived factor 2-like 1
|
|
chr6_+_12012723
|
0.725
|
NM_002114
|
HIVEP1
|
human immunodeficiency virus type I enhancer binding protein 1
|
|
chr2_+_54785453
|
0.723
|
NM_178313
|
SPTBN1
|
spectrin, beta, non-erythrocytic 1
|
|
chr11_+_33279167
|
0.722
|
NM_001048200
NM_005734
|
HIPK3
|
homeodomain interacting protein kinase 3
|
|
chr3_+_39093480
|
0.722
|
NM_020839
|
WDR48
|
WD repeat domain 48
|
|
chr17_-_1083008
|
0.718
|
NM_021962
|
ABR
|
active BCR-related gene
|
|
chr2_-_288181
|
0.717
|
NM_001002919
|
FAM150B
|
family with sequence similarity 150, member B
|
|
chr4_-_146100793
|
0.710
|
NM_001102653
|
OTUD4
|
OTU domain containing 4
|
|
chr5_-_58882274
|
0.706
|
NM_006203
|
PDE4D
|
phosphodiesterase 4D, cAMP-specific
|
|
chr8_+_38644721
|
0.706
|
NM_001122824
NM_006283
|
TACC1
|
transforming, acidic coiled-coil containing protein 1
|
|
chr5_-_59189620
|
0.704
|
NM_001104631
|
PDE4D
|
phosphodiesterase 4D, cAMP-specific
|
|
chr21_-_19191643
|
0.704
|
NM_001100420
NM_001100421
NM_017447
|
C21orf91
|
chromosome 21 open reading frame 91
|
|
chr18_-_71959109
|
0.702
|
NM_001190807
NM_001914
NM_148923
|
CYB5A
|
cytochrome b5 type A (microsomal)
|
|
chr20_+_37101457
|
0.699
|
NM_020336
|
RALGAPB
|
Ral GTPase activating protein, beta subunit (non-catalytic)
|
|
chr4_+_108745718
|
0.698
|
NM_001136258
|
SGMS2
|
sphingomyelin synthase 2
|
|
chr6_-_169654047
|
0.696
|
NM_003247
|
THBS2
|
thrombospondin 2
|
|
chr2_+_239335567
|
0.695
|
NM_001040445
|
ASB1
|
ankyrin repeat and SOCS box containing 1
|
|
chr1_+_65613211
|
0.688
|
NM_203464
NM_001005353
|
AK4
|
adenylate kinase 4
|
|
chr17_-_1090562
|
0.686
|
NM_001159746
|
ABR
|
active BCR-related gene
|
|
chr5_-_59783885
|
0.674
|
NM_001165899
|
PDE4D
|
phosphodiesterase 4D, cAMP-specific
|
|
chrX_-_99665270
|
0.674
|
NM_001105243
NM_001184880
NM_020766
|
PCDH19
|
protocadherin 19
|
|
chr1_-_21616888
|
0.671
|
NM_001397
|
ECE1
|
endothelin converting enzyme 1
|
|
chr4_+_108814419
|
0.670
|
NM_001136257
NM_152621
|
SGMS2
|
sphingomyelin synthase 2
|
|
chr6_-_107435635
|
0.667
|
NM_001080450
|
BEND3
|
BEN domain containing 3
|
|
chr17_-_42907606
|
0.665
|
NM_005497
|
GJC1
|
gap junction protein, gamma 1, 45kDa
|
|
chr1_+_101361589
|
0.665
|
NM_001144884
NM_133496
|
SLC30A7
|
solute carrier family 30 (zinc transporter), member 7
|
|
chr2_-_24583291
|
0.665
|
NM_006277
NM_019595
NM_147152
|
ITSN2
|
intersectin 2
|
|
chr12_-_57472573
|
0.664
|
NM_001130963
NM_015257
|
TMEM194A
|
transmembrane protein 194A
|
|
chr17_-_42908178
|
0.662
|
NM_001080383
|
GJC1
|
gap junction protein, gamma 1, 45kDa
|
|
chr16_-_87525317
|
0.659
|
NM_015144
|
ZCCHC14
|
zinc finger, CCHC domain containing 14
|
|
chr5_-_16936371
|
0.656
|
NM_012334
|
MYO10
|
myosin X
|
|
chr11_-_60928878
|
0.653
|
NM_017966
|
VPS37C
|
vacuolar protein sorting 37 homolog C (S. cerevisiae)
|
|
chr9_+_100263461
|
0.651
|
NM_001166116
|
TMOD1
|
tropomodulin 1
|
|
chr19_+_39138265
|
0.648
|
NM_004924
|
ACTN4
|
actinin, alpha 4
|
|
chr1_+_168195248
|
0.641
|
NM_199344
|
SFT2D2
|
SFT2 domain containing 2
|
|
chr3_-_187463474
|
0.640
|
NM_001706
|
BCL6
|
B-cell CLL/lymphoma 6
|
|
chr2_-_208634051
|
0.639
|
NM_003468
|
FZD5
|
frizzled family receptor 5
|
|
chr17_-_28257017
|
0.636
|
NM_033389
|
SSH2
|
slingshot homolog 2 (Drosophila)
|
|
chr11_-_45687135
|
0.633
|
NM_003654
|
CHST1
|
carbohydrate (keratan sulfate Gal-6) sulfotransferase 1
|
|
chr15_-_40398286
|
0.631
|
NM_001003942
NM_001003943
|
BMF
|
Bcl2 modifying factor
|
|
chr1_+_182992329
|
0.627
|
NM_002293
|
LAMC1
|
laminin, gamma 1 (formerly LAMB2)
|
|
chr15_-_59665069
|
0.626
|
NM_004998
|
MYO1E
|
myosin IE
|
|
chr3_-_122283077
|
0.621
|
NM_001146102
NM_001146105
NM_001146104
NM_001146106
|
PARP9
|
poly (ADP-ribose) polymerase family, member 9
|
|
chr5_-_58571916
|
0.614
|
NM_001197220
|
PDE4D
|
phosphodiesterase 4D, cAMP-specific
|
|
chr9_+_100263818
|
0.611
|
NM_003275
|
TMOD1
|
tropomodulin 1
|
|
chr11_+_111473099
|
0.609
|
NM_015191
|
SIK2
|
salt-inducible kinase 2
|
|
chr9_-_115095933
|
0.608
|
NM_001163788
NM_001163790
NM_001244896
NM_001244897
NM_005156
|
PTBP3
|
polypyrimidine tract binding protein 3
|
|
chr4_+_95679075
|
0.602
|
NM_001203
|
BMPR1B
|
bone morphogenetic protein receptor, type IB
|
|
chr2_+_65215577
|
0.601
|
NM_001193493
|
SLC1A4
|
solute carrier family 1 (glutamate/neutral amino acid transporter), member 4
|
|
chr5_-_59064437
|
0.601
|
NM_001197218
|
PDE4D
|
phosphodiesterase 4D, cAMP-specific
|
|
chr1_-_21605984
|
0.598
|
NM_001113347
|
ECE1
|
endothelin converting enzyme 1
|
|
chr12_-_53625834
|
0.597
|
NM_000966
NM_001243730
NM_001243731
|
RARG
|
retinoic acid receptor, gamma
|
|
chr7_-_92465929
|
0.596
|
NM_001145306
|
CDK6
|
cyclin-dependent kinase 6
|
|
chr1_-_226926875
|
0.595
|
NM_002221
|
ITPKB
|
inositol-trisphosphate 3-kinase B
|
|
chr2_-_204399906
|
0.591
|
NM_203365
NM_213589
|
RAPH1
|
Ras association (RalGDS/AF-6) and pleckstrin homology domains 1
|
|
chr13_-_110959441
|
0.589
|
NM_001845
|
COL4A1
|
collagen, type IV, alpha 1
|
|
chr7_+_77167351
|
0.587
|
NM_001131008
NM_001131009
|
PTPN12
|
protein tyrosine phosphatase, non-receptor type 12
|
|
chr11_+_118477212
|
0.587
|
NM_015157
|
PHLDB1
|
pleckstrin homology-like domain, family B, member 1
|
|
chr14_-_61190458
|
0.585
|
NM_017420
|
SIX4
|
SIX homeobox 4
|
|
chr16_+_4382224
|
0.584
|
NM_032575
|
GLIS2
|
GLIS family zinc finger 2
|
|
chr9_-_101984233
|
0.583
|
NM_033087
|
ALG2
|
asparagine-linked glycosylation 2, alpha-1,3-mannosyltransferase homolog (S. cerevisiae)
|
|
chr5_+_149887673
|
0.583
|
NM_001543
|
NDST1
|
N-deacetylase/N-sulfotransferase (heparan glucosaminyl) 1
|
|
chr8_-_12612968
|
0.582
|
NM_152271
|
LONRF1
|
LON peptidase N-terminal domain and ring finger 1
|
|
chr2_-_153573858
|
0.581
|
NM_017892
|
PRPF40A
|
PRP40 pre-mRNA processing factor 40 homolog A (S. cerevisiae)
|
|
chr5_-_142783975
|
0.574
|
NM_001018076
|
NR3C1
|
nuclear receptor subfamily 3, group C, member 1 (glucocorticoid receptor)
|
|
chr7_-_92463211
|
0.574
|
NM_001259
|
CDK6
|
cyclin-dependent kinase 6
|
|
chr17_-_49198084
|
0.574
|
NM_001130527
NM_001130528
NM_003971
|
SPAG9
|
sperm associated antigen 9
|
|
chr10_-_14372807
|
0.573
|
NM_018027
|
FRMD4A
|
FERM domain containing 4A
|
|
chr10_-_27443309
|
0.568
|
NM_001253866
NM_014263
NM_139312
|
YME1L1
|
YME1-like 1 (S. cerevisiae)
|
|
chr2_+_65216482
|
0.567
|
NM_003038
|
SLC1A4
|
solute carrier family 1 (glutamate/neutral amino acid transporter), member 4
|
|
chr2_-_11484699
|
0.567
|
NM_004850
|
ROCK2
|
Rho-associated, coiled-coil containing protein kinase 2
|
|
chr6_-_75915566
|
0.566
|
NM_004370
NM_080645
|
COL12A1
|
collagen, type XII, alpha 1
|
|
chr6_-_134639195
|
0.564
|
NM_001143676
|
SGK1
|
serum/glucocorticoid regulated kinase 1
|
|
chr12_-_111021026
|
0.563
|
NM_139283
|
PPTC7
|
PTC7 protein phosphatase homolog (S. cerevisiae)
|
|
chr17_-_79828691
|
0.559
|
NM_001185077
|
ARHGDIA
|
Rho GDP dissociation inhibitor (GDI) alpha
|