|
chr6_+_132891460
|
1.823
|
NM_175067
|
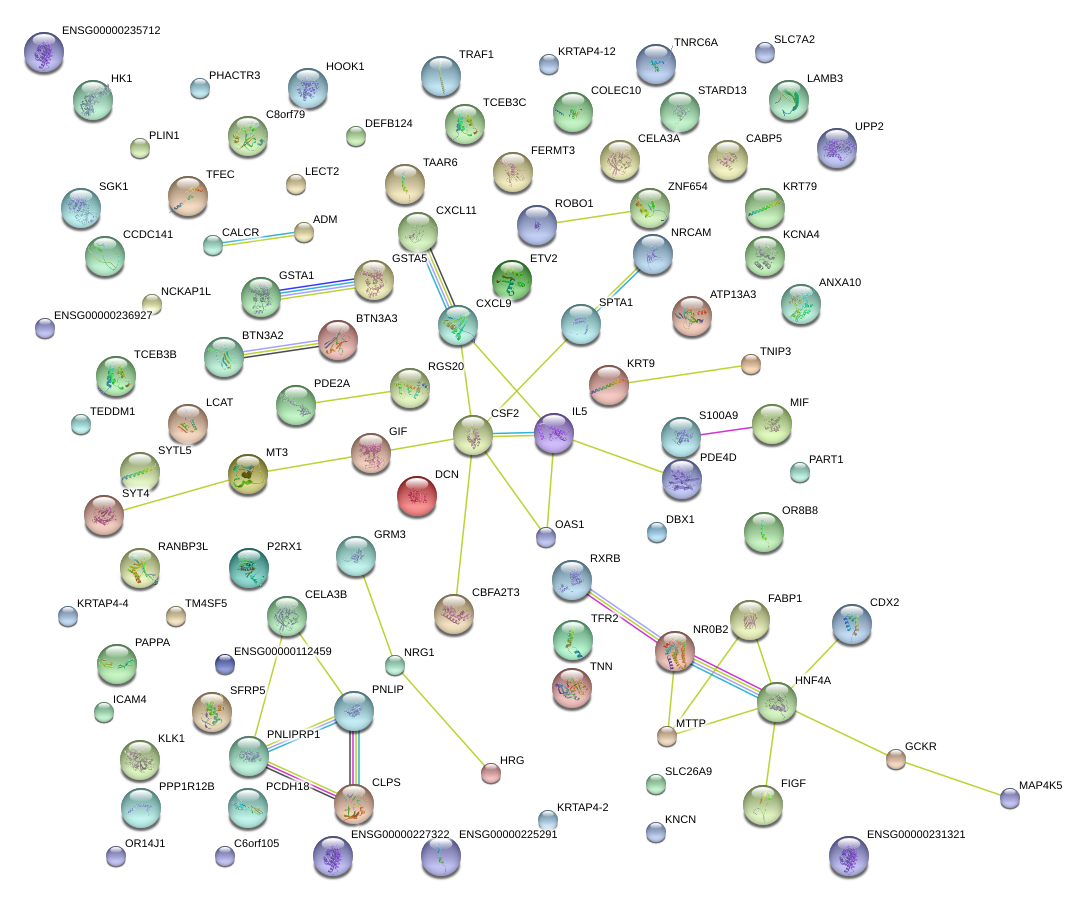
TAAR6
|
trace amine associated receptor 6
|
|
chr6_-_134498973
|
1.301
|
NM_001143677
|
SGK1
|
serum/glucocorticoid regulated kinase 1
|
|
chr5_-_59783885
|
1.127
|
NM_001165899
|
PDE4D
|
phosphodiesterase 4D, cAMP-specific
|
|
chr8_+_54764367
|
1.122
|
NM_170587
|
RGS20
|
regulator of G-protein signaling 20
|
|
chr6_-_33168448
|
1.048
|
|
RXRB
|
retinoid X receptor, beta
|
|
chr5_-_36301999
|
0.977
|
NM_001161429
NM_145000
|
RANBP3L
|
RAN binding protein 3-like
|
|
chr12_+_113344811
|
0.930
|
|
OAS1
|
2'-5'-oligoadenylate synthetase 1, 40/46kDa
|
|
chr5_+_131409484
|
0.880
|
NM_000758
|
CSF2
|
colony stimulating factor 2 (granulocyte-macrophage)
|
|
chr3_-_79817058
|
0.879
|
NM_002941
|
ROBO1
|
roundabout, axon guidance receptor, homolog 1 (Drosophila)
|
|
chr4_+_100495972
|
0.869
|
|
MTTP
|
microsomal triglyceride transfer protein
|
|
chr2_+_27719702
|
0.848
|
NM_001486
|
GCKR
|
glucokinase (hexokinase 4) regulator
|
|
chr11_+_63974190
|
0.847
|
|
FERMT3
|
fermitin family member 3
|
|
chr12_+_113344738
|
0.847
|
NM_001032409
NM_002534
NM_016816
|
OAS1
|
2'-5'-oligoadenylate synthetase 1, 40/46kDa
|
|
chr10_+_118350470
|
0.828
|
NM_006229
|
PNLIPRP1
|
pancreatic lipase-related protein 1
|
|
chr7_-_107880492
|
0.810
|
NM_001037132
|
NRCAM
|
neuronal cell adhesion molecule
|
|
chr12_-_53228061
|
0.797
|
NM_175834
|
KRT79
|
keratin 79
|
|
chr8_+_17396285
|
0.792
|
NM_001164771
NM_003046
|
SLC7A2
|
solute carrier family 7 (cationic amino acid transporter, y+ system), member 2
|
|
chr17_-_3819959
|
0.783
|
NM_002558
|
P2RX1
|
purinergic receptor P2X, ligand-gated ion channel, 1
|
|
chr13_-_28543143
|
0.750
|
|
CDX2
|
caudal type homeobox 2
|
|
chr20_+_43029973
|
0.733
|
|
HNF4A
|
hepatocyte nuclear factor 4, alpha
|
|
chr17_-_3819692
|
0.723
|
|
P2RX1
|
purinergic receptor P2X, ligand-gated ion channel, 1
|
|
chr12_-_91576579
|
0.695
|
|
DCN
|
decorin
|
|
chr4_-_76957139
|
0.689
|
NM_005409
|
CXCL11
|
chemokine (C-X-C motif) ligand 11
|
|
chr20_+_58251715
|
0.682
|
NM_001199506
|
PHACTR3
|
phosphatase and actin regulator 3
|
|
chrX_+_65235279
|
0.665
|
|
|
|
|
chr11_-_72380107
|
0.663
|
NM_001146209
|
PDE2A
|
phosphodiesterase 2A, cGMP-stimulated
|
|
chr3_+_88188261
|
0.631
|
NM_018293
|
ZNF654
|
zinc finger protein 654
|
|
chr6_+_29274402
|
0.616
|
NM_030946
|
OR14J1
|
olfactory receptor, family 14, subfamily J, member 1
|
|
chr1_+_22303417
|
0.611
|
NM_007352
|
CELA3A
CELA3B
|
chymotrypsin-like elastase family, member 3A
chymotrypsin-like elastase family, member 3B
|
|
chr4_-_122148620
|
0.611
|
NM_001244764
|
TNIP3
|
TNFAIP3 interacting protein 3
|
|
chr6_-_35765056
|
0.597
|
NM_001252597
NM_001252598
NM_001832
|
CLPS
|
colipase, pancreatic
|
|
chr6_-_11779279
|
0.589
|
NM_001143948
NM_032744
|
C6orf105
|
chromosome 6 open reading frame 105
|
|
chr11_-_59612925
|
0.584
|
NM_005142
|
GIF
|
gastric intrinsic factor (vitamin B synthesis)
|
|
chr18_-_40857245
|
0.577
|
NM_020783
|
SYT4
|
synaptotagmin IV
|
|
chr4_+_169013687
|
0.576
|
NM_007193
|
ANXA10
|
annexin A10
|
|
chr1_-_27240430
|
0.573
|
NM_021969
|
NR0B2
|
nuclear receptor subfamily 0, group B, member 2
|
|
chr17_-_39280377
|
0.561
|
NM_031854
|
KRTAP4-12
|
keratin associated protein 4-12
|
|
chr1_-_182369750
|
0.547
|
NM_172000
|
TEDDM1
|
transmembrane epididymal protein 1
|
|
chr11_+_63974144
|
0.546
|
NM_031471
NM_178443
|
FERMT3
|
fermitin family member 3
|
|
chr1_+_175036993
|
0.530
|
NM_022093
|
TNN
|
tenascin N
|
|
chr8_+_120079423
|
0.509
|
NM_006438
|
COLEC10
|
collectin sub-family member 10 (C-type lectin)
|
|
chr17_+_4675175
|
0.503
|
NM_003963
|
TM4SF5
|
transmembrane 4 L six family member 5
|
|
chr15_-_90222572
|
0.501
|
NM_001145311
NM_002666
|
PLIN1
|
perilipin 1
|
|
chr7_-_100239136
|
0.497
|
NM_003227
|
TFR2
|
transferrin receptor 2
|
|
chr1_-_158656487
|
0.491
|
NM_003126
|
SPTA1
|
spectrin, alpha, erythrocytic 1 (elliptocytosis 2)
|
|
chr5_-_135290521
|
0.489
|
NM_002302
|
LECT2
|
leukocyte cell-derived chemotaxin 2
|
|
chr16_-_55989942
|
0.484
|
NM_001190158
|
CES5A
|
carboxylesterase 5A
|
|
chr3_+_186383770
|
0.483
|
NM_000412
|
HRG
|
histidine-rich glycoprotein
|
|
chr10_-_99531712
|
0.481
|
NM_003015
|
SFRP5
|
secreted frizzled-related protein 5
|
|
chrX_+_37865834
|
0.474
|
NM_001163335
NM_138780
|
SYTL5
|
synaptotagmin-like 5
|
|
chr11_+_10326618
|
0.464
|
NM_001124
|
ADM
|
adrenomedullin
|
|
chr1_-_205912546
|
0.451
|
NM_052934
NM_134325
|
SLC26A9
|
solute carrier family 26, member 9
|
|
chr10_+_118305427
|
0.448
|
NM_000936
|
PNLIP
|
pancreatic lipase
|
|
chr11_-_124310980
|
0.438
|
NM_012378
|
OR8B8
|
olfactory receptor, family 8, subfamily B, member 8
|
|
chr1_+_202431870
|
0.435
|
NM_032103
NM_032104
|
PPP1R12B
|
protein phosphatase 1, regulatory subunit 12B
|
|
chr1_-_209825673
|
0.431
|
NM_001127641
|
LAMB3
|
laminin, beta 3
|
|
chr19_+_10397642
|
0.424
|
NM_001039132
NM_001544
NM_022377
|
ICAM4
|
intercellular adhesion molecule 4 (Landsteiner-Wiener blood group)
|
|
chr2_+_158958381
|
0.420
|
NM_173355
|
UPP2
|
uridine phosphorylase 2
|
|
chr9_+_118916069
|
0.412
|
NM_002581
|
PAPPA
|
pregnancy-associated plasma protein A, pappalysin 1
|
|
chr5_-_131879172
|
0.411
|
NM_000879
|
IL5
|
interleukin 5 (colony-stimulating factor, eosinophil)
|
|
chr1_+_87595526
|
0.409
|
|
LOC339524
|
uncharacterized LOC339524
|
|
chr2_-_179914785
|
0.405
|
NM_173648
|
CCDC141
|
coiled-coil domain containing 141
|
|
chr1_-_47016886
|
0.399
|
NM_001097611
|
KNCN
|
kinocilin
|
|
chr7_+_86273219
|
0.398
|
NM_000840
|
GRM3
|
glutamate receptor, metabotropic 3
|
|
chr16_-_89043215
|
0.397
|
NM_005187
|
CBFA2T3
|
core-binding factor, runt domain, alpha subunit 2; translocated to, 3
|
|
chr13_-_33760215
|
0.396
|
NM_001243466
NM_178007
|
STARD13
|
StAR-related lipid transfer (START) domain containing 13
|
|
chr10_+_71075609
|
0.394
|
NM_033496
|
HK1
|
hexokinase 1
|
|
chr4_-_76928601
|
0.394
|
NM_002416
|
CXCL9
|
chemokine (C-X-C motif) ligand 9
|
|
chr8_+_12803150
|
0.382
|
NM_020844
|
KIAA1456
|
KIAA1456
|
|
chr19_+_36132646
|
0.381
|
NM_014209
|
ETV2
|
ets variant 2
|
|
chr13_-_33780142
|
0.377
|
NM_001243474
NM_052851
|
STARD13
|
StAR-related lipid transfer (START) domain containing 13
|
|
chr6_+_26365397
|
0.372
|
NM_001197247
NM_001197249
NM_007047
NM_001197248
|
BTN3A2
|
butyrophilin, subfamily 3, member A2
|
|
chr9_-_123688352
|
0.370
|
|
TRAF1
|
TNF receptor-associated factor 1
|
|
chr18_-_44561967
|
0.368
|
NM_016427
|
TCEB3B
|
transcription elongation factor B polypeptide 3B (elongin A2)
|
|
chr7_-_115670774
|
0.365
|
|
TFEC
|
transcription factor EC
|
|
chr20_-_30060815
|
0.361
|
NM_001037500
|
DEFB124
|
defensin, beta 124
|
|
chr19_-_48547180
|
0.357
|
NM_019855
|
CABP5
|
calcium binding protein 5
|
|
chr2_-_88427535
|
0.356
|
NM_001443
|
FABP1
|
fatty acid binding protein 1, liver
|
|
chr5_+_59784004
|
0.355
|
|
PART1
|
prostate androgen-regulated transcript 1 (non-protein coding)
|
|
chr3_-_194188967
|
0.354
|
NM_024524
|
ATP13A3
|
ATPase type 13A3
|
|
chr16_-_67977956
|
0.352
|
NM_000229
|
LCAT
|
lecithin-cholesterol acyltransferase
|
|
chr16_+_24802421
|
0.351
|
|
TNRC6A
|
trinucleotide repeat containing 6A
|
|
chrX_-_15402469
|
0.346
|
NM_004469
|
FIGF
|
c-fos induced growth factor (vascular endothelial growth factor D)
|
|
chr7_-_93189121
|
0.345
|
NM_001164738
|
CALCR
|
calcitonin receptor
|
|
chr6_-_52710892
|
0.343
|
NM_153699
|
GSTA5
|
glutathione S-transferase alpha 5
|
|
chrX_+_78003205
|
0.342
|
NM_005296
|
LPAR4
|
lysophosphatidic acid receptor 4
|
|
chr12_-_114841702
|
0.342
|
NM_080718
|
TBX5
|
T-box 5
|
|
chr5_+_145316120
|
0.337
|
NM_152550
|
SH3RF2
|
SH3 domain containing ring finger 2
|
|
chr2_-_152830448
|
0.336
|
NM_001005747
|
CACNB4
|
calcium channel, voltage-dependent, beta 4 subunit
|
|
chr11_-_57148602
|
0.333
|
NM_006093
|
PRG3
|
proteoglycan 3
|
|
chr8_-_86290333
|
0.333
|
NM_001128829
NM_001128830
NM_001128831
NM_001738
|
CA1
|
carbonic anhydrase I
|
|
chrX_+_85517970
|
0.333
|
NM_001139515
|
DACH2
|
dachshund homolog 2 (Drosophila)
|
|
chr2_-_69098502
|
0.333
|
NM_014482
|
BMP10
|
bone morphogenetic protein 10
|
|
chr11_+_60467046
|
0.332
|
NM_031457
|
MS4A8B
|
membrane-spanning 4-domains, subfamily A, member 8B
|
|
chr7_+_20655244
|
0.332
|
NM_001163941
|
ABCB5
|
ATP-binding cassette, sub-family B (MDR/TAP), member 5
|
|
chr5_-_24645084
|
0.331
|
NM_006727
|
CDH10
|
cadherin 10, type 2 (T2-cadherin)
|
|
chr4_+_72897520
|
0.328
|
NM_004885
|
NPFFR2
|
neuropeptide FF receptor 2
|
|
chr3_+_127641901
|
0.328
|
NM_207335
|
KBTBD12
|
kelch repeat and BTB (POZ) domain containing 12
|
|
chr16_-_20338808
|
0.325
|
NM_001007240
NM_001007241
NM_001007242
NM_001502
|
GP2
|
glycoprotein 2 (zymogen granule membrane)
|
|
chr16_+_202853
|
0.325
|
NM_005332
|
HBZ
|
hemoglobin, zeta
|
|
chr18_-_28742744
|
0.322
|
NM_004948
NM_024421
|
DSC1
|
desmocollin 1
|
|
chr1_-_173176314
|
0.322
|
NM_003326
|
TNFSF4
|
tumor necrosis factor (ligand) superfamily, member 4
|
|
chr6_-_138539626
|
0.320
|
NM_021635
|
PBOV1
|
prostate and breast cancer overexpressed 1
|
|
chr6_+_26402464
|
0.319
|
NM_001145008
NM_001145009
NM_007048
NM_194441
|
BTN3A1
|
butyrophilin, subfamily 3, member A1
|
|
chr1_-_153044083
|
0.317
|
NM_001017418
|
SPRR2B
|
small proline-rich protein 2B
|
|
chr7_-_142659412
|
0.316
|
NM_000420
|
KEL
|
Kell blood group, metallo-endopeptidase
|
|
chr12_-_15091441
|
0.315
|
NM_152321
|
ERP27
|
endoplasmic reticulum protein 27
|
|
chr12_-_105322056
|
0.315
|
NM_032148
|
SLC41A2
|
solute carrier family 41, member 2
|
|
chr16_+_24857551
|
0.314
|
NM_052944
|
SLC5A11
|
solute carrier family 5 (sodium/glucose cotransporter), member 11
|
|
chr1_+_159175048
|
0.311
|
NM_001122951
|
DARC
|
Duffy blood group, chemokine receptor
|
|
chr16_+_24788568
|
0.305
|
|
TNRC6A
|
trinucleotide repeat containing 6A
|
|
chr19_+_14138959
|
0.305
|
NM_080864
|
RLN3
|
relaxin 3
|
|
chr22_+_22385340
|
0.299
|
|
|
|
|
chr10_-_75335415
|
0.297
|
NM_152586
|
USP54
|
ubiquitin specific peptidase 54
|
|
chr11_+_73357222
|
0.297
|
NM_001130033
NM_021200
|
PLEKHB1
|
pleckstrin homology domain containing, family B (evectins) member 1
|
|
chr9_+_33240165
|
0.292
|
NM_014471
|
SPINK4
|
serine peptidase inhibitor, Kazal type 4
|
|
chr11_+_131240370
|
0.292
|
NM_001048209
|
NTM
|
neurotrimin
|
|
chr12_+_45686465
|
0.292
|
NM_001142678
|
ANO6
|
anoctamin 6
|
|
chr13_+_24144402
|
0.291
|
NM_001204459
NM_148957
|
TNFRSF19
|
tumor necrosis factor receptor superfamily, member 19
|
|
chr19_+_39687600
|
0.290
|
NM_001001414
|
NCCRP1
|
non-specific cytotoxic cell receptor protein 1 homolog (zebrafish)
|
|
chr12_-_52995215
|
0.290
|
NM_001146225
NM_001146226
NM_080747
|
KRT72
|
keratin 72
|
|
chr1_-_55089068
|
0.286
|
NM_176782
|
FAM151A
|
family with sequence similarity 151, member A
|
|
chr2_-_233641225
|
0.286
|
NM_001172416
NM_001172417
NM_002242
|
KCNJ13
|
potassium inwardly-rectifying channel, subfamily J, member 13
|
|
chr2_+_90077732
|
0.284
|
|
|
|
|
chr5_+_34687663
|
0.282
|
NM_001145523
|
RAI14
|
retinoic acid induced 14
|
|
chr2_-_208994408
|
0.278
|
NM_020989
|
CRYGC
|
crystallin, gamma C
|
|
chr1_-_157811491
|
0.277
|
NM_005894
|
CD5L
|
CD5 molecule-like
|
|
chr17_-_39092714
|
0.277
|
|
KRT23
|
keratin 23 (histone deacetylase inducible)
|
|
chr18_-_64271215
|
0.276
|
NM_021153
|
CDH19
|
cadherin 19, type 2
|
|
chr7_-_142659397
|
0.275
|
|
KEL
|
Kell blood group, metallo-endopeptidase
|
|
chr12_+_4430346
|
0.270
|
NM_020375
|
C12orf5
|
chromosome 12 open reading frame 5
|
|
chr9_+_125273080
|
0.270
|
NM_054107
|
OR1J2
|
olfactory receptor, family 1, subfamily J, member 2
|
|
chr1_-_42630386
|
0.269
|
NM_033553
|
GUCA2A
|
guanylate cyclase activator 2A (guanylin)
|
|
chr2_+_169757749
|
0.269
|
NM_001081686
NM_021176
|
G6PC2
|
glucose-6-phosphatase, catalytic, 2
|
|
chr17_+_3100809
|
0.268
|
NM_012352
|
OR1A2
|
olfactory receptor, family 1, subfamily A, member 2
|
|
chr10_+_90424145
|
0.264
|
NM_001198828
NM_001198829
NM_001198830
NM_004190
|
LIPF
|
lipase, gastric
|
|
chr11_-_85437457
|
0.264
|
NM_206927
NM_206928
|
SYTL2
|
synaptotagmin-like 2
|
|
chr3_-_9290592
|
0.261
|
|
SRGAP3
|
SLIT-ROBO Rho GTPase activating protein 3
|
|
chrX_+_106161589
|
0.259
|
NM_001171095
|
CLDN2
|
claudin 2
|
|
chr1_+_22328148
|
0.258
|
NM_005747
|
CELA3A
|
chymotrypsin-like elastase family, member 3A
|
|
chr1_-_116311330
|
0.255
|
|
CASQ2
|
calsequestrin 2 (cardiac muscle)
|
|
chr2_-_200213802
|
0.255
|
|
SATB2
|
SATB homeobox 2
|
|
chr12_+_107974633
|
0.255
|
NM_001017523
|
BTBD11
|
BTB (POZ) domain containing 11
|
|
chr1_-_100643770
|
0.253
|
NM_144620
|
LRRC39
|
leucine rich repeat containing 39
|
|
chr8_-_72268720
|
0.252
|
NM_172058
NM_172059
NM_172060
|
EYA1
|
eyes absent homolog 1 (Drosophila)
|
|
chr4_+_106067031
|
0.252
|
NM_017628
|
TET2
|
tet methylcytosine dioxygenase 2
|
|
chr16_+_56899118
|
0.251
|
NM_000339
NM_001126107
NM_001126108
|
SLC12A3
|
solute carrier family 12 (sodium/chloride transporters), member 3
|
|
chr2_+_44066102
|
0.250
|
NM_022437
|
ABCG8
|
ATP-binding cassette, sub-family G (WHITE), member 8
|
|
chr2_-_136594749
|
0.250
|
NM_002299
|
LCT
|
lactase
|
|
chr14_-_107013122
|
0.249
|
|
IGHV4-31
IGHG1
|
immunoglobulin heavy variable 4-31
immunoglobulin heavy constant gamma 1 (G1m marker)
|
|
chr5_-_58652671
|
0.249
|
NM_001197219
|
PDE4D
|
phosphodiesterase 4D, cAMP-specific
|
|
chr4_-_122085475
|
0.247
|
NM_024873
|
TNIP3
|
TNFAIP3 interacting protein 3
|
|
chr1_-_116311398
|
0.244
|
NM_001232
|
CASQ2
|
calsequestrin 2 (cardiac muscle)
|
|
chr8_+_105352050
|
0.244
|
NM_030788
|
TM7SF4
|
transmembrane 7 superfamily member 4
|
|
chr1_+_215178884
|
0.242
|
NM_001017424
|
KCNK2
|
potassium channel, subfamily K, member 2
|
|
chr5_+_155754172
|
0.240
|
|
SGCD
|
sarcoglycan, delta (35kDa dystrophin-associated glycoprotein)
|
|
chr1_-_76397975
|
0.240
|
NM_080868
|
ASB17
|
ankyrin repeat and SOCS box containing 17
|
|
chr1_-_209825797
|
0.239
|
NM_000228
|
LAMB3
|
laminin, beta 3
|
|
chrX_+_49593905
|
0.238
|
NM_007003
|
PAGE4
|
P antigen family, member 4 (prostate associated)
|
|
chr7_-_44180911
|
0.238
|
NM_021223
|
MYL7
|
myosin, light chain 7, regulatory
|
|
chr12_-_52800063
|
0.234
|
NM_033033
|
KRT82
|
keratin 82
|
|
chr7_-_112727832
|
0.232
|
NM_001146265
NM_018970
|
GPR85
|
G protein-coupled receptor 85
|
|
chr6_+_167704802
|
0.231
|
NM_001143947
NM_018974
|
UNC93A
|
unc-93 homolog A (C. elegans)
|
|
chr3_-_189840225
|
0.230
|
NM_001134418
|
LEPREL1
|
leprecan-like 1
|
|
chr4_+_78432905
|
0.230
|
NM_006419
|
CXCL13
|
chemokine (C-X-C motif) ligand 13
|
|
chr3_-_167191808
|
0.230
|
NM_006217
|
SERPINI2
|
serpin peptidase inhibitor, clade I (pancpin), member 2
|
|
chr17_+_39555993
|
0.229
|
|
GAST
|
gastrin
|
|
chr12_+_9980076
|
0.229
|
NM_016523
|
KLRF1
|
killer cell lectin-like receptor subfamily F, member 1
|
|
chr2_+_69201704
|
0.228
|
NM_019617
|
GKN1
|
gastrokine 1
|
|
chr5_-_13944588
|
0.226
|
NM_001369
|
DNAH5
|
dynein, axonemal, heavy chain 5
|
|
chr3_-_112218383
|
0.225
|
NM_001085357
NM_181780
|
BTLA
|
B and T lymphocyte associated
|
|
chr1_+_50574601
|
0.224
|
|
ELAVL4
|
ELAV (embryonic lethal, abnormal vision, Drosophila)-like 4 (Hu antigen D)
|
|
chr10_-_52645430
|
0.223
|
NM_001198818
NM_001198819
NM_001198820
NM_014576
NM_138932
NM_138933
|
A1CF
|
APOBEC1 complementation factor
|
|
chr19_+_7741934
|
0.222
|
NM_174918
|
C19orf59
|
chromosome 19 open reading frame 59
|
|
chr10_+_24755459
|
0.222
|
|
KIAA1217
|
KIAA1217
|
|
chr6_-_46047978
|
0.219
|
NM_001114086
|
CLIC5
|
chloride intracellular channel 5
|
|
chr18_+_61582744
|
0.218
|
NM_005024
|
SERPINB10
|
serpin peptidase inhibitor, clade B (ovalbumin), member 10
|
|
chr17_-_42466840
|
0.218
|
NM_000419
|
ITGA2B
|
integrin, alpha 2b (platelet glycoprotein IIb of IIb/IIIa complex, antigen CD41)
|
|
chr22_+_51176623
|
0.218
|
NM_001097
|
ACR
|
acrosin
|
|
chr13_-_20110884
|
0.215
|
NM_001141968
NM_130785
NM_199254
|
TPTE2
|
transmembrane phosphoinositide 3-phosphatase and tensin homolog 2
|
|
chr13_-_46756291
|
0.215
|
|
LCP1
|
lymphocyte cytosolic protein 1 (L-plastin)
|
|
chr2_+_113885145
|
0.214
|
|
IL1RN
|
interleukin 1 receptor antagonist
|
|
chr10_+_70847857
|
0.213
|
|
SRGN
|
serglycin
|
|
chr15_+_67418053
|
0.213
|
NM_001145102
|
SMAD3
|
SMAD family member 3
|
|
chr2_-_21225640
|
0.212
|
|
APOB
|
apolipoprotein B (including Ag(x) antigen)
|
|
chr5_-_59064437
|
0.212
|
NM_001197218
|
PDE4D
|
phosphodiesterase 4D, cAMP-specific
|
|
chrX_+_38211735
|
0.210
|
NM_000531
|
OTC
|
ornithine carbamoyltransferase
|
|
chr3_+_189507448
|
0.208
|
NM_001114980
NM_001114981
NM_001114982
|
TP63
|
tumor protein p63
|
|
chr3_-_119379269
|
0.208
|
NM_022135
|
POPDC2
|
popeye domain containing 2
|
|
chr8_-_23712297
|
0.207
|
NM_003155
|
STC1
|
stanniocalcin 1
|
|
chr5_+_155753755
|
0.207
|
NM_000337
NM_001128209
NM_172244
|
SGCD
|
sarcoglycan, delta (35kDa dystrophin-associated glycoprotein)
|
|
chr8_-_95449131
|
0.205
|
NM_001205263
|
RAD54B
|
RAD54 homolog B (S. cerevisiae)
|
|
chr12_+_69742130
|
0.205
|
NM_000239
|
LYZ
|
lysozyme
|
|
chr11_+_60970983
|
0.203
|
NM_001079807
|
PGA3
PGA4
|
pepsinogen 3, group I (pepsinogen A)
pepsinogen 4, group I (pepsinogen A)
|
|
chr3_+_130569368
|
0.201
|
NM_001199180
NM_001199181
NM_001199182
|
ATP2C1
|
ATPase, Ca++ transporting, type 2C, member 1
|
|
chr4_-_164534656
|
0.201
|
NM_017923
|
MARCH1
|
membrane-associated ring finger (C3HC4) 1
|
|
chr4_+_151503076
|
0.201
|
NM_006439
|
MAB21L2
|
mab-21-like 2 (C. elegans)
|
|
chr22_-_37545944
|
0.201
|
NM_000878
|
IL2RB
|
interleukin 2 receptor, beta
|
|
chrX_+_65382432
|
0.200
|
NM_138737
|
HEPH
|
hephaestin
|
|
chr17_-_47045953
|
0.200
|
NM_004123
|
GIP
|
gastric inhibitory polypeptide
|