|
chr7_+_155089614
|
2.002
|
|
INSIG1
|
insulin induced gene 1
|
|
chr18_+_20715726
|
1.862
|
NM_001100619
|
CABLES1
|
Cdk5 and Abl enzyme substrate 1
|
|
chr2_-_86116016
|
1.291
|
NM_003896
|
ST3GAL5
|
ST3 beta-galactoside alpha-2,3-sialyltransferase 5
|
|
chr7_+_155089483
|
1.206
|
NM_005542
NM_198336
NM_198337
|
INSIG1
|
insulin induced gene 1
|
|
chr6_-_35109003
|
1.159
|
NM_001093728
NM_018679
|
TCP11
|
t-complex 11 homolog (mouse)
|
|
chr1_-_231175971
|
1.097
|
NM_198552
|
FAM89A
|
family with sequence similarity 89, member A
|
|
chr13_-_77460432
|
0.980
|
NM_138444
|
KCTD12
|
potassium channel tetramerisation domain containing 12
|
|
chr13_+_21277481
|
0.953
|
NM_138284
|
IL17D
|
interleukin 17D
|
|
chr8_+_38614756
|
0.831
|
|
TACC1
|
transforming, acidic coiled-coil containing protein 1
|
|
chr12_+_57482886
|
0.827
|
|
NAB2
|
NGFI-A binding protein 2 (EGR1 binding protein 2)
|
|
chr19_+_39833096
|
0.802
|
|
SAMD4B
|
sterile alpha motif domain containing 4B
|
|
chr15_+_67813466
|
0.757
|
NM_001143936
|
C15orf61
|
chromosome 15 open reading frame 61
|
|
chr13_+_42031679
|
0.755
|
|
C13orf15
|
chromosome 13 open reading frame 15
|
|
chr17_-_57184116
|
0.750
|
|
TRIM37
|
tripartite motif containing 37
|
|
chrX_+_150863729
|
0.743
|
NM_024082
|
PRRG3
|
proline rich Gla (G-carboxyglutamic acid) 3 (transmembrane)
|
|
chr17_+_35849950
|
0.736
|
NM_007026
|
DUSP14
|
dual specificity phosphatase 14
|
|
chr1_-_36184392
|
0.710
|
|
C1orf216
|
chromosome 1 open reading frame 216
|
|
chr18_-_500583
|
0.708
|
NM_130386
|
COLEC12
|
collectin sub-family member 12
|
|
chr12_+_8850479
|
0.705
|
NM_020734
|
RIMKLB
|
ribosomal modification protein rimK-like family member B
|
|
chr7_-_91763775
|
0.703
|
|
CYP51A1
|
cytochrome P450, family 51, subfamily A, polypeptide 1
|
|
chr1_-_33168356
|
0.698
|
NM_001161708
NM_030786
|
SYNC
|
syncoilin, intermediate filament protein
|
|
chr2_+_238536183
|
0.692
|
NM_001137550
|
LRRFIP1
|
leucine rich repeat (in FLII) interacting protein 1
|
|
chr13_+_42031690
|
0.690
|
|
C13orf15
|
chromosome 13 open reading frame 15
|
|
chr2_+_176994421
|
0.682
|
NM_001199747
NM_001199746
NM_019558
|
HOXD8
|
homeobox D8
|
|
chr17_-_57184114
|
0.679
|
|
TRIM37
|
tripartite motif containing 37
|
|
chr1_-_59042827
|
0.670
|
|
TACSTD2
|
tumor-associated calcium signal transducer 2
|
|
chr7_-_148581379
|
0.648
|
|
EZH2
|
enhancer of zeste homolog 2 (Drosophila)
|
|
chr21_-_40032563
|
0.647
|
NM_001243428
|
ERG
|
v-ets erythroblastosis virus E26 oncogene homolog (avian)
|
|
chr14_+_100438095
|
0.640
|
|
EVL
|
Enah/Vasp-like
|
|
chr1_+_61547625
|
0.627
|
NM_001134673
NM_005595
|
NFIA
|
nuclear factor I/A
|
|
chr13_+_42031525
|
0.620
|
NM_014059
|
C13orf15
|
chromosome 13 open reading frame 15
|
|
chr14_-_91526912
|
0.616
|
NM_004755
NM_182398
|
RPS6KA5
|
ribosomal protein S6 kinase, 90kDa, polypeptide 5
|
|
chr1_-_36184727
|
0.606
|
NM_152374
|
C1orf216
|
chromosome 1 open reading frame 216
|
|
chr8_-_93115453
|
0.599
|
NM_001198633
NM_175634
|
RUNX1T1
|
runt-related transcription factor 1; translocated to, 1 (cyclin D-related)
|
|
chr20_+_11871364
|
0.589
|
NM_181443
|
BTBD3
|
BTB (POZ) domain containing 3
|
|
chr7_-_91763828
|
0.576
|
NM_000786
|
CYP51A1
|
cytochrome P450, family 51, subfamily A, polypeptide 1
|
|
chr5_+_95067511
|
0.571
|
|
|
|
|
chr1_+_236305831
|
0.564
|
NM_003272
|
GPR137B
|
G protein-coupled receptor 137B
|
|
chr2_-_152684689
|
0.563
|
|
ARL5A
|
ADP-ribosylation factor-like 5A
|
|
chr17_+_30813928
|
0.562
|
NM_003885
|
CDK5R1
|
cyclin-dependent kinase 5, regulatory subunit 1 (p35)
|
|
chr9_-_126030792
|
0.558
|
NM_018387
|
STRBP
|
spermatid perinuclear RNA binding protein
|
|
chr14_-_89883306
|
0.548
|
NM_005197
|
FOXN3
|
forkhead box N3
|
|
chr1_-_45672225
|
0.543
|
NM_020883
|
ZSWIM5
|
zinc finger, SWIM-type containing 5
|
|
chr1_+_25943958
|
0.537
|
NM_020379
|
MAN1C1
|
mannosidase, alpha, class 1C, member 1
|
|
chrX_-_50557019
|
0.531
|
NM_020717
|
SHROOM4
|
shroom family member 4
|
|
chr1_+_212458867
|
0.530
|
NM_006243
|
PPP2R5A
|
protein phosphatase 2, regulatory subunit B', alpha
|
|
chr20_-_50384899
|
0.527
|
NM_006045
|
ATP9A
|
ATPase, class II, type 9A
|
|
chr1_-_94374986
|
0.524
|
NM_002061
|
GCLM
|
glutamate-cysteine ligase, modifier subunit
|
|
chr6_+_160183510
|
0.521
|
|
ACAT2
|
acetyl-CoA acetyltransferase 2
|
|
chrX_-_9733916
|
0.515
|
NM_000273
|
GPR143
|
G protein-coupled receptor 143
|
|
chr12_-_124018428
|
0.512
|
|
RILPL1
|
Rab interacting lysosomal protein-like 1
|
|
chr20_-_50384861
|
0.502
|
|
ATP9A
|
ATPase, class II, type 9A
|
|
chr12_-_108954952
|
0.498
|
|
SART3
|
squamous cell carcinoma antigen recognized by T cells 3
|
|
chr17_+_35849997
|
0.493
|
|
DUSP14
|
dual specificity phosphatase 14
|
|
chr12_-_124018066
|
0.491
|
NM_178314
|
RILPL1
|
Rab interacting lysosomal protein-like 1
|
|
chr12_-_108954942
|
0.491
|
|
SART3
|
squamous cell carcinoma antigen recognized by T cells 3
|
|
chr5_-_31532164
|
0.487
|
NM_001100412
NM_013235
|
DROSHA
|
drosha, ribonuclease type III
|
|
chr1_+_178063237
|
0.478
|
|
RASAL2
|
RAS protein activator like 2
|
|
chr2_+_113403433
|
0.477
|
NM_005415
|
SLC20A1
|
solute carrier family 20 (phosphate transporter), member 1
|
|
chr14_+_53019865
|
0.476
|
NM_001099652
|
GPR137C
|
G protein-coupled receptor 137C
|
|
chr6_+_72892371
|
0.475
|
|
RIMS1
|
regulating synaptic membrane exocytosis 1
|
|
chr11_-_116968986
|
0.474
|
NM_025164
|
SIK3
|
SIK family kinase 3
|
|
chr1_+_92495484
|
0.471
|
NM_173567
|
EPHX4
|
epoxide hydrolase 4
|
|
chr9_+_133971862
|
0.465
|
NM_001185095
NM_001185096
NM_031426
|
AIF1L
|
allograft inflammatory factor 1-like
|
|
chr1_+_178062955
|
0.463
|
|
RASAL2
|
RAS protein activator like 2
|
|
chr8_+_42396716
|
0.460
|
NM_138436
NM_001135674
NM_001135675
|
C8orf40
|
chromosome 8 open reading frame 40
|
|
chr7_+_1097140
|
0.455
|
NM_138445
|
GPR146
|
G protein-coupled receptor 146
|
|
chr14_+_77228132
|
0.454
|
NM_014909
|
VASH1
|
vasohibin 1
|
|
chr15_+_67835002
|
0.453
|
NM_002757
NM_145160
|
MAP2K5
|
mitogen-activated protein kinase kinase 5
|
|
chr7_-_15726026
|
0.453
|
|
MEOX2
|
mesenchyme homeobox 2
|
|
chr1_+_178063302
|
0.453
|
|
RASAL2
|
RAS protein activator like 2
|
|
chrX_-_62570968
|
0.452
|
NM_001012968
|
SPIN4
|
spindlin family, member 4
|
|
chr16_-_88772732
|
0.452
|
NM_001171815
|
RNF166
|
ring finger protein 166
|
|
chr11_-_71159371
|
0.449
|
|
DHCR7
|
7-dehydrocholesterol reductase
|
|
chr7_+_89783789
|
0.449
|
|
STEAP1
|
six transmembrane epithelial antigen of the prostate 1
|
|
chr15_+_99645152
|
0.445
|
NM_015286
NM_145728
|
SYNM
|
synemin, intermediate filament protein
|
|
chr7_+_89783688
|
0.434
|
NM_012449
|
STEAP1
|
six transmembrane epithelial antigen of the prostate 1
|
|
chr19_+_18111923
|
0.433
|
NM_001025604
|
ARRDC2
|
arrestin domain containing 2
|
|
chrX_+_107069459
|
0.432
|
|
MID2
|
midline 2
|
|
chr1_+_43232928
|
0.431
|
|
C1orf50
|
chromosome 1 open reading frame 50
|
|
chr1_+_65991390
|
0.431
|
|
LEPR
|
leptin receptor
|
|
chr1_+_65991357
|
0.430
|
NM_001198687
NM_001198688
NM_001198689
|
LEPR
|
leptin receptor
|
|
chr9_-_13279562
|
0.426
|
|
MPDZ
|
multiple PDZ domain protein
|
|
chr13_-_29069215
|
0.425
|
NM_001159920
NM_001160030
NM_001160031
NM_002019
|
FLT1
|
fms-related tyrosine kinase 1 (vascular endothelial growth factor/vascular permeability factor receptor)
|
|
chr7_+_106685007
|
0.424
|
NM_002736
|
PRKAR2B
|
protein kinase, cAMP-dependent, regulatory, type II, beta
|
|
chr15_-_75918028
|
0.421
|
|
SNUPN
|
snurportin 1
|
|
chr9_-_100459623
|
0.415
|
NM_000380
|
XPA
|
xeroderma pigmentosum, complementation group A
|
|
chr12_+_123319977
|
0.409
|
NM_003959
|
HIP1R
|
huntingtin interacting protein 1 related
|
|
chr12_+_13197284
|
0.406
|
NM_020853
|
KIAA1467
|
KIAA1467
|
|
chr16_-_1821503
|
0.406
|
|
NME3
|
non-metastatic cells 3, protein expressed in
|
|
chr6_+_52442104
|
0.404
|
|
FLJ37798
|
uncharacterized LOC401264
|
|
chr13_+_35516390
|
0.404
|
NM_015678
|
NBEA
|
neurobeachin
|
|
chr1_-_53793743
|
0.400
|
NM_001018054
NM_004631
NM_017522
NM_033300
|
LRP8
|
low density lipoprotein receptor-related protein 8, apolipoprotein e receptor
|
|
chr16_-_67217825
|
0.400
|
NM_001040715
|
KIAA0895L
|
KIAA0895-like
|
|
chr11_+_46299161
|
0.399
|
NM_052854
|
CREB3L1
|
cAMP responsive element binding protein 3-like 1
|
|
chr11_+_86748870
|
0.397
|
NM_001168724
NM_022918
|
TMEM135
|
transmembrane protein 135
|
|
chr11_-_119234628
|
0.397
|
|
USP2
|
ubiquitin specific peptidase 2
|
|
chr16_-_1821709
|
0.395
|
NM_002513
|
NME3
|
non-metastatic cells 3, protein expressed in
|
|
chr17_+_78075390
|
0.395
|
|
GAA
|
glucosidase, alpha; acid
|
|
chr17_+_4402128
|
0.395
|
NM_001124758
|
SPNS2
|
spinster homolog 2 (Drosophila)
|
|
chr9_-_100459556
|
0.395
|
|
XPA
|
xeroderma pigmentosum, complementation group A
|
|
chr5_+_149737296
|
0.395
|
|
TCOF1
|
Treacher Collins-Franceschetti syndrome 1
|
|
chr17_+_45727303
|
0.394
|
|
KPNB1
|
karyopherin (importin) beta 1
|
|
chr8_+_96037186
|
0.390
|
NM_152416
|
C8orf38
|
chromosome 8 open reading frame 38
|
|
chr6_+_137143748
|
0.388
|
|
PEX7
|
peroxisomal biogenesis factor 7
|
|
chr22_+_29279573
|
0.388
|
NM_001206998
|
ZNRF3
|
zinc and ring finger 3
|
|
chr20_+_42544781
|
0.386
|
NM_001098796
NM_032883
|
TOX2
|
TOX high mobility group box family member 2
|
|
chr4_+_108852671
|
0.383
|
NM_183075
|
CYP2U1
|
cytochrome P450, family 2, subfamily U, polypeptide 1
|
|
chr14_-_103995336
|
0.380
|
|
|
|
|
chr17_+_45726838
|
0.376
|
|
KPNB1
|
karyopherin (importin) beta 1
|
|
chr19_-_2308155
|
0.376
|
NM_001101391
|
LINGO3
|
leucine rich repeat and Ig domain containing 3
|
|
chr3_+_110790460
|
0.374
|
NM_001243286
NM_015480
|
PVRL3
|
poliovirus receptor-related 3
|
|
chr9_+_133971902
|
0.370
|
|
AIF1L
|
allograft inflammatory factor 1-like
|
|
chr7_-_148581377
|
0.369
|
|
EZH2
|
enhancer of zeste homolog 2 (Drosophila)
|
|
chr9_-_126030854
|
0.367
|
NM_001171137
|
STRBP
|
spermatid perinuclear RNA binding protein
|
|
chr13_-_21348081
|
0.367
|
|
N6AMT2
|
N-6 adenine-specific DNA methyltransferase 2 (putative)
|
|
chr10_-_105452878
|
0.366
|
|
SH3PXD2A
|
SH3 and PX domains 2A
|
|
chr17_+_75136985
|
0.365
|
NM_001039573
NM_001143998
NM_001143999
NM_003003
|
SEC14L1
|
SEC14-like 1 (S. cerevisiae)
|
|
chr6_+_86159738
|
0.363
|
|
NT5E
|
5'-nucleotidase, ecto (CD73)
|
|
chr17_+_78075299
|
0.363
|
NM_000152
NM_001079803
NM_001079804
|
GAA
|
glucosidase, alpha; acid
|
|
chr7_+_116312412
|
0.358
|
NM_000245
NM_001127500
|
MET
|
met proto-oncogene (hepatocyte growth factor receptor)
|
|
chr4_+_81952118
|
0.357
|
NM_001201
|
BMP3
|
bone morphogenetic protein 3
|
|
chr12_-_123920967
|
0.356
|
|
RILPL2
|
Rab interacting lysosomal protein-like 2
|
|
chr22_-_29075708
|
0.355
|
NM_001145418
|
TTC28
|
tetratricopeptide repeat domain 28
|
|
chr1_+_43232911
|
0.355
|
NM_024097
|
C1orf50
|
chromosome 1 open reading frame 50
|
|
chr12_+_68042493
|
0.354
|
NM_003583
NM_006482
|
DYRK2
|
dual-specificity tyrosine-(Y)-phosphorylation regulated kinase 2
|
|
chr7_-_91764036
|
0.354
|
NM_001146152
|
CYP51A1
|
cytochrome P450, family 51, subfamily A, polypeptide 1
|
|
chr2_+_10183630
|
0.353
|
NM_003597
NM_001177716
|
KLF11
|
Kruppel-like factor 11
|
|
chr1_+_78511588
|
0.351
|
NM_017655
|
GIPC2
|
GIPC PDZ domain containing family, member 2
|
|
chr6_+_57037333
|
0.350
|
|
BAG2
|
BCL2-associated athanogene 2
|
|
chr12_+_56661026
|
0.348
|
NM_001099337
|
COQ10A
|
coenzyme Q10 homolog A (S. cerevisiae)
|
|
chr8_-_48650683
|
0.347
|
|
CEBPD
|
CCAAT/enhancer binding protein (C/EBP), delta
|
|
chr19_+_1524072
|
0.345
|
NM_001243079
|
PLK5
|
polo-like kinase 5
|
|
chr7_-_148581297
|
0.344
|
|
EZH2
|
enhancer of zeste homolog 2 (Drosophila)
|
|
chr17_+_15848422
|
0.343
|
|
ADORA2B
|
adenosine A2b receptor
|
|
chr17_-_57184174
|
0.340
|
NM_001005207
NM_015294
|
TRIM37
|
tripartite motif containing 37
|
|
chr7_+_24612714
|
0.340
|
NM_016447
|
MPP6
|
membrane protein, palmitoylated 6 (MAGUK p55 subfamily member 6)
|
|
chr14_-_53019036
|
0.337
|
NM_001160047
NM_020784
|
TXNDC16
|
thioredoxin domain containing 16
|
|
chr7_+_94139331
|
0.337
|
|
CASD1
|
CAS1 domain containing 1
|
|
chr19_+_32896515
|
0.337
|
NM_001172774
|
DPY19L3
|
dpy-19-like 3 (C. elegans)
|
|
chr2_-_172750724
|
0.336
|
NM_003705
|
SLC25A12
|
solute carrier family 25 (mitochondrial carrier, Aralar), member 12
|
|
chr16_-_84178685
|
0.335
|
NM_001146051
NM_031463
|
HSDL1
|
hydroxysteroid dehydrogenase like 1
|
|
chr3_+_138327918
|
0.335
|
NM_018147
|
FAIM
|
Fas apoptotic inhibitory molecule
|
|
chr7_-_91763677
|
0.334
|
|
CYP51A1
|
cytochrome P450, family 51, subfamily A, polypeptide 1
|
|
chr3_-_187871816
|
0.334
|
|
LPP-AS2
|
LPP antisense RNA 2 (non-protein coding)
|
|
chr6_+_160183062
|
0.333
|
|
ACAT2
|
acetyl-CoA acetyltransferase 2
|
|
chr2_+_181845088
|
0.333
|
NM_182678
NM_006357
|
UBE2E3
|
ubiquitin-conjugating enzyme E2E 3
|
|
chrY_+_6114263
|
0.330
|
NM_022573
|
TSPY2
TSPY1
|
testis specific protein, Y-linked 2
testis specific protein, Y-linked 1
|
|
chr12_-_123921219
|
0.329
|
NM_145058
|
RILPL2
|
Rab interacting lysosomal protein-like 2
|
|
chr9_+_131451519
|
0.329
|
|
SET
|
SET nuclear oncogene
|
|
chr7_-_148581403
|
0.327
|
NM_001203247
NM_001203248
NM_004456
NM_152998
|
EZH2
|
enhancer of zeste homolog 2 (Drosophila)
|
|
chr1_+_63833324
|
0.324
|
|
ALG6
|
asparagine-linked glycosylation 6, alpha-1,3-glucosyltransferase homolog (S. cerevisiae)
|
|
chr2_-_62733475
|
0.322
|
NM_198276
|
TMEM17
|
transmembrane protein 17
|
|
chr1_+_210406194
|
0.322
|
NM_019605
|
SERTAD4
|
SERTA domain containing 4
|
|
chr1_-_45452266
|
0.321
|
NM_001166588
NM_020365
|
EIF2B3
|
eukaryotic translation initiation factor 2B, subunit 3 gamma, 58kDa
|
|
chr14_-_23821423
|
0.315
|
NM_020372
|
SLC22A17
|
solute carrier family 22, member 17
|
|
chr8_+_87354958
|
0.315
|
NM_007013
|
WWP1
|
WW domain containing E3 ubiquitin protein ligase 1
|
|
chr2_-_43453737
|
0.314
|
NM_006887
|
ZFP36L2
|
zinc finger protein 36, C3H type-like 2
|
|
chr1_-_55352818
|
0.313
|
|
DHCR24
|
24-dehydrocholesterol reductase
|
|
chr16_+_30406711
|
0.313
|
NM_152652
|
ZNF48
|
zinc finger protein 48
|
|
chr10_+_8096633
|
0.312
|
NM_001002295
NM_002051
|
GATA3
|
GATA binding protein 3
|
|
chr15_-_83680332
|
0.311
|
|
C15orf40
|
chromosome 15 open reading frame 40
|
|
chr12_+_3068442
|
0.311
|
NM_003213
NM_201441
NM_201443
|
TEAD4
|
TEA domain family member 4
|
|
chr12_+_3186520
|
0.309
|
NM_001168320
NM_006675
|
TSPAN9
|
tetraspanin 9
|
|
chr6_-_150346599
|
0.308
|
NM_130900
|
RAET1L
|
retinoic acid early transcript 1L
|
|
chrX_+_135067573
|
0.307
|
NM_001177651
NM_001042537
NM_006359
|
SLC9A6
|
solute carrier family 9 (sodium/hydrogen exchanger), member 6
|
|
chr16_+_2205809
|
0.307
|
|
TRAF7
|
TNF receptor-associated factor 7
|
|
chr14_-_30396811
|
0.307
|
NM_002742
|
PRKD1
|
protein kinase D1
|
|
chr9_+_134378335
|
0.306
|
|
POMT1
|
protein-O-mannosyltransferase 1
|
|
chr9_-_126692184
|
0.305
|
NM_020946
NM_024820
|
DENND1A
|
DENN/MADD domain containing 1A
|
|
chr1_+_227127937
|
0.304
|
NM_020247
|
ADCK3
|
aarF domain containing kinase 3
|
|
chr1_+_63833260
|
0.304
|
NM_013339
|
ALG6
|
asparagine-linked glycosylation 6, alpha-1,3-glucosyltransferase homolog (S. cerevisiae)
|
|
chr13_-_110438896
|
0.300
|
NM_003749
|
IRS2
|
insulin receptor substrate 2
|
|
chr2_+_10184371
|
0.300
|
NM_001177718
|
KLF11
|
Kruppel-like factor 11
|
|
chr15_-_83680369
|
0.299
|
NM_001160113
NM_001160114
NM_001160115
NM_001160116
NM_144597
|
C15orf40
|
chromosome 15 open reading frame 40
|
|
chr2_+_7057471
|
0.298
|
NM_014746
|
RNF144A
|
ring finger protein 144A
|
|
chr6_+_15245702
|
0.297
|
|
JARID2
|
jumonji, AT rich interactive domain 2
|
|
chr14_-_54421269
|
0.297
|
NM_130851
|
BMP4
|
bone morphogenetic protein 4
|
|
chr1_+_227127959
|
0.296
|
|
ADCK3
|
aarF domain containing kinase 3
|
|
chr9_+_134378353
|
0.296
|
|
POMT1
|
protein-O-mannosyltransferase 1
|
|
chr21_+_35445877
|
0.296
|
|
MRPS6
|
mitochondrial ribosomal protein S6
|
|
chr3_+_193853937
|
0.295
|
|
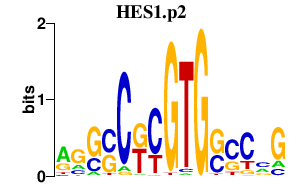
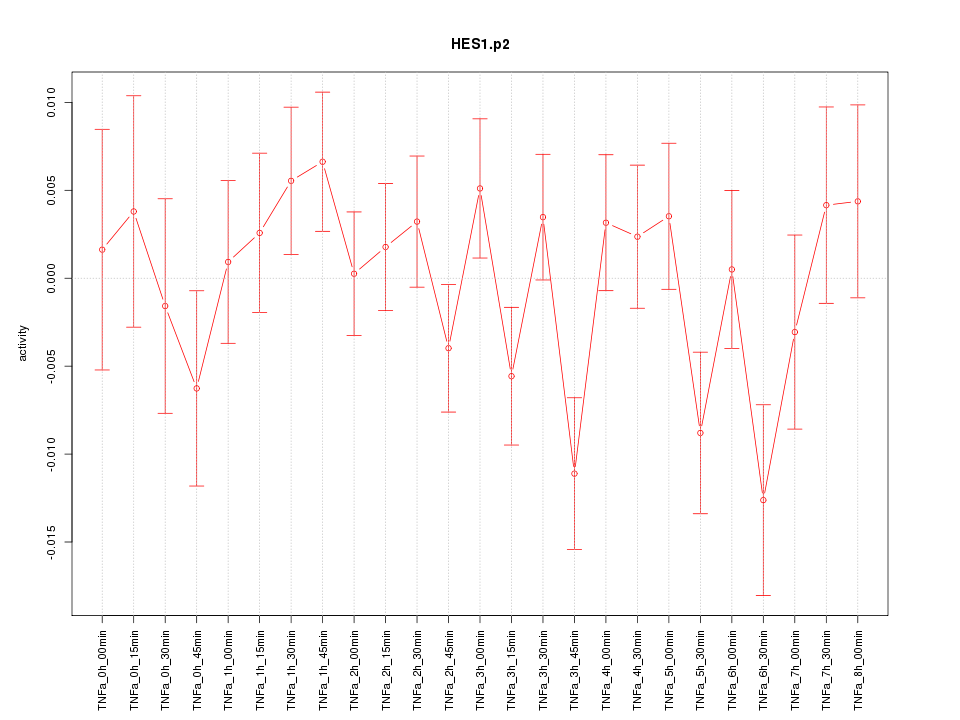
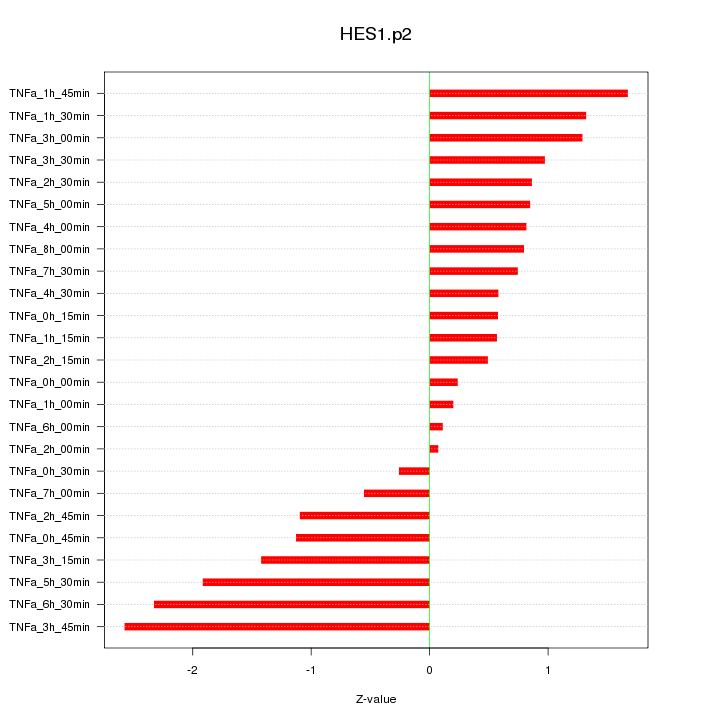
HES1
|
hairy and enhancer of split 1, (Drosophila)
|
|
chr21_+_35445808
|
0.295
|
NM_032476
NM_006933
|
MRPS6
SLC5A3
|
mitochondrial ribosomal protein S6
solute carrier family 5 (sodium/myo-inositol cotransporter), member 3
|
|
chr12_-_108954929
|
0.295
|
|
SART3
|
squamous cell carcinoma antigen recognized by T cells 3
|
|
chr14_+_77227783
|
0.295
|
|
|
|
|
chr10_-_94333847
|
0.295
|
NM_004969
|
IDE
|
insulin-degrading enzyme
|
|
chr6_+_160182988
|
0.294
|
NM_005891
|
ACAT2
|
acetyl-CoA acetyltransferase 2
|
|
chr2_+_181845803
|
0.293
|
|
UBE2E3
|
ubiquitin-conjugating enzyme E2E 3
|
|
chr7_+_64498643
|
0.293
|
|
CCT6P3
|
chaperonin containing TCP1, subunit 6 (zeta) pseudogene 3
|
|
chr2_+_29117503
|
0.293
|
NM_015131
|
WDR43
|
WD repeat domain 43
|
|
chr16_+_55542981
|
0.291
|
|
LPCAT2
|
lysophosphatidylcholine acyltransferase 2
|
|
chr19_+_35760002
|
0.291
|
|
USF2
|
upstream transcription factor 2, c-fos interacting
|
|
chr11_+_64001974
|
0.290
|
NM_001243733
NM_003377
|
VEGFB
|
vascular endothelial growth factor B
|
|
chr5_+_176237435
|
0.290
|
NM_133369
|
UNC5A
|
unc-5 homolog A (C. elegans)
|
|
chr5_+_139028483
|
0.289
|
|
CXXC5
|
CXXC finger protein 5
|
|
chr1_-_168105620
|
0.288
|
NM_153832
|
GPR161
|
G protein-coupled receptor 161
|
|
chrX_+_9754465
|
0.288
|
NM_001649
|
SHROOM2
|
shroom family member 2
|
|
chr17_-_882905
|
0.287
|
NM_022463
|
NXN
|
nucleoredoxin
|
|
chr1_-_45452215
|
0.287
|
|
EIF2B3
|
eukaryotic translation initiation factor 2B, subunit 3 gamma, 58kDa
|
|
chr1_+_227127999
|
0.286
|
|
ADCK3
|
aarF domain containing kinase 3
|