|
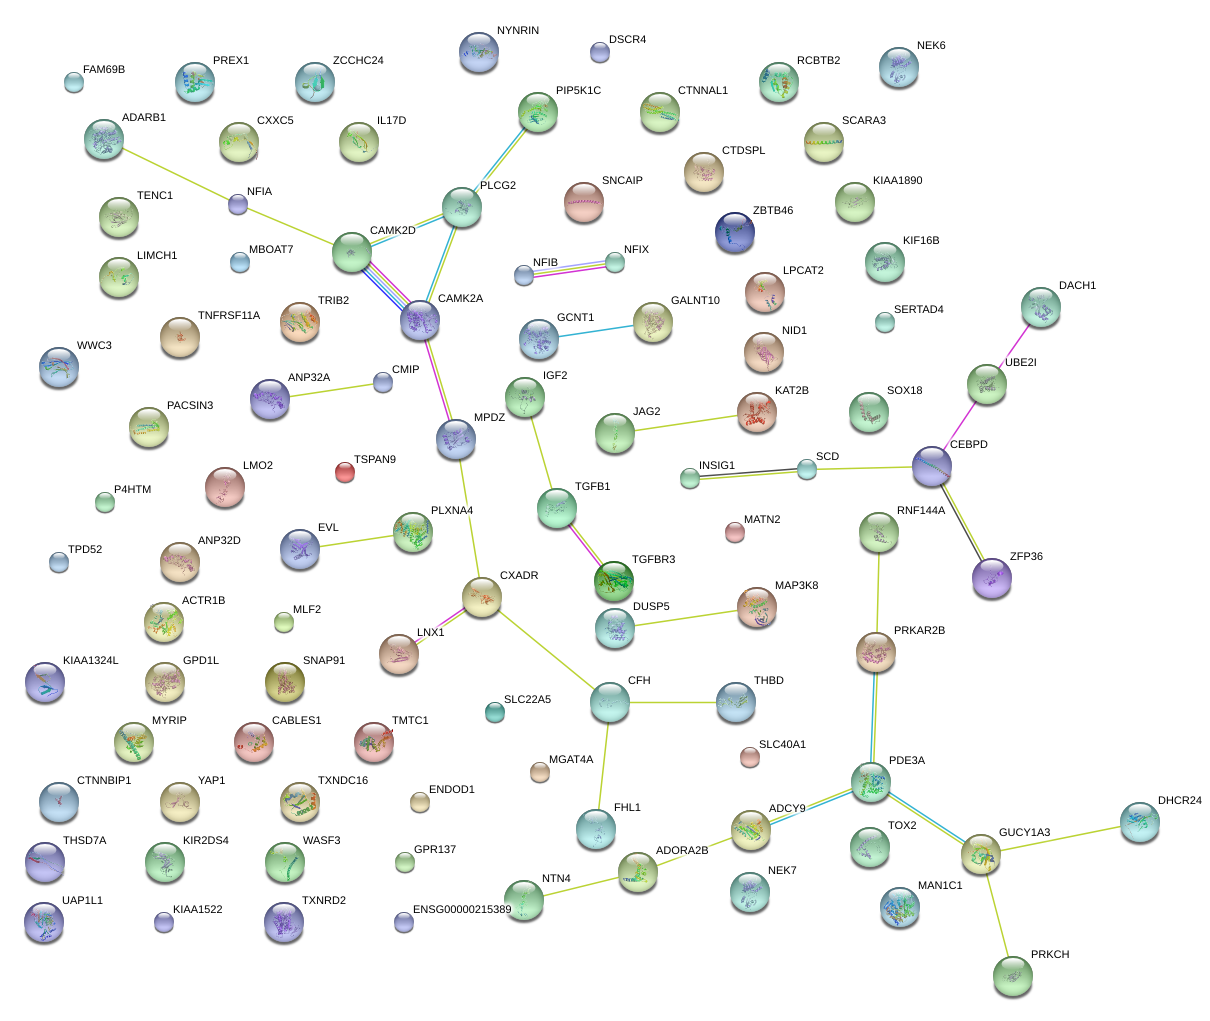
chr11_-_33891485
|
9.766
|
NM_001142315
|
LMO2
|
LIM domain only 2 (rhombotin-like 1)
|
|
chr11_-_33891258
|
9.289
|
|
LMO2
|
LIM domain only 2 (rhombotin-like 1)
|
|
chr1_+_61547625
|
8.852
|
NM_001134673
NM_005595
|
NFIA
|
nuclear factor I/A
|
|
chr1_-_92351613
|
8.576
|
NM_001195683
NM_003243
|
TGFBR3
|
transforming growth factor, beta receptor III
|
|
chr2_+_7057471
|
7.971
|
NM_014746
|
RNF144A
|
ring finger protein 144A
|
|
chr20_-_62462568
|
7.937
|
|
ZBTB46
|
zinc finger and BTB domain containing 46
|
|
chr11_-_33891361
|
7.900
|
NM_001142316
|
LMO2
|
LIM domain only 2 (rhombotin-like 1)
|
|
chr1_-_92351476
|
7.809
|
|
TGFBR3
|
transforming growth factor, beta receptor III
|
|
chr11_-_33890931
|
7.705
|
|
LMO2
|
LIM domain only 2 (rhombotin-like 1)
|
|
chr2_-_99347430
|
6.555
|
|
MGAT4A
|
mannosyl (alpha-1,3-)-glycoprotein beta-1,4-N-acetylglucosaminyltransferase, isozyme A
|
|
chr20_-_62680880
|
6.316
|
NM_018419
|
SOX18
|
SRY (sex determining region Y)-box 18
|
|
chr14_-_105635114
|
5.733
|
NM_002226
NM_145159
|
JAG2
|
jagged 2
|
|
chr9_-_111775721
|
5.639
|
NM_003798
|
CTNNAL1
|
catenin (cadherin-associated protein), alpha-like 1
|
|
chr7_-_132261268
|
5.570
|
NM_001105543
NM_020911
|
PLXNA4
|
plexin A4
|
|
chr7_-_11871735
|
5.570
|
NM_015204
|
THSD7A
|
thrombospondin, type I, domain containing 7A
|
|
chr14_-_105634708
|
5.363
|
|
JAG2
|
jagged 2
|
|
chr11_+_94822937
|
5.314
|
NM_015036
|
ENDOD1
|
endonuclease domain containing 1
|
|
chr8_+_27491384
|
5.094
|
|
SCARA3
|
scavenger receptor class A, member 3
|
|
chr20_-_23030141
|
5.034
|
NM_000361
|
THBD
|
thrombomodulin
|
|
chr8_-_48650683
|
4.986
|
|
CEBPD
|
CCAAT/enhancer binding protein (C/EBP), delta
|
|
chr13_-_72440143
|
4.960
|
|
DACH1
|
dachshund homolog 1 (Drosophila)
|
|
chr10_-_81205091
|
4.886
|
NM_153367
|
ZCCHC24
|
zinc finger, CCHC domain containing 24
|
|
chr3_+_20081853
|
4.856
|
|
KAT2B
|
K(lysine) acetyltransferase 2B
|
|
chr12_+_3186520
|
4.716
|
NM_001168320
NM_006675
|
TSPAN9
|
tetraspanin 9
|
|
chr22_-_19929447
|
4.676
|
|
TXNRD2
|
thioredoxin reductase 2
|
|
chr18_+_59992519
|
4.654
|
NM_003839
|
TNFRSF11A
|
tumor necrosis factor receptor superfamily, member 11a, NFKB activator
|
|
chr3_+_39851028
|
4.635
|
NM_015460
|
MYRIP
|
myosin VIIA and Rab interacting protein
|
|
chr9_+_79074067
|
4.563
|
NM_001097633
NM_001490
|
GCNT1
|
glucosaminyl (N-acetyl) transferase 1, core 2
|
|
chr9_+_139606916
|
4.511
|
NM_152421
|
FAM69B
|
family with sequence similarity 69, member B
|
|
chr11_+_101980736
|
4.480
|
NM_001130145
NM_001195044
NM_006106
|
YAP1
|
Yes-associated protein 1
|
|
chr3_+_32148136
|
4.471
|
|
GPD1L
|
glycerol-3-phosphate dehydrogenase 1-like
|
|
chr9_+_139972195
|
4.453
|
|
UAP1L1
|
UDP-N-acteylglucosamine pyrophosphorylase 1-like 1
|
|
chr3_+_32148000
|
4.386
|
NM_015141
|
GPD1L
|
glycerol-3-phosphate dehydrogenase 1-like
|
|
chr2_+_12856813
|
4.354
|
NM_021643
|
TRIB2
|
tribbles homolog 2 (Drosophila)
|
|
chr4_+_41362750
|
4.223
|
NM_001112717
NM_001112718
NM_014988
|
LIMCH1
|
LIM and calponin homology domains 1
|
|
chr1_-_236228374
|
4.206
|
|
NID1
|
nidogen 1
|
|
chr8_+_27491460
|
4.169
|
NM_016240
NM_182826
|
SCARA3
|
scavenger receptor class A, member 3
|
|
chr19_+_39897457
|
4.018
|
NM_003407
|
ZFP36
|
zinc finger protein 36, C3H type, homolog (mouse)
|
|
chr1_+_33207343
|
4.002
|
NM_020888
|
KIAA1522
|
KIAA1522
|
|
chr16_+_81478774
|
4.001
|
NM_198390
|
CMIP
|
c-Maf inducing protein
|
|
chr4_+_156588811
|
3.993
|
NM_001130684
|
GUCY1A3
|
guanylate cyclase 1, soluble, alpha 3
|
|
chr7_+_155089614
|
3.990
|
|
INSIG1
|
insulin induced gene 1
|
|
chr14_+_24867926
|
3.974
|
NM_025081
|
NYNRIN
|
NYN domain and retroviral integrase containing
|
|
chr3_+_49027281
|
3.939
|
NM_177938
NM_177939
|
P4HTM
|
prolyl 4-hydroxylase, transmembrane (endoplasmic reticulum)
|
|
chr12_-_96184510
|
3.914
|
NM_021229
|
NTN4
|
netrin 4
|
|
chr6_-_84419018
|
3.909
|
|
SNAP91
|
synaptosomal-associated protein, 91kDa homolog (mouse)
|
|
chr2_-_99347588
|
3.742
|
NM_012214
|
MGAT4A
|
mannosyl (alpha-1,3-)-glycoprotein beta-1,4-N-acetylglucosaminyltransferase, isozyme A
|
|
chr3_+_37903643
|
3.727
|
NM_001008392
NM_005808
|
CTDSPL
|
CTD (carboxy-terminal domain, RNA polymerase II, polypeptide A) small phosphatase-like
|
|
chr3_+_49027770
|
3.680
|
|
P4HTM
|
prolyl 4-hydroxylase, transmembrane (endoplasmic reticulum)
|
|
chr12_-_96184346
|
3.674
|
|
NTN4
|
netrin 4
|
|
chrX_+_9983793
|
3.573
|
NM_015691
|
WWC3
|
WWC family member 3
|
|
chr9_+_139971938
|
3.570
|
NM_207309
|
UAP1L1
|
UDP-N-acteylglucosamine pyrophosphorylase 1-like 1
|
|
chr17_+_15848230
|
3.539
|
NM_000676
|
ADORA2B
|
adenosine A2b receptor
|
|
chr12_+_20522178
|
3.514
|
NM_000921
|
PDE3A
|
phosphodiesterase 3A, cGMP-inhibited
|
|
chr16_+_55543044
|
3.454
|
|
LPCAT2
|
lysophosphatidylcholine acyltransferase 2
|
|
chr15_-_23378217
|
3.417
|
|
HERC2P2
|
hect domain and RLD 2 pseudogene 2
|
|
chr1_-_236228382
|
3.337
|
|
NID1
|
nidogen 1
|
|
chr19_-_41859519
|
3.278
|
|
TGFB1
|
transforming growth factor, beta 1
|
|
chrX_+_135229536
|
3.261
|
NM_001159702
NM_001159703
NM_001449
|
FHL1
|
four and a half LIM domains 1
|
|
chr7_+_155089483
|
3.238
|
NM_005542
NM_198336
NM_198337
|
INSIG1
|
insulin induced gene 1
|
|
chr16_+_81812925
|
3.214
|
|
PLCG2
|
phospholipase C, gamma 2 (phosphatidylinositol-specific)
|
|
chr15_-_69113213
|
3.189
|
|
ANP32A
|
acidic (leucine-rich) nuclear phosphoprotein 32 family, member A
|
|
chr4_+_156587861
|
3.187
|
NM_000856
NM_001130682
NM_001130686
NM_001130687
NM_001130683
NM_001130685
|
GUCY1A3
|
guanylate cyclase 1, soluble, alpha 3
|
|
chr16_+_81812899
|
3.183
|
|
PLCG2
|
phospholipase C, gamma 2 (phosphatidylinositol-specific)
|
|
chr10_+_102106958
|
3.158
|
|
SCD
|
stearoyl-CoA desaturase (delta-9-desaturase)
|
|
chr16_-_4166021
|
3.130
|
|
ADCY9
|
adenylate cyclase 9
|
|
chr8_+_98881277
|
3.103
|
NM_002380
NM_030583
|
MATN2
|
matrilin 2
|
|
chr18_+_20715726
|
3.054
|
NM_001100619
|
CABLES1
|
Cdk5 and Abl enzyme substrate 1
|
|
chr1_-_55352893
|
3.017
|
|
DHCR24
|
24-dehydrocholesterol reductase
|
|
chr8_-_48650703
|
3.017
|
NM_005195
|
CEBPD
|
CCAAT/enhancer binding protein (C/EBP), delta
|
|
chr10_+_112257624
|
3.007
|
NM_004419
|
DUSP5
|
dual specificity phosphatase 5
|
|
chr7_-_86688944
|
2.982
|
NM_001142749
|
KIAA1324L
|
KIAA1324-like
|
|
chr8_-_4852262
|
2.926
|
NM_033225
|
CSMD1
|
CUB and Sushi multiple domains 1
|
|
chr1_+_25943958
|
2.913
|
NM_020379
|
MAN1C1
|
mannosidase, alpha, class 1C, member 1
|
|
chr20_+_42543417
|
2.883
|
NM_001098797
|
TOX2
|
TOX high mobility group box family member 2
|
|
chr1_+_210406194
|
2.878
|
NM_019605
|
SERTAD4
|
SERTA domain containing 4
|
|
chr19_-_54693453
|
2.863
|
|
MBOAT7
|
membrane bound O-acyltransferase domain containing 7
|
|
chr21_+_46494433
|
2.857
|
NM_001112
NM_001160230
NM_015833
NM_015834
|
ADARB1
|
adenosine deaminase, RNA-specific, B1
|
|
chr5_+_139028483
|
2.854
|
|
CXXC5
|
CXXC finger protein 5
|
|
chr9_-_13279562
|
2.844
|
|
MPDZ
|
multiple PDZ domain protein
|
|
chr13_+_27131799
|
2.836
|
NM_006646
|
WASF3
|
WAS protein family, member 3
|
|
chr12_+_53440809
|
2.806
|
NM_198316
|
TENC1
|
tensin like C1 domain containing phosphatase (tensin 2)
|
|
chr1_-_55352818
|
2.792
|
|
DHCR24
|
24-dehydrocholesterol reductase
|
|
chr21_+_18885104
|
2.757
|
NM_001207063
NM_001207064
NM_001207065
NM_001207066
NM_001338
|
CXADR
|
coxsackie virus and adenovirus receptor
|
|
chr11_-_47207938
|
2.756
|
NM_001184974
NM_016223
|
PACSIN3
|
protein kinase C and casein kinase substrate in neurons 3
|
|
chr14_+_61788398
|
2.753
|
NM_006255
|
PRKCH
|
protein kinase C, eta
|
|
chr6_-_84419108
|
2.729
|
NM_001242793
NM_001242794
NM_014841
|
SNAP91
|
synaptosomal-associated protein, 91kDa homolog (mouse)
|
|
chr12_-_29936685
|
2.704
|
NM_001193451
|
TMTC1
|
transmembrane and tetratricopeptide repeat containing 1
|
|
chr20_-_47444404
|
2.704
|
NM_020820
|
PREX1
|
phosphatidylinositol-3,4,5-trisphosphate-dependent Rac exchange factor 1
|
|
chr1_-_9970265
|
2.695
|
NM_001012329
NM_020248
|
CTNNBIP1
|
catenin, beta interacting protein 1
|
|
chr19_-_3700466
|
2.674
|
NM_001195733
NM_012398
|
PIP5K1C
|
phosphatidylinositol-4-phosphate 5-kinase, type I, gamma
|
|
chr19_-_41859830
|
2.631
|
NM_000660
|
TGFB1
|
transforming growth factor, beta 1
|
|
chr19_-_3700387
|
2.629
|
|
PIP5K1C
|
phosphatidylinositol-4-phosphate 5-kinase, type I, gamma
|
|
chr9_+_127020251
|
2.619
|
|
NEK6
|
NIMA (never in mitosis gene a)-related kinase 6
|
|
chr5_+_121647385
|
2.604
|
|
SNCAIP
|
synuclein, alpha interacting protein
|
|
chr6_-_84418705
|
2.579
|
NM_001242792
|
SNAP91
|
synaptosomal-associated protein, 91kDa homolog (mouse)
|
|
chr10_+_30723050
|
2.576
|
|
MAP3K8
|
mitogen-activated protein kinase kinase kinase 8
|
|
chr13_-_49107250
|
2.571
|
NM_001268
|
RCBTB2
|
regulator of chromosome condensation (RCC1) and BTB (POZ) domain containing protein 2
|
|
chr7_+_106685007
|
2.542
|
NM_002736
|
PRKAR2B
|
protein kinase, cAMP-dependent, regulatory, type II, beta
|
|
chr13_+_21277481
|
2.539
|
NM_138284
|
IL17D
|
interleukin 17D
|
|
chr4_-_114682836
|
2.531
|
NM_001221
NM_172114
NM_172115
NM_172127
NM_172128
NM_172129
|
CAMK2D
|
calcium/calmodulin-dependent protein kinase II delta
|
|
chr14_+_100438095
|
2.515
|
|
EVL
|
Enah/Vasp-like
|
|
chr10_+_102107001
|
2.502
|
|
SCD
|
stearoyl-CoA desaturase (delta-9-desaturase)
|
|
chr5_+_121647773
|
2.487
|
NM_001242935
NM_005460
|
SNCAIP
|
synuclein, alpha interacting protein
|
|
chr17_+_15848422
|
2.483
|
|
ADORA2B
|
adenosine A2b receptor
|
|
chr11_-_2162340
|
2.463
|
NM_001127598
|
IGF2
|
insulin-like growth factor 2 (somatomedin A)
|
|
chr2_-_190445612
|
2.462
|
|
SLC40A1
|
solute carrier family 40 (iron-regulated transporter), member 1
|
|
chr8_-_81083660
|
2.461
|
NM_001025253
NM_005079
|
TPD52
|
tumor protein D52
|
|
chr16_+_1359622
|
2.452
|
NM_003345
NM_194259
|
UBE2I
|
ubiquitin-conjugating enzyme E2I
|
|
chr5_+_153570270
|
2.449
|
NM_198321
|
GALNT10
|
UDP-N-acetyl-alpha-D-galactosamine:polypeptide N-acetylgalactosaminyltransferase 10 (GalNAc-T10)
|
|
chr9_-_10612722
|
2.434
|
NM_002839
|
PTPRD
|
protein tyrosine phosphatase, receptor type, D
|
|
chr3_+_43328001
|
2.421
|
NM_001100594
NM_017719
|
SNRK
|
SNF related kinase
|
|
chr1_+_33004969
|
2.419
|
|
ZBTB8A
|
zinc finger and BTB domain containing 8A
|
|
chr1_-_55352881
|
2.400
|
|
DHCR24
|
24-dehydrocholesterol reductase
|
|
chr20_+_62887046
|
2.386
|
NM_001104925
NM_018257
|
PCMTD2
|
protein-L-isoaspartate (D-aspartate) O-methyltransferase domain containing 2
|
|
chr10_+_35416089
|
2.386
|
|
CREM
|
cAMP responsive element modulator
|
|
chr2_+_173600634
|
2.373
|
|
RAPGEF4
|
Rap guanine nucleotide exchange factor (GEF) 4
|
|
chr10_-_131762017
|
2.372
|
NM_001005463
|
EBF3
|
early B-cell factor 3
|
|
chr2_-_190445521
|
2.368
|
NM_014585
|
SLC40A1
|
solute carrier family 40 (iron-regulated transporter), member 1
|
|
chr19_-_11373117
|
2.367
|
NM_020812
|
DOCK6
|
dedicator of cytokinesis 6
|
|
chr2_+_173600595
|
2.367
|
|
RAPGEF4
|
Rap guanine nucleotide exchange factor (GEF) 4
|
|
chr13_-_114566951
|
2.347
|
|
GAS6
|
growth arrest-specific 6
|
|
chr1_-_236228476
|
2.340
|
NM_002508
|
NID1
|
nidogen 1
|
|
chr21_-_35987144
|
2.329
|
NM_004414
|
RCAN1
|
regulator of calcineurin 1
|
|
chr16_+_81812897
|
2.323
|
NM_002661
|
PLCG2
|
phospholipase C, gamma 2 (phosphatidylinositol-specific)
|
|
chr3_+_141457110
|
2.317
|
|
RNF7
|
ring finger protein 7
|
|
chr1_+_77747602
|
2.315
|
NM_174858
|
AK5
|
adenylate kinase 5
|
|
chr12_+_96588000
|
2.300
|
NM_005230
|
ELK3
|
ELK3, ETS-domain protein (SRF accessory protein 2)
|
|
chr2_+_173600519
|
2.297
|
NM_007023
|
RAPGEF4
|
Rap guanine nucleotide exchange factor (GEF) 4
|
|
chr2_-_190445466
|
2.297
|
|
SLC40A1
|
solute carrier family 40 (iron-regulated transporter), member 1
|
|
chr1_+_221052845
|
2.289
|
|
HLX
|
H2.0-like homeobox
|
|
chr19_+_18530211
|
2.283
|
|
SSBP4
|
single stranded DNA binding protein 4
|
|
chr12_-_42983412
|
2.282
|
NM_153026
|
PRICKLE1
|
prickle homolog 1 (Drosophila)
|
|
chr17_+_5973640
|
2.280
|
NM_015253
|
WSCD1
|
WSC domain containing 1
|
|
chr11_-_124632050
|
2.276
|
NM_138961
|
ESAM
|
endothelial cell adhesion molecule
|
|
chr22_+_19705891
|
2.263
|
NM_001009939
|
SEPT5
|
septin 5
|
|
chr10_+_102106771
|
2.246
|
NM_005063
|
SCD
|
stearoyl-CoA desaturase (delta-9-desaturase)
|
|
chr8_-_28243589
|
2.241
|
|
ZNF395
|
zinc finger protein 395
|
|
chr11_+_926021
|
2.229
|
|
AP2A2
|
adaptor-related protein complex 2, alpha 2 subunit
|
|
chr15_-_102029872
|
2.228
|
|
PCSK6
|
proprotein convertase subtilisin/kexin type 6
|
|
chr2_+_238536183
|
2.227
|
NM_001137550
|
LRRFIP1
|
leucine rich repeat (in FLII) interacting protein 1
|
|
chr2_-_43453146
|
2.209
|
|
ZFP36L2
|
zinc finger protein 36, C3H type-like 2
|
|
chr14_+_105941061
|
2.204
|
NM_001312
|
CRIP2
|
cysteine-rich protein 2
|
|
chr22_-_19929250
|
2.196
|
|
TXNRD2
|
thioredoxin reductase 2
|
|
chr3_+_50192420
|
2.192
|
|
SEMA3F
|
sema domain, immunoglobulin domain (Ig), short basic domain, secreted, (semaphorin) 3F
|
|
chr19_+_18530423
|
2.189
|
|
|
|
|
chr9_-_72287097
|
2.183
|
NM_001163
|
APBA1
|
amyloid beta (A4) precursor protein-binding, family A, member 1
|
|
chr11_+_68079999
|
2.183
|
NM_002335
|
LRP5
|
low density lipoprotein receptor-related protein 5
|
|
chr11_-_63536112
|
2.176
|
NM_001144936
|
C11orf95
|
chromosome 11 open reading frame 95
|
|
chr22_-_19929333
|
2.168
|
NM_006440
|
TXNRD2
|
thioredoxin reductase 2
|
|
chr17_+_40913233
|
2.161
|
|
RAMP2
|
receptor (G protein-coupled) activity modifying protein 2
|
|
chr17_-_76921205
|
2.145
|
|
TIMP2
|
TIMP metallopeptidase inhibitor 2
|
|
chr1_+_212459262
|
2.141
|
|
PPP2R5A
|
protein phosphatase 2, regulatory subunit B', alpha
|
|
chr17_+_78075299
|
2.135
|
NM_000152
NM_001079803
NM_001079804
|
GAA
|
glucosidase, alpha; acid
|
|
chr19_-_54693167
|
2.128
|
|
MBOAT7
|
membrane bound O-acyltransferase domain containing 7
|
|
chr19_-_19006868
|
2.127
|
NM_021267
NM_198207
NM_001492
|
CERS1
GDF1
|
ceramide synthase 1
growth differentiation factor 1
|
|
chr17_+_78075390
|
2.124
|
|
GAA
|
glucosidase, alpha; acid
|
|
chr5_-_179718963
|
2.079
|
|
MAPK9
|
mitogen-activated protein kinase 9
|
|
chr17_+_60705042
|
2.063
|
|
MRC2
|
mannose receptor, C type 2
|
|
chr18_+_9334820
|
2.054
|
|
TWSG1
|
twisted gastrulation homolog 1 (Drosophila)
|
|
chr19_-_54693414
|
2.054
|
|
MBOAT7
|
membrane bound O-acyltransferase domain containing 7
|
|
chr11_+_925899
|
2.053
|
|
AP2A2
|
adaptor-related protein complex 2, alpha 2 subunit
|
|
chr9_+_127020242
|
2.051
|
|
NEK6
|
NIMA (never in mitosis gene a)-related kinase 6
|
|
chr18_+_9334762
|
2.048
|
NM_020648
|
TWSG1
|
twisted gastrulation homolog 1 (Drosophila)
|
|
chr3_+_32280154
|
2.047
|
NM_178868
|
CMTM8
|
CKLF-like MARVEL transmembrane domain containing 8
|
|
chr21_+_18885296
|
2.044
|
|
CXADR
|
coxsackie virus and adenovirus receptor
|
|
chr7_-_752083
|
2.042
|
|
PRKAR1B
|
protein kinase, cAMP-dependent, regulatory, type I, beta
|
|
chr2_+_242498118
|
2.041
|
NM_032515
|
BOK
|
BCL2-related ovarian killer
|
|
chr9_-_80646150
|
2.035
|
NM_002072
|
GNAQ
|
guanine nucleotide binding protein (G protein), q polypeptide
|
|
chr13_-_114567040
|
2.034
|
NM_000820
|
GAS6
|
growth arrest-specific 6
|
|
chr1_+_65210724
|
2.030
|
NM_018211
|
RAVER2
|
ribonucleoprotein, PTB-binding 2
|
|
chr17_-_76921453
|
2.029
|
NM_003255
|
TIMP2
|
TIMP metallopeptidase inhibitor 2
|
|
chr6_+_11538486
|
2.020
|
NM_001100829
|
TMEM170B
|
transmembrane protein 170B
|
|
chr13_-_102068838
|
1.995
|
|
NALCN
|
sodium leak channel, non-selective
|
|
chr15_-_69113255
|
1.994
|
NM_006305
|
ANP32A
|
acidic (leucine-rich) nuclear phosphoprotein 32 family, member A
|
|
chr3_-_18466759
|
1.990
|
NM_001195470
NM_002971
|
SATB1
|
SATB homeobox 1
|
|
chr17_-_61523544
|
1.980
|
NM_001017916
NM_001915
|
CYB561
|
cytochrome b-561
|
|
chrX_+_152240726
|
1.971
|
NM_001170944
NM_001242319
NM_032882
|
PNMA6C
PNMA6D
PNMA6A
|
paraneoplastic antigen like 6C
paraneoplastic antigen like 6D
paraneoplastic antigen like 6A
|
|
chr3_-_15900928
|
1.970
|
NM_015199
|
ANKRD28
|
ankyrin repeat domain 28
|
|
chr17_-_76921076
|
1.965
|
|
TIMP2
|
TIMP metallopeptidase inhibitor 2
|
|
chr4_-_1722978
|
1.964
|
NM_001127266
NM_138385
|
TMEM129
|
transmembrane protein 129
|
|
chr1_-_205649537
|
1.964
|
|
SLC45A3
|
solute carrier family 45, member 3
|
|
chr7_+_130131921
|
1.963
|
NM_002402
|
MEST
|
mesoderm specific transcript homolog (mouse)
|
|
chr6_-_13486986
|
1.958
|
|
GFOD1
|
glucose-fructose oxidoreductase domain containing 1
|
|
chr14_-_30396811
|
1.952
|
NM_002742
|
PRKD1
|
protein kinase D1
|
|
chr17_+_60705051
|
1.948
|
|
MRC2
|
mannose receptor, C type 2
|
|
chr22_+_23522551
|
1.944
|
NM_004327
NM_021574
|
BCR
|
breakpoint cluster region
|
|
chr6_+_39760138
|
1.943
|
|
|
|
|
chr1_+_77747727
|
1.928
|
|
AK5
|
adenylate kinase 5
|
|
chr9_+_133971862
|
1.925
|
NM_001185095
NM_001185096
NM_031426
|
AIF1L
|
allograft inflammatory factor 1-like
|
|
chr12_+_96588254
|
1.924
|
|
ELK3
|
ELK3, ETS-domain protein (SRF accessory protein 2)
|
|
chr3_+_32280211
|
1.923
|
|
CMTM8
|
CKLF-like MARVEL transmembrane domain containing 8
|
|
chr12_+_2904289
|
1.921
|
|
FKBP4
|
FK506 binding protein 4, 59kDa
|
|
chr1_+_33722158
|
1.911
|
NM_152493
|
ZNF362
|
zinc finger protein 362
|
|
chr10_+_93170053
|
1.908
|
|
|
|
|
chr1_+_90098693
|
1.907
|
|
LRRC8C
|
leucine rich repeat containing 8 family, member C
|
|
chr3_+_50192847
|
1.899
|
NM_004186
|
SEMA3F
|
sema domain, immunoglobulin domain (Ig), short basic domain, secreted, (semaphorin) 3F
|
|
chr9_-_140196702
|
1.899
|
NM_001004354
|
NRARP
|
NOTCH-regulated ankyrin repeat protein
|
|
chr19_-_41859332
|
1.890
|
|
TGFB1
|
transforming growth factor, beta 1
|
|
chr12_+_44229851
|
1.887
|
NM_032256
|
TMEM117
|
transmembrane protein 117
|